


Introduction
210Pb has a half-life of 22.3 years and is a member of the natural decay series of 238U. This actinide nuclide exists in the Earth continental crust at a level of ~1.7 ppm (Wedepohl, Reference Wedepohl1995). One of the progenies of 238U is 222Rn, a radioactive isotope of the noble gas radon, which emanates from the soil into the atmosphere. Due to its half-life of 3.8 days, 222Rn is transported within the lower troposphere over large distances and altitudes (Feichter and Crutzen, Reference Feichter and Crutzen1990; Lee and Feichter, Reference Lee and Feichter1995). There, 222Rn decays via short-lived nuclides (half-lives shorter than 30 min) to 210Pb. All progenies of 222Rn are heavy metals and attach to aerosol particles predominantly from the accumulation mode (diameters between ~100 and 300 nm). Thereafter, the behavior of 210Pb in the atmosphere is identical to that of aerosol particles. The atmospheric residence time of 210Pb is in the order of weeks (Kuroda and others, Reference Kuroda, Daniel, Nevissi, Beck and Meason1978), with a trend to longer values for higher altitudes (Moore and others, Reference Moore, Poet and Martell1973). 210Pb then decays via 210Bi (a β-emitter with a half-life 5 days) to 210Po (an α-emitter with a half-life of 138 days) to stable 206Pb. 210Pb is usually deposited on the Earth surface with precipitation except for very arid regions where dry deposition becomes dominant. Commonly two models are applied that describe 210Pb deposition, constant initial concentration (CIC) and constant rate of supply (CRS). In glaciology, usually the CIC assumption best describes the behavior because archived 210Pb in glaciers simply reflects the precipitation history with no secondary processes involved. From environmental monitoring it is well known that the 210Pb activity concentrations in air at a given site – and therefore also in fresh precipitation at this site – is quite constant over time on an annual basis (Gäggeler, Reference Gäggeler1995). This is different for e.g. lake sediments where the recorded 210Pb activity concentration is modulated by numerous environmental processes prior to deposition in the sediment. In this case, the CRS assumption often holds best (Appleby and Oldfield, Reference Appleby and Oldfield1978; Appleby, Reference Appleby2008). 210Pb application in glaciology has been pioneered in the 1960s by G. Cozaz from the group of E. Picciotto (Université Libre de Bruxelles, Belgium). She analyzed snow and ice samples from Antarctica (Crozaz and others, Reference Crozaz, Picciotto and de Breuck1964), Greenland (Cozaz and Langway, Reference Crozaz and Langway1966) and from the European Alps (Crozaz, Reference Crozaz1967). A more general overview on early 210Pb applications in environmental research can be found in Goldberg (Reference Goldberg1963).
The activity concentration of 210Pb in the lower troposphere over Europe amounts to ~0.2–0.7 mBq m−3 (Gäggeler and others, Reference Gäggeler, Jost, Baltensperger, Schwikowski and Seibert1995). In Polar regions, the values are significantly lower, for example 0.015 mBq m−3 at Franz Joseph Island or 0.013 mBq m−3 at the South Pole (Rangarajan and others, Reference Rangarajan, Madhavan and Gopalakrishnan1986). Moreover, there is a decrease in activity as a function of altitude (Turekian and others, Reference Turekian, Nozaki and Benninger1977; Balkanski and others, Reference Balkanski, Jacob, Gardner, Graustein and Turekian1993). Model calculations showed that the 210Pb activity concentration of ground-level air has a strong geographical pattern with significantly lower values over the oceans compared to coastal or continental sites (Feichter and Crutzen, Reference Feichter and Crutzen1990). This simply reflects the pattern of the 238U concentrations, the source of 222Rn, which are almost three orders of magnitude lower in ocean water compared to soil with 3 ppb and 1.7 ppm, respectively (Mason and Moore, Reference Mason and Moore1982). No significant seasonal variability in the 210Pb activity concentrations in air from Fribourg (Switzerland) or Munich (Germany) was found (Gäggeler, Reference Gäggeler1995), with an average value of ~0.5 mBq m−3. In contrast, at higher altitude, for example at the Jungfraujoch (3450 m a.s.l., Switzerland), a pronounced seasonal dependence in the 210Pb activity concentrations was observed with typical values of 0.6 mBq m−3 in summer and 0.05 mBq m−3 in winter (Gäggeler and others, Reference Gäggeler, Jost, Baltensperger, Schwikowski and Seibert1995). The reason is the strong convective vertical mixing in summer (Baltensperger and others, Reference Baltensperger, Gäggeler, Jost, Emmenegger and Nägeli1991).
The determination of 210Pb in environmental samples is usually performed either via γ-counting (46 keV line) or via measurement of its grand-daughter 210Po via α-counting (5.3 MeV α-line). γ-Counting is restricted to samples with rather high activity concentrations of 210Pb due to the high conversion of the low energy γ-line at 46 keV (96% in the form of electron and only 4% in the form of γ emission), but also due to a rather low efficiency of γ-detectors. γ-Counting enables measurements without any chemical treatment and is usually applied for lake sediments (Gäggeler and others, Reference Gäggeler, von Gunten and Nyffeler1976) or peat bogs but not for precipitation or ice samples.
In this overview, we focus on 210Pb activity measurements in firn and ice samples using α-counting of its grand-daughter 210Po. Prerequisite of this approach is the secular equilibrium between 210Pb and 210Po, which is reached after ~1½ years. This corresponds to four half-lives of the grand-daughter nuclide 210Po (T ½ = 138 days) when 94% of saturation with equal activity of 210Pb and 210Po is reached.
Experimental procedure
The procedure to extract 210Po from snow and ice samples is rather simple: under reducing conditions, polonium spontaneously deposits onto the surface of a silver plate immersed into the melted sample (Gäggeler and others, Reference Gäggeler, von Gunten, Rössler, Oeschger and Schotterer1983). Before melting of a sample of ~100–200 mL of water, 50 mL HClconc is added as well as 100 μL of a 209Po standard with known activity. The solution is then heated to 90°C for ~10 h. Reducing condition is established by bubbling SO2 gas through the liquid for 3 min. A silver disk of typically 6 mm diameter is immersed into the liquid that is continuously mixed with a magnetic stirrer. In order to prevent polonium deposition on both sides of the silver plate, it is advisable to mount the plate into a plastic frame that protects deposition on the back side (Gäggeler and others, Reference Gäggeler, von Gunten, Rössler, Oeschger and Schotterer1983). After deposition, the silver plate is placed opposite to a silicon semiconductor detector, able to measure energy-resolved α-particles.
To reach a detection uncertainty of 1%, 10 000 counts are required. The 209Po standard, which is added to the sample prior to the polonium extraction, is used to determine the polonium deposition and overall yield. 209Po has an α-decay energy of 4.9 MeV, which is well separated from the 5.3 MeV α-line from 210Po. Yields are typically ~80% and the detection limit of this counting technique is ~1 mBq kg−1 for a sample size of ~200 g and a counting time of 1 week. A typical example of an α-spectrum of a sample from Chongce Ice Cap (Tibet, China) is depicted in Figure 1 (Hou and others, Reference Hou2018), showing the two α-lines from 209Po and 210Po.
α-Spectrum of a surface sample (103 g) from Chongce Ice Cap (Tibet, China) measured for 241 844 s with a surface barrier detector. The α-lines of 209Po (standard) and 210Po (sample) have energies of 4.9 and 5.3 MeV, respectively.

210Pb activity concentrations on glacier surfaces
The mean annual activity concentration of 210Pb in precipitation at München-Neuherberg (Germany) is ~150 mBq L−1 and the annual deposition rate is 130 Bq m−2 (Hötzl and others, Reference Hötzl, Rosner and Winkler1983). In Fribourg, Switzerland, the activity concentration is somewhat smaller, ~50 mBq L−1 (Steinmann and others, Reference Steinmann2015). Table 1 summarizes 210Pb activity concentrations of surface samples from different glaciers worldwide.
210Pb activity concentrations in surface snow/ice as reported in the literature or deduced from therein-presented profiles by extrapolation to zero depth

This table is structured according to different geographical regions: (a) Polar, (b) European Alps, (c) very continental sites such as Altai, and Tien Shan, (d) Andes and Patagonia (e) Indian and Chinese Himalaya and (f) the New Zealand Mount Cook area. When not available from the literature, values are activity concentrations at zero depth deduced from extrapolations of depicted data as a function of depth. No uncertainties are listed. They are typically 10–20%, caused by the variability in the results from individual measurements and not by counting statistics.
Generally, the variation and differences in the levels of 210Pb activity concentrations in the freshly deposited snow/ice observed for the different regions are as expected, considering the regional emission source strength of the 210Pb precursor: crustal 238U. 238U concentrations are much lower in ocean water compared to soil which may further be rich or poor in its uranium deposits (Mason and Moore, Reference Mason and Moore1982). 210Pb activity concentrations are lowest at Polar sites (Table 1, Index a), both from Antarctica and the Arctic. The average value is ~30 mBq kg−1. It is interesting to note that across the European Alps (b) the 210Pb activity concentrations are rather similar, on average 86 ± 16 mBq kg−1. The most continental sites listed in Table 1 are from Altai, Tien Shan (c) and certain areas of the Tibetan Plateau (Chongce). At these locations, the highest values of 210Pb activity concentrations were observed.
Values of the activity concentrations in the Andes (d) are lower for sites affected predominantly by marine air masses related to the prevailing Westerlies (Cerro Tapado, Mercedario) but also for Pio XI in Patagonia. They are higher for sites under influence of continental air masses related to the tropical circulation (Chimborazo, Corupuna, Illimani, and surprisingly, as found by Vimeux and others (Reference Vimeux2008), also for the Patagonian site San Valentin). On average, however, they are rather similar to those from the European Alps. Significant differences are also observed between the sites in the Himalaya (e). This may reflect the influence of the monsoon. Sites that are heavily influenced by monsoon, such as Changme-Kangpu and Nehnar Changme, show lower values while at the continental site Chongce in Tibet the value is significantly higher. Rather unexpected are the high 210Pb activity concentrations for glaciers in the Mount Cook area in New Zealand considering the fact that these glaciers are in close vicinity to the Tasman Sea, the source of precipitation. We attribute these rather surprisingly high values to air mass transport from Australia. It is well known that Australian geology is rich in uranium deposits, resulting in many uranium mining sites, and is therefore a strong source of 222Rn, the precursor of 210Pb. The study by Marx and others (Reference Marx, Kamber and McGowan2005) using 210Pb as a monitor of Australian dust flux into New Zealand strongly corroborates the above interpretation for the observed high values.
Seasonality of 210Pb deposition
Due to vertical convective mixing within the atmosphere during summer, strong seasonal variability in the 210Pb activity concentrations in fresh snow may result. As an example, Figure 2 depicts highly resolved 210Pb activity concentrations at Grenzgletscher (4200 m a.s.l., Switzerland) (Eichler and others, Reference Eichler2000). The average winter and summer values for this site amount to ~25 and 125 mBq kg1, respectively.
Highly resolved depth profile of 210Pb activity concentrations in an ice core from Grenzgletscher (4200 m a.s.l., Switzerland). Maximum and minimum values represent summer and winter precipitation, respectively. Figure from Eichler and others (Reference Eichler2000). Reprinted from Journal of Glaciology with permission of the International Glaciological Society.
The very low values prove that in winter little exchange of air between the free troposphere and the planetary boundary layer occurs. In principle, it is possible to determine seasonality as well as individual annual deposition rates by such measurements. However, it should be mentioned that 210Pb measurements are time consuming and therefore dating by annual layer counting is much simpler using easy to analyze chemical tracers that also exhibit a high seasonal variability such as for example ammonium (see e.g. Döscher and others, Reference Döscher, Gäggeler, Schotterer and Schwikowski1995).
Nevertheless, from Figure 2 it becomes evident that 210Pb dating requires longer-term averages (at least annual) to minimize the effect of seasonal fluctuations.
Dating of ice cores with 210Pb
Basic principles
If an ice core should be dated with the 210Pb method several prerequisites need to be fulfilled:
• The CIC assumption should be fulfilled as well as constant annual precipitation rates. This results in a CRS situation.
• Post-depositional effects (melting, sublimation and wind drift) should be minimal.
• In some cases, however, it could be shown that 210Pb activity profiles were not much influenced by percolating meltwater. We assume that the 210Pb atoms are strongly adsorbed on the surfaces of mineral dust particles contained in the ice matrix (see section ‘210Pb dating of temperate glaciers’).
• A great advantage is the fact that sampling can be made from the outside of the core, which is usually not suited for chemical trace analysis.
• Continuous sampling is essential – though at low sample resolution.
• Measurements should be continued to depths where constant values are reached. These indicate the natural background level needed for background correction.
• With the surface age known (equal to the date of drilling), a fit through the data plotted against depth in meter water equivalent (m w.e., converted from depth in meter by multiplying with density to account for snow/firn densification as observed in the measured density profile) yields the final age–depth relationship by applying the radioactive decay law:
(1)$$t = \displaystyle{{-s} \over {\ln \lpar 2\rpar }}\cdot T_{1/2}\cdot x\comma \;$$

where t is the age in years since the drill date, s is the slope of the fit, T ½ is the half-life of 210Pb (22.3 years) and x is the depth in m w.e. From the uncertainty of the regression slope, the dating uncertainty can be estimated (see Fig. 3). Note that the uncertainty bands are different if the fit relates either to the scale of the measured 210Pb concentration activity or to the therefrom-deduced age scale. This is because, for the latter case, the uncertainty is zero at the surface for which the age is known precisely, that is equal to the year of drilling.
210Pb activity concentration and derived age as a function of depth in an ice core from Belukha. (a) 210Pb activity concentration as a function of depth. The thin dotted line indicates the 1σ uncertainty band of the regression fit. The dashed line indicates the average value for the lowermost samples reflecting the input from supported 210Pb, that is the natural background determined for this site. (b) The same data of 210Pb activity concentration, but with the natural background (supported 210Pb) subtracted, together with the derived age scale as shown on the right y-axis as a function of depth. The dotted lines indicate the 1σ dating uncertainty, derived by error propagation, which includes the uncertainty of the regression fit shown in (a). Open gray circles indicate distinct time horizons found in the ice core (3H peak in 1963 from nuclear weapons testing and signals in sulfate related to the known volcanic eruptions from Katmai and Tambora in 1912 and 1815/16, respectively). The fit shown by the thick gray line does account for glacier thinning (see section ‘Effect from thinning of annual layers’). Data from Olivier and others (Reference Olivier2006).

Figure 3 shows an example of 210Pb measurements of an ice core from Belukha (Olivier and others, Reference Olivier2006). After the expected exponential decrease with depth or time, respectively, the values reach a plateau, indicating an average background value of 3.6 ± 1.2 mBq kg−1 (value already corrected for the small instrumental background of ~1 mBq kg−1, see section ‘Experimental procedure’). This value represents 210Pb from mineral dust contained in the ice. This activity is called supported 210Pb. The background value observed at Belukha is typical for many glacier sites. Note that this natural background value has always to be subtracted from all the measured 210Pb activity concentrations to deduce the final dating (Fig. 3b).
The time range accessible with the 210Pb method depends on the initial activity concentration at the surface and the respective background. The dating time frame is ~80 years for sites with ~40 mBq kg−1 surface activity concentration and increases to ~180 years for the most continental sites such as Tien Shan (400 mBq kg−1) or Belukha (280 mBq kg−1), respectively. From Figure 3b it becomes clear that the dating uncertainty increases as a function of age (in Fig. 3b about ±10 years for the lowermost samples from the mid-19th century). Advantage of the 210Pb dating is that it is independent from other approaches such as annual layer counting based on chemical tracers.
Effect from thinning of annual layers
Ice is a plastic solid, therefore increasing pressure induced by overlaying ice layers causes horizontal glacier flow, resulting in a reduction of the original ice layer thickness. This effect is called thinning and becomes significant particularly for deeper ice core sections. Consequently, a deviation of the exponential trend in the 210Pb activity concentration with depth is expected. Several mathematical models describe such a thinning. We use here the oldest, original one by Haefeli (Reference Haefeli1961) to illustrate the basic principle of this effect. This model describes the time as a function of depth with

where t is the time in years after deposition, H the ice thickness in m w.e., a the net annual accumulation rate in m w.e. and x is the depth from the surface in m w.e.
If this equation is combined with the exponential decay law for 210Pb, the following equation results for the 210Pb activity concentration A as a function of depth (Gäggeler and others, Reference Gäggeler, von Gunten, Rössler, Oeschger and Schotterer1983):

with

where λ is the decay constant of 210Pb (0.0311 a−1).
An example from Colle Gnifetti is shown in Figure 4, highlighting the potential importance to consider the thinning effect when dating by 210Pb. The fit derived based on Eqn (3) accounting for thinning (R 2 = 0.89, n = 13; residual sum of squares (RSS) = 380.0) is a better description of the observed data than the fit based on the law of exponential decay which does not consider any thinning (R 2 = 0.85, n = 13; RSS = 557.7).
210Pb activity concentration as a function of depth in m w.e. at Colle Gnifetti (adapted from Gäggeler and others, Reference Gäggeler, von Gunten, Rössler, Oeschger and Schotterer1983). The solid thick line shows a fit through the data accounting for thinning (according to Eqn (2)), whereas the thin line is a fit solely derived from the exponential decay law. Horizontal bars indicate sampling depth ranges and vertical bars the std dev. of the averaged values from individual measurements performed in higher sampling resolution.

Special cases
210Pb dating of temperate glaciers
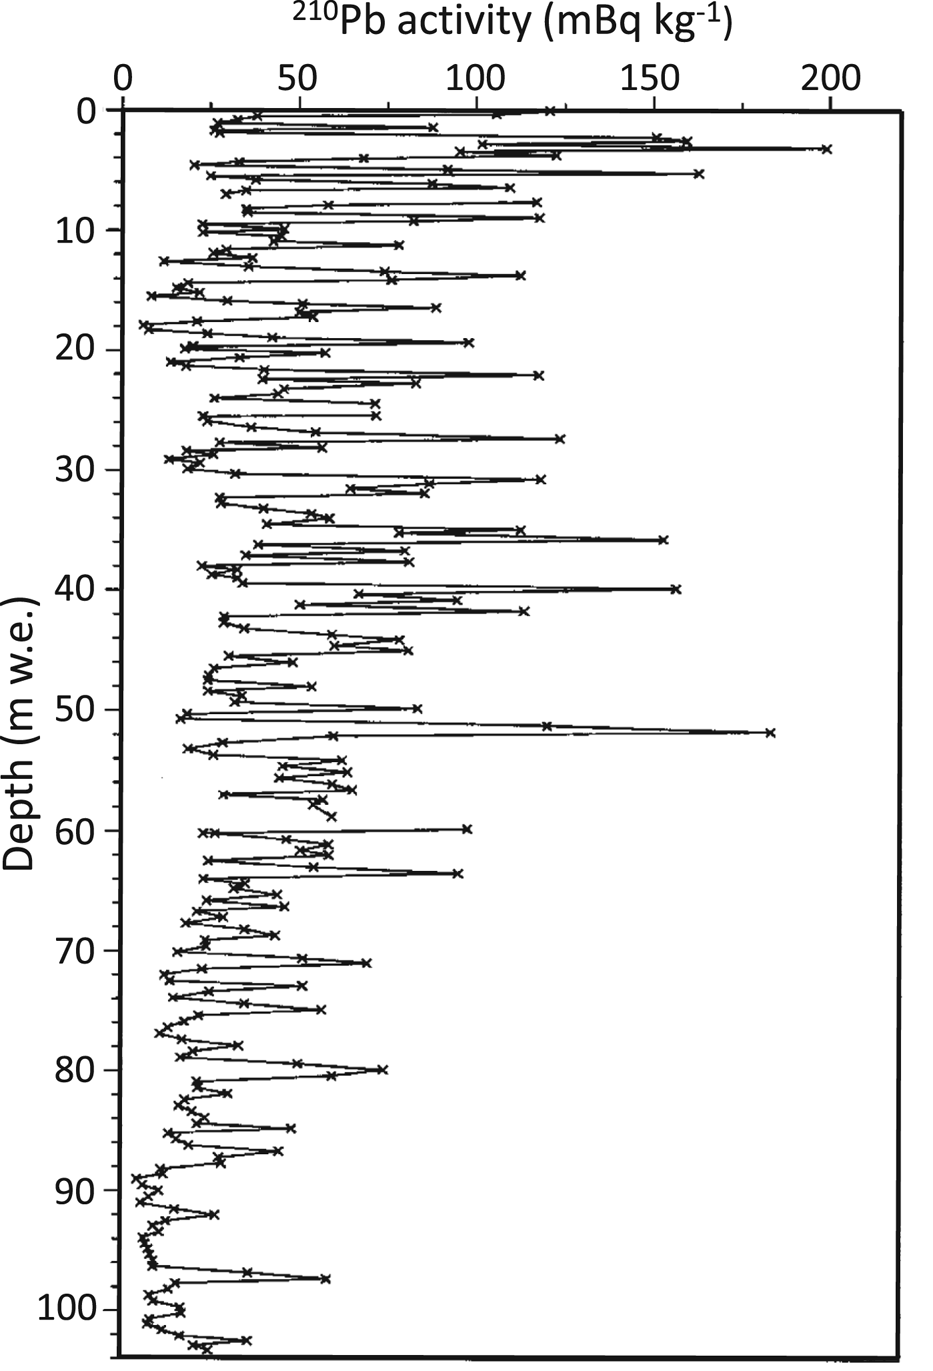
Temperate glaciers are characterized by an ice temperature close to the melting point and the presence of liquid water formed by melting of ice and/or originating from rain or snow melt. Water percolation may therefore influence the 210Pb activity concentration profiles by downward relocation and, in the extreme case, by removal of 210Pb through run-off with meltwater. As an example, Figure 5 shows 210Pb data of an ice core from the temperate Vernagtferner (Austria), with the ice core sampling site located at an elevation of 3150 m a.s.l. (von Gunten and others, Reference von Gunten, Rössler and Gäggeler1982). Obviously, relocation of 210Pb with meltwater resulted in high variability. It is interesting to note that often the maxima of the 210Pb activity concentrations coincide with high levels of mineral dust.
Continuous 210Pb activity concentration profile in the ice core from the Vernagtferner (3150 m a.s.l., Austria) drilled in 1979 (open symbols with 1σ analytical uncertainty bars). The profile includes three replicate samples. Depicted is a best fit through all 210Pb data. The fit directly relates to the age scale indicated by the right-hand y-axis with the 1σ dating uncertainty shown by the dashed lines. Figure deduced from von Gunten and others (Reference von Gunten, Rössler and Gäggeler1982).

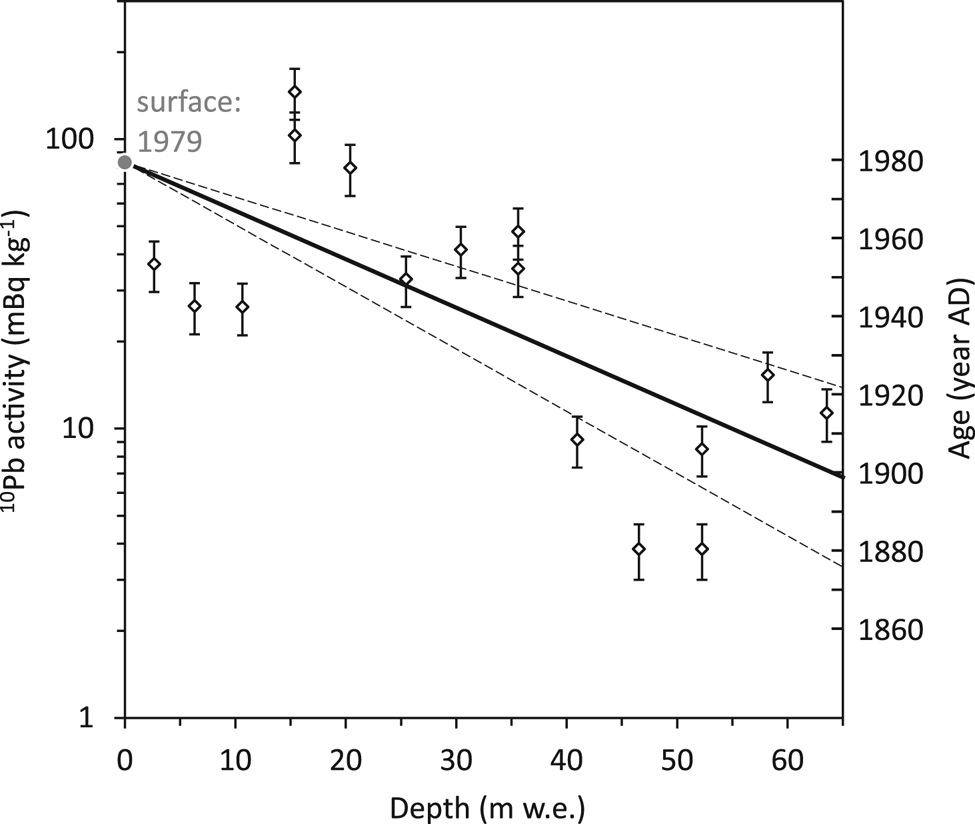
Another example is from the temperate Silvretta Glacier (Switzerland) with the drilling site located at 2927 m a.s.l. (Fig. 6, Pavlova and others, Reference Pavlova2015). Again, despite fluctuating 210Pb values, on average the inventory of 210Pb and the exponential decrease looks very reasonable. In this case, the 1963 horizon identified via tritium measurements is predicted slightly older by the 210Pb dating at 1953 but still in agreement within the 1σ uncertainty estimate.
210Pb activity concentrations along an ice core from Silvretta, drilled in 2011. The red dot shows the 1963 peak in 3H related to nuclear bomb testing, indicating the accuracy of the dating by 210Pb with uncertainties (1σ) depicted by the shaded area. Adapted from Pavlova and others (Reference Pavlova2015).

Surface age in case of negative mass balance
Due to climate warming, glaciers in most mountain regions of the world have been retreating and even disappearing at an accelerated rate in recent decades (e.g. Zemp and others, Reference Zemp2015). This increasingly affects also the accumulation areas, for which widespread surface loss is often observed. 210Pb may serve to identify such cases since melting of surface layers may lead to enrichment of 210Pb activity concentrations at the surface. An example is shown in Figure 7 for the Mount Geladaindong Glacier, central Tibetan Plateau (5750 m a.s.l.) (Kang and others, Reference Kang2015).
210Pb activity concentrations in an ice core from Mount Geladaindong (5750 m a.s.l.) (open and solid diamonds); adapted from Kang and others (Reference Kang2015). For details see text.

In Figure 7, the 210Pb activity concentrations at depths below ~5 m (solid diamonds) follow an exponential decrease. However, the topmost two values (open diamonds) strongly deviate from this trend, seemingly being far too high. We assume that these two data points represent enriched values. The hypothesis is that while matrix water was removed by melting, 210Pb was enriched in the surface layers due to adsorption on rather immobile dust particles. A significant loss of surface mass is corroborated by the presence of the nuclear fallout layer at a shallow depth of only 5.74 m, identified by the prominent peak in the tritium activity concentration (red dot) (Kang and others, Reference Kang2015). The resulting net accumulation between the date of ice core drilling (October 2005, i.e. surface) and 1963 (at 5.74 m depth) of 14 cm a−1 is much smaller than the 30 cm a−1 deduced for the lower part of the core from the slope of the exponential decrease (see Fig. 7). A more recent change in the mass balance to negative values thus seems to be a reasonable assumption for this site. Accordingly, the age of the surface can be assumed to differ from the date of drilling (October 2005). The age of the surface was estimated by anchoring the 210Pb profile to the year 1963 represented by the tritium peak at 5.74 m depth, resulting in the time axis depicted on the right y-axis. An extrapolation to the surface results in a surface age of 1982 ± 5, hence in a loss of 2005–1982 = 23 ± 5 years of accumulation, and a deduced surface 210Pb activity concentration of 89 mBq kg−1 (gray cross), which is a very reasonable value (see Table 1). A final proof of evidence for the validity of the chosen approach can be derived, based on the 210Pb activity concentration observed in the first two values. Under the assumption of surface enrichment, they should reflect the integrated activity of 23 years of 210Pb deposition with the determined initial activity A 0 (89 mBq kg−1). Indeed, the observed high values do account for 81% of the expected activity, suggesting only moderate removal, that is run-off of the deposited 210Pb of ~ 20%. This is in close agreement with the determined preservation of lead in snow and ice under the influence of percolating meltwater of ~70% (Avak and others, Reference Avak, Schwikowski and Eichler2018, Reference Avak2019).
Effect of sublimation on the 210Pb profile
Andean glaciers located in the South American dry diagonal are often influenced by strong sublimation. A consequence is the formation of penitents. Sublimation means evaporation of water from the solid phase to the gas phase while non-volatile species such as 210Pb remain in the matrix. Such a situation was extensively studied at Cerro Tapado (30°08′S; 69°55′W; 5534 m a.s.l.) in the Chilean Andes (Ginot and others, Reference Ginot2002, Reference Ginot, Kull, Schotterer, Schwikowski and Gäggeler2006). A large year-to-year variability in loss of H2O due to sublimation was observed (Ginot, Reference Ginot2001). The sublimation rate was determined by chemical means via measurement of chloride concentrations: at this glacier, most precipitation comes from the nearby Pacific by westerly winds that contains much sea salt. As a consequence, the chloride concentration is rather high and constant in fresh snow. Deviations of the chloride concentration measured in individual ice samples compared to those in fresh snow then yield the enrichment factor due to sublimation. On average, sublimation turned out to result in a mass loss of 60%. This means that a determination of annual net accumulation rates from measured 210Pb profiles differs from total accumulation rates. Figure 8 depicts the situation observed at Cerro Tapado. The trend in the measured chronology of 210Pb activity concentrations as a function of depth indicates an annual accumulation rate of 235 mm w.e. a−1 (Fig. 8a). Correcting the 210Pb activity concentration profile by accounting for loss of snow by sublimation using the chloride concentration record (Fig. 8b) results in a revised annual accumulation rate of 405 ± 50 mm w.e., in reasonable agreement with 470 ± 70 mm w.e. from a glaciological estimate (see Ginot, Reference Ginot2001).
Effect of sublimation on the 210Pb profile. (a) Measured 210Pb activity concentration in an ice core from Cerro Tapado as a function of depth in m w.e. (b) The same data but here accounting for sublimation resulting in a corrected depth (see text for details). Dashed lines indicate the measured 210Pb activity concentration, and respective trend line. Hatched areas indicate the depth range where 210Pb activity reached the background level from supported 210Pb. The solid lines depict the measured data (and respective trend lines) after substraction of this background (average value within hatched areas). Figure adapted from Ginot and others (Reference Ginot, Kull, Schotterer, Schwikowski and Gäggeler2006).

Special applications using 210Pb
Determination of the annual deposition rate
At remote sites with no possibility to get meteorological information or to return for stake measurements, the last year's deposition can be determined using the ratio of the grand-daughter radionuclide 210Po and its mother nuclide 210Pb. As stated previously, after ~1½ years the secular equilibrium between these two radionuclides is nearly reached (see Introduction). Between time zero and equilibrium, the relationship between the activity concentrations of 210Po and 210Pb approximately follows the below equation:

where A(x) is the activity concentration of nuclide x, t is the elapsed time between precipitation date and date of sample collection and λ is the decay constant of 210Po ( = ln(2)/138.4 days). Equation (5) is only a close approximation, since the intermediate radionuclide 210Bi the daughter of 210Pb with a half-lie of 5 days is ignored. However, this is justified considering its short half-life compared to those of 210Pb and 210Po, respectively.
Figure 9 depicts an example of this approach for measurements at Jungfraujoch (Switzerland) (Gäggeler and others, Reference Gäggeler, Tobler and Vogel2009). One half of each firn sample was analyzed for 210Po immediately after sampling. The other half was stored for 1½ years and then analyzed again for 210Po, but now representing the 210Pb activity concentration since equilibrium between the two radionuclides was nearly reached. The red curve depicts the ratio between the activity concentrations. The maximum value of 0.84 at 5.7 m depth indicates that the equilibrium at this depth was almost reached already at the time of sample collection (i.e. the time of first analysis). Using Eqn (5), a value for t of 366 days results (i.e. ~1 year) indicating the annual net accumulation at this site to be 5.7 m of snow. Obviously, the same accumulation rate can be deduced from the profile at any other, shallower depth. Therefore, this application is not dependent on the performed sampling depth, which is important to note if intended to be applied at a site with no initial knowledge (although sampling depths covering close to 1 year or more of deposition is favorable to obtain a better constrained fit and accordingly better precision and accuracy for the finally determined accumulation).
Activity concentrations of 210Po and 210Pb in a firn core from Jungfraujoch (Switzerland) sampled on 25 March 2007 (reported in Gäggeler and others, Reference Gäggeler, Tobler and Vogel2009). The red line is the modeled fit according to Eqn (5).

210Pb, a potential tool for the determination of net glacier ice flow rates
We tested whether 210Pb surface activity concentrations along a trajectory of the Aletsch Glacier (Switzerland) below the equilibrium line do yield time information on the glacier flow rate. The idea behind this approach is that 210Pb – incorporated in the ice matrix by initial deposition in the accumulation zone and likely being adsorbed on mineral dust particles – is rather immobile. Moreover, it is assumed that 210Pb is not prone to relocation even in the case of percolating meltwater certainly existing in the sampled ablation zone. This seems reasonable based on Avak and others (Reference Avak, Schwikowski and Eichler2018, Reference Avak2019), showing that lead incorporated in snow and ice is one of the well-preserved trace elements under the conditions of percolating water (~70% preservation). However, later, additional input to the now re-exposed sampled surface in the ablation zone, for example by meltwater from the winter snow and from summer rain is assumed to be entirely removed by run-off. Under such assumptions, the 210Pb activity concentration profile along a downward trajectory should decrease in correspondence to the elapsed time, following the law of decay for 210Pb.
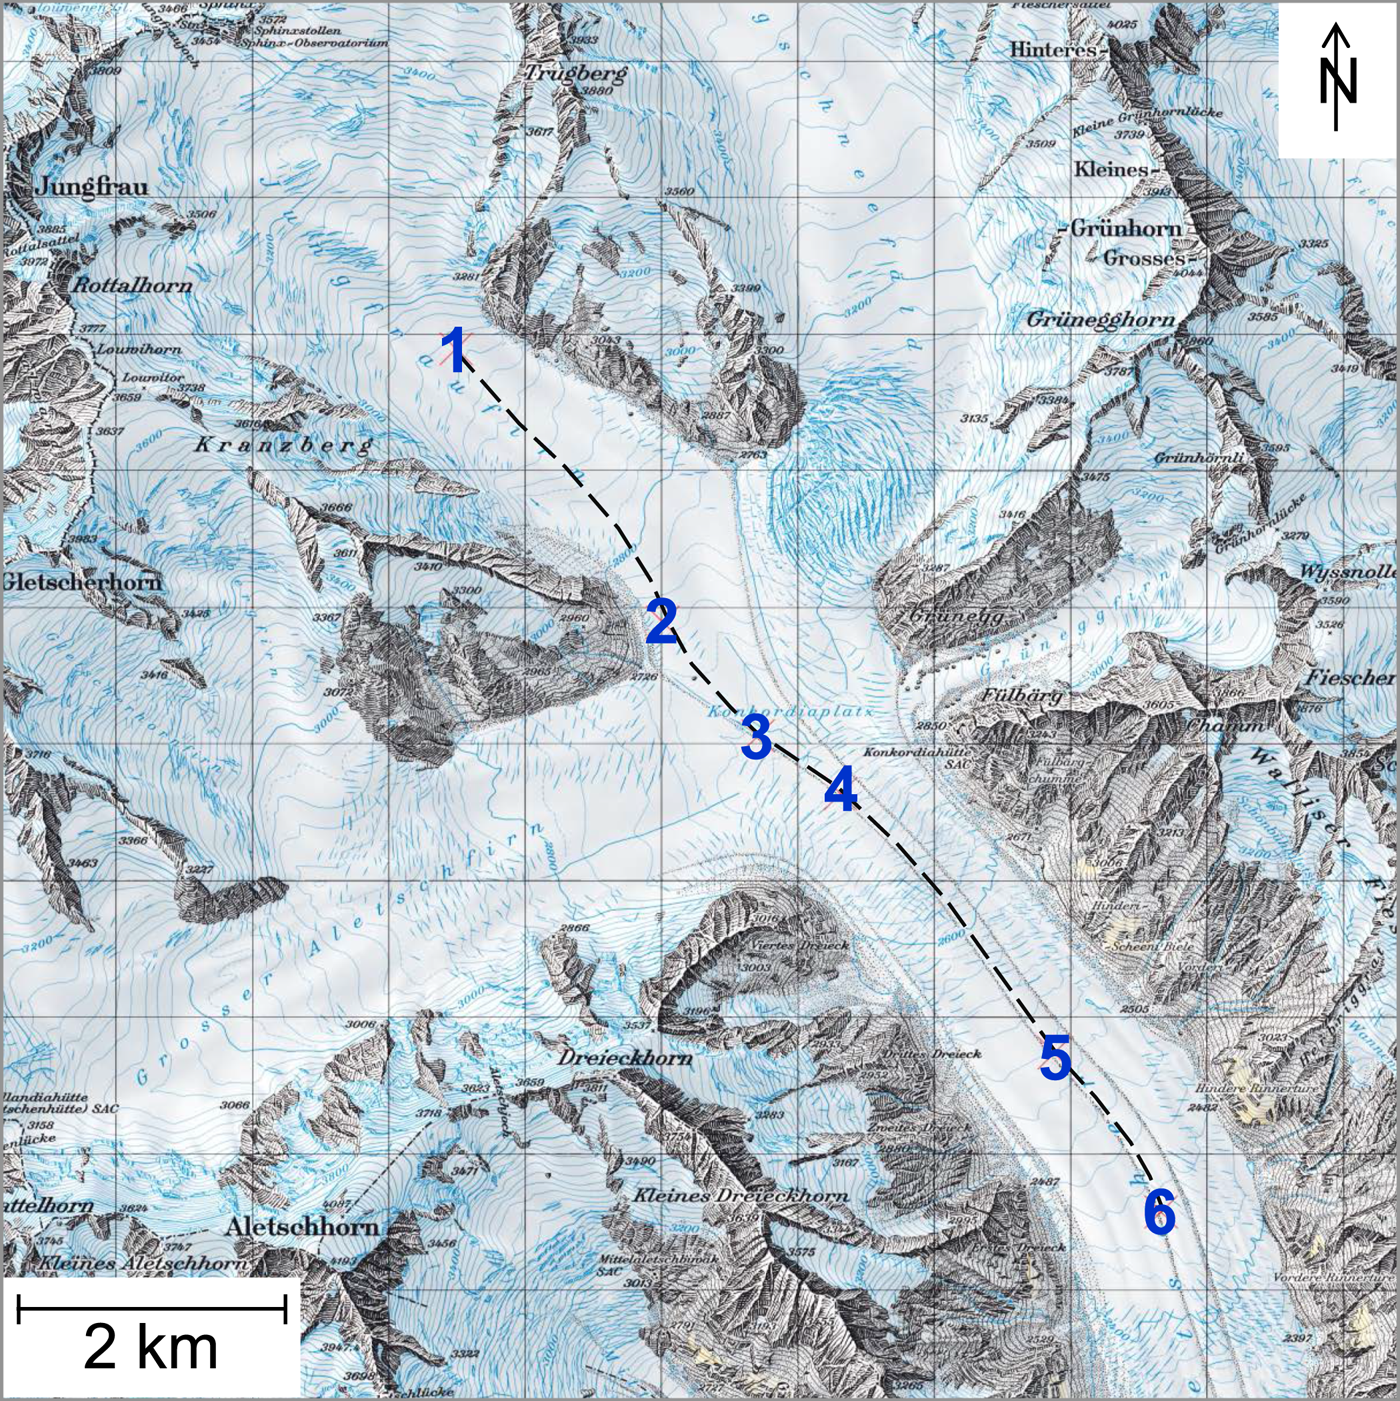
Near-surface samples (after cleaning to remove surface dust layers) of ~10 cm length were taken using a hand-drill device. The sample sites along the trajectory are shown in Figure 10 and are summarized in Table 2, together with the measured 210Pb activity concentrations.
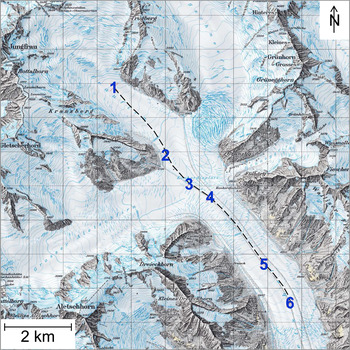
Trajectory along the Jungfraufirn/Aletsch Glacier (Switzerland) along which surface ice samples were collected for 210Pb analysis. Map reproduced by permission of swisstopo (JA100121).
Sample sites on Jungfraufirn/Aletsch Glacier (Switzerland) along the trajectory depicted in Figure 10, measured 210Pb activity concentrations and deduced flow rates (Gäggeler and others, Reference Gäggeler, Szidat, Vogel, Tobler and Boss2010)

Typical uncertainties of 210Pb activity concentrations are ±7%. Coordinates refer to the Swiss coordinate system (Swiss Grid) CH1903/LV03.
Obviously, the 210Pb values steadily decrease along the trajectory with one exception: in the middle of the Konkordia place, a significantly higher value was measured (sample site 3). Likely the trajectory of ice parcels do not follow the surface at this exceptional site where the Aletsch Glacier is fed from four different sides, from the large firn fields called Jungfraufirn (i.e. the upper part of our trajectory), Ewigschneefeld and Grosser Aletschfirn as well as from the somewhat smaller Grüneggfirn. The value from sample site 3 was therefore discarded. From the 210Pb activity ratio between two sample sites, the known half-life for 210Pb and the distance, the flow rate was deduced, resulting in an average flow rate of 166 m a−1 along the entire 7.92 km trajectory.
In a recent paper, Jouvet and Funk (Reference Jouvet and Funk2017) modeled the trajectory of the corpses of mountaineers who disappeared on Aletsch Glacier in 1926. According to their modeling results, the relics were transported parallel to our trajectory between sample sites 4 and 6 (see Table 2) for the time interval from 1985 to 2012. The average flow rate given in Jouvet and Funk (Reference Jouvet and Funk2017) for this section is ~150 m a−1, in surprisingly good agreement with our estimated value of 160 m a−1.
Conclusion
The natural radionuclide 210Pb attached to aerosol particles and deposited on glacier surfaces with fresh snow allows to date glaciers over roughly one century, using its half-life of 22.3 years as a clock. However, the uncertainty is rather large, typically ±5 years for individual samples. This uncertainty is caused mainly by a large variability of 210Pb activity concentrations in individual precipitation events as well as seasonal variability and to lesser extent by counting statistics. Therefore, 210Pb dating should be based on continuous records rather than individual measurements.
In case of glaciers with no or little thinning, the observed chronology of 210Pb activity concentrations as a function of depth follows an exponential decrease. From the slope of the linear fit through the data in a semi-logarithmic plot, the mean annual accumulation rate can be determined. If thinning becomes significant, the decrease of the 210Pb activity concentration as a function of depth is non-linear in such a plot. The measured profile then allows for the determination of thinning as a function of depth.
Some special applications describe that: (i) 210Pb dating – though at a reduced time resolution – can be applicable also for temperate glaciers that are influenced by meltwater; (ii) 210Pb may be used to determine time periods with negative mass balance; (iii) 210Pb measurements of glacier ice core samples in arid regions need to be corrected for sublimation by for example chemical means to deduce total accumulation rates; (iv) the activity concentration ratio between 210Pb and its grand-daughter nuclide 210Po can be used to determine the annual net accumulation rate and finally (v) the 210Pb surface ice activity concentration along a glacier in the ablation zone potentially allows for a determination of glacier flow rates.
Acknowledgements
We highly acknowledge the help of Edith Vogel (University of Bern, Switzerland) and Silvia Köchli (Paul Scherrer Institute, Switzerland) in technical assistance to prepare and measure samples for analysis of 210Pb via 210Po.


 Open access