


1. Introduction
Emission pathways for global warming of between 1.5°C and 2.0°C require steep reductions in global net emissions, reaching 25–45% in 2030 (compared to 2010 levels), with net-zero emissions by 2050–2070 (Masson-Delmotte et al., Reference Masson-Delmotte, Zhai, Pörtner, Roberts, Skea, Shukla and Waterfield2018). On a per-capita basis, global emissions therefore need to go down to 2.5–3.3 tCO2 per capita in 2030 (Global Carbon Project, 2018; UN, Reference UN2017) or less (Girod et al., Reference Girod, van Vuuren and Hertwich2014; O'Neill et al., Reference O'Neill, Fanning, Lamb and Steinberger2018; Tukker et al., Reference Tukker, Bulavskaya, Giljum, de Koning, Lutter, Simas and Wood2016). These reductions are necessary to halt climate change and would require rapid and far-reaching changes in all aspects of society, including production and consumption practices.
The current distribution of greenhouse gas (GHG) emissions is largely unequal within (Chancel & Piketty, Reference Chancel and Piketty2015; Otto et al., Reference Otto, Kim, Dubrovsky and Lucht2019; Wiedenhofer et al., Reference Wiedenhofer, Guan, Liu, Meng, Zhang and Wei2016) and across countries (Ivanova et al., Reference Ivanova, Stadler, Steen-Olsen, Wood, Vita, Tukker and Hertwich2016). The top 10% of GHG emitters make up 34–45% of annual GHG emissions globally (Chancel & Piketty, Reference Chancel and Piketty2015; Hubacek et al., Reference Hubacek, Baiocchi, Feng, Muñoz Castillo, Sun and Xue2017). The carbon footprint of a typical super-rich household of two is estimated to be about 130 tCO2eq (Otto et al., Reference Otto, Kim, Dubrovsky and Lucht2019), compared to a world average of 3.4 tCO2eq/cap in 2011 (Stadler et al., Reference Stadler, Wood, Bulavskaya, Södersten, Simas, Schmidt and Tukker2018). About a fifth of the top 10% of world emitters are located in the European Union (EU) (Chancel & Piketty, Reference Chancel and Piketty2015). The EU has an average carbon footprint of 8.2 tCO2eq/cap and constitutes 22% of global GHG emissions (Ivanova et al., Reference Ivanova, Stadler, Steen-Olsen, Wood, Vita, Tukker and Hertwich2016).
A large body of literature on household environmental impacts exists, applying various perspectives and methods to study the resource use and wastes associated with consumption (Di Donato et al., Reference Di Donato, Lomas and Carpintero2015; Dubois et al., Reference Dubois, Sovacool, Aall, Nilsson, Barbier, Herrmann and Sauerborn2019; Niamir, Reference Niamir2019; Rai & Henry, Reference Rai and Henry2016). Prior studies have linked household expenditure surveys with environmental intensities to show the distribution of environmental footprints (Di Donato et al., Reference Di Donato, Lomas and Carpintero2015; Ivanova et al., Reference Ivanova, Vita, Steen-Olsen, Stadler, Melo, Wood and Hertwich2017; Wiedenhofer et al., Reference Wiedenhofer, Smetschka, Akenji, Jalas and Haberl2018) and the effect of (prospective) environmental policies on different household groups (Cullenward et al., Reference Cullenward, Wilkerson, Wara and Weyant2016; Melnikov et al., Reference Melnikov, O'Neill, Dalton and van Ruijven2017; Rausch et al., Reference Rausch, Metcalf and Reilly2011). Recent developments address regional and urban sustainability (Di Donato et al., Reference Di Donato, Lomas and Carpintero2015), with existing studies focusing on a single country or region (Büchs & Schnepf, Reference Büchs and Schnepf2013; Gill & Moeller, Reference Gill and Moeller2018; Girod & De Haan, Reference Girod and De Haan2010) or aggregated units of analysis such as income groups (Steen-Olsen et al., Reference Steen-Olsen, Wood and Hertwich2016; Wiedenhofer et al., Reference Wiedenhofer, Guan, Liu, Meng, Zhang and Wei2016), regions and countries (Dubois et al., Reference Dubois, Sovacool, Aall, Nilsson, Barbier, Herrmann and Sauerborn2019). For example, an analysis of the carbon footprints of 177 regions highlights the spatial heterogeneity across the EU regions (Ivanova et al., Reference Ivanova, Vita, Steen-Olsen, Stadler, Melo, Wood and Hertwich2017). While the contribution of the EU to global emissions is substantial, a detailed analysis of its carbon footprint distribution is largely missing.
To our knowledge, this is the first study to communicate carbon footprint distributions of the EU based on household-level consumption data (micro-data). The analysis covers 275,246 household surveys of between 51 and 63 different consumption categories from 26 EU countries, which is by far the most extensive to our knowledge. We combine the use of expenditure data with GHG emission intensities derived through multiregional input–output (MRIO) analysis building on prior regional-level analysis (Ivanova et al., Reference Ivanova, Vita, Steen-Olsen, Stadler, Melo, Wood and Hertwich2017). We capture differences in consumption and carbon trends between the highest and the lowest EU emitters and compare them to a per capita carbon target level of 2.5 tCO2eq/cap.
Climate change and mitigation policies have a varying impact on different segments of the population, with the consumption, livelihoods and well-being of the poorest often being most drastically affected (Rao et al., Reference Rao, Van Ruijven, Riahi and Bosetti2017). Having a distributional perspective is essential for the design of mitigation policies prioritizing well-being, social protection and access to resources within planetary boundaries (Cullenward et al., Reference Cullenward, Wilkerson, Wara and Weyant2016; Rao et al., Reference Rao, Van Ruijven, Riahi and Bosetti2017; Roberts et al., Reference Roberts, Steinberger, Dietz, Lamb, York, Jorgenson and Schor2020). At the same time, distributional perspectives remain hugely underexplored (Rao et al., Reference Rao, Van Ruijven, Riahi and Bosetti2017). We discuss the policy implications of the EU consumption distribution for environmental and social outcomes.
Our study makes a contribution in three main ways. Firstly, it offers an overview of the carbon (and consumption) inequality in the EU and across countries, regions and social groups. Secondly, it explores the consumption trends of various household groups and discusses the carbon distribution by consumption category. Thirdly, it analyses the relationships between carbon footprints and social indicators within EU countries. We highlight the strong links between the consumption distribution and various social and environmental outcomes. Understanding these links is critical for achieving well-being within planetary boundaries.
2. Methods
2.1. Household budget surveys
Consumer expenditure data at the household level were collected from Eurostat and national statistics institutes in the form of household budget surveys (HBSs) for the year 2010. This is the latest harmonized dataset that is available at the moment of publication of our analysis. Supplementary Information (SI) 1 and the EU quality report on the 2010 wave (Eurostat, 2015) provide more detail on sample sizes, response rates, recording period and expenditure detail. This analysis includes HBSs from Belgium (BE), Bulgaria (BG), Cyprus (CY), Czech Republic (CZ), Germany (DE), Denmark (DK), Estonia (EE), Spain (ES), Finland (FI), France (FR), Greece (GR), Croatia (HR), Hungary (HU), Ireland (IE), Italy (IT), Lithuania (LT), Luxembourg (LU), Latvia (LV), Malta (MT), Poland (PL), Portugal (PT), Romania (RO), Sweden (SE), Slovenia (SI), Slovakia (SK) and the United Kingdom (GB).
The HBSs have highly a harmonized consumption structure (based on Eurostat's Classification of Individual Consumption by Purpose (COICOP)) and year coverage (i.e., 2010 wave) (Eurostat, 2015), although some differences in the survey design and methodology remain.
Households were asked to maintain detailed expenditure diaries over a fixed period of time (generally two weeks). In addition to the expenditure diaries, HBSs include interviews collecting information about regular expenditure such as rents and energy bills and infrequent larger purchases for up to one year retrospectively (Eurostat, 2015). Sharing common accommodation and expenses is central to the definition of a household for all HBSs. We derived per capita expenditure and footprints by applying the real household count with the same weights to children and adults.
2.2. Harmonization of HBSs and EXIOBASE
The use of environmentally extended MRIO analysis for quantifying household environmental impacts to produce top-down carbon footprint estimates is quite common (Di Donato et al., Reference Di Donato, Lomas and Carpintero2015; Ivanova et al., Reference Ivanova, Vita, Steen-Olsen, Stadler, Melo, Wood and Hertwich2017; Steen-Olsen et al., Reference Steen-Olsen, Wood and Hertwich2016). The Input–Output Expenditure (IO-Expenditure; Di Donato et al., Reference Di Donato, Lomas and Carpintero2015) approach (also referred to as Consumer Expenditure Surveys – Multiregional Input–Output (CES-MRIO) matching; Ivanova et al., Reference Ivanova, Vita, Steen-Olsen, Stadler, Melo, Wood and Hertwich2017; Steen-Olsen et al., Reference Steen-Olsen, Wood and Hertwich2016) combines survey expenditure with carbon intensities from a MRIO model, which encompasses the whole economy providing goods and services to final demand.
The product-level carbon intensities in this work were derived from the EXIOBASE 3.6 database (Stadler et al., Reference Stadler, Wood, Bulavskaya, Södersten, Simas, Schmidt and Tukker2018). EXIOBASE has a high sectoral detail and a wide range of environmental and social satellite accounts (Wood et al., Reference Wood, Stadler, Bulavskaya, Lutter, Giljum, de Koning and Tukker2015), and version 3.6 provides input–output tables ranging from 1995 to 2016 for 44 countries (including 28 EU members) and 5 rest-of-the-world regions. Carbon footprints were calculated using the Global Warming Potential 100 (GWP100) metric communicating the amount of CO2, CH4, N2O (from combustion and non-combustion) and SF6 in kgCO2-equivalents per year (Solomon et al., Reference Solomon, Qin, Manning, Marquis, Averyt, Tignor and Chen2007). SI1 and the Supplementary Spreadsheet provide more details on the harmonization procedure between HBSs and EXIOBASE. We focused our analysis solely on household expenditure, thus excluding other final demands such as gross capital formation and governmental spending. Therefore, we quantified the household carbon footprint, referred to as the carbon footprint (CF) from here onwards.
Despite the large sample sizes, it is common to find significant differences between total expenditure as reported in HBSs and as estimated in national accounts. Prior studies have discussed the importance of survey under-reporting (e.g., with hospitality and ‘discretionary’ expenditure often underestimated in surveys) (Isaksen & Narbel, Reference Isaksen and Narbel2017). Furthermore, HBSs generally record more expenditure on food and non-alcoholic beverages, housing, water, electricity, gas and other fuels compared to the national accounts (Eurostat, 2015; Statistics Explained, 2019), which matches our over-reporting adjustments in these sectors. The analysis of extremes may suffer from under-reporting at the top of the distribution (Chancel & Piketty, Reference Chancel and Piketty2015; Eurostat, 2015), thus underestimating the top and the mean expenditure. We estimated under- and over-spending on average by country and proportionally reallocated it to households.
2.3. Indirect and direct GHG emissions
We converted survey expenditure from purchaser's prices or the price paid by final consumers to basic prices (bp) in order to match with EXIOBASE. We utilized transport, trade and tax layers, relocating the trade and transport costs from final products to the respective sectors. We introduced a function for this conversion f, described elsewhere (Steen-Olsen et al., Reference Steen-Olsen, Wood and Hertwich2016).
Direct GHG emissions occur during the use phase of products. We adopted direct emission intensities by products and countries measured in kgCO2eq/EUR in bp, so that the amount of direct emissions was proportionate to the household spending on the product. For products with no (or very low) household spending, we adopted a fixed amount per capita.
We adopted a climate target of 2.5 tCO2eq/cap by 2030, which is consistent with emission pathways limiting global warming to 1.5°C (Masson-Delmotte et al., Reference Masson-Delmotte, Zhai, Pörtner, Roberts, Skea, Shukla and Waterfield2018). Prior studies discuss per capita climate targets of 1.6–3.3 tCO2eq/cap (Bjørn et al., Reference Bjørn, Kalbar, Nygaard, Kabins, Jensen, Birkved and Hauschild2018; Girod et al., Reference Girod, van Vuuren and Hertwich2014; Global Carbon Project, 2018; O'Neill et al., Reference O'Neill, Fanning, Lamb and Steinberger2018; Tukker et al., Reference Tukker, Bulavskaya, Giljum, de Koning, Lutter, Simas and Wood2016; UN, Reference UN2017). The time horizon for such a budget is critical, as essentially global emissions need to go down to net-zero (Masson-Delmotte et al., Reference Masson-Delmotte, Zhai, Pörtner, Roberts, Skea, Shukla and Waterfield2018).
2.4. Statistical analysis and linking to social outcomes
Expenditure elasticities (referred to as ‘elasticities’ hereafter) measure the responsiveness of expenditure on a certain product to a unit change in total expenditure. High elasticities of a product signal an increasing proportion of expenditure on the product with rising total expenditure, and these are common for non-necessities. Low elasticities are common for the consumption of necessities. A significant change in elasticities may reflect the shift from basic to discretionary spending (Rao & Baer, Reference Rao and Baer2012), or even conspicuous consumption. For example, food-related expenditure elasticities naturally decrease for higher-expenditure quintiles across EU countries, reflecting the decrease in utility from allocating more expenditure towards food consumption. Similarly, low-income countries have a higher elasticity of food products than countries with higher income levels (Rao & Baer, Reference Rao and Baer2012).
We also explore the link between GHG emissions and socially desirable outcomes (Table 1). We based the social outcomes on multidimensional indicators for a safe and just space (O'Neill et al., Reference O'Neill, Fanning, Lamb and Steinberger2018) and poverty measurement (Rao et al., Reference Rao, Van Ruijven, Riahi and Bosetti2017).
Socially desirable outcomes and definitions measured on a household level.

3. Results
3.1. Carbon footprint distribution in the EU
The top 10%, middle 40% and bottom 50% of the population in terms of CF per capita contribute 27%, 47% and 26% of the EU total CF, respectively (Figure 1, left). That is, the top 10% of the EU population have a higher emission share than the bottom 50%. The top 1% of the EU population have a CF share as high as the bottom 18% combined, or about 6% of EU total emissions. These results are adjusted for the variation in household sizes by different emitting groups.
Carbon footprint (CF) distribution by European Union (EU) individuals (adjusted by household size) on the left and by EU households on the right. ‘EU Top 10%’ refers to the 10% of the EU population with the highest CFs per capita on the left plot and the 10% of households with the highest CFs per capita on the right plot. EU household weights applied.

As household sizes among the groups vary substantially, the carbon distribution of the top 10%, middle 40% and bottom 50% of EU households is very different (Figure 1, right). The top 10% of households contribute 19% of the EU CF with an average household size of 1.7 members. The share of the middle 40% and bottom 50% of households amounts to 43% and 38%. Their average household sizes correspond to 2.1 and 2.6 members, respectively. As HBSs collect expenditures and weights per households, from here onwards we discuss results by households (corresponding to Figure 1, right). ‘EU top 1%’ and ‘EU top 10%’ refer to the 1% and 10% of EU households with the highest CF per capita, while ‘EU bottom 50%’ refers to the 50% of EU households with the lowest CF per capita. The rest of EU households fall within ‘EU middle 40%’.
High emitters from all EU countries are among the EU top 10% emitters (Table 2). These households have an average CF of 23 tCO2eq/cap (Figure 1) and a minimum CF of 15 tCO2eq/cap. DE, GB and IT contribute to the highest share of EU emissions – 4%, 4% and 3%, respectively. As much as 36% of Luxembourg's households enter the EU top 10%, which is the highest relative share among EU countries.
Share of European Union (EU) carbon footprint (CF) and households by country and emitting group.

Key: 0.5% of the EU emissions are linked to the consumption of Belgian households, which are among the EU top 10%. This includes about 11% of the country's households.
Shading represents the magnitude of the EU CF shares.
See Section 2 for country codes.
The average CF of the EU middle 40% emitters amounts to 10 tCO2eq/cap (Figure 1), with CFs between 7 and 15 tCO2eq/cap. The average CF of the EU bottom 50% emitters amounts to 5 tCO2eq/cap. This is about 5 times lower than that of the EU top 10% average and 12 times lower than that of the EU top 1%.
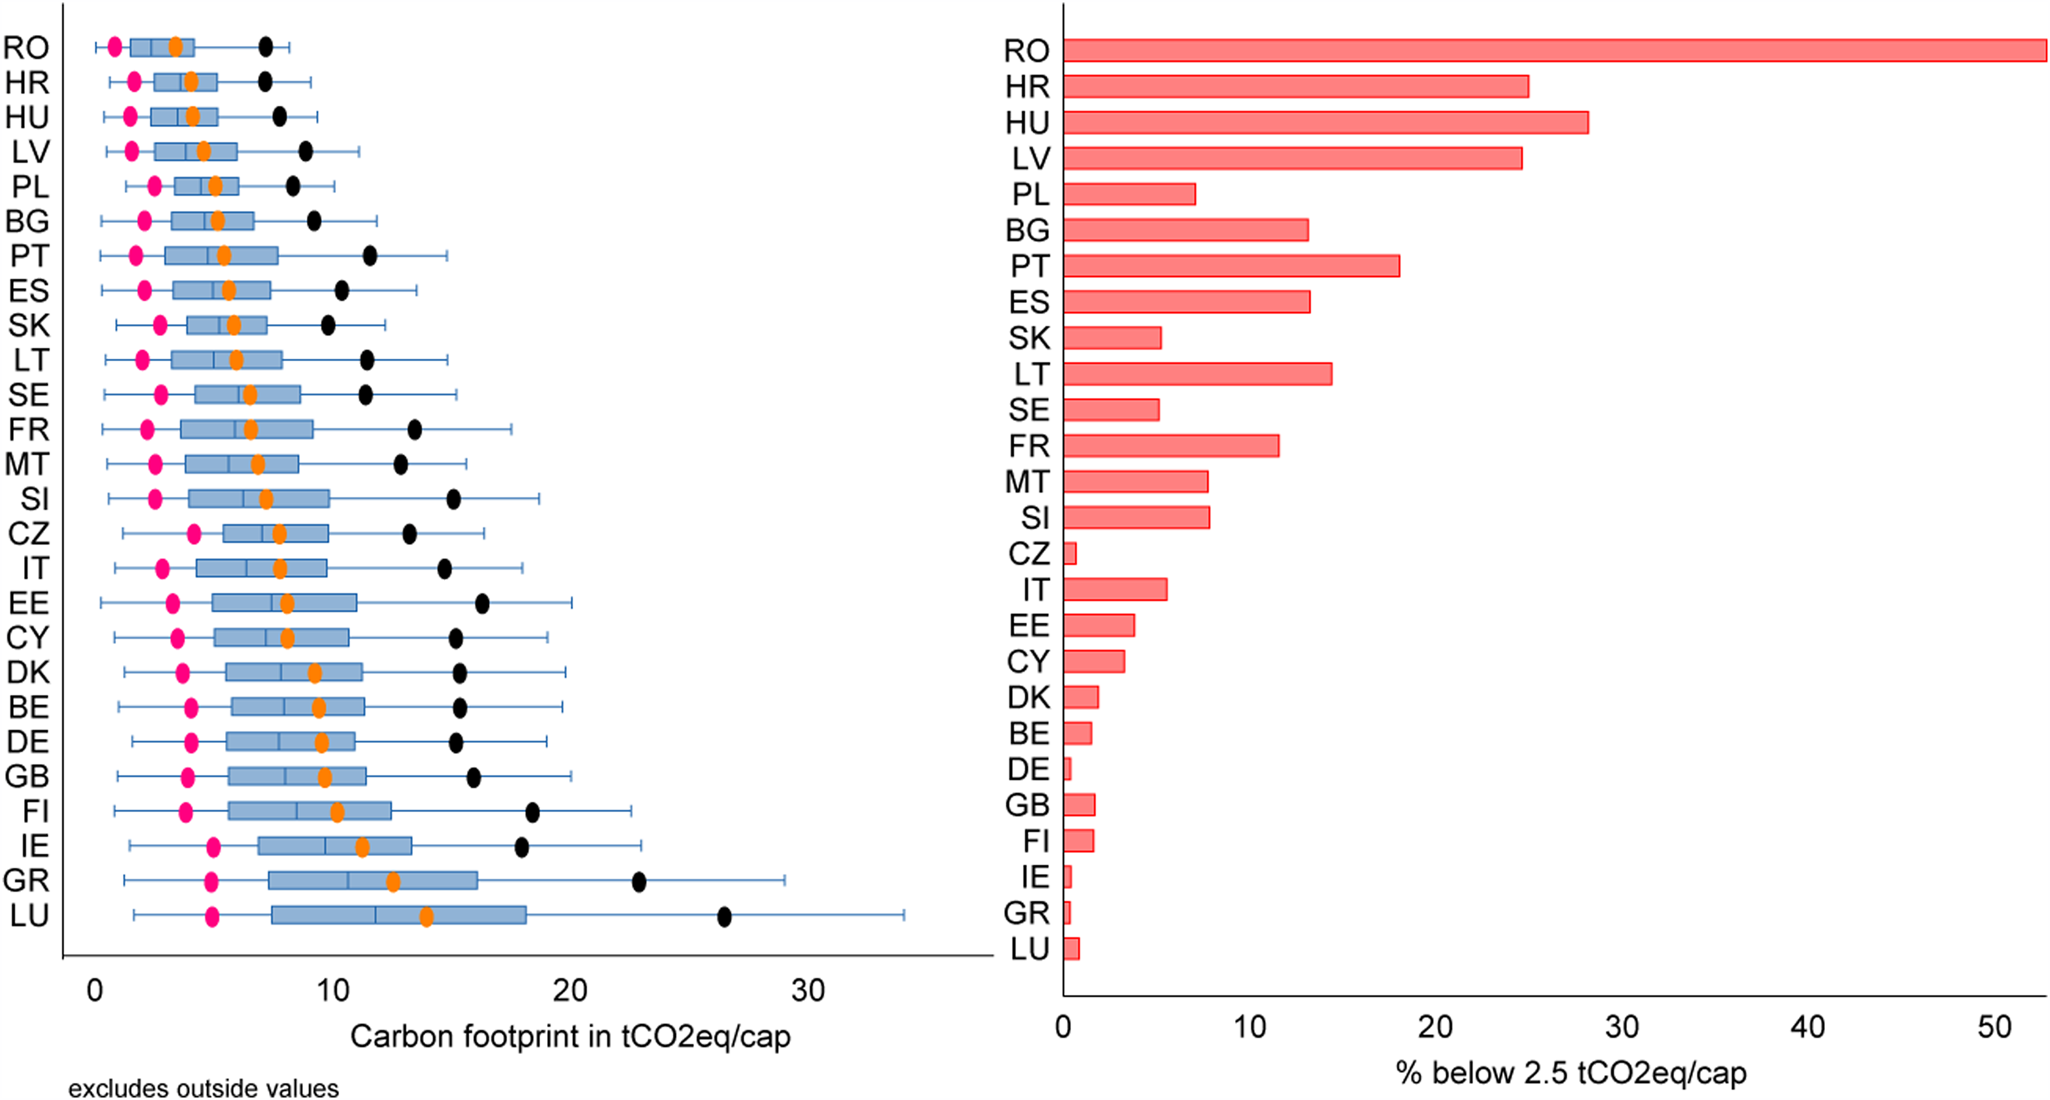
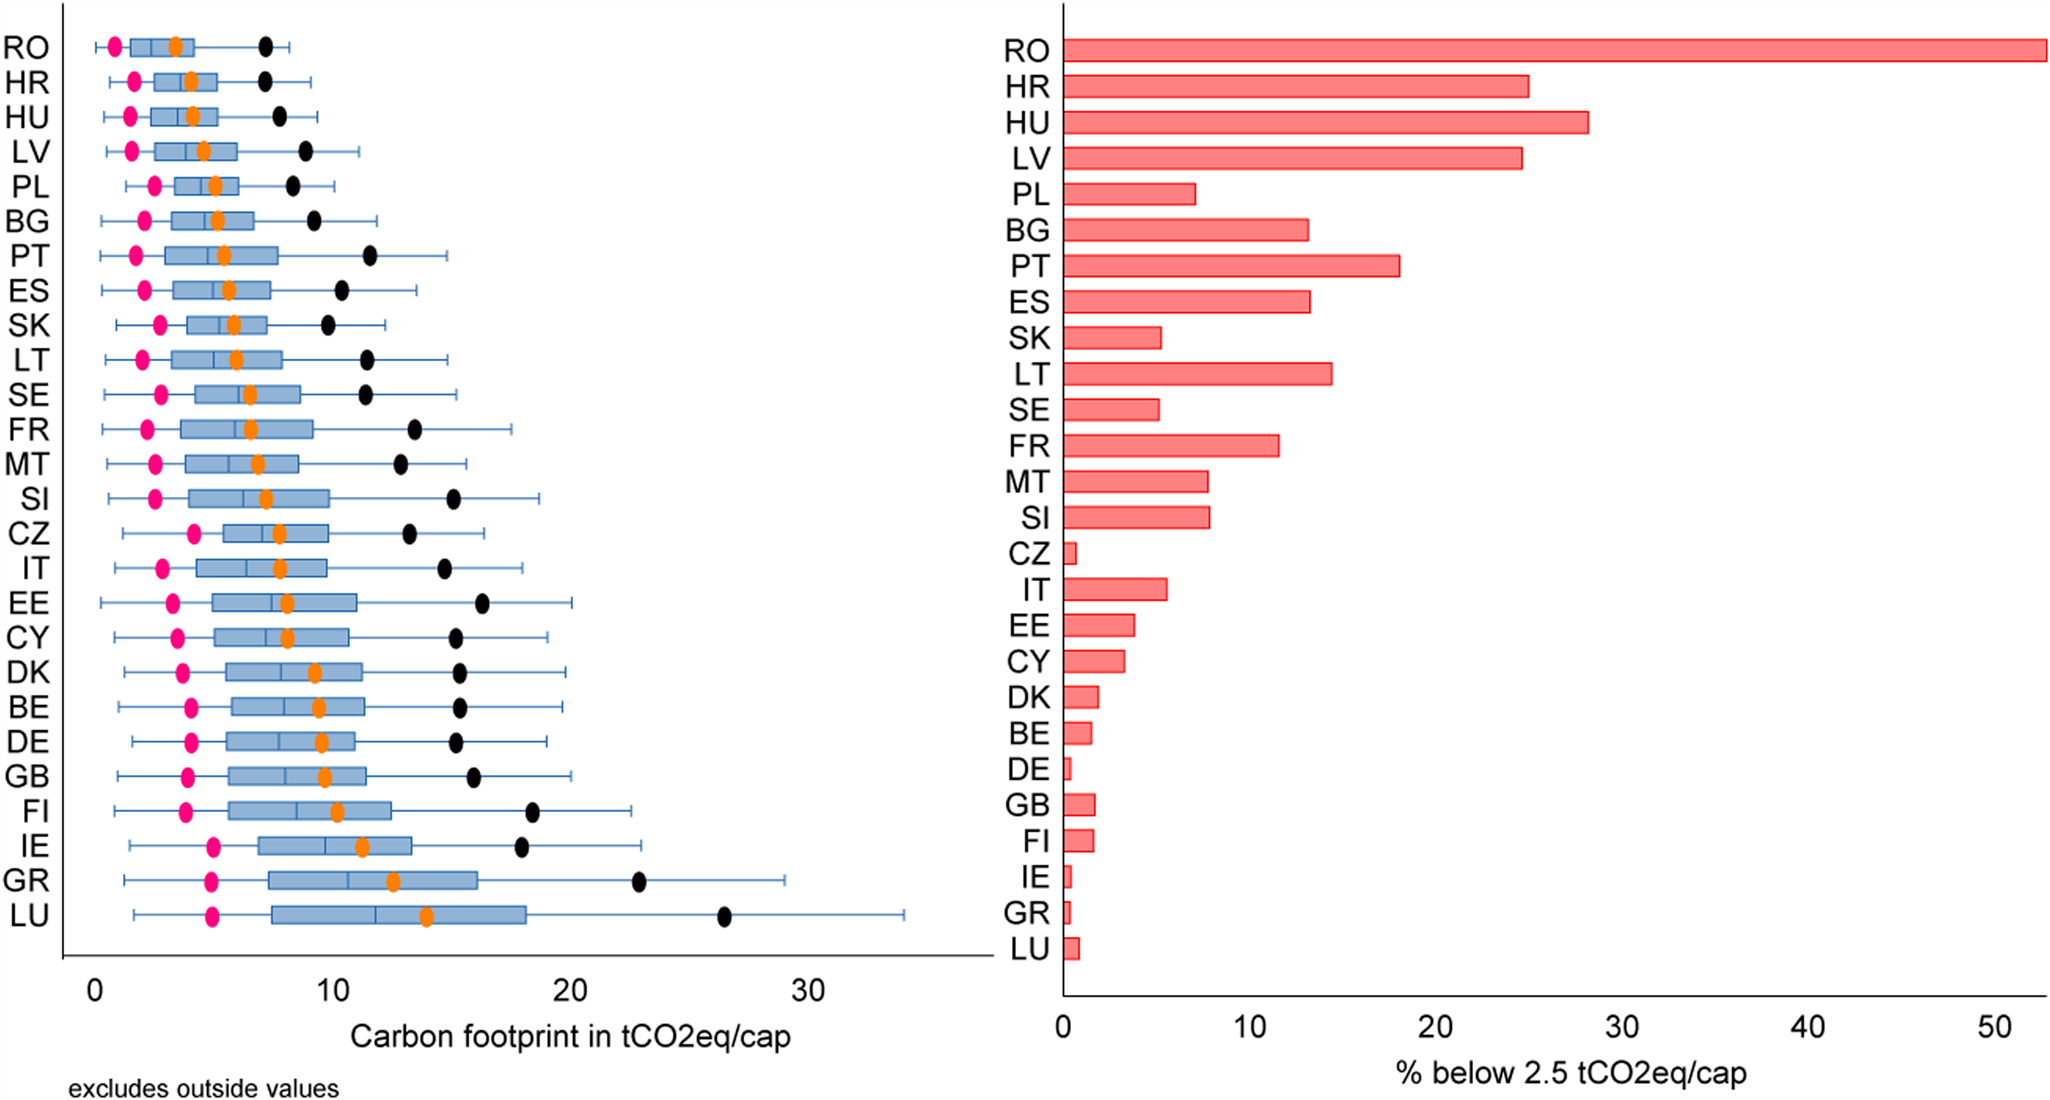
The ranges in Figure 2 describe how concentrated the CF is within countries. Means are higher than medians for all countries, pointing to a right-skewed carbon distribution. Within countries, the top 1% of households have CFs between 15.0 (HR) and 48.3 (GR) tCO2eq/cap, while the top 10% have CFs between 7.3 (HR) and 26.4 (LU) tCO2eq/cap (Figure 3). The highest share of CF below 2.5 tCO2eq/cap is noted in Romania at about 53%. Other countries with a share of low-carbon households above 20% include Hungary, Latvia and Croatia. Conversely, countries such as Germany, Ireland, Greece and Luxembourg have less than 1% of households within climate targets.
Distribution of carbon footprints per capita (on the left) and percentage of households below 2.5 tCO2eq/cap (on the right) by country. Countries are ordered by average carbon footprint per capita (orange circles), from the lowest to the highest. The boxes describe 25th percentiles (left hinge), median and 75th percentiles (right hinge), and the whiskers describe the minimum and the maximum in the absence of outside values. The pink and grey circles describe the 10th and 90th percentiles in each country, respectively. See Section 2 for country codes.
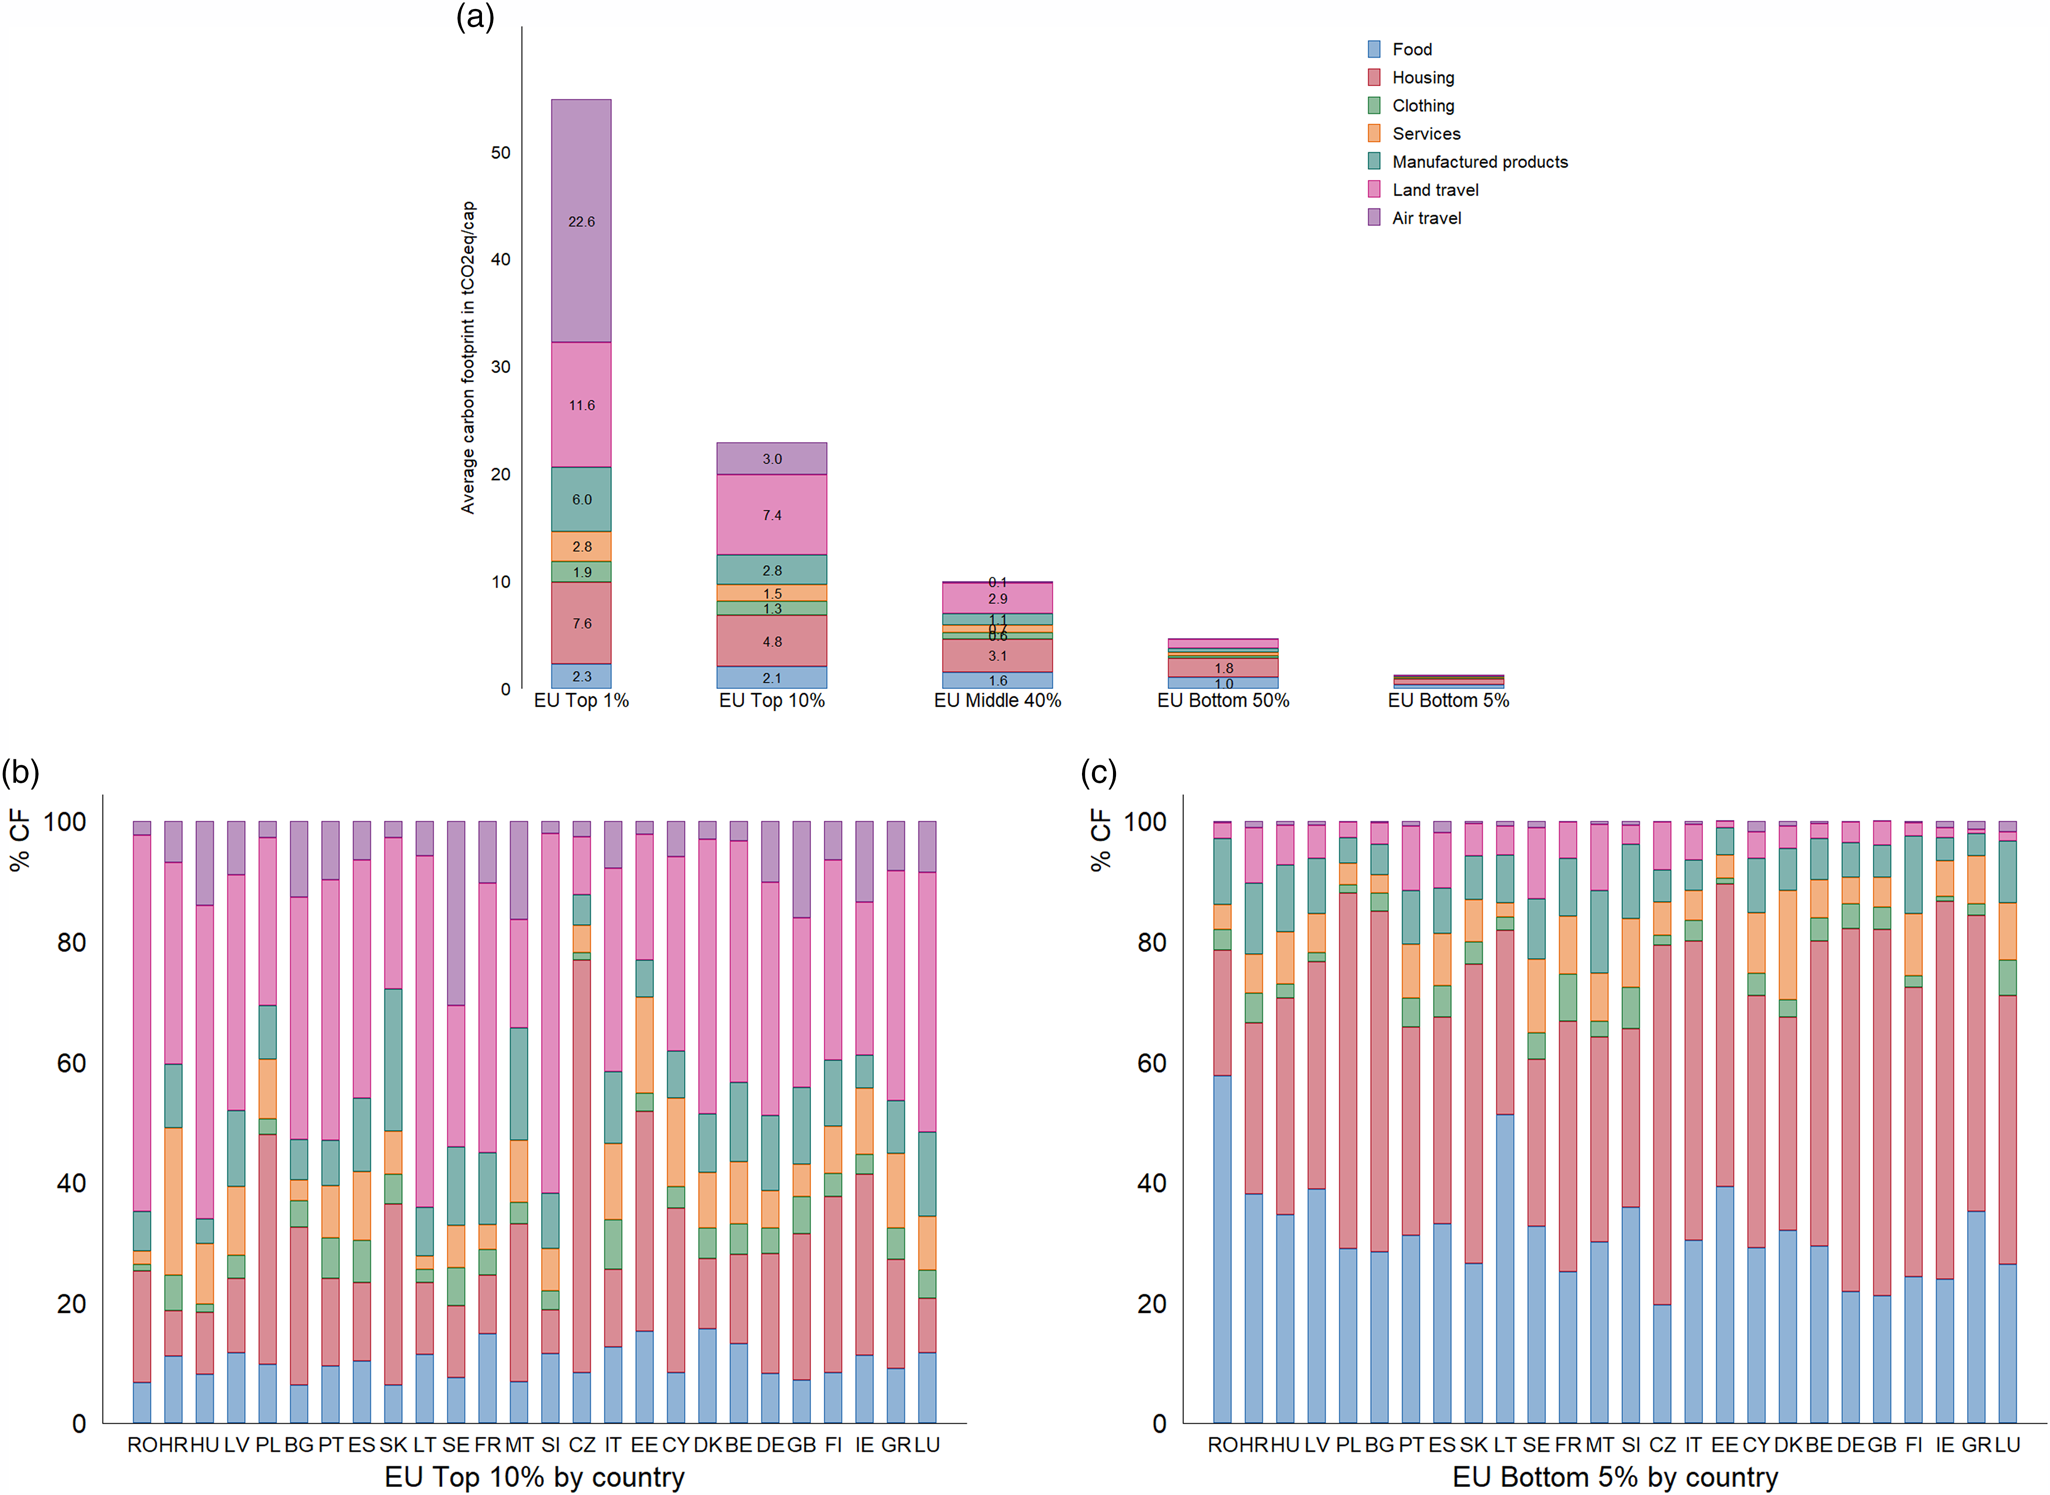
Average carbon footprint (CF) distribution by consumption category in the European Union (EU) (top). The bottom graph depicts the average CF shares by consumption category and countries of EU top 10% emitters on the left (with CF >15 tCO2eq/cap) and EU bottom 5% of emitters on the right (with CF <2.5 tCO2eq/cap). See SI4 for country averages. EU household weights applied. See Section 2 for country codes.
Another way of measuring carbon inequality is through CF Ginis (i.e., carbon concentration indices). RO, BG and PL stand out with the highest CF Ginis, at between 0.42 and 0.45, signalling their relatively unequal distribution of CFs. Even large geographical regions have more equal carbon distributions compared to countries (SI4). This is especially the case for Bulgaria and Poland, where regional Ginis drop to 0.25–0.34. At the other end, Czech Republic, Slovakia and Germany have the most equal carbon distributions, with CF Ginis below 0.3.
3.2. Carbon footprints by consumption category, expenditure and income quintiles
The EU top 10% households have a carbon intensity at 0.86 kgCO2eq/EUR on average, while that of the EU top 1% is at 0.95 kgCO2eq/EUR on average. For comparison, the average EU carbon intensity is about 0.7 kgCO2eq/EUR. The highest emitters are associated with larger shares of land and air travel GHG emissions (Figure 3). Transport use has the highest carbon intensity among the consumption categories (SI4) and shows a stable increase with expenditure and income (Figure 4). Those with the highest CFs also have the highest expenditure and income levels, with a stronger correlation with expenditure (Figure 4).
Average carbon footprint distribution by expenditure quintile (EQ; on the left) and by income quintile (on the right) in the European Union (EU). EQ1 contains households with annual expenditure levels below 6300 EUR in basic prices; 6300 EUR < EQ2 < 9300; 9300 EUR < EQ3 < 12,800; 12,800 EUR < EQ4 < 18,700; EQ5 > 18,700 EUR. EU household weights applied.

The majority of GHG emissions of the top EU emitters are transport-related. In particular, air travel drives a CF of 22.6 tCO2eq/cap among the EU top 1% households, which is about 41% of their total contribution. It is the EU top 10% of households that fly, with an average air travel CF of the rest of the population below 0.1 tCO2eq/cap. The CF associated with air travel increases with rising expenditure and income (Figure 4). In fact, air travel is by far the most elastic consumption in the EU, with an expenditure elasticity of 1.5; this suggests that, as total expenditure doubles, the expenditure on air travel increases by 150% (Figure 5). The consumption category has a rising elasticity with expenditure quintile, reaching 2.0–2.7 among the highest spenders. Whilst the expenditure effect is strong, there are many households with high expenditure that avoid air travel. The lowest-expenditure quintile has an insignificant coefficient, which confirms that an increase in total spending does not result in an increase in flying among the lowest spenders. This confirms air travel as a highly carbon-intensive luxury (Oswald et al., Reference Oswald, Owen and Steinberger2020).
European Union (EU) expenditure elasticities by consumption category (top) and by consumption category and expenditure quintile combined (bottom). Dependent variable = log of expenditure in a certain category; independent variable = log of total expenditure. See SI3 for analysis by country. EU household weights applied. See Section 2 for country codes.

The trend of decreasing elasticity with rising total spending is generally present across categories, except for air travel (Figure 5). Our findings point to important expenditure thresholds for low-spending groups and decreasing elasticities for higher spenders across the consumption categories, signalling diminishing utility from further consumption of that good (Rao & Baer, Reference Rao and Baer2012). In the case of air travel, we note an increasing elasticity and hence a rising shift of expenditure towards this consumption category with rising total spending.
Land travel is associated with some of the highest consumption shares among the EU top emitters (Figure 3) and spenders (Figure 4). Land travel (purchase of vehicles, transport fuels and services) drives 32% of the CF of the top 10%, making it the consumption category with the highest contribution among the biggest emitters. Nevertheless, the transport share of the lowest expenditure quintile is not negligible, with a relative importance of about 20%, only below basic needs such as food and housing (Figure 4). The expenditure elasticity exceeds 1 among the lowest-expenditure quintiles (Figure 5), suggesting a high inequality in the distribution of land travel, which calls attention to the importance of equity considerations, particularly in car-dependent rural areas. The elasticities drop below 1 among the biggest spenders, reflecting the more basic nature of this category at higher-expenditure levels. These results confirm transport as one of the most unequally distributed and the strongest drivers of the CF of the rich (Oswald et al., Reference Oswald, Owen and Steinberger2020; Otto et al., Reference Otto, Kim, Dubrovsky and Lucht2019).
The carbon intensity of the EU bottom 5% of households is about 0.7 kgCO2eq/EUR. This varies substantially across countries, from 0.3 kgCO2eq/EUR in Sweden to 2.0 kgCO2eq/EUR in Estonia. The EU bottom 5% show disproportionally large shares of basic consumption (Figure 3). The large differences in carbon intensity across countries give rise to substantial variation in consumption levels (SI2).
Food and housing are necessities and are thus associated with much lower expenditure elasticities than other consumption categories. The food elasticity decreases steadily across EU expenditure quintiles from 0.58 to 0.17 among the lowest and the highest quintiles, respectively (Figure 5). In the context of housing, we note a decrease in the elasticity for the middle quintiles, followed by an increase for the highest quintiles. This may reflect increases in dwelling sizes or shifts to single-family houses (Ivanova et al., Reference Ivanova, Vita, Wood, Lausselet, Dumitru, Krause and Hertwich2018) and in turn heating and cooling needs among the highest spenders.
3.3. Carbon footprints and social outcomes
Figure 6 sheds more light on the interlinkages between consumption and environmental and social outcomes. In line with previously adopted social thresholds (O'Neill et al., Reference O'Neill, Fanning, Lamb and Steinberger2018), here we explore desirable social outcomes such as income, access to energy, employment and nutrition. The graphs depict a wide range of socially desirable outcomes at the same level of CFs.
Average carbon footprints and social outcomes by expenditure decile and country. The shares on the x-axes vary from 0 to 1, corresponding to the range from 0% to 100%. See Section 2 for country codes.

Income and CFs are strongly positively correlated, as highlighted by prior studies (Baiocchi et al., Reference Baiocchi, Minx and Hubacek2010; Ivanova et al., Reference Ivanova, Vita, Steen-Olsen, Stadler, Melo, Wood and Hertwich2017; Kerkhof et al., Reference Kerkhof, Benders and Moll2009; Zhang et al., Reference Zhang, Luo and Skitmore2015), with a correlation coefficient of 0.65 for the whole of the EU. Figure 6 depicts several country clusters with varying slopes. The cluster with the steepest slope represent countries such as Estonia and Bulgaria, characterized by relatively low income/consumption levels and high carbon intensities per level of income. The middle cluster captures countries such as Greece and Czech Republic, with moderate carbon intensity and higher income levels. The cluster with the flattest slope consists of the countries with the highest income levels and lowest carbon intensities, such as Denmark and France. Figure 6 displays a wide variation of CFs at fixed incomes, pointing to the countries with the highest carbon efficiency per income level.
Similarly, there is a positive association between the CF and education (as previously suggested; Ivanova et al., Reference Ivanova, Vita, Steen-Olsen, Stadler, Melo, Wood and Hertwich2017), with a correlation coefficient of 0.54 for the EU. Yet, similarly to income, there is wide variation in CFs across countries at similar education levels. A positive, although weaker, association between CFs and nutrition is noted as well, with a correlation coefficient of 0.35 for the EU. We also note a negative correlation between CFs and risk of (fuel) poverty and social exclusion, as well as a weak negative correlation between CFs and living on unemployment benefits, with a coefficient of –0.22.
Figure 6 depicts associations and should not be interpreted as low emissions causing social challenges or vice versa. Consumption is at the root of these strong associations. Consumption of certain material goods such as food and housing is necessary for the satisfaction of material and human needs (Jackson, Reference Jackson2005), such as subsistence and protection and decent living standards (Rao & Min, Reference Rao and Min2018). The decarbonization of these key material goods remains a challenge for sustainability.
4. Discussion
4.1. The distribution of CFs
Here, we aim to inform EU, national and regional sustainability efforts through providing a distributional perspective on GHG emissions. Only about 5% of the EU households conform to climate targets, with CFs below 2.5 tCO2eq/cap. Our results are in agreement with prior evidence (Bjørn et al., Reference Bjørn, Kalbar, Nygaard, Kabins, Jensen, Birkved and Hauschild2018; O'Neill et al., Reference O'Neill, Fanning, Lamb and Steinberger2018) that substantial decarbonization of consumption is needed to ensure a good life within planetary boundaries. With an average CF in Europe of 7.5 tCO2eq/cap (Ivanova et al., Reference Ivanova, Barrett, Wiedenhofer, Macura, Callaghan and Creutzig2020), there is a need to reduce the GHG intensity of consumption by a factor of 3 or more to meet climate targets (Bjørn et al., Reference Bjørn, Kalbar, Nygaard, Kabins, Jensen, Birkved and Hauschild2018).
The EU top 1% emit 55 tCO2eq/cap on average, more than 22 times the 2.5-tonne target. Aviation particularly stands out, with a substantial carbon contribution and the highest expenditure elasticities for the highest emitters. The EU top 1% of households have an average CF share associated with air travel of 41%, making air travel the consumption category with the highest carbon contribution among the top emitters. Package holidays and air transport are luxury items with high energy intensity (Oswald et al., Reference Oswald, Owen and Steinberger2020); at the same time, they receive extremely low policy attention, with only 1% of policies targeting aviation (Dubois et al., Reference Dubois, Sovacool, Aall, Nilsson, Barbier, Herrmann and Sauerborn2019). This lack of policy focus on high-carbon polluting activities of high-income actors – who have both high responsibility and capacity for climate change mitigation – raises substantial ethical and equity concerns.
Land travel drives 21% and 32% of the average CF of the EU top 1% and top 10% of households, respectively. Radical emission reductions in this category require decreases in the number of vehicles and travel distance and the shift to low-carbon transport modes (Ivanova et al., Reference Ivanova, Barrett, Wiedenhofer, Macura, Callaghan and Creutzig2020). Research on car dependence exposes the difficulty of moving away from a car-dominated, high-carbon transport system and draws attention to the political-economic factors underpinning that dependence (Mattioli et al., Reference Mattioli, Roberts, Steinberger and Brown2020). Moreover, the high expenditure share on land travel among the lowest EU expenditure quintile (20%) is alarming, with relative importance below only basic needs such as food and housing. In Organisation for Economic Co-operation and Development (OECD) countries, the need satisfaction and social inclusion are dependent on car use and ownership, especially in suburban and peri-urban areas built on the assumption of near-universal car access (Mattioli et al., Reference Mattioli, Roberts, Steinberger and Brown2020). These results, as well as recent events (e.g., the yellow vest movement in France; Le Monde, 2018), call attention to the importance of equity considerations in transport policy.
Important infrastructural, institutional and behavioural lock-ins (Seto et al., Reference Seto, Davis, Mitchell, Stokes, Unruh and Ürge-Vorsatz2016) and powerful forces of highly profitable (fossil fuel) industries (Fuchs et al., Reference Fuchs, Di Giulio, Glaab, Lorek, Maniates, Princen and Røpke2016; Roberts et al., Reference Roberts, Steinberger, Dietz, Lamb, York, Jorgenson and Schor2020) constrain the transition to a low-carbon society. Giving further attention to the ways in which to overcome social and political barriers to low-carbon consumption patterns and living is key (Ivanova et al., Reference Ivanova, Barrett, Wiedenhofer, Macura, Callaghan and Creutzig2020; Mattioli et al., Reference Mattioli, Roberts, Steinberger and Brown2020; Roberts et al., Reference Roberts, Steinberger, Dietz, Lamb, York, Jorgenson and Schor2020).
4.2. Social outcomes and policy recommendations
This article complements prior cross-country analyses of biophysical boundaries and social thresholds (O'Neill et al., Reference O'Neill, Fanning, Lamb and Steinberger2018) with within-country perspectives in the EU. We explore the distribution of CFs relative to multidimensional social indicators focusing on income, education, health and living conditions, allowing for a broader measurement of poverty and equity and comparisons across the Sustainable Development Goals (Rao et al., Reference Rao, Van Ruijven, Riahi and Bosetti2017). We observe wide ranges in income, education, nutrition, employment and poverty for the same levels of CFs, highlighting successful cases of low-carbon contribution and high levels of social well-being, as well as high-carbon, low-well-being cases that need further attention (Roberts et al., Reference Roberts, Steinberger, Dietz, Lamb, York, Jorgenson and Schor2020). Ensuring decent levels of physical requirements (e.g., nutrition, shelter) and social requirements (e.g., communications, mobility) (Rao & Baer, Reference Rao and Baer2012; Rao & Min, Reference Rao and Min2018) for well-being should be a key consideration in the design of a fair climate policy.
More attention on equitable well-being is expected to enable gains in well-being that are compatible with the radical GHG emission reductions needed (Roberts et al., Reference Roberts, Steinberger, Dietz, Lamb, York, Jorgenson and Schor2020). A comprehensive analysis of the dynamics of the distributional impacts of climate policies and climate change impacts on various household groups is needed in order to inform mitigation and adaptation policies (Rao et al., Reference Rao, Van Ruijven, Riahi and Bosetti2017), capturing household heterogeneity in consumption, income and well-being indicators. The distributional perspective within countries and regions provides an additional monitoring base, and thus a more complete picture of the beneficiaries of various actions and policies (Cullenward et al., Reference Cullenward, Wilkerson, Wara and Weyant2016; Roberts et al., Reference Roberts, Steinberger, Dietz, Lamb, York, Jorgenson and Schor2020; Steininger et al., Reference Steininger, Lininger, Meyer, Munõz and Schinko2016).
Furthermore, there is robust evidence that overconsumption and materialistic practices are not only damaging for the environment, but may also reduce psychological well-being (Brown & Kasser, Reference Brown and Kasser2005; Jackson, Reference Jackson2005). In order to reduce trade-offs between social and environmental goals, policies should target changes in higher-order need satisfiers, such as social structures and practices, and reimagine forms of need satisfaction within environmental constraints (Mattioli, Reference Mattioli2016). Redesigning consumption practices (Ivanova et al., Reference Ivanova, Barrett, Wiedenhofer, Macura, Callaghan and Creutzig2020), public spaces and social structures through voluntary simplicity (Jackson, Reference Jackson2005; Vita et al., Reference Vita, Ivanova, Dumitru, García-mira, Carrus, Stadler and Hertwich2020) and sharing (Ivanova & Büchs, Reference Ivanova and Büchs2020) may reconcile lower carbon emissions and higher well-being. Collective solutions and investment in social infrastructure (see universal basic services; Coote et al., Reference Coote, Kasliwal and Percy2019) hold potential to deliver the social services necessary for human well-being in coherence with the principles of equity, efficiency, solidarity and sustainability (Coote et al., Reference Coote, Kasliwal and Percy2019).
4.3. Limitations
The Eurostat HBSs are largely harmonized; however, differences remain in the designs, definitions and procedures. The size of the sampling error depends on the sample size (Eurostat, 2015), and the actual sample sizes are larger than the effective sample sizes for all countries except for Czech Republic and Sweden, where differences are within 10% (SI1). Certain groups of households may be difficult to access or disproportionately affected by non-response (Eurostat, 2015). In particular, the group of the super-rich may be underrepresented, with countries such as Germany excluding households with a monthly net income higher than €18,000 (Eurostat, 2015).
Consumption categories may be under- and over-reported given the mode of data collection (Eurostat, 2015). Certain products may be under-reported deliberately as more ‘sensitive’, or unintentionally due to recall problems (Bee et al., Reference Bee, Meyer and Sullivan2012; Eurostat, 2015). Differences in expenditure may also be relatively large for infrequent purchases (e.g., private vehicles, non-work and irregular travel; Clarke et al., Reference Clarke, Dix and Jones1981; Ivanova et al., Reference Ivanova, Vita, Wood, Lausselet, Dumitru, Krause and Hertwich2018; Minnen et al., Reference Minnen, Glorieux and van Tienoven2015), resulting in artificial variation among households and elevated standard deviations (Eurostat, 2015; Gill & Moeller, Reference Gill and Moeller2018). The tourism and transport sectors may be associated with higher uncertainty due to residents’ spending abroad (Ivanova et al., Reference Ivanova, Vita, Steen-Olsen, Stadler, Melo, Wood and Hertwich2017; Usubiaga & Acosta-Fernández, Reference Usubiaga and Acosta-Fernández2015). Our footprints focus on household consumption and thus exclude government consumption and investment, which contribute to roughly 32% of the EU's total CF (Ivanova et al., Reference Ivanova, Stadler, Steen-Olsen, Wood, Vita, Tukker and Hertwich2016).
Household expenditure is used in combination with monetary environmental intensities, which vary by product and country. This probably overestimates the environmental impact of expensive products (and wealthier individuals) and underestimates the impact of cheap products (and less wealthy individuals) (Girod & De Haan, Reference Girod and De Haan2010). Physical consumption data – when such data are available – may be useful in controlling for price differences across income cohorts (Girod & De Haan, Reference Girod and De Haan2010). Some HBSs offered physical data on food consumption (quantities in kilograms/litres), which we used to adjust the CFs across income decile groups. While indeed we calculated higher food prices for higher-income quintiles, the differences between the two approaches were not statistically significant for several of the countries. Since the physical data were only available for food and for some of the EU countries, we did not use them in the analysis.
EXIOBASE provides high product detail, depicting the global economy in 200 product classifications (Wood et al., Reference Wood, Stadler, Bulavskaya, Lutter, Giljum, de Koning and Tukker2015). However, the product detail may still be insufficient to adequately account for the variation of environmental contributions within the same sector. For example, we could not recognize efforts towards green consumerism (e.g., buying a fuel-efficient car or opting for a green energy provider; Gill & Moeller, Reference Gill and Moeller2018). The allocation of emissions from land-use change to specific economic activities is also problematic (Hertwich & Peters, Reference Hertwich and Peters2009).
Future work may target some of these limitations by focusing on the environmental and social implications for under-represented and under-analysed socio-demographic groups. Environmental impact assessment may benefit from higher detail of environmental intensities and physical consumption data collected through the HBSs.
5. Conclusions
The EU has committed to an action programme towards a good life for all within the planetary boundaries (European Commission, 2013). Such actions require mitigation efforts by all actors in society and radical reductions in CFs to meet climate targets. In our analysis of the CF of European households using household-level consumption data, we find significant inequality in the distribution of CFs. The top 10% of the EU population with the highest CFs contribute more carbon compared to the 50% of the EU population with the lowest CFs. Only 5% of the EU households live within a CF target of 2.5 tCO2eq/cap, while the top 1% of EU households have CFs of 55 tCO2eq/cap. The households with the highest CFs are by and large the households with the highest levels of income and expenditure. Even more so, we find the contributions of land and air transport to be disproportionally large among the top emitters. As land transport and, even more so, air transport are both highly carbon intensive and highly elastic, we would argue that significantly more needs to be done in these domains. Action here is likely to affect those with the highest footprints, incomes and expenditures most, but impacts on low-income groups are also key, as they have significant expenditure shares on land transport. Finally, we analyse the range in CFs in comparison to levels of social outcomes, pointing to the possibility of mitigating climate change while achieving high well-being. Further attention is needed to limit potential trade-offs between climate change mitigation and socially desirable outcomes. The distributional perspective presented in this study brings to the surface remaining key challenges to meet both environmental and social objectives. Exploring the prerequisites for living well within carbon limits is a key focus of our time.
Supplementary information
The supplementary material for this article can be found at https://doi.org/10.1017/sus.2020.12
The supplementary information includes:
• SI1: More details on the household budget survey data and harmonization procedure.
• SI2: More details on the expenditure distributions.
• SI3: Expenditure elasticities by country, consumption category and expenditure quintile.
• SI4: Carbon footprint distribution, including histograms, carbon concentration (Gini) indices, carbon intensities and footprints by consumption category and region.
• SI5: Verification of carbon footprint estimates.
• Supplementary Spreadsheet: country concordances between HBSs and EXIOBASE sectors and concordance from EXIOBASE sectors to consumption categories.
Acknowledgements
We would like to acknowledge Eurostat as a provider of the HBS data essential for our study and to thank their staff for their great communication and service. We would like to thank Dr Loup Suja-Thauvin for his coding assistance and for always finding a solution. We would also like to thank Dr Kjartan Steen-Olsen for assisting with prior code and routines and Robin Styles for writing assistance. We thank Dr Dominik Wiedenhofer for his valuable feedback on an early draft and Dr Milena Büchs for her assistance with the sample representativeness.
Author contributions
D.I. and R.W. designed the study. D.I. assembled the data and performed the analysis. D.I. and R.W. wrote the manuscript.
Financial support
The study was partially funded by a grant from the Strategic Research Area on Sustainability at the Norwegian University of Science and Technology (NTNU). D.I. received funding from the UK Research and Innovation (UKRI) Energy Programme under the Centre for Research into Energy Demand Solutions (Engineering and Physical Sciences Research Council (EPSRC) award EP/R035288/1).
Conflict of interest
The authors declare no conflict of interest in the submission of this manuscript.
Code availability
Two codes are used in the text: one to generate carbon footprint results (MATLAB) and one to perform the statistical analysis (STATA). Code is available directly from the authors on request.
Data availability
The work uses the EXIOBASE database, which is released as a freely available dataset through www.exiobase.eu. Micro-data from the HBS were acquired through Eurostat. According to the terms of use, we cannot distribute the micro-data and derived intermediate results. The data that support the findings of this study are available from the corresponding author upon reasonable request.




 Open access

