


Impact Statement
This manuscript discusses recent advances in the vortex dynamics in the left ventricle and its role in heart disease progression and early diagnosis. The vortex formation index has been formulated in the past and this can be useful for the early diagnosis of flow pattern changes and better treatment management. The change in flow patterns due to structural change in the left ventricle has been critically analysed by discussing hemodynamics in healthy and dilated cardiomyopathy models. Challenges, opportunities and future directions for left ventricle hemodynamics have been discussed.
1. Introduction
Cardiovascular diseases (CVDs) are a leading cause of death globally. According to the World Health Organization (WHO), CVDs account for approximately 31 % of all deaths worldwide. Heart attacks are the major cause of death in CVDs, which account for 25 % of deaths to total deaths. Disabilities due to CVDs can have a significant impact on individuals and communities, and definitely lead to decreased quality of life and increased healthcare costs. Understanding the global burden of heart diseases and their risk factors is crucial for developing effective prevention and treatment strategies.
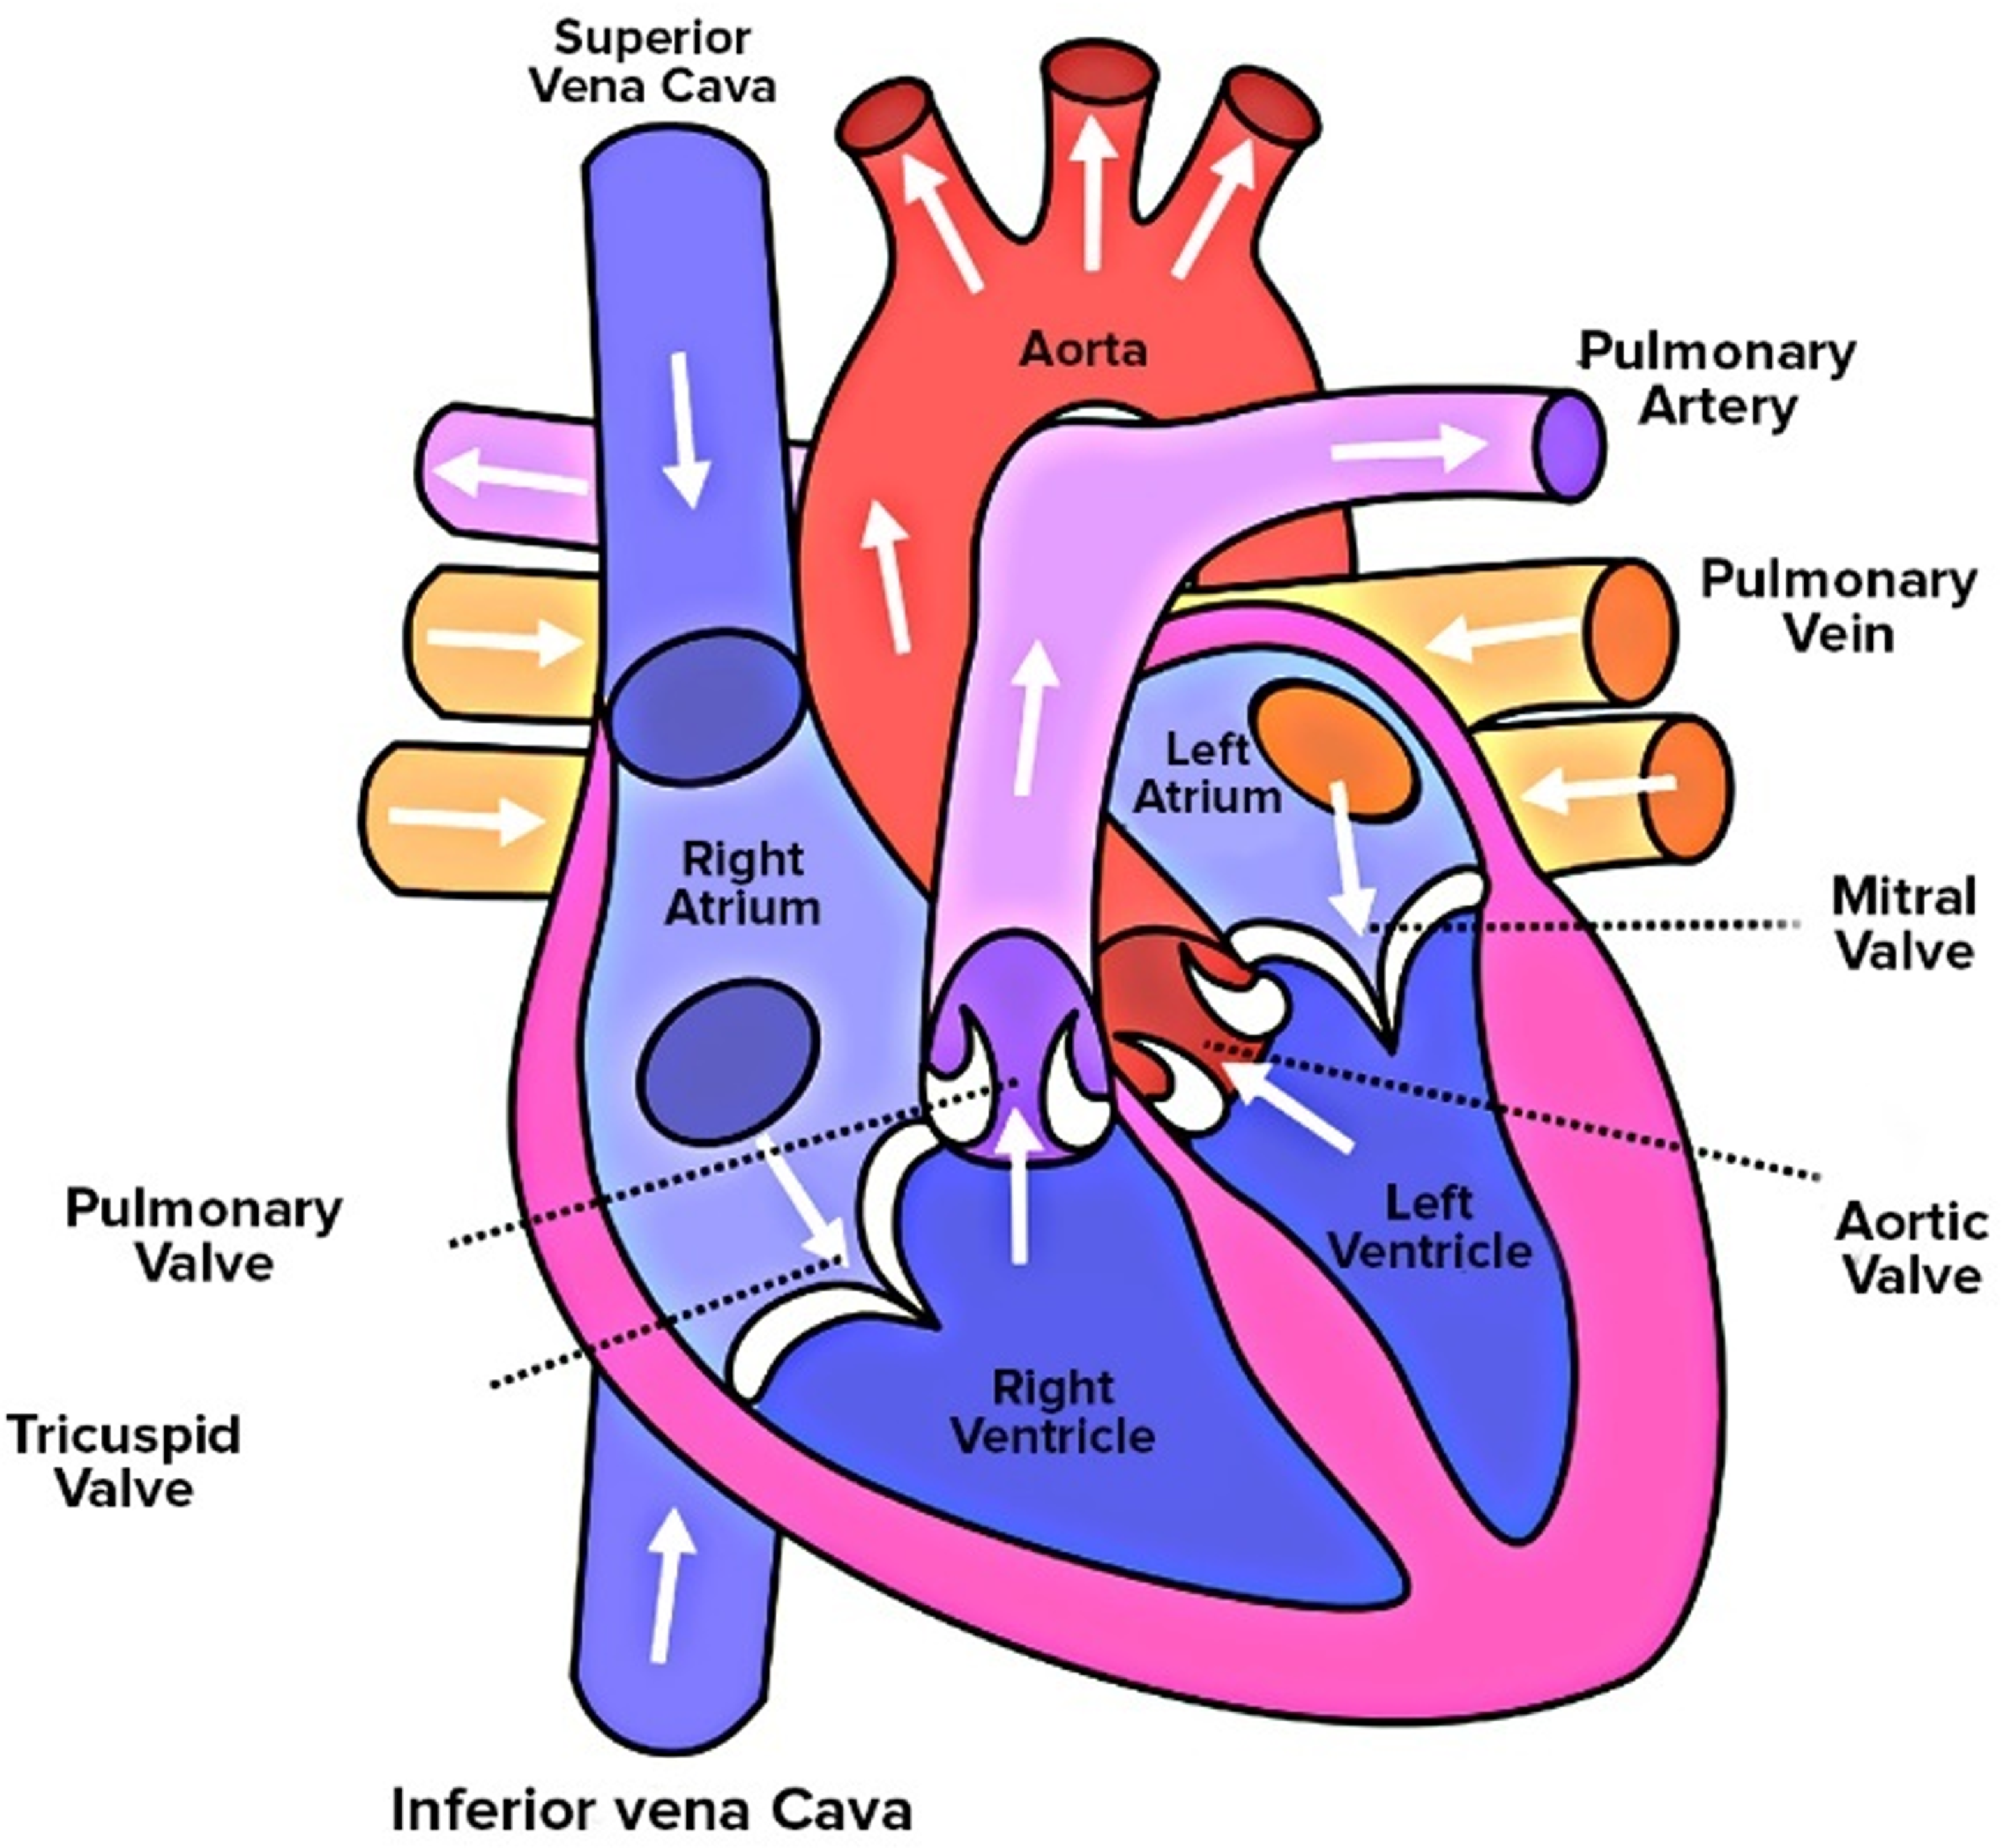
The human heart consists of four chambers, a pair of atriums and ventricles, as shown in Figure 1. Atria are used for collecting blood whereas ventricles are used for pumping blood. The right atrium collects the deoxygenated blood from various organs and the left atrium collects oxygenated blood from the lungs via pulmonary veins. The right ventricle pumps the blood to the lungs for oxygenation and the left pumps the oxygenated blood to the rest of the body. The left ventricle (LV) plays a crucial role in the functioning of the heart, being responsible for supplying blood to all the tissues throughout the body. The LV collects the oxygenated blood from the left atrium during diastolic filling and ejects the blood during systole. The vortex patterns during diastolic filling differentiate between normal and abnormal LV flow dynamics. Asymmetric and smooth vortex formation in the LV is considered a healthy means of blood transport. However, the presence of an unnatural vortex in the LV is often associated with cardiac diseases. One of the very common LV diseases is dilated cardiomyopathy (DCM), which is a condition in which the LV chamber becomes enlarged, with thinner and weaker walls, which corresponds to decreased cardiac function (Grossman et al., Reference Grossman, McLaurin, Moos, Stefadouros and Young1974; Jefferies and Towbin, Reference Jefferies and Towbin2010). Due to changes in the anatomy of the LV, the flow and vortex patterns change. It has been observed that DCM patients have less ordered blood flow patterns with decreased vortex strength, a decrease in flow propagation velocity and more stagnation at the apex of LV (Baccani et al., Reference Baccani, Domenichini, Pedrizzetti and Tonti2002b; Loerakker et al., Reference Loerakker, Cox, van Heijst, de Mol and van de Vosse2008). Changes in blood flow patterns have been analysed using computational fluid dynamics (CFD), by investigating various flow and vortex indices.
Schematic of the human heart consisting of four chambers: right atrium, left atrium, right ventricle and LV. Heart valves controlling blood flow between chambers are shown in the whole heart model. Schematic is reused under GNU free documentation licence from the Free Software Foundation (Human Heart, 2023).
Vortex patterns in the LV are crucial for efficient blood transport and have been studied extensively in CVD. Past studies have shown that abnormal flow patterns due to vortex breakdowns can lead to energy dissipation and increased stagnation zones (Pedrizzetti et al., Reference Pedrizzetti, La, Alfieri and Tonti2014). An increase in stagnation zones leads to clot formation and a decrease in ejection fraction increases the in-turn risk for heart failure (Pedrizzetti and Domenichini, Reference Pedrizzetti and Domenichini2005, Reference Pedrizzetti and Domenichini2015; Pedrizzetti and Sengupta, Reference Pedrizzetti and Sengupta2015). The vortex in a healthy LV is asymmetric and non-planar, which avoids eddy formation by recirculating and propagating them towards the outlet without colliding with each other. The asymmetric doughnut-shaped vortex ring formation occurs during diastolic filling at the end of the E-wave and A-wave (M Elbaz et al., Reference Elbaz, Calkoen, Westenberg, Lelieveldt, Roest and Van Der Geest2014; Töger et al., Reference Töger, Kanski, Carlsson, Kovács, Söderlind, Arheden and Heiberg2012). An index has been formulated to characterise the vortex ring formation quantitatively and its propagation: the vortex formation number (VFN). The VFN measures the length-to-diameter ratio of the ejected fluid, which is directly proportional to ejection velocity and inversely proportional to orifice opening. A VFN between 3 and 5 has been considered optimal, whereas values beyond 5 lead to instability and excessive energy dissipation (Gharib et al., Reference Gharib, Rambod, Kheradvar, Sahn and Dabiri2006). Recently, the vortex in the LV has been used as an early predictor of cardiovascular outcomes. It is believed that abnormal flow patterns in the LV could signal the presence of heart malfunction even before noticeable structural changes are evident (Pedrizzetti et al., Reference Pedrizzetti, La, Alfieri and Tonti2014). In contrast, utilisation of the VFN as a marker for cardiac function has been argued experimentally and it has been proposed that the VFN is not an index of cardiac function and it should not be used as an index (Pasipoularides et al., Reference Pasipoularides, Vlachos and Little2015; Stewart et al., Reference Stewart, Charonko, Niebel, Little and Vlachos2012). However, few clinical studies have shown the use of the vortex formation time as an indicator of cardiac function, but they have pointed out the discrepancies in heart failure with preserved ejection fraction and sphericity of the LV (Martínez-Legazpi et al., Reference Martínez-Legazpi, Bermejo, Benito, Yotti, Pérez del Villar, González-Mansilla, Barrio, Villacorta, Sánchez, Fernández-Avilés and del Álamo2014; Poh et al., Reference Poh, Lee, Shen, Chong, Tan, Chai, Yeo and Wood2012).
Numerical studies have become an essential tool in understanding the hemodynamics and vortex patterns of the LV over the last couple of decades. Computational fluid dynamics has been used to study the blood flow patterns in the LV, providing insights into the vortex dynamics in both healthy and diseased hearts (Chan et al., Reference Chan, Lim, Chee and Abu Osman2013b; Doost et al., Reference Doost, Ghista, Su, Zhong and Morsi2016a). The CFD studies were started with two-dimensional models of the LV and analysed the formation of the vortex in a healthy and a diseased LV and found that the flow wave propagation velocity reduced in a dilated LV (Reference Baccani, Domenichini, Pedrizzetti and Tonti2002b, Baccani et al., Reference Baccani, Domenichini and Pedrizzetti2002a; Chan et al., Reference Chan, Lim, Ong and Abu Osman2013c; Loerakker et al., Reference Loerakker, Cox, van Heijst, de Mol and van de Vosse2008; Pierrakos and Vlachos, Reference Pierrakos and Vlachos2006; Vierendeels et al., Reference Vierendeels, Riemslagh, Dick and Verdonck2000). Further, numerical simulation of three-dimensional ideal healthy LV models found asymmetric vortex generation (Schenkel et al., Reference Schenkel, Malve, Reik, Markl, Jung and Oertel2009). Recently, high-resolution imaging techniques such as MRI have been combined with CFD to obtain detailed flow characteristics and improve our understanding of the complex hemodynamics in the LV (Khalafvand et al., Reference Khalafvand, Hung, Ng and Zhong2015; Labbio and Kadem Reference Di Labbio and Kadem2018). Past studies investigated that the effect of inlet waveform specified at pulmonary veins does not affect flow patterns in patient-specific LV and stagnation zones at the apex of the LV are prone to thrombi formation (Lantz et al., Reference Lantz, Gupta, Henriksson, Karlsson, Persson, Carlhäll and Ebbers2019; Liao et al., Reference Liao, Simpson, Neidlin, Kaufmann, Li, Woodruff and Gregory2016). Most of the studies have the major limitation of considering the walls of the LV as rigid, which is not close to the in vivo situation. Realistic studies have modelled the contraction and expansion of the LV using a moving mesh approach. Consideration of moving walls improves the accuracy of the vortex pattern prediction and the hemodynamics in the LV (Chan et al., Reference Chan, Abu Osman, Lim, Chee, Abdul Aziz, Abed, Lovell, Dokos and Bauer2013a, Reference Chan, Ahmad Bakir, Al Abed, Dokos, Leong, Ooi, Lim and Lim2019; Cheng et al., Reference Cheng, Oertel and Schenkel2005; Vedula et al., Reference Vedula, Fortini, Seo, Querzoli and Mittal2014). Recently published articles considered the coupling of mitral valve (MV) movement with LV hemodynamics and found that it helps in risk stratification and optimisation of heart therapies (Gao et al., Reference Gao, Feng, Qi, Berry, Griffith and Luo2017).
Despite the complexity of cardiac flows, this review will focus on showing an extensive review of the formation of the vortex. It should be acknowledged that factors such as mitral and aortic valve modelling, patient conditions and disease alterations influence the flow. However, we will specifically examine the literature on the vortical patterns in these flows, setting aside other phenomena beyond the scope of this paper.
This review, which includes over 125 references, summarises significant advances from the last two decades in the fundamentals of cardiac flows from a numerical perspective. It also compares these with experimental or medical data. The selected publications provide a comprehensive overview of the current technology for studying cardiac flows, offering new insights into the flow physics of healthy and diseased hearts. Additionally, this review highlights the need for validating optimal and abnormal vortex patterns using extensive datasets of experimental data and clinical observations. The review also considers the potential of data-driven methods, including machine learning, for identifying abnormal vortex patterns as markers for heart function monitoring. Trained machine learning models could become invaluable for assessing early outcomes of heart valve surgeries and indicating the success of various heart procedures. This opens new discussions on the condition selection necessary for accurate CFD simulations of the LV.
2. Vortex dynamics in the left ventricle
The filling of blood in the LV occurs due to the MV opening and the flowing of blood into the LV through the small MV orifice. The MV consists of two triangular cusps of unequal size; they are stronger in mechanical strength than tricuspid valves. The expansion of the LV during early diastolic flow (during the E-wave) creates a reduced pressure in the LV, which generates a gradient for blood flow from mitral leaflets (high pressure) to the LV apex (low pressure). Decreased pressure thus generated in the LV chamber induces the mitral cusps to open. Blood filling from the left atrium is observed while low pressure exists in the LV. Atrium contraction also contributes to LV filling, which is called A-wave filling. The blood flow through a healthy MV is generally laminar: this promotes a normal asymmetric vortex formation in the LV, as shown in Figure 2(a). The smooth transfer of blood is observed during the systolic phase in a healthy heart.
(a) Schematic of blood transport during filling and ejection of blood through a healthy LV, dark grey: old blood, and light grey: new blood. Adapted with permission from a previous numerical study (Di Labbio et al., Reference Di Labbio, Thiffeault and Kadem2022). (b) Blood flows (thick red arrow) into the LV through the MV. At the trailing edge of the MV, blood develops two shear layers of different velocities. The boundary layer separation leads to an adverse pressure gradient and the blood stream rolls up into a vortex.
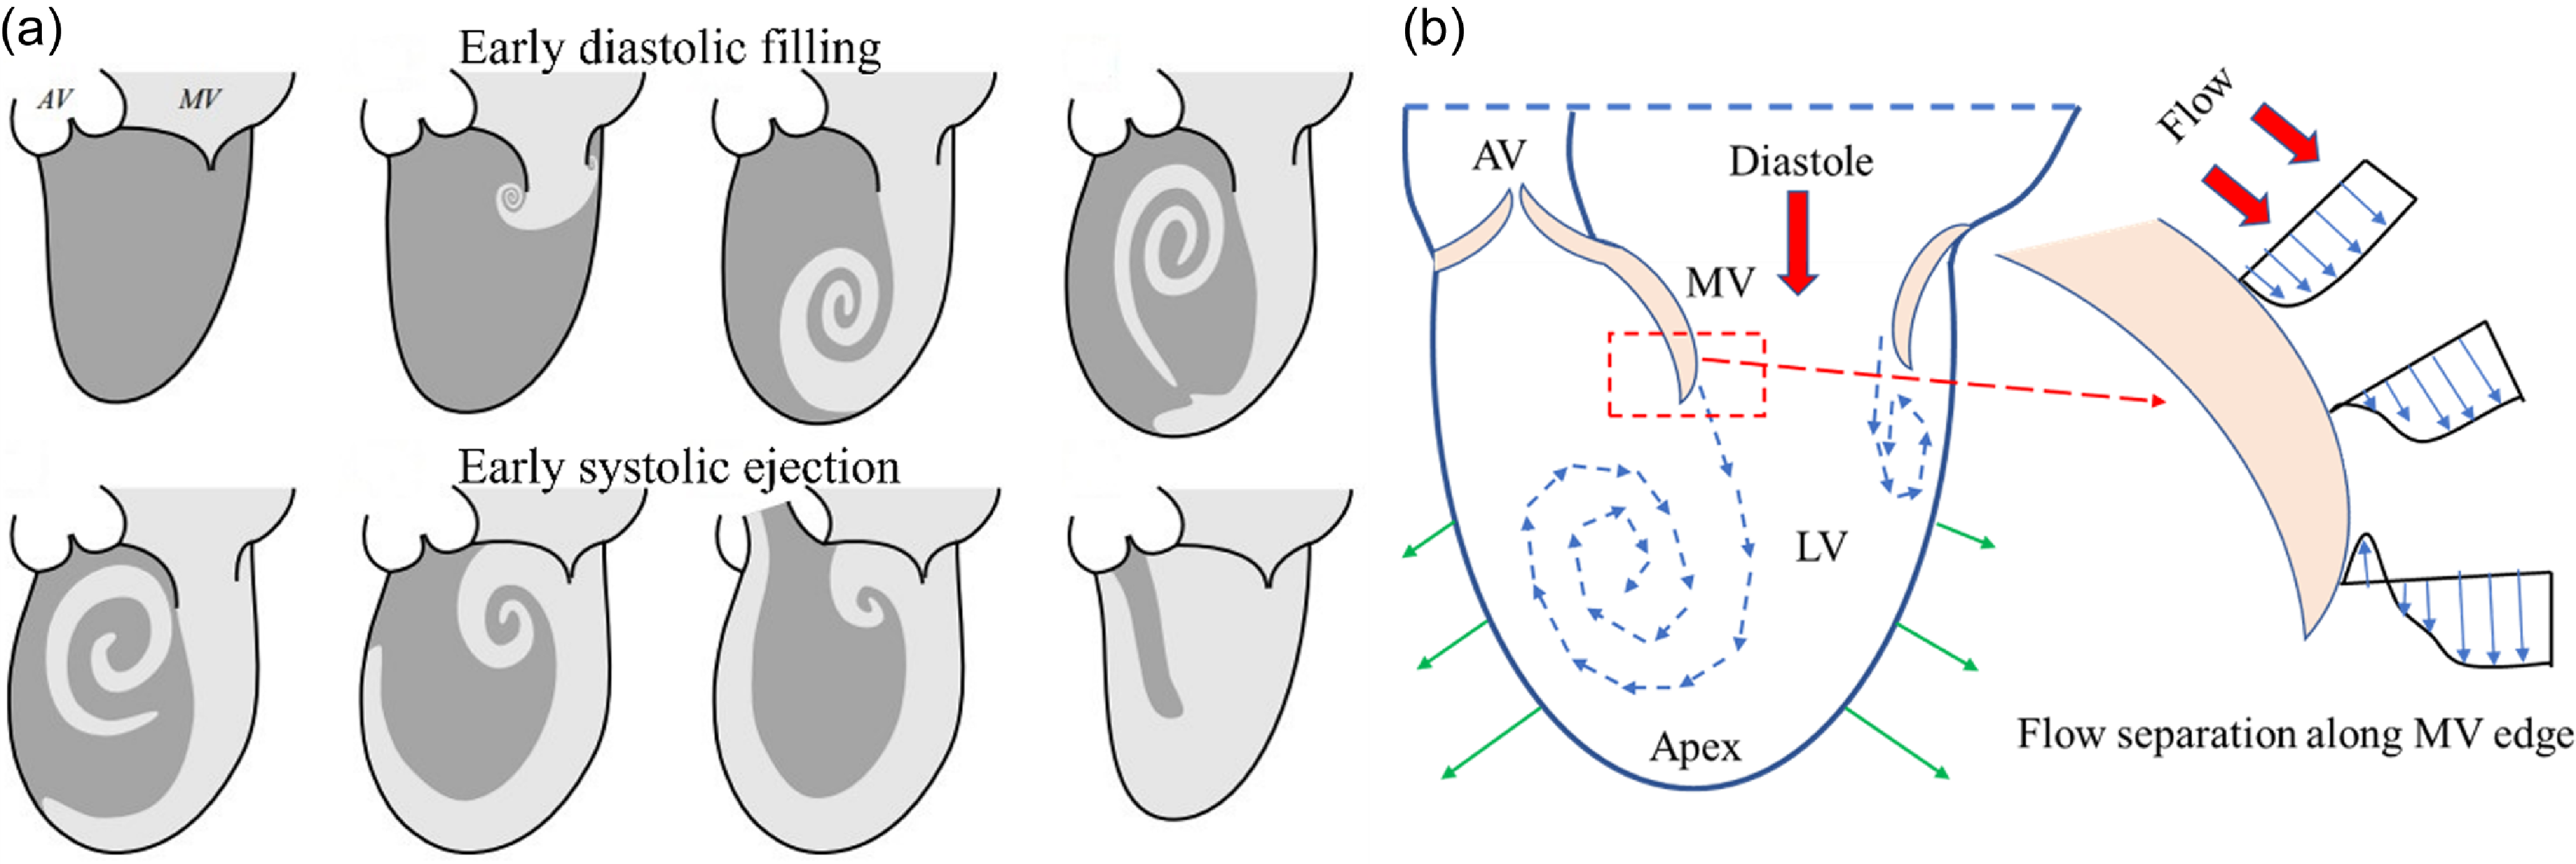
The boundary layer separation of the MV leaflet’s trailing edge and the subsequent development of shear layers is the triggering point of vortex formation. During blood flow through the MV, blood develops shear layers of increasing velocity away from the valve edge, as shown in Figure 2(b). The velocity of the blood layer close to the valve edge is almost zero and away from the valve edge shows a higher velocity. Due to the curvature of the MV edges, flow separation occurs, and due to the gradient in velocity shear layers, the bending of the streamlines induces a rolling motion of the blood, and the subsequent formation of a vortex on both sides of the MV. During the roll-up process, the distance between adjacent vortex turns reduces and the vortex cone forms a conical-like flow trajectory. The base of a cone can be referred to as the initial vortex size, whereas the tapered end of the cone is considered as the end of the vortex helical path. The vortex formation in the LV is a smoother (in contrast to chaotic or turbulent flow) phenomenon due to a confined and limited expansion of the LV, which restricts the vortex size from growing. The formation of a vortex stores the incoming translational kinetic energy into a rotary motion. Ill-functioning LVs show abnormal vortex formation flows and these may lead to turbulence and excessive energy dissipation. It has been reported that malfunctioning of the heart typically results in changes in the vortex dynamics or the size and number of vortices.
The vortex formed in a healthy LV is asymmetric: these asymmetries have been proven beneficial for the smooth transfer of blood from the MV toward the LV base. The formed vortex decays at the end of the diastole and a difference in decay rate was observed for normal and abnormal filling (Brindise et al., Reference Brindise, Meyers and Vlachos2020). This asymmetric shape is due to the unbalanced shape of the MV, since the anterior leaflet (Figure 2b left cusp of the MV) is larger than the posterior leaflet (right cusp of the MV). Also, the area available for flow and fluid wall interaction is different for the leaflets. The posterior leaflet has a free edge and more area to flow while the anterior leaflet finds the LV wall adjacent to the MV leaflet. The generated primary and secondary vortex rings at the MV propagate into the LV until they get pinched off from the flowing jet at the end of the E-wave (primary vortex ring) and A-wave (secondary vortex ring) during the diastolic phase. The vortex can be visualised as the doughnut-shaped ring in Figure 3. The asymmetry in the vortex size is also reflected in the vortex ring thickness. The ring thickness is lower on the posterior side than on the anterior. The ring thickness depends on leaflet lengths and non-homogeneous pressure gradient in the LV. The vortex ring rotates while propagating towards the LV apex. Moreover, the ring-shaped vortex changes its axis of rotation by ninety degrees and efficiently aligns itself in the flow direction towards the aorta. A lower thickness ring shifts towards the LV apex by rotation and can be an efficient means of momentum transfer, as shown in Figure 3 (Kheradvar et al., Reference Kheradvar, Assadi, Falahatpisheh and Sengupta2012).
Vortex formation in the healthy LV and the vortex ring pinch-off and rotation during a cardiac cycle. Adapted with permission from a previously published article (Kheradvar et al., Reference Kheradvar, Assadi, Falahatpisheh and Sengupta2012).
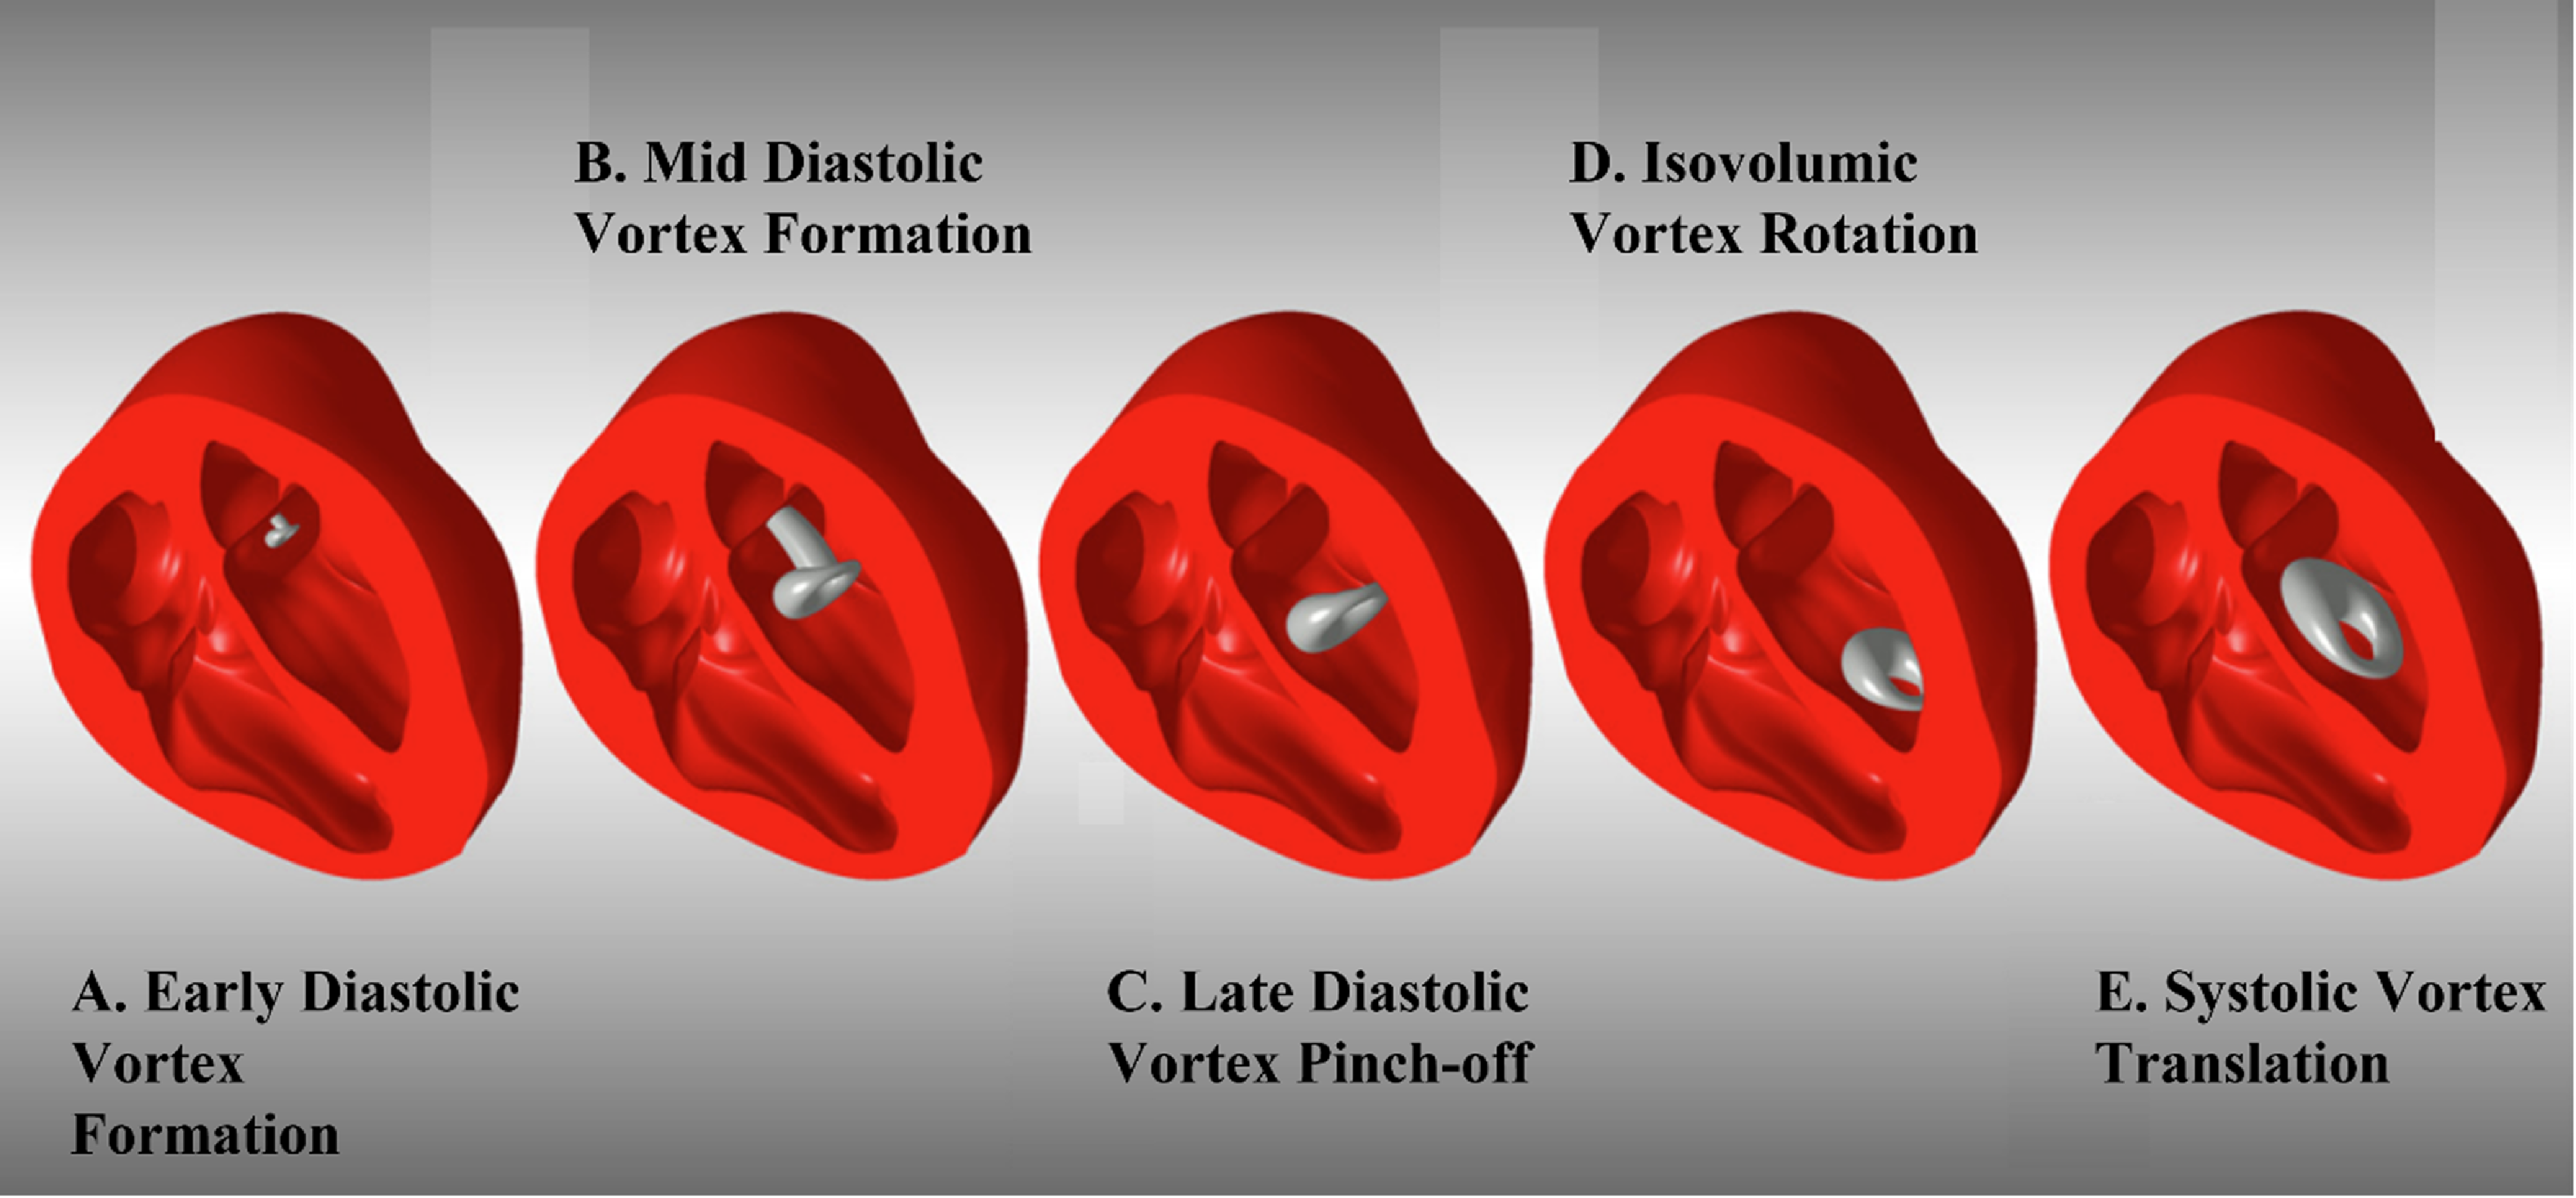
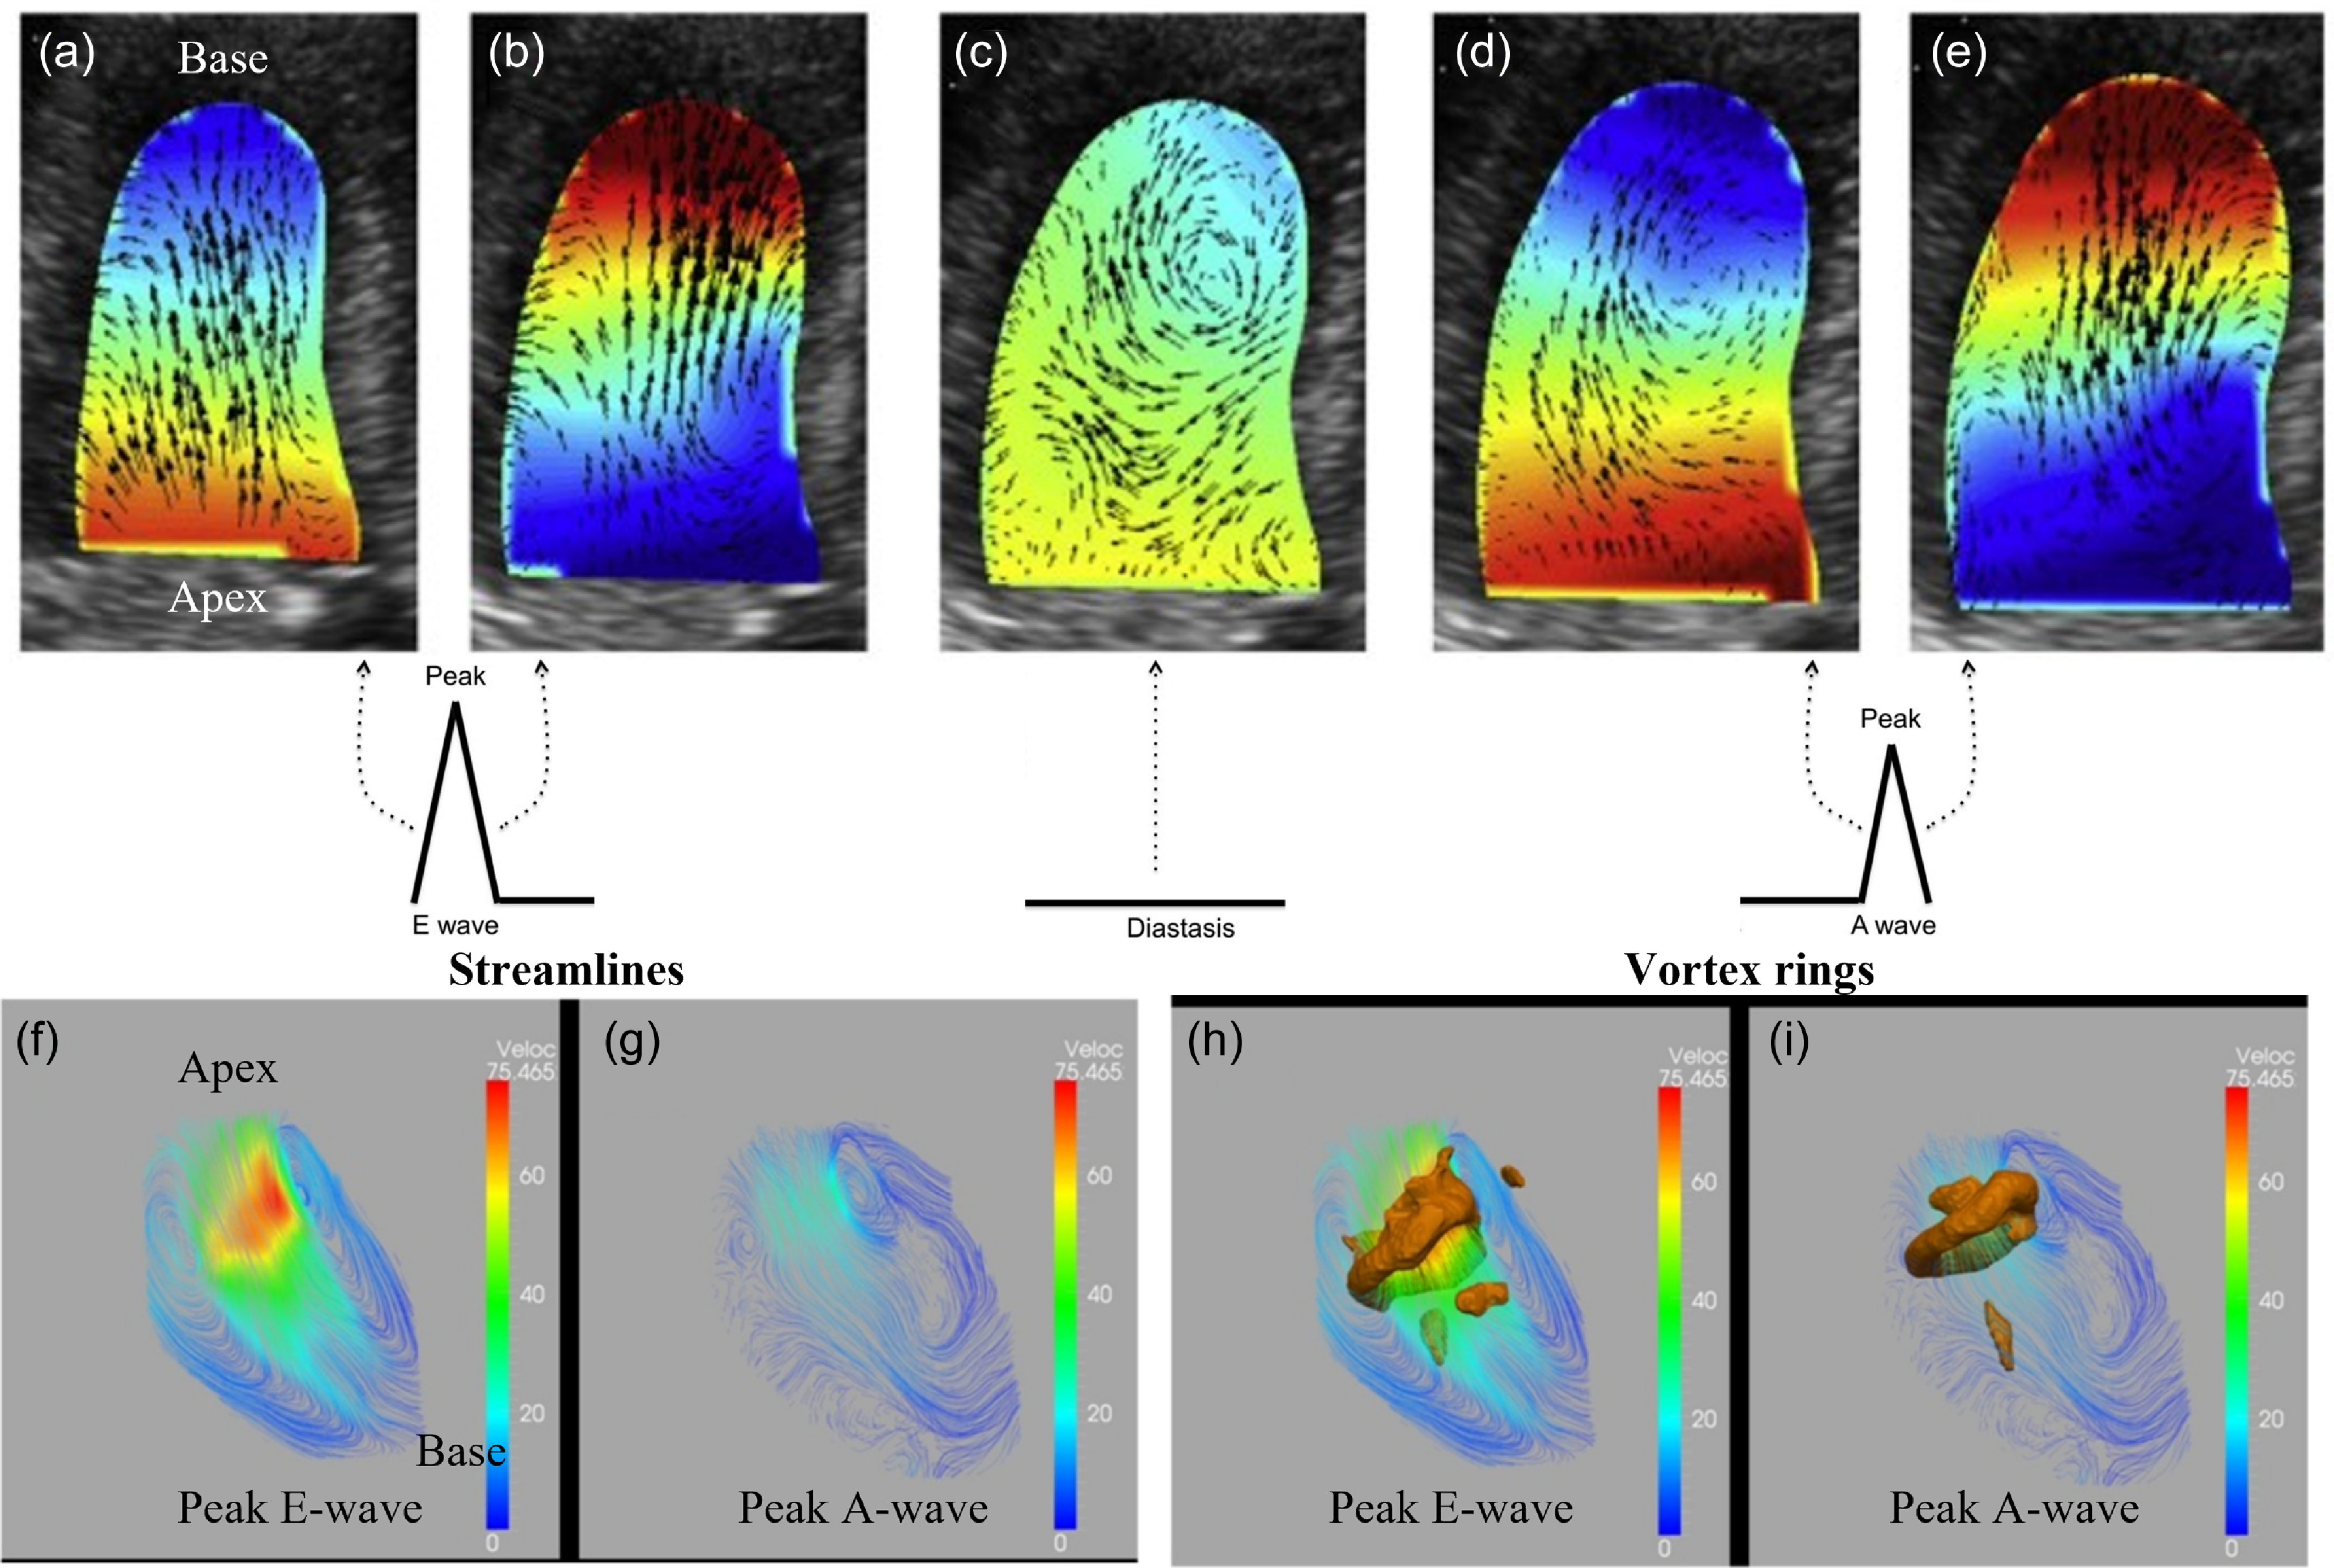
Figure 4(a–e) shows the intraventricular pressure distribution during LV filling in a healthy subject. Before the E-wave peak, the pressure gradient points from the MV orifice towards the apex and the flow is driven in the same direction. The generation of a lower pressure zone at the apex is the result due to LV expansion. After the peak velocity has been attained, the pressure distribution reverses until the apical pressure exceeds that of the base. This pressure gradient directs the flow towards the middle cavity of the LV. During diastasis, the pressure gradient does not significantly vary in the LV cavity. Again, the pressure gradient from base to apex is generated due to the contraction of the atrial chamber before the A-wave peak. Finally, the contraction of the LV results in a pressure gradient from the apex to the LV outlet, and blood smoothly transfers towards the aorta in the form of stable, orderly converging vortices. Similarly, figure 4(f–i) shows the velocity streamlines and vortex ring formation during peak E-wave and A-wave. The formation of primary and secondary vortex rings is clearly seen during the E and A waves, respectively.
Intraventricular pressure distribution in the LV during the diastolic filling phase in a healthy subject. (a) Pressure gradient increases from base to apex and flow accelerates accordingly during early diastole before E-wave peak; (b) pressure gradient is directed from apex to base and inflow decelerates during end of E-wave; (c) no significant pressure gradient occurs during diastasis; (d) pressure gradient increases from base to apex and flow accelerates accordingly during beginning of atrial systole before A-wave peak; (e) pressure gradient is directed from apex to base and accelerating flow towards LV outlet by smooth vortex rotation. Blue: lower, and red: higher values. Streamlines at (f) peak E-wave, (g) peak A-wave, vortex rings (lambda 2 criteria) at (h) peak E-wave, (i) peak A-wave. Adapted with permission from a previously published article (M Elbaz et al., Reference Elbaz, Calkoen, Westenberg, Lelieveldt, Roest and Van Der Geest2014; Mele et al., Reference Mele, Smarrazzo, Pedrizzetti, Capasso, Pepe, Severino, Luisi, Maglione and Ferrari2018).
Recall that LV dysfunction and abnormal vortex patterns are strongly connected. The difference between efficient and inefficient LV ejection can be understood and even quantified more easily by introducing several vortex formation indices. The VFN defines the optimal range of blood transport, between 3.5 and 5.5. It can be expressed as given in equation 1
 \begin{align} VFN={\frac{\overline{U}}{\overline{D}}}. T, \end{align}
where $\overline{U}$
is the time-average velocity of the bloodstream coming out from MV,
$\overline{U}$
is the time-average velocity of the bloodstream coming out from MV, $\overline{D}$
is the time-average mitral orifice diameter and T is the duration of the diastolic filling during the E-wave.
$\overline{D}$
is the time-average mitral orifice diameter and T is the duration of the diastolic filling during the E-wave.
The VFN range between 3.5 and 5.5 has been observed as an efficient means of fluid transport. Indeed, all biological propulsions observed in nature are shown a VFN between 3.5 and 5.5 (Dabiri, Reference Dabiri2009). If the range goes beyond 5.5 the vortices are formed as a trailing jet, which is inefficient (Gharib et al., Reference Gharib, Rambod and Shariff1998). The fluid transport by vortices is more efficient than by a steady jet or trailing jet (Krueger and Gharib, Reference Krueger and Gharib2003; Xiang et al., Reference Xiang, Qin and Liu2018). The vortex ring will continue to grow until VFN reaches 4. For VFNs greater than 4, vortex instability results, which in turn prevents vortex growth on the grounds of energetic constraints: this leads to the trailing jet regime (Dabiri and Gharib, Reference Dabiri and Gharib2004; Gharib et al., Reference Gharib, Rambod and Shariff1998). A single vortex ring is formed when the VFN is less than or within the optimal range. For example, mitral stenosis reduces the area available to flow and increases the bloodstream velocity, which leads to an increase in the VFN beyond the optimal range. In contrast, a dilated LV decreases the VFN to below 3.5, leading to abnormal diastolic LV filling. The ejection fraction (EF) can be expressed in terms of the VFN as in equation 2. Recently, it has been observed that dilated LV shows lower washout rates in comparison with normal ones (Goubergrits et al., Reference Goubergrits, Vellguth, Obermeier, Schlief, Tautz, Bruening, Lamecker, Szengel, Nemchyna, Knosalla, Kuehne and Solowjowa2022; Obermeier et al., Reference Obermeier, Vellguth, Schlief, Tautz, Bruening, Knosalla, Kuehne, Solowjowa and Goubergrits2022). The increased stagnation zones were observed in dilated LVs and these contribute to blood clot formation
 \begin{align}VFN=\frac{4(1-\beta )}{\pi }\cdot \alpha ^{3}\cdot EF,\end{align}
where β is the fraction of stroke volume in the LV obtained from the left atrium (LA) and can be expressed as equation 3
 \begin{align}\beta = \frac{V_{A}}{EDV}=\frac{VTI_{A}\times \frac{\pi }{4}D_{E}^{2}}{EDV},\end{align}
where V A is the blood volume that entered the LV during atrial contraction, EDV is the LV end-diastolic volume, VTI A is the velocity–time integral of the A-wave and D E is the effective diameter of the mitral orifice area.
The variable α is a purely geometric parameter of the LV, defined by
 \begin{align}\alpha =\frac{EDV^{\frac{1}{3}}}{\overline{D}},\end{align}
where EDV is the LV end-diastolic volume and $\overline{D}$
is the time-averaged MV diameter defined in Equation 1.
$\overline{D}$
is the time-averaged MV diameter defined in Equation 1.
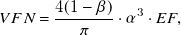
A comparison of intraventricular flow fields in healthy and DCM patients shows significant differences in velocity profiles, and three-dimensional flow fields, as shown in Figure 5 (Mangual et al., Reference Mangual, Kraigher-krainer, De, Toncelli, Shah, Solomon, Galanti, Domenichini and Pedrizzetti2013). They have performed the simulation for one cardiac cycle on three-dimensional echocardiographic LV data acquired at a frame rate of 20–30 Hz. They were simulated using the immersed boundary method, and the Eulerian–Lagrangian approach was used to model wall movement and fluid flow. In this approach, the LV model is immersed inside the computational domain and inflow/outflow velocity profiles are automatically ensured by mass conservation from the system of equations. The flow patterns are shown at the end of the E-wave and A-wave diastolic phases, providing an important understanding of flow patterns in healthy and DCM patients. In the healthy LV, anticlockwise rotation of the vortex dominates the central cavity of the LV. However, diseased (DCM) LVs show a more complex vortex pattern in the middle of the LV (Figure 5: bottom). The three-dimensional flow structures visualised by the velocity gradient tensor (λ 2) criterion differentiate that the vortex is more stretched towards the apex in the healthy case as compared with a more compact vortex in a DCM patient. The vortical circulation is restricted to the central cavity in DCM patients, while it is well distributed in healthy subjects. The vortex strength is higher in healthy cases as compared with DCM patients, as shown in Figure 5. The vortex core is very compact and limited to the central LV cavity for DCM patients.
Numerical simulations for diastolic intraventricular flow at the end of (a) E-wave and (b) A-wave for a healthy (top) and DCM patient (bottom). Comparison of flow structure for healthy and DCM patient – left: velocity vectors at the midplane of LV; middle: three-dimensional vortex fields by iso-surface of λ 2) criteria. Adapted with permission from previously published numerical simulations (Mangual et al., Reference Mangual, Kraigher-krainer, De, Toncelli, Shah, Solomon, Galanti, Domenichini and Pedrizzetti2013).
Notes: AO: Aortic valve, MO: Mitral valve.
Note also that the presence of stagnation regions in a diseased case is prone to thrombus formation and leads to dangerous situations. A thrombus may propagate through the arteries and cut off blood supply in narrower arteries leading to further complications. A well-distributed blood flow throughout the LV indicates a healthy flow pattern.
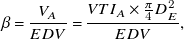
Various studies simulated healthy and diseased LV models and compared vortex patterns to understand the changes in the vortex dynamics. Patient-specific LV models have been simulated by considering resistance and compliance/flexibility of arteries. Healthy and DCM LV models have been simulated and compared with the vortex patterns before and after surgery of DCM LV models, as shown in Figure 6 (Doenst et al., Reference Doenst, Spiegel, Reik, Markl, Hennig, Nitzsche, Beyersdorf and Oertel2009). In a healthy LV, the asymmetric vortex is formed just after the MV opening, which was shown by CFD (Figure 6). The asymmetry might help to minimise the dissipative interaction between inflow, vortical structures and outflow (Kilner et al., Reference Kilner, Yang, Wilkest, Mohladdlin, Firmin and Yacoub2000). The vortex ring is pinched off and rotated in a clockwise direction to redirect the flow toward the aorta. In the dilated LV (pre-operative case), dilation at the apex of LV deforms the vortex towards dilated regions which causes momentum loss during diastole. Similar flow structures were observed during systole for healthy and DCM cases. After the removal of the dilated region at the LV apex, the vortex deformation was reduced and blood flowed more efficiently toward the aorta with lower dissipation or losses.
Karlsruhe heart model simulations showing a comparison of vortex patterns in DCM models (pre-operative and post-operative) as opposed to a healthy model. Adapted with permission from previously published numerical simulations (Doenst et al., Reference Doenst, Spiegel, Reik, Markl, Hennig, Nitzsche, Beyersdorf and Oertel2009).
As we have discussed so far there has been a systematic effort to study the vortex dynamics in the LV and its linkage to disease progression; also, a vortex formation index has been proposed. Table 1 shows the models, methods used and limitations for various LV numerical studies, Table 2 shows the experimental (in vivo and in vitro) methods and imaging techniques used in past studies with major outcomes, and Table 3 presents the relevant numerical studies and their outcomes on the whole heart and LV hemodynamics. However, this approach has not yet gained acceptance in clinical practice, since CFD modelling presents several limitations for various LV numerical studies, and more consistency in CFD outputs in various studies is desired to gain confidence for clinical practice. Consistency in results can be achieved by sharing models and methodology used in open-source platforms so that other researchers can utilise and replicate the results.
Vortex dynamics studies using numerical methods in either the whole heart or LV models
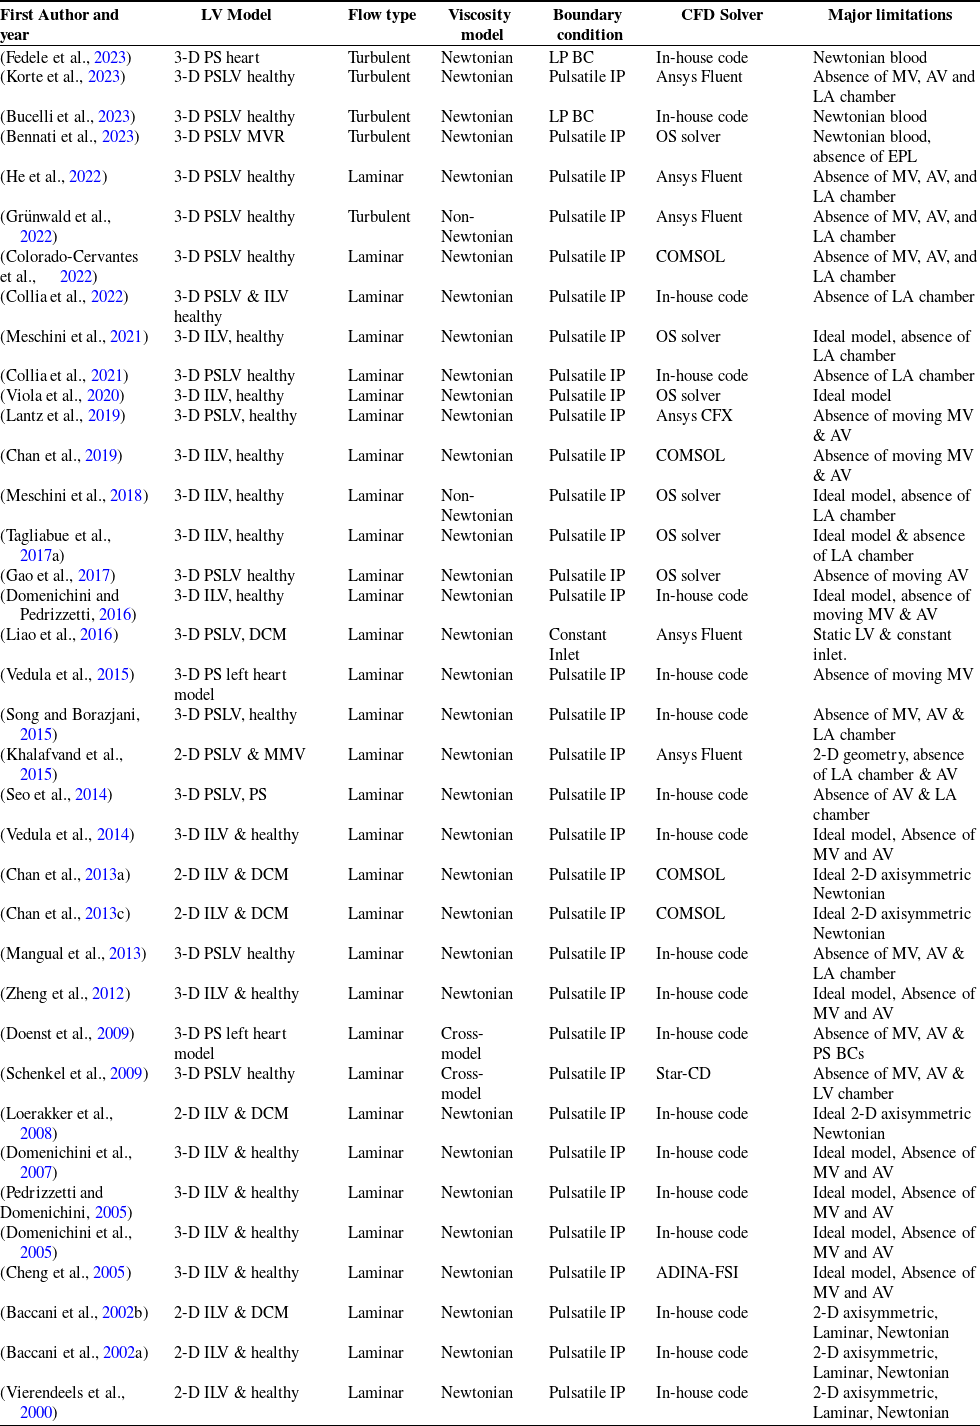
Notes: IP = inlet profile; DCM =dilated cardiomyopathy; ILV = ideal left ventricle; PSLV = patient-specific left ventricle; MV = mitral valve; AV = Aortic valve; PS = Patient-specific; BC = boundary condition; MMV = moving mitral valve; OS = open source; MVR = mitral valve regurgitation; EPL = electrophysiology; Ansys Fluent, (ANSYS, 2022) COMSOL (COMSOL, 2018).
Vortex dynamics studies using experimental techniques in the LV models
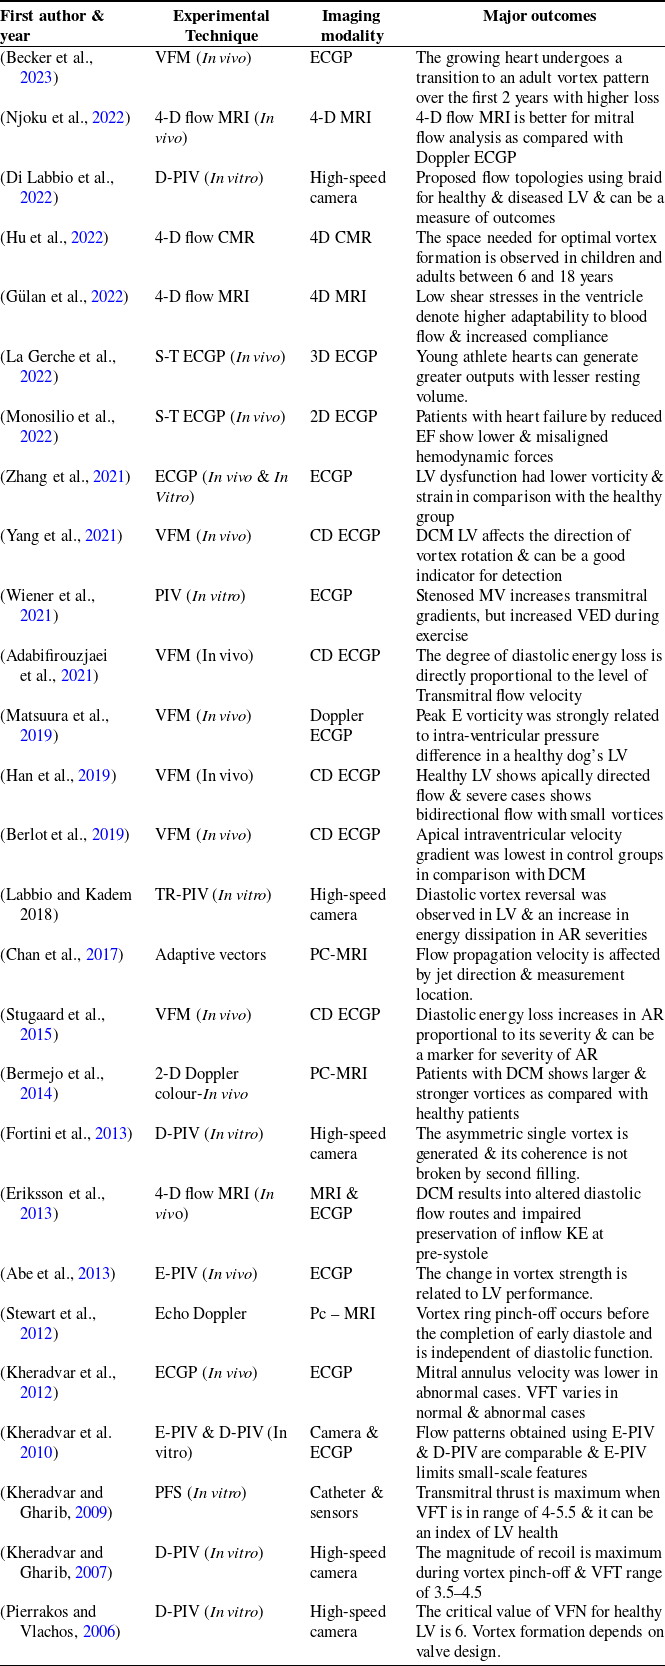
Notes: D-PIV = particle image velocimetry; E-PIV = Electrographic particle image velocimetry,; TR = time-resolved; CD = colour Doppler; S-T = speckle-tracking; ECGP = echocardiography; pc-MRI = phase-contrast MRI; MRI = magnetic resonance imaging; VFM = vector flow mapping; PFS = pulse flow simulator; VFN = vortex formation number; VFT = vortex formation time; AR = aortic regurgitation; VED = viscous energy dissipation; EF = ejection fraction; CMR = cardiovascular magnetic resonance.
Major contributions from recent CFD studies to vortex dynamics in patient-based whole heart or LV models and important outcomes
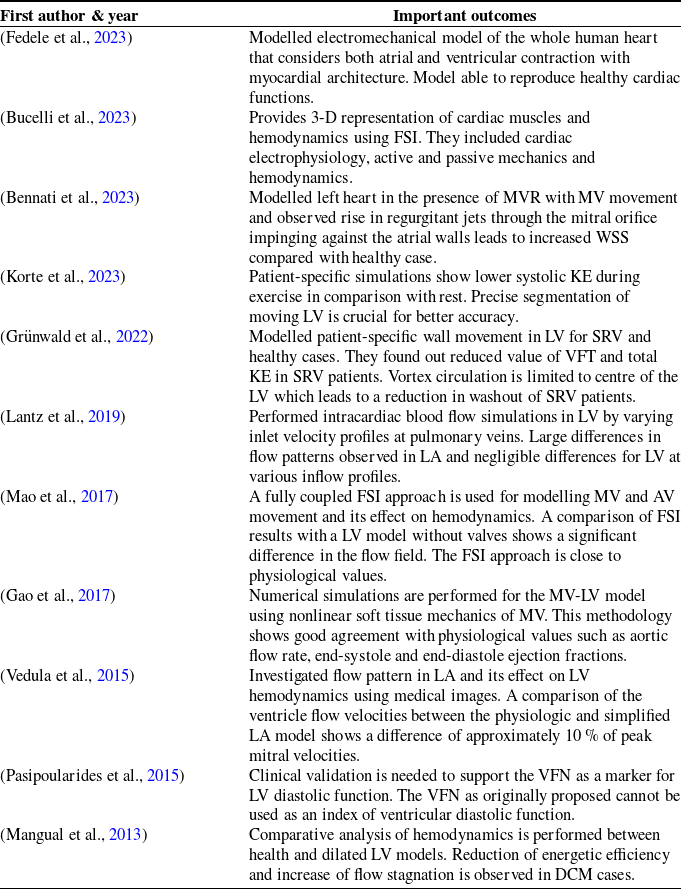
Notes: FSI = fluid-structure interaction; MVR = mitral valve regurgitation; WSS = wall shear stress; KE = kinetic energy; LV = left ventricle; SRV = single right ventricle; VFT = vortex formation time; AV = aortic valve; MV = mitral valve.
3. Challenges and opportunities in CFD modelling of the patient-specific left ventricle
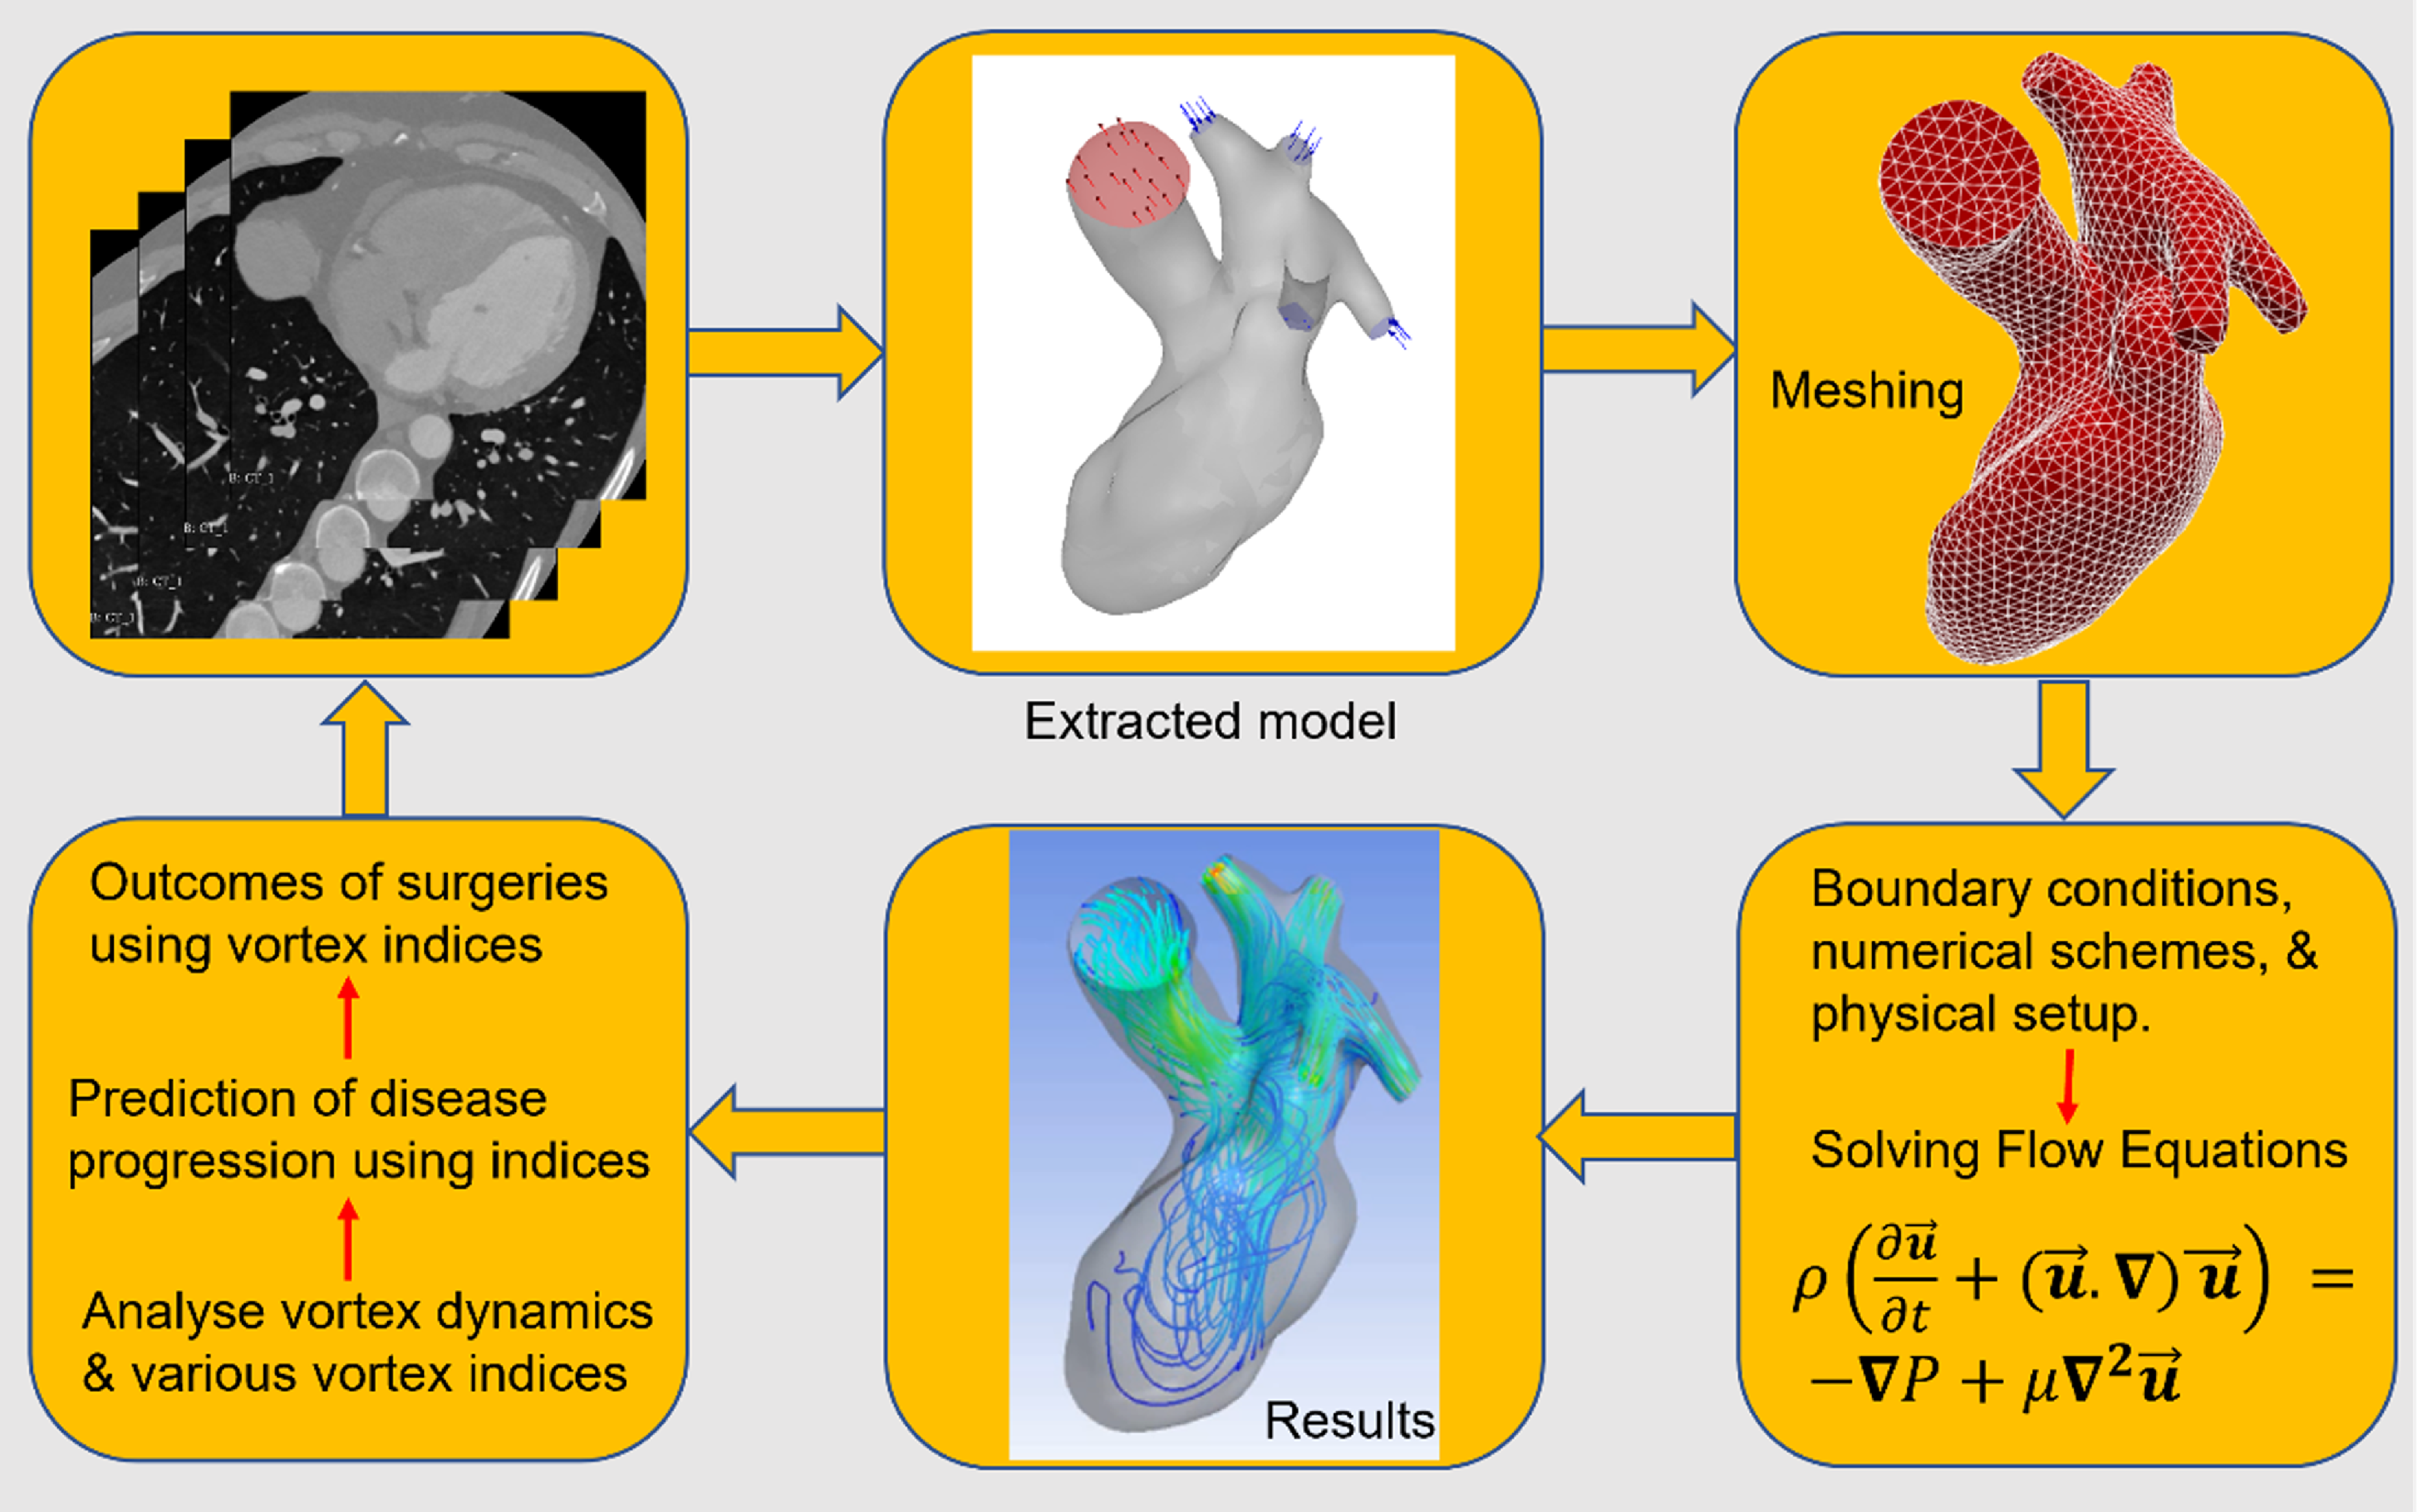
The typical pipeline for patient-based modelling blood flow in the LV is sketched in Figure 7. This pipeline proceeds through stages, each of them with its own complications. The first stage is to collect the medical images (CT or MRI) of heart models from physicians. The images need to be segmented for extraction of the heart surface and further smoothing. The extracted model is fed to either open-source or commercial tools for mesh generation and simulation. Mesh independence tests are crucial before performing final simulations. After mesh independence assessment, the appropriate patient-specific boundary conditions are enforced for the heart model such as inlet flow/pressure profiles and ventricle wall movement. The blood flow dynamics in the heart model is simulated by solving numerically the Navier–Stokes equations. After solving the flow field, the three-dimensional vortical structures and various hemodynamic parameters can be extracted for flow analysis. The most used marker for heart health is the vortex structure and the VFN. These markers can be helpful in monitoring heart health and can also be beneficial for heart surgery planning or evaluation of post-surgery outcomes. Every step involved in a pipeline of blood flow modelling is further discussed in depth below.
Pipeline used in CFD modelling of vortex dynamics in patient-specific left heart model.
3.1 Segmentation of heart models using medical images
The DICOM file format is commonly used in medical images for visualisation, transfer and segmentation purposes. The segmented models can be exported in stereolithography file formats for further processing, refinement and numerical simulations. The segmentation step involves generation of the endocardial surface and definition of the endocardial displacement field during systolic filling dilation. Plenty of tools are available for segmentation of medical images. However, the most popular tools are discussed in this section. The entire segmentation procedure can be performed using the open-source software 3D slicer (Kikinis et al., Reference Kikinis, Pieper and Vosburgh2013), the vascular modeling toolkit (vmtk) (Antiga et al., Reference Antiga, Piccinelli, Botti, Ene-Iordache, Remuzzi and Steinman2008), vmtk features can be enhanced by using additional tools for cardiac surface processing and the SimpleElastix library for image processing (Fedele and Quarteroni, Reference Fedele and Quarteroni2021; Klein et al., Reference Klein, Staring, Murphy, Viergever and Pluim2010). The segmented and processed models can be visualised using ParaView, an open-source visualisation software (A. Henderson, Reference Henderson2007). Although the above mentioned libraries are available, the segmentation and generation of whole heart model geometry with its moving endocardial walls and heart valves is a cumbersome and challenging task.
The accurate segmentation and reconstruction of heart models and their time-resolved wall motion using cine-MR or ultrasound images enhances diagnostic accuracy and CFD modelling credibility. However, due to the limitation of imaging resolution, a lack of accuracy in the imaging of the heart valves and ventricular apex is observed. The wall motion in very short time intervals during a cardiac cycle is difficult to resolve properly due to the limitation of temporal resolution in imaging modalities. The number of frames per cardiac cycle is limited to 20–30. The intermediate surfaces between very short intervals of time are obtained by interpolation of temporal datasets (Antiga et al., Reference Antiga, Piccinelli, Botti, Ene-Iordache, Remuzzi and Steinman2008; Renzi et al., Reference Renzi, Vargara, Fedele, Giambruno, Quarteroni, Puppini and Luciani2023).
Regarding the segmentation techniques, two main approaches exist: image-driven approaches and model-driven approaches. Image-driven models are designed without or with weak prior models, while model-driven approaches are based on strong prior knowledge. The image-driven approach identifies the pixel difference in tissue, blood pool and myocardium and segmentation can be performed by thresholding and region-growing methods (Peng et al., Reference Peng, Lekadir, Gooya, Shao, Petersen and Frangi2016). On the other side, a model-driven approach uses strong prior knowledge about the specific shape variability of the ventricle chambers, instead of making assumptions on boundaries. Various researchers have used a model-based approach for segmentation of the heart and this method has shown promising results (Mitchell et al., Reference Mitchell, Bosch, Lelieveldt, Van der Geest, Reiber and Sonka2002; van Assen et al., Reference van Assen, Danilouchkine, Frangi, Ordás, Westenberg, Reiber and Lelieveldt2006).
Choice of segmentation techniques is not trivial and can be constrained by the specific protocol. Model-based technique can be useful for obtaining LV walls combined with thresholding to eliminate the effect of papillary muscles. If training datasets are limited, then the use of model-based techniques is not preferred, and it is instead advised to refer to image-driven approaches. Finally, segmentation accuracy is the major criterion for selecting a segmentation technique.
Challenges of whole heart segmentation are mainly due to large shape changes of the heart and unclear boundaries between various substructures. A practical problem is the computational time for segmentation raised from a non-rigid registration process. Other challenges that arise in the use of fully automatic algorithms are large variability of the heart shape, indistinct boundaries and restricted image quality or resolution. The automatic algorithms cannot be applied to every heart simulation, but rather they are limited to specific tasks.
3.2 Numerical scheme consistency
We observed a disparity in various numerical schemes used for modelling of LV hemodynamics. Few studies used first-order temporal or spatial discretisation, while others have used second- or higher-order discretisation methods. Similarly, different pressure–velocity coupling schemes have been used in past studies. It is not clear which order of discretisation or pressure–velocity coupling is best for biomedical simulations. Sufficient knowledge of various numerical schemes and their effect on vortex patterns in the LV would be a great guide for in silico medicine. However, most of the studies used second-order schemes for temporal discretisation and second- or higher-order schemes for spatial discretisation. Nowadays, the use of higher-order schemes in industrial applications is a common practice. The appropriate choices on use of numerical schemes with the in vivo or in vitro validation can be an excellent addition to available literature knowledge. A universal guide for CFD methods used and consistency in results obtained could be a better approach to translating CFD results into clinical decisions. The successful adaption of CFD to clinical decision making can be possible when CFD output is readily tuned for specific clinical needs.
3.3 Boundary condition specification
The effect of boundary conditions on flow patterns and hemodynamic markers have been thoroughly studied and shows the necessity of using individual patient-specific boundary conditions (Dahl et al., Reference Dahl, Thomassen, Hellevik and Skallerud2012; Lantz et al., Reference Lantz, Gupta, Henriksson, Karlsson, Persson, Carlhäll and Ebbers2019). Numerical results significantly depend on the accuracy of boundary conditions. Inappropriate boundary conditions lead to incorrect prediction of flow fields and hemodynamic markers (Tagliabue et al., Reference Tagliabue, Dedè and Quarteroni2017b). Use of generic boundary conditions available in commercial solvers restricts the use of CFD analysis in medical practice due to deviations from in vivo physiology. However, a recent study explored the effect of various inlet boundary conditions on hemodynamics and advised that artificial inlet profiles are acceptable to use in the absence of patient-specific boundary conditions (Wei et al., Reference Wei, Huddleston, Trusty, Singh-Gryzbon, Fogel, Veneziani and Yoganathan2019). Artificial inlet profiles are generic inlet boundary conditions adapted from literature studies which consist of an E-wave and A-wave (diastolic filling), as shown in Figures 4 and 8(b). The inlet profile is similar in all healthy cases, but it can be different in diseased cases (Wei et al., Reference Wei, Huddleston, Trusty, Singh-Gryzbon, Fogel, Veneziani and Yoganathan2019). Patient-specific inlet boundary conditions are replications of in vivo velocity/flow profiles measured by phase-contrast MRI or catheterisation. Using such inlet profiles in CFD simulation for each patient-specific LV replicates the CFD results close to in vivo flow patterns. The flow profiles obtained from medical data can be implemented in CFD simulations by interpolating the flow curve and writing a customised function (e.g. in Ansys, a user-fefined function) for boundary condition implementation. Note that obtaining the blood flow velocities or pressure at various valve locations is not a routine clinical practice, which limits the availability of patient-specific boundary conditions and accurate flow dynamics in the heart. It can be a very good initiative to perform whole heart simulations using patient-specific flow and wall properties. Patient-specific flow profiles at specified regions can be obtained using four-dimensional flow MRI studies. Similarly, computed tomography angiography (CTA) with Doppler ultrasound can be used to extract two-dimensional velocity profiles at desired planes. These extracted profiles from clinical data can be implemented into CFD simulations using curve fitting and extracting the coordinates. Patient-based wall properties can be acquired using tagged MRI which provides detailed strain and wall deformation of the LV. Similarly, three-dimensional echocardiography gives a volumetric view of heart wall motion. High-resolution MRI measures the thickness of the heart muscles. While speckle tracking echo measures wall strain in real time. Measured principal strains from tagged MRI can be validated with experimental stress tests. These tests consist of tensile tests to obtain a stress–strain curve, biaxial testing to calculate anisotropic properties and shear tests for measuring the shear modulus and viscoelastic behaviour. Hyperplastic models can be implemented to model heart muscle behaviour, The Holzapfel–Ogden model accounts for anisotropy and could be beneficial over isotropic models. Such studies will add valuable knowledge to the existing literature, and it will be possible to translate such studies into clinical practices.
Validation and comparison of inlet flow profiles with Zheng et al. (Reference Zheng, Seo, Vedula, Abraham and Mittal2012) using moving mesh methodology: (a) ideal geometry of LV, (b) validation of ventricular VFR with past study, (c) ventricle volume change during cardiac cycle, (d) fffect of plug and parabolic inlet profile on Q-criterion in ideal LV model.
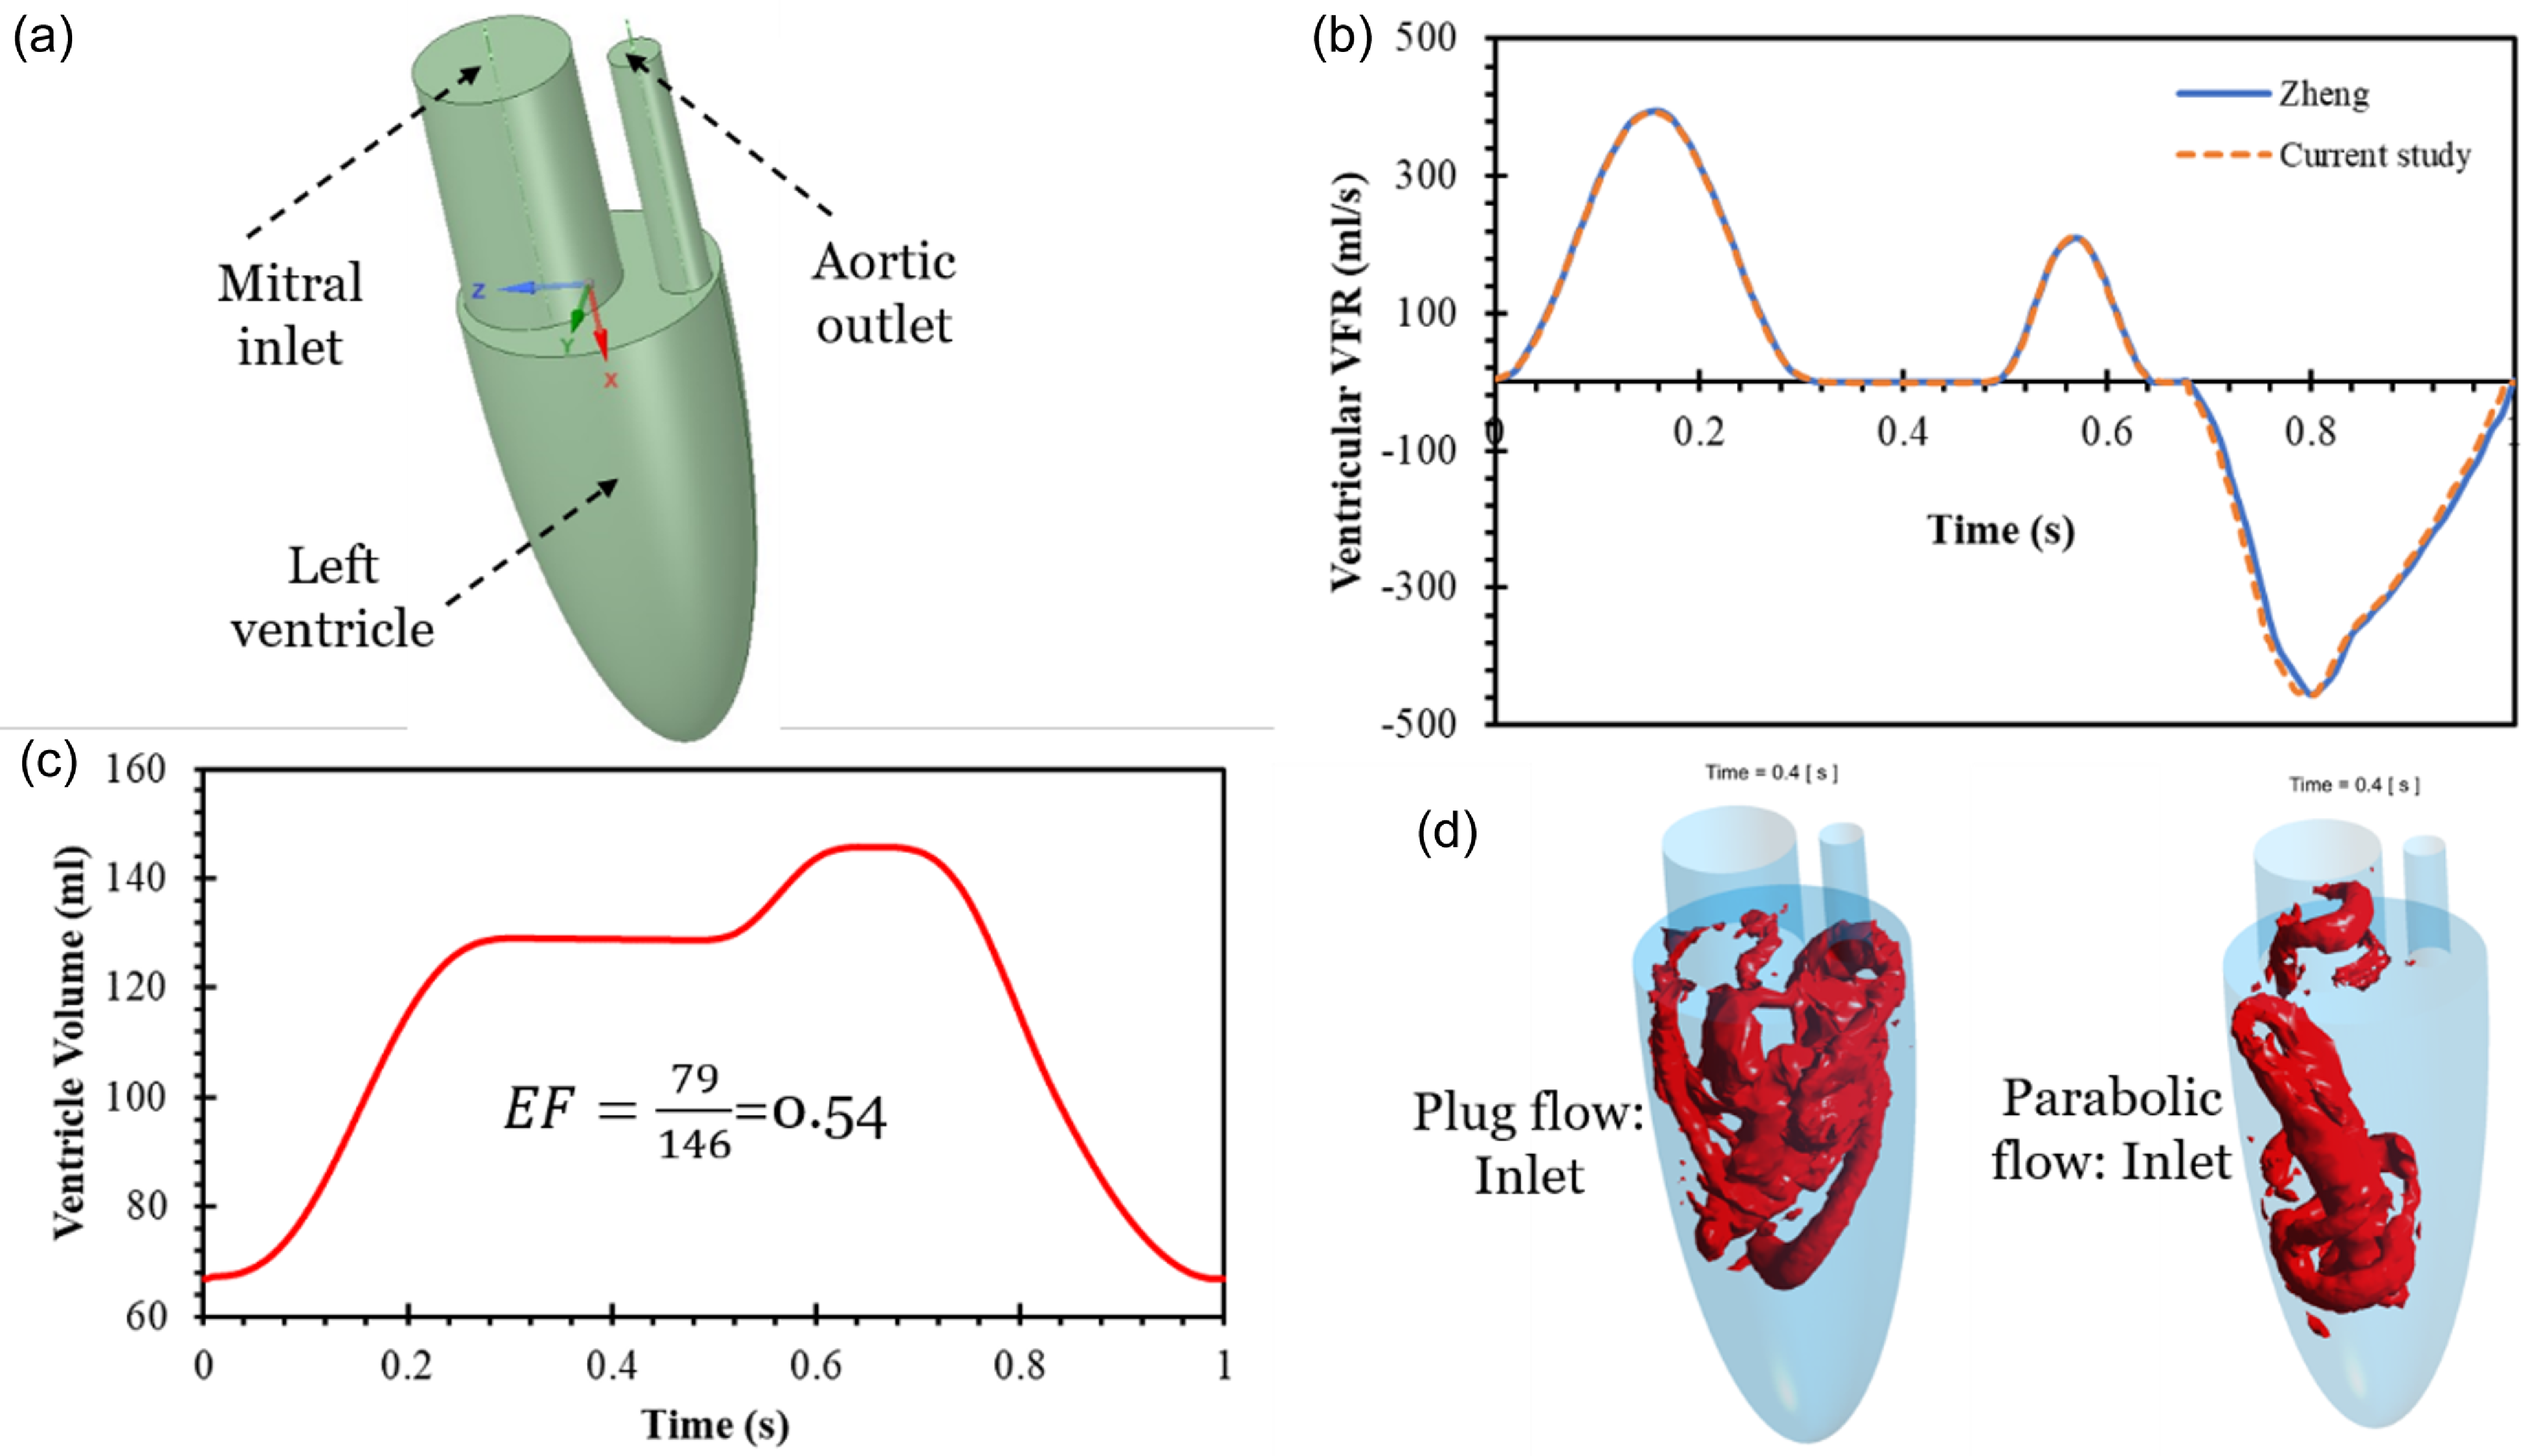
We have simulated and compared the effect of plug and parabolic inlet profiles on vortex formation and found that vortex patterns are significantly different, as shown in Figure 9(d). The vortex patterns obtained using a plug flow inlet is in agreement with in vivo flow dynamics and past published articles (Chan et al., Reference Chan, Lim, Ong and Abu Osman2013c). Therefore, it is recommended to use the plug inlet profile at the LV inlet (MV) during LV filling simulations. In a recent study, three different models of left heart models with varying inlet pulmonary veins (PVs) were compared and analysed (Dahl et al., Reference Dahl, Thomassen, Hellevik and Skallerud2012). Four jets enter the atrium asymmetrically, and complex vortex patterns are observed. They found that, with anatomically based PV positions, the flow was directed towards the MV without collision. This model shows an evenly distributed velocity at the MV plane and lower maximum transmitral velocity during the E-wave. The asymmetrically located veins prevent flow instabilities and excessive energy dissipation in the flow. To obtain physiologically correct simulations, ventricular filling and MV dynamics should be modelled using patient-specific anatomies, flow rates and MV properties. In another recent study, three different inlet waveforms at the PVs are analysed using four-dimensional flow MRI (Lantz et al., Reference Lantz, Gupta, Henriksson, Karlsson, Persson, Carlhäll and Ebbers2019). They have observed that different inlets at PVs affect the LA flow patterns. A large variation in kinetic energy (KE) is observed for varying inlet velocity profiles, especially during the early filling phase. In vivo MRI measurement shows higher flow volumes on the right side of PVs compared with the left side, which seems to be realistic as the right lung has three lobes and the left lung has only two lobes. Some of the vortical structures generated in the LA transferred towards the LV. The high residence time regions trigger thrombus formation and it is most commonly observed at abnormal flow regions in the LA (Hara et al., Reference Hara, Virmani, Holmes, Buchbinder, Lesser, van Tassel, Mooney and Schwartz2009; Heppell et al., Reference Heppell, Berkin, McLenachan and Davies1997). Asymmetrical filling of the LA preserves the momentum and is redirected towards LV through the MV (Kilner et al., Reference Kilner, Yang, Wilkest, Mohladdlin, Firmin and Yacoub2000).
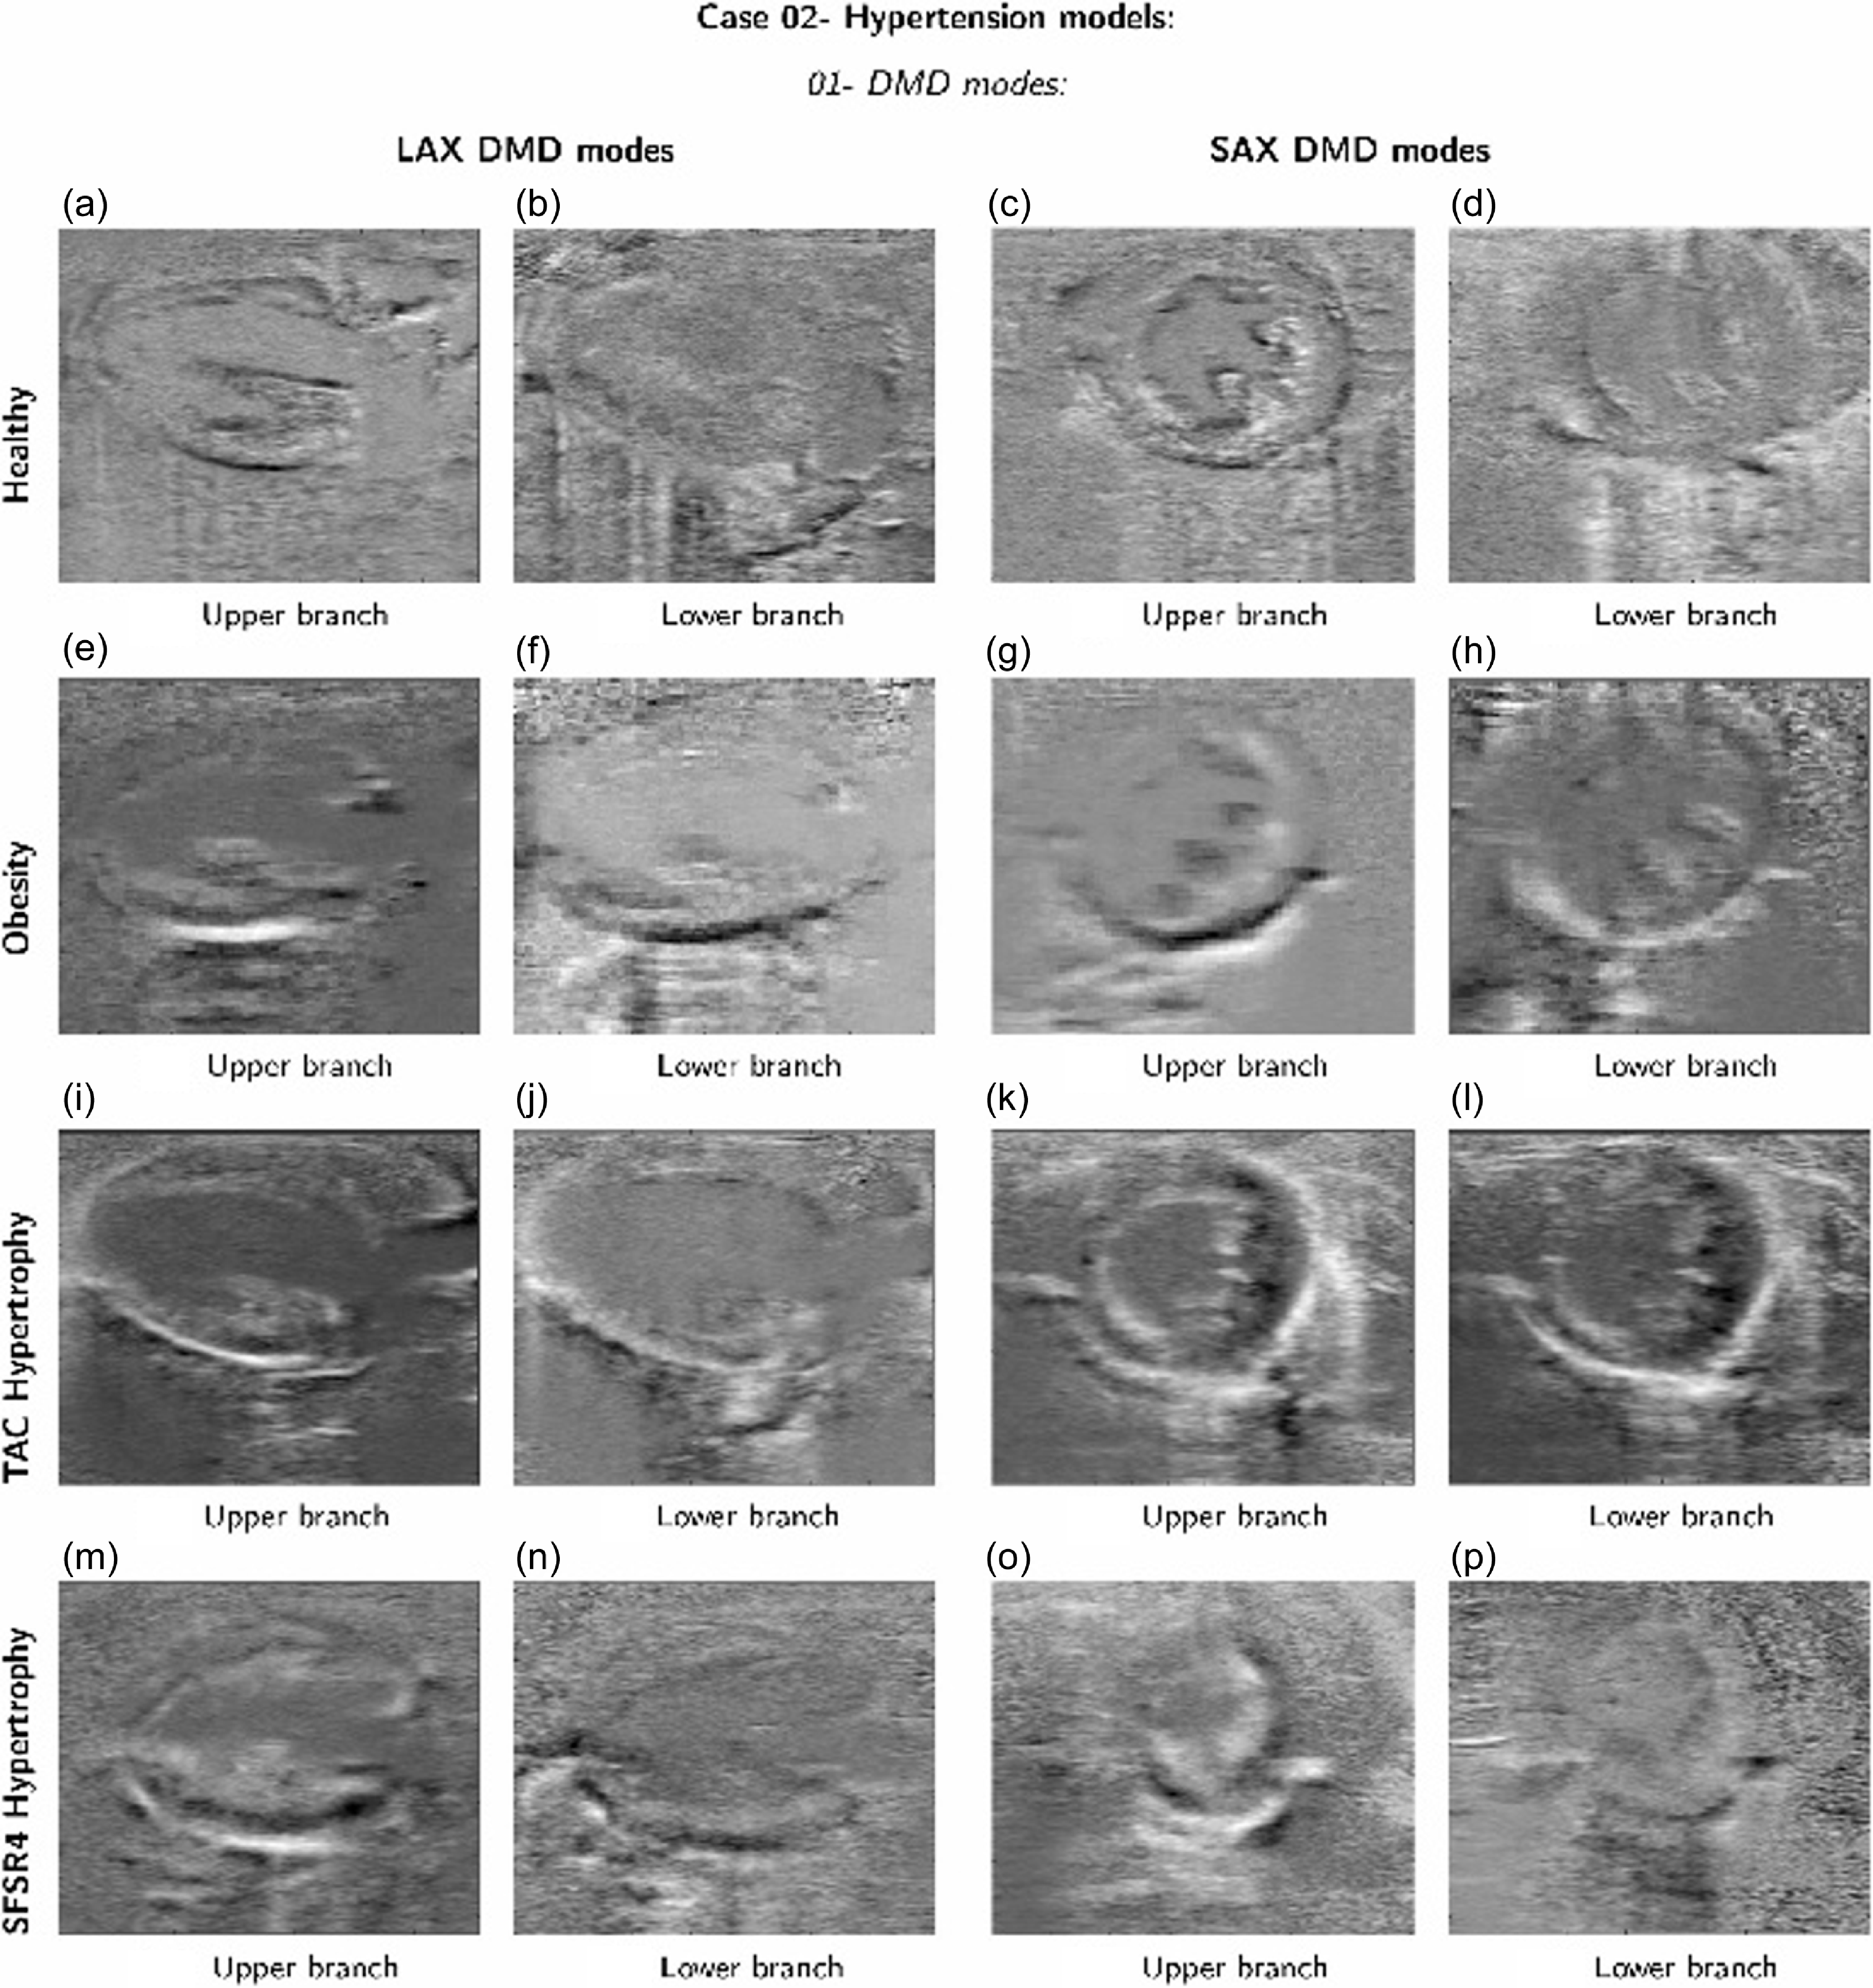
A comparison between the DMD modes obtained from the healthy data set and the DMD modes obtained from analysing the datasets of the hypertrophic hearts. Reproduced from (Groun et al., Reference Groun, Villalba-Orero, Lara-Pezzi, Valero, Garicano-Mena and Le Clainche2022).
Notes: TAC: Time-Area Curves, SFSR4: Segmental Function Score for Radial 4-Chamber, LAX: Long-Axis and SAX: Short-Axis Views.
3.4 Wall modelling
Moving mesh methods are useful for simulating the large expansion characterising the movement of the LV walls. A possible implementation of a moving mesh approach interprets interpolating the LV surface generated at various time instances during a cardiac cycle. The change in LV volume is reconstructed from medical images in spatio-temporal node positions. The mesh is updated to respective dilated LV volume using surface coordinates at various time instances. It is very difficult to use two-way fluid–structure interaction (FSI) for larger deformations of the LV. However, FSI is useful for modelling heart valve movement. In the FSI, the momentum transfer from fluid (blood) to solid (artery wall/endothelial surface) and vice versa is modelled. Current spatial and temporal resolutions for cardiac MRI are around 1–1.5 mm and 40–50 ms, respectively (Saeed et al., Reference Saeed, Van, Krug, Hetts and Wilson2015). This resolution is inadequate to capture the motion of heart valves. Very few studies have modelled patient-specific heart models with heart valve movement (Chnafa et al., Reference Chnafa, Mendez and Nicoud2014; Gao et al., Reference Gao, Feng, Qi, Berry, Griffith and Luo2017; Mao et al., Reference Mao, Caballero, McKay, Primiano and Sun2017; Seo et al., Reference Seo, Vedula, Abraham, Lardo, Dawoud, Luo and Mittal2014; Su et al., Reference Su, Zhong, Wang, Zhang, Tan, Allen, Tan, Kim and Leo2014, Reference Su, Tan, Tan, Guo, Zhang, Leng, Zhao, Allen and Zhong2016). In most of the studies, valves are modelled as either fully open or fully closed; moreover, valve opening and closing are assessed to be very fast, almost instantaneous. However, neglecting wall movement during opening and closing may affect the left ventricular flow patterns. Valve movement has been modelled in two ways, either using medical imaging data to specify opening and closing motion or directly simulating using the FSI approach. It is necessary to give wall boundary conditions during early diastole to the aortic valve and during systole to the MV. Specifying the wall boundary condition defines the valve as completely closed. These can be changed during a cardiac cycle from wall to velocity inlet or pressure outlet and vice versa. Specifying these boundary conditions replicates the opening and closing of valves during the diastole and systole phases of the cardiac cycle. Despite many investigations having been conducted by using different types of boundary conditions for LV valves, it is still unclear what is the best fit of boundary conditions to replicate physiological flow features in the LV. The best practice to model the valves is to use the FSI approach instead of modelling it as completely open or closed. The FSI approach is computationally expensive and time consuming. It can be modelled using a computationally viable moving mesh approach, but we need surface information on valve movement. However, it is difficult to extract valve movement due to current imaging constraints. The opening and closing of valves are so rapid that current imaging techniques will not be helpful in extracting their movement. After extracting valve movement, it can be modelled using the moving mesh approach which has been used in modelling LV wall movement.
3.5 Newtonian and non-Newtonian blood models
It has been argued that blood flow in larger arteries and veins can be modelled as Newtonian (Ku, Reference Ku1997). The heart is, in a sense, a large vessel, but it involves complex flow patterns due to contraction and expansion of endocardial walls and moving heart valves. The flow patterns in the heart chamber involve vortices and recirculation. The recirculation leads to lower shear rate values, and it is well known that blood viscosity is dependent on local shear rates (Cho and Kensey, Reference Cho and Kensey1991). The lower shear rate leads to increased blood viscosity, and it becomes important to understand the effect of non-Newtonian models on vortex patterns in the LV. A recent study attempted to investigate the effect of various non-Newtonian models (shear thinning) on vortex analysis in the LV and they found a significant difference between both vortex patterns and vortex ring angle in various non-Newtonian models (Doost et al., Reference Doost, Zhong, Su and Morsi2016b). The number of smaller vortices and their magnitudes are different for various non-Newtonian models. A larger apparent viscosity value is observed in the apex and middle of the LV. The vortex patterns are the major marker of measuring heart function, and it shows the importance of non-Newtonian blood flow modelling in the LV. They have analysed the effect of non-Newtonian blood for a single case. It would be interesting to see a comparison of non-Newtonian models in large datasets of patient-specific LVs, especially in DCM patients. In DCM patients, LV volume is increased and larger stagnation regions are observed which can lead to increased viscosity regions. To the best of the authors’ knowledge, there is no study available on the effect of VFN for various non-Newtonian models in healthy and diseased LVs. The VFN has been considered as an important marker of identifying normal and abnormal vortex patterns in the LV. Overall, the consideration of non-Newtonian modelling becomes important due to its strong linkage with vortex patterns and the VFN.
Few other studies have investigated the effect of non-Newtonian models on the hemodynamics of mechanical heart valves and left-ventricular assist devices (Al-Azawy et al., Reference Al-Azawy, Turan and Revell2017; De Vita et al., Reference De Vita, de Tullio and Verzicco2016). They found that, irrespective of having larger vessels such as the aorta and heart pump, shear rate values are lower than threshold limits to show constant viscosity and its shear-thinning behaviour might affect the flow patterns. Haemolysis, induced due to altered wall shear stress (WSS), is observed to be higher for the non-Newtonian model compared with Newtonian blood (De Vita et al., Reference De Vita, de Tullio and Verzicco2016). Further, it was suggested to use non-Newtonian models for modelling left ventricular-assisted devices. They found that the shear rate values are lower than 100 s-1 in the chamber and these shear rate values belong to the nonlinear viscosity range for blood (Al-Azawy et al., Reference Al-Azawy, Turan and Revell2017). Total KE is observed to be higher for non-Newtonian models compared with Newtonian ones. Finally, there is insufficient knowledge available on which non-Newtonian model is the best fit for hemodynamics in the LV (De Vita et al., Reference De Vita, de Tullio and Verzicco2016). It would be a great addition to the literature to validate CFD vortex patterns using various non-Newtonian models with four-dimensional flow MRI vortex data. The closely matching non-Newtonian model can be recommended for future simulation to avoid confusion.
3.6 Validation of numerical methodology
Validation of numerical results against well-designed experimental datasets is necessary for gaining confidence in CFD simulations. The accuracy of CFD simulations in biomedical flows largely depends on the selection of geometry, boundary conditions, blood and wall properties, mesh quality and numerical methods used. Due to simplifications and assumptions made during heart simulations, it is very difficult to validate these results with experimental or in vivo data. Very few studies validated their CFD results against the experimental values. Vedula et al., have validated the hemodynamics in a moving LV model with particle image velocimetry experiments, which matched well both qualitatively and quantitatively (Vedula et al., Reference Vedula, Fortini, Seo, Querzoli and Mittal2014). Few other studies validated CFD results with in vivo flow profiles obtained using four-dimensional flow MRI and they matched qualitatively (Saber et al., Reference Saber, Wood, Gosman, Merrifield, Yang, Charrier, Gatehouse and Firmin2003; Schenkel et al., Reference Schenkel, Malve, Reik, Markl, Jung and Oertel2009).
We have validated the numerical methodology with Zheng et al., on an idealLV hemodynamics, as shown in Figure 9 (Zheng et al., Reference Zheng, Seo, Vedula, Abraham and Mittal2012). Simulations were performed using a well-established moving mesh approach. The movement of heart walls during diastolic filling has been mimicked by updating surface files in a short interval of time during simulations, please see section 3.4 for a more detailed explanation. Figure 9(a) shows the ideal LV model (Vedula et al., Reference Vedula, Fortini, Seo, Querzoli and Mittal2014), which is a semi-prolate ellipsoid in shape consisting of a mitral orifice (inlet) and aortic outlet. The inlet profile is adapted from the literature and compares the volumetric flow rate (VFR) at inlets and outlets and it has already been discussed in the boundary condition section. Figure 9(b, c) shows the validation of the ventricular VFR for the present simulation with Zheng et al., and the ejection fraction (ratio of ejected volume to the total LV volume) achieved matches their results (Zheng et al., Reference Zheng, Seo, Vedula, Abraham and Mittal2012).
3.7 New tools for pattern identification
The identification of coherent structures is of paramount importance in the field of cardiac flow modelling. However, this area remains under-explored due to the inherent complexity of the problem. New data-driven techniques offer a promising avenue for advancing our understanding of the flow physics, providing general descriptions of the main mechanisms involved in heart dynamics, and detecting the presence and evolution of the vortex ring originated in early diastole from the MV.
For instance, data-driven modal decomposition techniques can identify the primary patterns and global instabilities driving the flow dynamics. Two prominent methods in fluid dynamics are proper orthogonal decomposition and dynamic mode decomposition (DMD). Proper orthogonal decomposition decomposes the flow into the most energetic orthogonal modes, representing large-scale structures. Dynamic mode decomposition identifies high-amplitude modes driving the flow dynamics. By identifying the main flow patterns, it is possible to connect these structures with healthy or diseased heart mechanisms, allowing for the preemptive detection of CVDs. These data analysis techniques have gained traction in medical image analysis and diagnosis (Fathi et al., Reference Fathi, Bakhshinejad, Baghaie, Saloner, Sacho, Rayz and D’Souza2018; Grinberg et al., Reference Grinberg, Yakhot and Karniadakis2009), extending to conditions like Parkinson’s and lung disease (Fu et al., Reference Fu, Klyuzhin, McKeown, Stoessl and Sossi2020; Xi and Zhao, Reference Xi and Zhao2019).
In particular, a study by (Groun et al., Reference Groun, Villalba-Orero, Lara-Pezzi, Valero, Garicano-Mena and Le Clainche2022) has investigated the use of higher-order dynamic mode decomposition (HODMD) in the realm of medical imaging, particularly in the analysis of echocardiography images obtained from mice with different cardiac conditions. The algorithm demonstrated robust performance, successfully capturing two branches of frequencies related to heart and respiratory rates across all datasets. Despite variations in the number of identified modes and frequencies due to noise level, disease characteristics and anaesthesia effects, HODMD consistently distinguishes characteristic patterns associated with each cardiac pathology, as shown in Figure 8.
Inspired by these results, in future avenues, we will apply the HODMD algorithm to analyse cardiac flow CFD databases, shedding light on vortical structures within the LV model. The data from this CFD simulations is compiled into a three-dimensional snapshot tensor called v(x, y, z, t k), which we feed into the HODMD algorithm. This method decomposes the dataset into an expansion of DMD modes um each of them associated with an amplitude a m, as
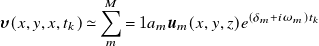 \begin{align*} \boldsymbol{\upsilon}(x,y,x,t_k)\simeq \sum^M_m=1 a_m \boldsymbol{{u}}_m (x,y,z) e^{(\delta_m + i \omega_m) t_k} \end{align*}
for k = 1, …, K . The DMD modes can grow, decay or remain neutral according to the associated growth rate δ m and oscillate in time with the frequency ω m.
Notably, this algorithm exhibits several advantages, including its capability to analyse three-dimensional data, integrate both experimental and numerical data sources and obtain a set of modes associated with the vortical structures.
Recent advances in deep learning, including convolutional neural networks (CNNs) and recurrent neural networks, have significantly enhanced our ability to manage and interpret the large datasets generated by improved cardiac flow simulations. These artificial intelligence (AI) and machine learning techniques have been instrumental in diagnosing CVDs, particularly through the classification of MRI image sequences of coronary arteries (Berikol et al., Reference Berikol, Yildiz and Özcan2016; Worden et al., Reference Worden, Lindower, Burns, Chatterjee and Weiss2015).
The work by Bell-Navas et al. introduces an automatic cardiac pathology recognition system using a novel deep-learning framework (Bell-Navas et al., Reference Bell-Navas, Groun, Villalba-Orero, Lara-Pezzi, Garicano-Mena and Le Clainche2025). This system analyses real-time echocardiography video sequences in two stages. The first stage converts echocardiography data into annotated images suitable for machine learning, employing the HODMD algorithm for data augmentation and feature extraction. The second stage involves training a vision transformer from scratch, adapted for small datasets. This neural network predicts heart conditions from echocardiography images and has shown superior performance, even surpassing pre-trained CNNs, highlighting the efficacy of the HODMD algorithm in the medical field.
In conclusion, the application of the HODMD algorithm to the analysis of cardiac flows has not only the potential to deepen our insight into the intricate physics governing this complex phenomenon, but also may be of use as a valuable tool for identifying and foreseeing the temporal progression of CVDs. Through its ability to unravel the flow patterns within the LV, HODMD illuminates the path to more precise and targeted interventions.
4. Future directions
A recent study modelled the whole beating heart hemodynamics with the inclusion of valves and electrophysiology (Fedele et al., Reference Fedele, Piersanti, Regazzoni, Salvador, Africa, Bucelli, Zingaro, Dede’ and Quarteroni2023). However, we are still far away from replicating the physiological phenomena. It is recommended to use the following advancements to move closer towards replication of in vivo flow and material properties.
4.1 Imaging and segmentation
Current limitations in temporal and spatial resolutions of imaging techniques restricts the acquisition of heart valve anatomies, myocardium thickness and structures, papillary muscles and chordae tendineae. The inclusion of these anatomical features in vortex analysis would give a more accurate and closer picture of in vivo flow patterns. The inclusion of papillary muscles may change the vortex patterns by obstructing the blood flow stream and vortices. Segmentation of such minute anatomic features is a major challenge. One possible avenue to overcome this obstruction would be developing neural network algorithms for segmentation. Machine learning-based algorithms could be explored then to interpolate these structures from available weak anatomical features.
4.2 Numerical simulation
The wall movement of the LV has been modelled so far by dynamic meshing features in each available study. However, the surface meshes used and their respective time instances during the cardiac cycle must match to accurately predict the flow patterns in the LV. Interpolation techniques are used for intermediate surface meshes during transient simulations. It is very difficult to interpolate the surface movement by including moving heart valves and papillary muscles. Also, patient-specific boundary conditions are needed for inlet velocity/pressure at local regions, and they can be measured using probes in each patient. The aortic and MV properties can be replicated using a heart muscle stress test, and this could be implemented into numerical simulations. The computational time and cost of cardiovascular simulations are decreasing rapidly, and it can be extended by parallelising the flow solvers. The cost of computer simulation per Gflop is less than a cent of a dollar, which can be utilised in patient care by including numerical simulations in medical practice.
4.3 Analysis of results using trained models
Cardiovascular simulations are time consuming due to human interventions at every step and the time required can be reduced by automating the numerical simulations from loading images to post-processing of results. The vortex patterns in LV can be analysed by machine learning-trained algorithms on various scales of healthy, moderate to severe diseases. After gaining large and rich CFD data on the vortex dynamics for a large population, it could be possible to train neural networks and obtain vortex parameters using just an anatomic model of the heart.
The inclusion of the above suggestions will significantly contribute to increasing the applicability of CFD simulations in daily clinical practice and pre-operative and post-operative surgery planning and evaluation. The use of increased computational capability and lower cost will enhance the inclusion of in silico medicine in clinical practice and decision making. The US Food and Drug Administration (FDA) recommends using computer simulations to complement human or animal testing. Recently, the FDA approved multiple computer programs that are useful in the treatment and management of CVDs (Ahmed et al., Reference Ahmed, Pathmanathan, Kabadi, Drgon and Morrison2023; Morrison et al., Reference Morrison, Pathmanathan, Adwan and Margerrison2018).
Funding statement
The authors acknowledge the grants TED2021-129774B-C21 and PLEC2022-009235 funded by MCIN/AEI/10.13039/501100011033 and by the European Union ``NextGenerationEU''/PRTR and the grant PID2023-147790OB-I00 funded by MCIU/AEI/10.13039/501100011033/FEDER, UE. The authors gratefully acknowledge the Universidad Politécnica de Madrid (www.upm.es) for providing computing resources on the Magerit Supercomputer.
Competing interests
The authors declare that they have no known competing financial interests or personal relationships that could have appeared to influence the work reported in this paper.
Data availability statement
Not applicable.


 Open access