


1. Introduction
Water isotopic ratios in polar ice cores are a major tool for temperature reconstructions over the late Quaternary (NorthGRIP members, 2004; Reference JouzelJouzel and others, 2007). The variations of δD and δ18O in polar regions result from equilibrium and kinetic isotopic fractionations of water at each step of the hydrological cycle, extending from the oceanic source to the polar condensation point. Because equilibrium and kinetic isotopic fractionations have slightly different effects on the hydrogen and oxygen isotopic ratios of water, combining two isotopic ratios makes it possible to derive second-order information such as climatic conditions of the oceanic source regions. Polar snow d-excess (d-excess = δD-8δ18O (Reference DansgaardDansgaard, 1964)) has thus been used for 30 years to infer changes in temperature and relative humidity in the source oceanic regions (e.g. Reference Jouzel, Merlivat and LoriusJouzel and others, 1982; Reference Petit, White, Young, Jouzel and KorotkevichPetit and others, 1991;Reference Vimeux, Masson, Jouzel, Stievenard and PetitVimeux and others, 1999;Reference StenniStenni and others, 2001).
More recently, a method for high-precision measurements of δ17O and δ18O on the same water sample has permitted the development of a new tracer of the hydrological cycle: 17O-excess = ln (δ17O+1)-0.528 × ln(δ18O+1) (Reference Barkan and LuzBarkan and Luz, 2007). In contrast to d-excess, which is sensitive to both temperature and relative humidity, 17O-excess is independent of the temperature at the evaporation site (Reference Barkan and LuzBarkan and Luz, 2007;Reference Luz and BarkanLuz and Barkan, 2010;Reference Uemura, Barkan, Abe and LuzUemura and others, 2010). Moreover, measurements of 17O-excess along an Antarctic transect from the coast to the remote station of Dome C on the eastern plateau (Reference Landais, Barkan and LuzLandais and others, 2008a) have revealed that 17O-excess does not show any trend associated with the δ18O decrease (between -28% and -53%), mainly due to the temperature decrease over the transect. This constant 17O-excess level contrasts with the d-excess increase toward central Antarctica (e.g. Reference Petit, White, Young, Jouzel and KorotkevichPetit and others, 1991;Reference Masson-DelmotteMasson-Delmotte and others, 2008) and suggests that the 17O-excess in precipitation remains unmodified during the air-mass trajectory. Since the 17O-excess in the first vapor is linearly related to relative humidity as evidenced by Reference Uemura, Barkan, Abe and LuzUemura and others (2010), polar snow 17O-excess should directly reflect surface relative humidity at the oceanic source region, which makes it a more direct indicator of climatic conditions than d-excess in polar snow.
While d-excess measurements over the last deglaciation at Vostok (78°27' S, 106°50' E; Fig. 1) display only a relatively small signal (1%), measurements of 17O-excess display a significant increase by 20 per meg (Reference Landais, Barkan and LuzLandais and others, 2008a) that has initially been interpreted as a 20% change in relative humidity of the oceanic source region. This interpretation is, however, subject to discussion. First, a change of relative humidity by 20% in the oceanic source region contradicts modeling studies that simulate constant relative humidity over the ocean through time. Second, the seasonality of precipitation has not been considered by Reference Landais, Barkan and LuzLandais and others (2008a), while Reference Risi, Landais, Bony, Masson-Delmotte, Jouzel and VimeuxRisi and others (2010a) have shown that seasonality may contribute significantly to the observed change in 17O-excess. Unfortunately, this latter study was based only on a modeling approach. Finally, even if the 17O-excess is stable over an Antarctic transect between Terra Nova Bay (mean δ18O ~-30%) and Dome C (mean δ18O ~-53%o), this transect does not cover the δ18O range over the last deglaciation at Vostok (-60% to -54%), and it does not exclude that 17O-excess in surface snow may decrease with temperature when δ18O is lower than -53%(Reference MillerMiller, 2008). Actually, measurements of 17O-excess in melted snow of Antarctic origin with very low S18O (Standard Light Antarctic Precipitation (SLAP) with δ18O = -55%o; Dome F with δ18O = -58%o) show values ~30-40 per meg lower (Reference Luz and BarkanLuz and Barkan, 2010) than the trend of the Antarctic transect of Reference Landais, Barkan and LuzLandais and others (2008a).
Map of Antarctica showing the location of Vostok station.

In this paper, we explore the variability of the d-excess and 17O-excess in very remote regions where δ18O and δD are strongly negative. With this purpose we measured, for the first time, d-excess and 17O-excess from precipitation sampled over a whole year at Vostok station. Based on the comparison of 17O-excess, d-excess and δ18O measured values and model calculation results, we show that kinetic fractionation for condensation at very low temperatures can explain low 17O-excess values as well as strong seasonal variations of both parameters. Finally, we discuss the possible implications of our findings for the interpretation of d-excess and 17O-excess in profiles from central East Antarctica in terms of climatic conditions of oceanic source regions.
2. Method
2.1. Sampling
Precipitation samples were collected at Vostok by the wintering party of the 44th Russian Antarctic Expedition from December 1999 to December 2000. The precipitation trap was installed ~50m windward from the station buildings 1.5 m above the snow surface in order to avoid the influence of blowing snow. The trap was visited after each precipitation event (snow from clouds, diamond dust or rime). The collected precipitation was melted, poured into special plastic bottles and frozen again. We believe that this procedure prevented the alteration of the initial isotopic composition of precipitation due to sublimation, exchange with the air or water-vapor diffusion in surface snow occurring at solid-vapor isotopic equilibrium which strongly modifies d-excess and 17O-excess with time in the polar firn (Reference Johnsen, Clausen, Cuffey, Hoffmann, Schwander, Creyts and HondohJohnsen and others, 2000;Reference Landais, Steen-Larsen, Guillevic, Masson-Delmotte, Vinther and WinklerLandais and others, 2012). In total, 56 samples were collected and further analyzed for δ18O and SD (performed at the Geophysics Department of the Niels Bohr Institute (NBI), University of Copenhagen), but because we lacked sufficient material, only 16 samples were used for 17O-excess analyses.
2.2. Measurements
The 17O-excess measurements presented here were obtained following the experimental set-up described by Reference Barkan and LuzBarkan and Luz (2005). Water is converted to oxygen by fluorination with CoF3 reagent, and the produced oxygen is trapped in a tube manifold immersed in liquid helium. Each oxygen tube is then analyzed by dual inlet for S17O and S18O. Each water sample has been converted and measured two to four times.
One flask of working water standard was analyzed daily to check the performance of both the fluorination line and the mass spectrometer. The δ17O,δ18O and 17O-excess values were expressed with respect to Vienna Standard Mean Ocean Water (VSMOW). The resulting uncertainty on 17O-excess was 5 per meg (data are given in Table 1).
Data displayed in Figure 2
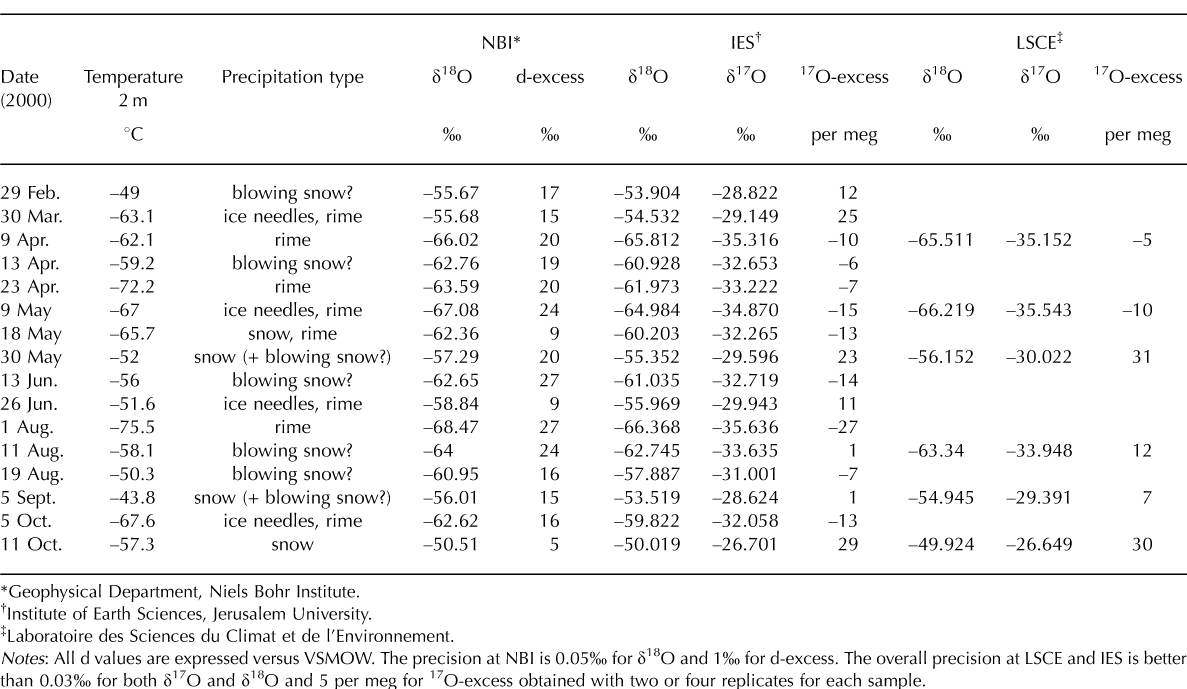
In order to check for any bias that could be introduced by the fluorination method or mass spectrometer analysis, water conversion and dual inlet analysis of precipitation samples were performed in two different laboratories. The sixteen precipitation samples were analyzed at the Institute of Earth Sciences (IES), Jerusalem, and six of them were also measured at the Laboratoire des Sciences du Climat et de l'Environnement (LSCE) in Gif-sur-Yvette. In both laboratories the same working standard, Dome F, was used during the measurement period. A difference of 17 per meg was found between the two laboratories in measured 17O-excess of the working standard Dome F vs VSMOW: 1 per meg at IES and 18 per meg at LSCE. Possible explanations of this difference will be published elsewhere: they are mainly due to differences in mass spectrometers used in the different institutes (e.g. different background procedures and different heating capacity of the source of the mass spectrometers that may influence the peak of mass 33). In the present study, in the absence of any absolute determination of 17O- excess of two water standards to calibrate mass spectrometer measurements, we have corrected the results obtained at LSCE relative to the Dome F value measured at IES because the fractionation coefficients associated with 17O-excess and the 17O-excess profile of the Vostok ice core have been measured at IES. After correction, the agreement in 17O-excess between the two laboratories was excellent, confirming the high reliability of the set of measurements presented here (Fig. 2).
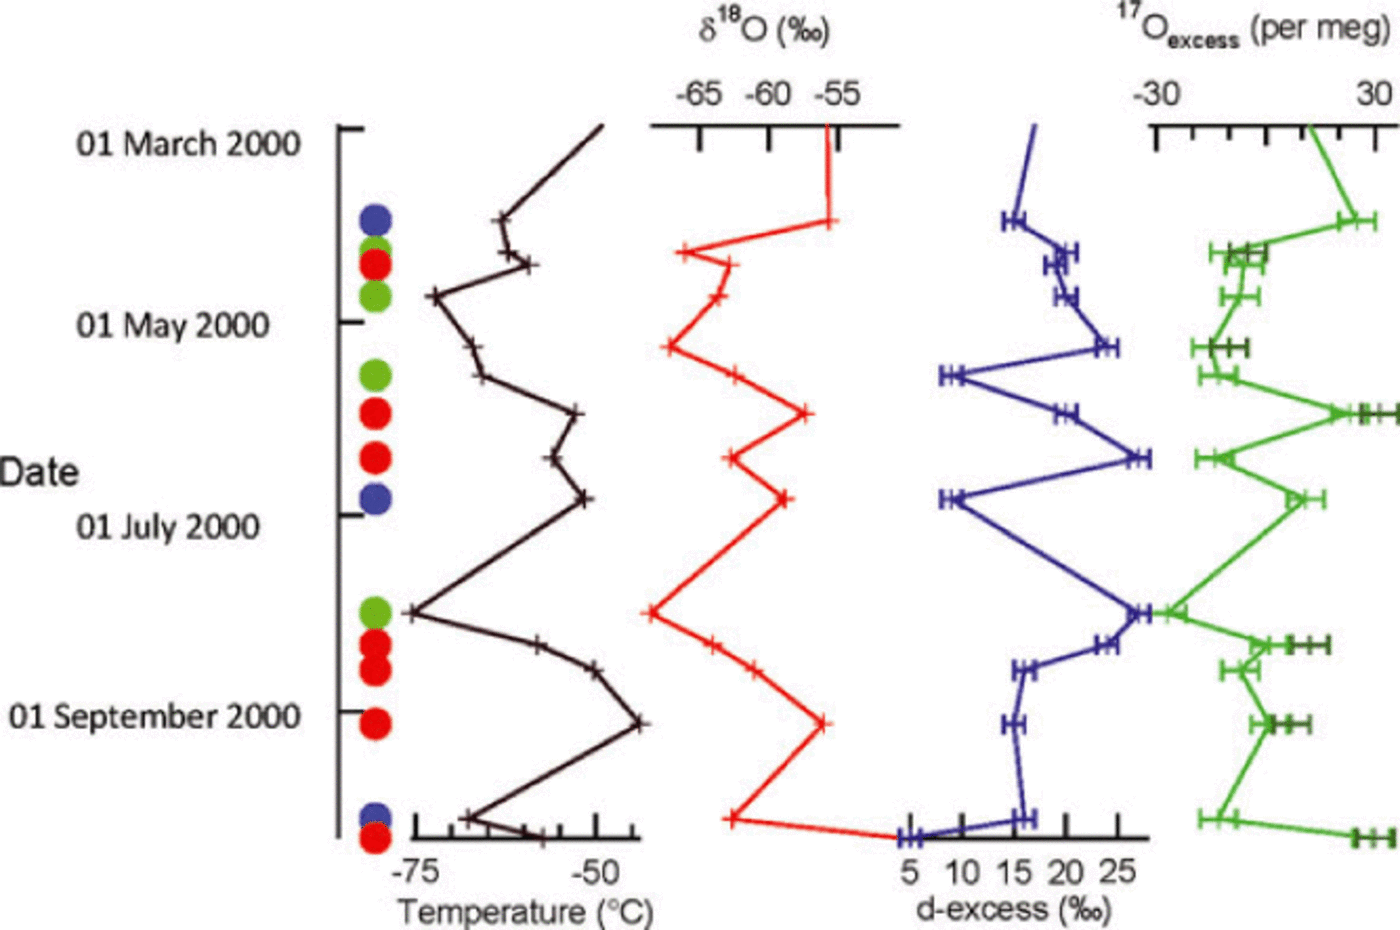
Variations of 17O-excess (light green: measurements performed at IES; dark green: measurements performed at LSCE), d-excess (blue), δ18O (red) and temperature at 2m during the precipitation event (black). At the bottom, the circles indicate the precipitation types (red:snow; blue: ice needles; green: rime). No obvious relationship is found between the isotopic composition 17O-excess and the type of precipitation.
The δ18O values of the samples were determined at NBI in August 2002 using a standard technique of water exchange with reference CO2 gas. The mean monthly isotopic values of snow precipitation content were presented by Reference Ekaykin, Lipenkov, Kuz'mina, Petit, Masson-Delmotte and JohnsenEkaykin and others (2004), while isotope composition of individual snowfalls was never shown or discussed. δ18O values obtained by the fluorination methods at IES and LSCE are higher by 1.9±0.8% and 0.8± 0.8%, respectively, than the δ18O values measured at NBI. This is mainly due to storage of flasks for 8 years at -20°C at LSCE and for 6 years at -20°C, then for 2 years at 5°C at IES. However, the variations of 17O-excess over the seasonal cycle at Vostok are not significantly affected by this effect. Indeed, storage of small flasks of home standard samples of low δ18O (-50%) at room temperature for several years has shown systematic increases of δ18O by about 1-3% (depending on the storage period), but 17O- excess was not modified by >8 per meg. Moreover, the fact that we found comparable 17O-excess at LSCE and IES despite different storage histories confirms the robustness of 17O-excess values.
3. Results
The results displayed in Figure 2 show that over the course of the year, Vostok δ18O is significantly correlated with temperature (Δ(δ18O)/ΔT = 0.35%°C-1; Fig. 3a). This seasonal slope is less than that observed at the remote station at Dome F (Fig. 1) for a similar range of surface temperature and δ18O (0.78%°C-1; Reference Fujita and AbeFujita and Abe, 2006) and 47% °C-1; Reference Motoyama, Hirasawa, Satow and WatanabeMotoyama and others, 2005). It is also half the observed spatial slope over Antarctica (Δ(δ18O)/Δ7= 75-0.80%°C-1 (Reference Lorius, Merlivat, Jouzel and PourchetLorius and others, 1979;Reference Masson-DelmotteMasson-Delmotte and others, 2008)). In turn, such a low value for the temporal slope at Vostok is consistent with the temporal slope (~0.3% °C-1) observed in Greenland over the Holocene, the deglaciation and the last glacial period (Reference Cuffey, Clow, Alley, Stuiver, Waddington and SaltusCuffey and others, 1995;Reference VintherVinther and others, 2009;Reference CapronCapron and others, 2010). It is also consistent with the modeled slope at Vostok for a warmer climate simulated through CO2 doubling (Reference Sime, Wolff, Oliver and TindallSime and others, 2009). In these latter cases, the low values of the temporal slope are mostly due to a change of the seasonality of the precipitation with time (more precipitation in summer during the coldest periods). As observed at Vostok, stations closer to coastal Antarctica also exhibit lower temporal slopes than the spatial slope at the seasonal scale (e.g. Reference Van Ommen and MorganVan Ommen and Morgan, 1997). This is most likely explained by the relatively large amount of snowfall occurring when temperature is above average (Reference Peel, Bradley and JonesPeel, 1992).
(a) Evolution of 17Oexcess, d-excess and δ18O vs air temperature at 2m height over the seasonal cycle at Vostok. (b) Evolution of 17O-excess and d-excess vs δ18O over the seasonal cycle at Vostok.

The explanations given above cannot be applied to explain the low Δ(δ180)/ΔT slope observed at the seasonal scale at Vostok since we measure temperature and isotopic composition of snow on an event basis. We thus suggest that the observed low slope can be partly explained by (1) a strong gradient between condensation and surface temperature (Reference EkaykinEkaykin, 2003) and/or (2) changes in the source climatic conditions for moisture feeding Vostok precipitation. More information on the meteorological conditions associated with each precipitation event and use of back- trajectory analyses are needed to decipher between these different hypotheses.
As already observed at the remote Dome F site (Reference Fujita and AbeFujita and Abe, 2006), as well as in monthly Vostok data on temperature and isotope content (Reference Ekaykin, Lipenkov, Kuz'mina, Petit, Masson-Delmotte and JohnsenEkaykin and others, 2004), Vostok d-excess is anticorrelated with both δ180 and temperature at the seasonal scale (Figs 2 and 3a and b). The highest values (>25%) were obtained during the coldest periods of precipitation (April and September), and the lowest value (5%) during a warm period in October. Still, the anticorrelation between d-excess and temperature is not significant over this seasonal cycle at Vostok (R2 = 0.09;Fig. 3a). The anticorrelation is actually significant only between δ18O and d-excess (R2 = 0.49;Fig. 3b), suggesting that parameters other than local precipitation temperature also control the isotopic composition of surface snow at Vostok.
170-excess depicts clear variations of the order of 40 per meg over the year, with maximal values in austral summer (>20 per meg) and minimal values in austral winter (<-20 per meg). As for the relationships between 170-excess, surface temperature and δ180, strong correlation is observed between 170-excess and δ18O (Δ(17O-excess)/Δ(δ18O) = per meg%-1; R2 = 0.78;Fig. 3b), while correlation is much weaker between 17O-excess and surface temperature (Δ(17O-excess)/ΔT=0.92 per meg °C-1; R2 = 0.24; Fig. 3a).
Reference MillerMiller (2008) suggested that part of the 17O-excess signal at Vostok could be induced by significant intrusion of stratospheric water vapor with associated high 17O-excess because of mass-independent fractionation. However, our calculations, based on available values of 170-excess at the tropopause and estimated stratospheric-tropospheric fluxes have shown that this effect should not have significant influence even at the remote Vostok station (Reference Landais, Barkan and LuzLandais and others, 2008b). Thus, in the following discussion we do not consider the stratospheric influence.
4. Discussion
The seasonal variations of 17O-excess and the significant correlation between 17O-excess and δ18O observed at Vostok strongly contrast with the stable behavior of 17O- excess observed on an Antarctic transect between the coast and the inland Dome C station (Reference Landais, Barkan and LuzLandais and others, 2008a) (Fig. 4). In parallel, the anticorrelation between d-excess and δ18O at the very cold Vostok site is much stronger than what was observed over the Antarctic transect (Fig. 4).
Repartition of 17O-excess vs δ18O (top) and d-excess vs δ18O (bottom) for an Antarctic transect between Terra Nova Bay and Dome C (blue; Reference Landais, Barkan and LuzLandais and others, 2008a) and for the seasonal cycle at Vostok (red). Two water standards, SLAP and Dome F (Luzband Barkan, 2010), are indicated in green.

With the purpose of explaining the different behaviors of 17O-excess over the seasonal cycle and over the transect, as well as understanding the influence of different climatic or cloud physics parameters on 17O-excess and d-excess, we used a simple modeling approach to provide a context for interpreting our data.
4.1. Simple modeling approach
The 17O-excess correlation with δ18O observed at low temperature can be explained by the increasing importance of the kinetic effect (due to higher supersaturation) in the very cold polar regions. The fractionation coefficient associated with solid precipitation is classically expressed as (Reference Jouzel and MerlivatJouzel and Merlivat, 1984)

where Sis the supersaturation of water vapor over ice, which increases with decreasing temperature, D and *D are the diffusion coefficients of H2 16O and H2*O in air, *oeq is the fractionation coefficient associated with solid-vapor equilibrium for H2*O vs H2 16O, and '*' stands for 17 or 18. S is generally assumed to be a linear function of temperature (Reference Ciais and JouzelCiais and Jouzel, 1994), so that S =1-aT with a>0 (Tin °C). The main importance of the parameter S is that it controls the balance between kinetic (given by the relationship between the values of D/D18 and D/D17 for 17O-excess; Reference Barkan and LuzBarkan and Luz, 2007) and equilibrium (given by the relationship between 18αeq and 17αeq for 17O-excess; Reference Barkan and LuzBarkan and Luz, 2005) effects. Thus, an increase of S leads to an increase of the slope (Δ17O-excess)/Δ(δ18O) at very low temperatures (Fig. 4). Indeed, the ratio of the equilibrium fractionation factors ln(17αeq)/ln(18αeq), associated with δ17O (17αeq) and δ18O (18αeq), at temperatures below 0°C is close to 0.528 (Reference Van HookVan Hook, 1968) and is not different from the value 0.529 obtained at temperatures of 10-40°C (Reference Barkan and LuzBarkan and Luz, 2005). As a consequence, a significant contribution of kinetic fractionation, and thus an increase of S, is needed to explain a 17O-excess increase with δ18O.
The balance between kinetic and equilibrium effects for solid precipitation also strongly affects d-excess. Reference Jouzel and MerlivatJouzel and Merlivat (1984) first showed that pure equilibrium fractionation between vapor and solid (i.e. supersaturation of 1) leads to a strong anticorrelation between d-excess and S18O with very high d-excess (60%) in remote regions like Vostok. This is because the ratio of the equilibrium fractionation factors (Dαeq-1)/(18αeq-1), associated with SD (Dαeq) and δ18O (18αeq), is significantly different from 8 at low temperatures. To explain the mean annual value of ~18% at Vostok, a contribution of kinetic fractionation to the process of solid precipitation formation (i.e. S>1) is needed, but the anticorrelation between d-excess and δ18O remains. It is indeed observed in Figure 4 that increasing S leads to a decrease of the slope Δ(d-excess)/Δ(δ18O).
To reproduce the evolution of the snow isotopic composition over the Antarctic transect and on the seasonal cycle at Vostok, we have used the same mixed cloud isotopic model (MCIM; Reference Ciais and JouzelCiais and Jouzel, 1994) based on a Rayleigh distillation (Reference Jouzel and MerlivatJouzel and Merlivat, 1984) and adapted to 17O-excess, as in Landais and others (2008a). The MCIM describes the isotopic processes at each phase transition, and thus the isotopic composition of both the condensed phase (liquid water or solid ice) and the water vapor at each step from the oceanic source region to the precipitation site on the ice sheet. Only one trajectory with a single source and a single precipitation site can be taken into account in this model. During liquid precipitation, only equilibrium fractionation occurs. Kinetic fractionation is taken into account for snowflake formation and is controlled by supersaturation as in Eqn (1). The model receives as main inputs (1) the temperature, relative humidity, wind speed and surface atmospheric pressure of the source region as well as the isotopic composition of the surface ocean, and (2) the condensation temperature and atmospheric pressure at the precipitation site.
The model is first initialized through the isotopic composition of water vapor in the boundary layer above the ocean. This can be done either by imposing the isotopic composition of this water vapor or using the so-called closure assumption detailed by Reference Merlivat and JouzelMerlivat and Jouzel (1979), which relies on the hypothesis that the only source of vapor in the boundary layer is from the surface evaporation. Then the transport path of the water mass is calculated in terms of temperature and pressure. The air parcel is transported in saturated (or supersaturated in polar regions) conditions from the source region to the precipitation site, hence implying continuous fractionation. The MCIM includes several tunable parameters (Reference Ciais and JouzelCiais and Jouzel, 1994) such as the dependence of supersaturation on temperature and the fraction of condensate remaining in clouds. We performed numerous sensitivity experiments to tune these parameters (Reference WinklerWinkler and others, 2011). For our study, the main differences between the simulated d-excess and 17O-excess are due to the change of the supersaturation dependency to temperature whose effect is displayed in Figure 4.
4.2. Model-data comparison
The relationships between 17O-excess (d-excess) and δ18O over the Antarctic transect and over one seasonal cycle at Vostok can be satisfyingly reproduced with a simple isotopic model assuming a supersaturation function of S = 1 -0.004T(Fig. 4). Yet, as we show below, such parameterization of the ratio between equilibrium and kinetic fractionation at solid precipitation is not enough to explain the relationship between surface temperature and the isotopic composition of snow at Vostok as shown in Figure 3a.
Using the parameterization of the function S(T) given above and running the MCIM with different condensation temperatures, Tcond, between -30°C and -50°C, we obtained values of 1.7% °C-1, 3.6 per meg °C-1 and-2.9% °C-1 for the gradients Δ(δ18O)/ATcond, Δ(17O-excess)/ATcond and Δ(d-excess)/ΔTcond, respectively. We note that Tcond is not equal to surface temperature, and the relationship between the two is strongly influenced by the atmospheric inversion layer. Classically, a slope of 0.6-0.67 (Reference Jouzel and MerlivatJouzel and Merlivat, 1984;Reference Ekaykin, Lipenkov and HondohEkaykin and Lipenkov, 2009) is always assumed between variations of near-surface and condensation (or inversion) temperatures based on available temperature measurements performed in several places in Antarctica (Reference Jouzel and MerlivatJouzel and Merlivat, 1984 and references therein). Using such a relationship between condensation temperature and surface temperature leads to a difference of a factor of two, at least, between the modeled and the measured gradients Δ(δ18O)/ΔT Δ(17O-excess)/ΔTand Δ(d-excess)/ΔT where Tis the surface temperature.
Many factors can explain the differences between model and observations. First, based on balloon sounding measurements of the temperature of the inversion layer at the seasonal scale over almost 30 years (1963–91), Reference EkaykinEkaykin (2003) estimated that at Vostok the slope of the seasonal relationship between near-surface and condensation temperatures may be only _0.32. From this relationship, the modeled gradients Δ(δ18O)ΔT, Δ(17O-excess)ΔTand Δ(d-excess)ΔTcan be calculated as 0.54%8C–1, 1.1 per meg 8C–1 and –0.93%8C–1, respectively.
The second potential problem is that our model considered constant climatic conditions (relative humidity, temperature, etc.) for the oceanic source regions. This is obviously not correct, since relative humidity and temperature are not constant at the ocean surface throughout the year. This effect has a strong influence on polar snow 17O- excess and d-excess. Indeed, at Vostok, Risi and others (2010a) and Reference WinklerWinkler and others (2011) estimated variations of 17O-excess in polar snow with relative humidity at the source of ~1 per meg%-1, and variations of d-excess in polar snow with Tsource of ~1.5% °C-1. Moreover, the location of Vostok's oceanic source regions changes over the year, as was shown by retrotrajectory analyses (Reference Sodemann, Schweirz and WernliSode-mann and others, 2008;Reference Sodemann and StohlSodemann and Stohl, 2009). First, the sources of water vapor precipitating at Vostok are mainly from the austral ocean in winter, while there is a possible contribution of recycling over Antarctica in summer (Reference WinklerWinkler and others, 2011). Second, Reference Ekaykin, Lipenkov and HondohEkaykin and Lipenkov (2009) noted that the observed seasonal cycle of d-excess at Vostok can be explained if we suggest that the weighted source temperature is 1.58C lower in summer than in winter, likely due to reduced sea-ice coverage around Antarctica, so that the region of evaporation is extended to higher latitudes. The significance of these additional effects is that it is not possible to quantitatively predict the seasonal variations of δ18O, 17O-excess and d-excess with the MCIM considering only one trajectory and one constant moisture source. Thus, the next step should be to use water-isotope tagging in Atmospheric General Circulation Models (AGCMs) to quantify the different influences on δ18O, d-excess and 17O-excess seasonal variations. There have been some attempts to incorporate δ18O and dD in such models (e.g. Reference Hoffmann and HeimannHoffmann and Heimann, 1993; Reference Risi, Landais, Bony, Masson-Delmotte, Jouzel and VimeuxRisi and others, 2010b). However, until now, while these models are able to reproduce the relative evolution of d-excess with respect to d18O in polar regions as the MCIM does (e.g. Reference Schmidt, Hoffmann, Shindell and HuSchmidt and others, 2005; Reference Risi, Landais, Bony, Masson-Delmotte, Jouzel and VimeuxRisi and others, 2010b), they are still not able to simulate the extremely cold conditions of central East Antarctica, nor the observed d-excess changes over time.
4.3. Implications for interpretation of water isotopic records from Antarctic ice cores
The results obtained for 17O-excess variations over the seasonal cycle are instructive with respect to the 17O-excess change of ~20 per meg at Vostok between the Last Glacial Maximum and the early Holocene. As shown in Figure 5, the relative change in 17O-excess vs S18O observed over the last deglaciation in Vostok (3.8 per meg%o-1) is of the same order of magnitude as the relative change in 17O-excess vs δ18O over the Vostok seasonal cycle (2.96 per meg%o-1). From this similarity, it is tempting (as suggested by Reference MillerMiller, 2008) to conclude that the observed change in 17O-excess over the last deglaciation in Vostok could be interpreted as a local temperature effect, and not as a climatic signal from the source region.
Water isotopic measurements over the last 150 ka on the Vostok ice core. The bold grey lines show the measured profiles after a five-point average (raw data for d18O and d-excess are from Reference Vimeux, Masson, Jouzel, Stievenard and PetitVimeux and others, 1999; raw data for 17O-excess are from Reference Landais, Barkan and LuzLandais and others, 2008a). The bold black lines display the d18O and dexcess profiles after correction for the change in δ18O of the global ocean of 1% over glacial–interglacial periods, but no correction is needed for 17O-excess. The bold red lines account for the d-excess and 17O-excess after they were corrected by the observed seasonal tendencies Δ(17O-excess)Δ(δ18O) (2.96 per meg%–1) and (d-excess)Δ(δ18O) (–0.91%%–1).

In Figure 5 together with the measured δ18O and d-excess values, we present the corresponding values corrected (using the formulas given in Reference JouzelJouzel and others, 2003) for the observed change in δ18O of the global ocean (δ18Osw) of 1% over glacial-interglacial periods (Reference WaelbroeckWaelbroeck and others, 2002). No corrections for δ18Osw are needed for 17O-excess (Luz and Barkan 2010; Reference Risi, Landais, Bony, Masson-Delmotte, Jouzel and VimeuxRisi and others, 2010a). Then, 17Oexcess and d-excess values were corrected for the observed trends over the seasonal cycle: Δ(17O-excess)Δ(δ18O) = 2.96 per meg%–1 and Δ(d-excess)Δ(δ18O) =–0.91%%.
The residual signal (red line in Fig. 5) does not show a significant increase of 17O-excess over the deglaciation, but clearly evidences a minimum at ~50 ka BP. Such a flat 17Oexcess signal over the deglaciation is in good agreement with the small or non-existent increasing 17O-excess trends observed over the same climatic transition in more coastal ice cores over Antarctica (Reference WinklerWinkler and others, 2011). This confirms the interpretation proposed by Reference WinklerWinkler and others (2011) that the Vostok site has a too remote location in East Antarctica, preventing the confident use of 17O-excess for reconstructing past relative humidity. For such sites, the influence of local temperature on 17O-excess should be taken into account. This can best be done by combining surface measurements and isotopic modeling as presented in this paper.
The same comparison between seasonal and glacial– interglacial changes can be drawn for d-excess. The residual d-excess signal after the two corrections (red line in Fig. 5) is very different from the original one. We note particularly that after corrections the 41 ka obliquity cycles, generally observed on d-excess long records from ice cores from East Antarctica and Greenland (Reference Vimeux, Masson, Jouzel, Stievenard and PetitVimeux and others, 1999; Reference Uemura, Yoshida, Kurita, Nakawo and WatanabeUemura and others, 2004; Reference Masson-DelmotteMasson-Delmotte and others, 2005; Reference StenniStenni and others, 2010), disappear. We also observe a strong increase of d-excess by >4% leading the last deglaciation by 10 ka. This trend cannot be explained simply by a change in the temperature of the oceanic source region unless we suggest that the source regions move northward at that period. However, at present we have no evidence for such a change in the location of the oceanic source region.
Finally, we should be cautious when comparing changes in 17O-excess and d-excess at the seasonal cycle with those over the last climatic cycle. Possible limits of this analogy are (1) a change of seasonality of the precipitation over the last climatic cycle and/or (2) a change in the source regions or of the trajectory of the water mass over the seasonal cycle. To go further on the use of the seasonal cycle data for interpretation of ice-core profiles, more complete studies, including meteorological datasets and back-trajectory analysis, should be drawn on the seasonal scale, and modeling experiments on past periods should be launched using an AGCM including water isotopes.
5. Conclusion and Perspectives
The first measurements of 17O-excess on an event basis over 1 year at the remote East Antarctic station of Vostok showed a strong correlation between 17O-excess and δ18O, with seasonal variations of 17O-excess larger than 40 per meg. In contrast, a clear anticorrelation is observed between d- excess and δ18O at the same timescale, with seasonal variations of d-excess of the order of 20%. The correlation of 17O-excess and anticorrelation of d-excess with δ18O could easily be explained by taking into account the relative proportion of kinetic to equilibrium fractionation at solid precipitation in a MCIM. In a classical approach their proportion is regulated using the supersaturation function, S, related to the condensation temperature Tcond. Our results are best fitted with S =1 -0.004Tcond. However, while this approach successfully explains the relationships between 17O-excess, d-excess and δ18O, it fails to simulate correctly the link between the surface temperature and the isotopic composition of water. In this case, the model predicts too strong an influence of temperature on δ18O, d-excess and 17O-excess. At least two effects can explain this discrepancy: (1) a particular link between inversion and surface temperature at Vostok and/or (2) seasonal changes in the source (i.e. evaporative regions) climatic conditions.
Our first results of 17O-excess of precipitation over a whole year at Vostok station have important applications for paleoclimate reconstruction from deep ice cores, especially the Vostok core:
-
1. The 17O-excess increase observed over the deglaciation on the Vostok ice core can be explained by a balance of kinetic to equilibrium fractionation at solid precipitation in very cold sites in Antarctica. The tuning of supersaturation dependency to temperature is critical for interpreting the 17O-excess changes with S18O in these regions. The 17O-excess of polar ice cores should not be used to reconstruct source relative humidity in remote locations, but rather in coastal regions, where the influence of supersaturation on 17O-excess local variations is weak.
-
2. The large variations of 17O-excess and d-excess during a year suggest that a change of the seasonality of the precipitation with time (e.g. over the deglaciation) strongly influences the mean level of 17O-excess and d-excess archived in the ice core. Thus, it is essential to consider the seasonality issue when interpreting water isotopic composition in polar ice cores.
At present, we have no clear quantitative explanation for the link between local temperature and water isotopic composition at Vostok, and this calls for the following future studies:
-
1. Meteorological studies are required to enable us (1) to quantify the relationship between condensation, inversion and surface temperatures and (2) to trace the origin of the precipitation through back-trajectories at the event, seasonal and interannual scale.
-
2. Mean annual levels of 17O-excess should be measured at very remote sites in East Antarctica (e.g. Dome A, Dome F) in order to check if the correlation observed between 17O-excess and δ18O at the seasonal scale is also seen spatially.
In conclusion, there is no doubt that combining 17O-excess and d-excess measurements in East Antarctica is essential to document climate and paleoclimate through model-data approaches. This first study should be used as a benchmark for AGCM experiments including water isotopes.
Acknowledgements
We are grateful to M. Miller for his suggestion to carry out 17O-excess measurements of the samples collected over 1 year at Vostok. We thank Viktor Persky, the meteorologist of the 44th Russian Antarctic Expedition, for careful work collecting the precipitation samples in the harsh winter conditions of Vostok station. The two reviewers (James Farquhar and an anonymous reviewer) are warmly thanked for useful comments. A.E. was supported by Russian Foundation for Basic Research grant 10-05-93106. The work at Hebrew University was supported by Israel Science Foundation grant No. 26/10. The work at LSCE was supported by the ANR CITRONNIER and the Marie Curie Initial Training Network INTRAMIF (FP7). This is LSCE publication No. 4722.



