

Introduction
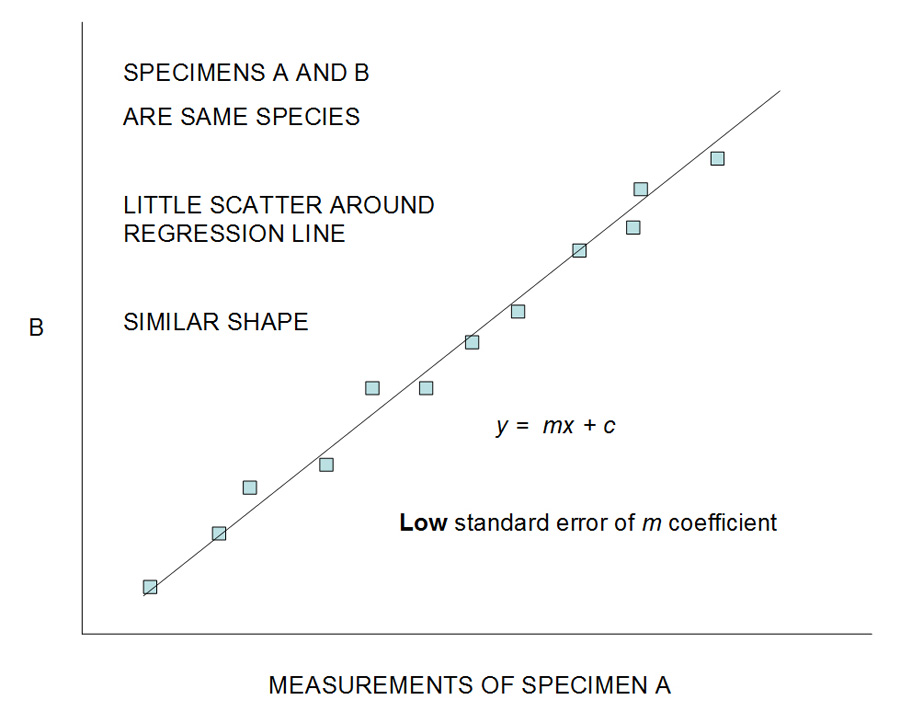
In a comparison between measurements of two specimens of the same species, there is little scatter around the regression line, and a low standard error of the m-coefficient (s.e.m) where m is the slope of the regression line associated with the general equation y = mx + c. The degree of scatter reflects the degree of similarity in shape of the two specimens. Little scatter reflects similarity in shape of the two conspecific specimens.

Reference DarwinDarwin (1871) recognised that Africa was the continent from which humans originated. This suggestion was based not on fossils but on comparative anatomy of modern primates. Of all the living primates, it is the African chimpanzee (Pan) and Gorilla that are most similar to Homo in terms of gross anatomy. The discovery of Australopithecus africanus at Taung in southern Africa in 1924, described by Raymond Reference DartDart (1925), supported Darwin's statement regarding an African origin for humanity. Robert Broom described Paranthropus robustus as another hominin from the South African site of Kromdraai (Reference BroomBroom 1938; Broom & Schepers 1946), and additional specimens of A. africanus were discovered by Reference BroomBroom (1947) at Sterkfontein. Broom & Robinson (1949, 1950) reported the presence of Telanthropus, later recognised as early Homo, at Swartkrans in Early Pleistocene contexts. Initially it was possible to 'pigeon-hole' new hominin discoveries into discrete genera and distinct species, but with the discovery of additional specimens from South Africa as well as Ethiopia, Kenya, Tanzania, Malawi and Chad, boundaries between species and even between genera have become questionable. There is clearly a need for an approach whereby the degree of similarity between specimens can be re-assessed in the context of a species definition which is applicable to hominin fossils.
In this study, similarity indices based on pair-wise comparisons of measurements of African Plio-Pleistocene hominin crania are calculated using least squares linear regression analysis of cranial dimensions (Reference ThackerayThackeray 1997, 2007; Thackeray et al. 1997; Aiello et al. 2000). The approach is related to a statistical (probabilistic) definition of a species (Reference ThackerayThackeray 2007), associated with the degree of scatter around the regression line, quantifiable by means of the s.e.m statistic which is the standard error of the m-coefficient related to equations of the form y = mx + c (Figure 1).
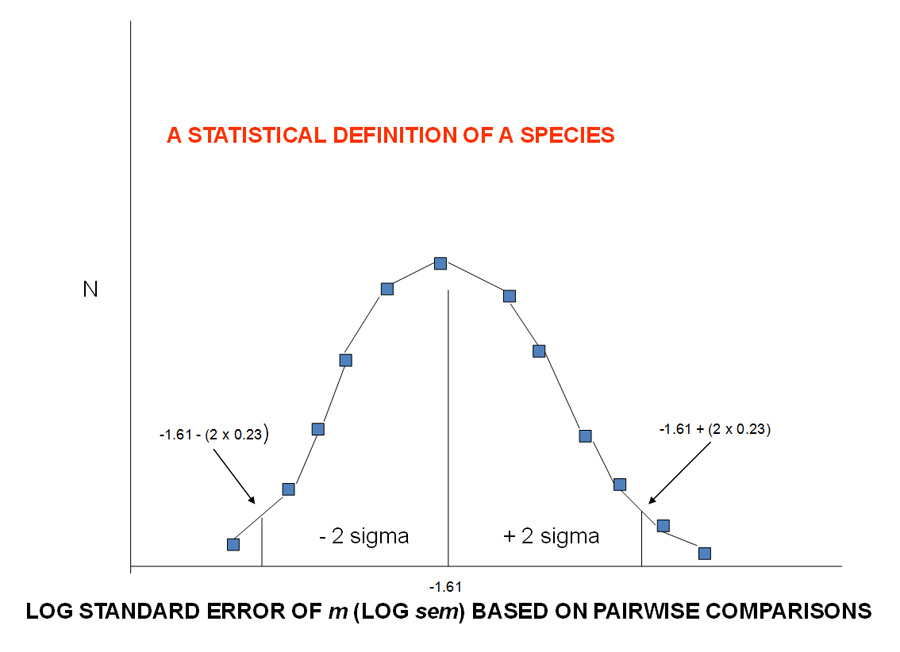
Log normal distribution of s.e.m values. The mean log s.e.m = ‑1.61 (±0.23) is based on 1424 specimens. This constitutes a statistical (probabilistic) definition of a species.
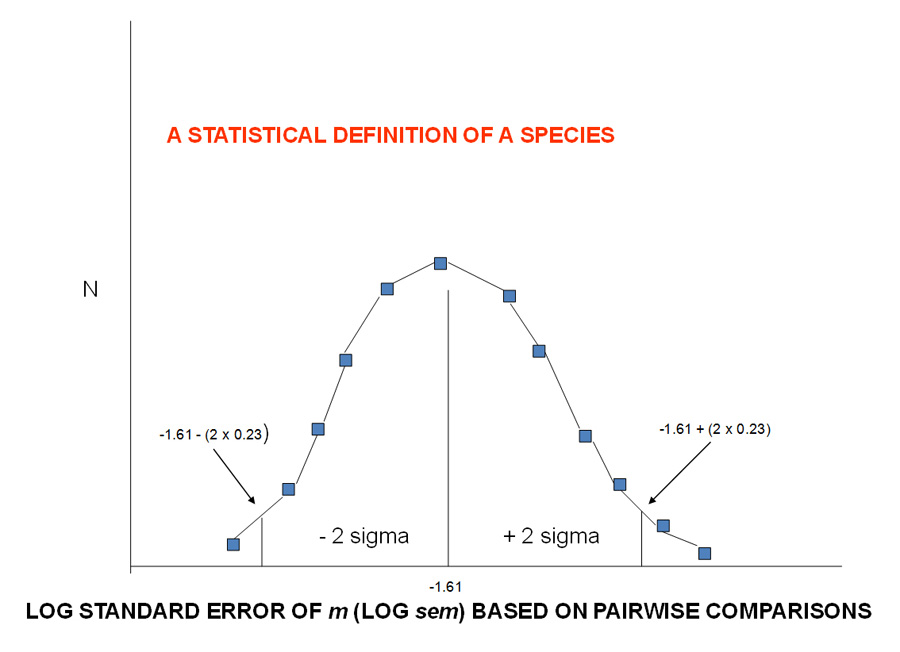
In the case of many pair-wise comparisons of measurements obtained from modern vertebrate (mammals, birds, reptiles) and invertebrate (Lepidoptera and Coleoptera) species, it was found that log-transformed s.e.m statistics display a normal distribution around a mean value of ‑1.61 (±0.23, n=1424 specimens; Reference ThackerayThackeray 2007) (Figure 2). The sample included closely related taxa, for which relatively low log s.e.m values were calculated.
A mean log s.e.m value of ‑1.44±0.17 (n = 90 pairwise comparisons) has been obtained when pairwise comparisons are made between specimens of Pan troglodytes schweinfurthii and Pan troglodytes troglodytes (chimpanzee subspecies). These are closely related taxa (two subspecies of chimpanzee, the species Pan troglodytes). The log s.e.m value for pairwise comparisons between these subspecies is consistent with the fact that they are conspecific, relative to the mean log s.e.m value of ‑1.61±0.2 obtained from more than 1400 conspecific pairs (Thackeray & Prat 2009).
Reference ThackerayThackeray (2007) suggested that the log s.e.m value of ‑1.61 approximates a biological species constant (T) for species across evolutionary time and geographical space. The standard deviation (±0.23) around the mean value of ‑1.61 allows one to make comparisons with data obtained from fossil hominin specimens.
In other studies (e.g. Cofran & Thackeray 2010), a similar approach was used whereby STET values were calculated, taking into account comparisons between specimen A against B, and B against A in regression analyses. In this study, however, log s.e.m statistics are obtained from Early Pleistocene adult hominin specimens, whereby measurements of specimen A (on the x axis) are compared to measurements of specimen B (on the y axis), and vice versa, with log s.e.m values from both of these regressions being incorporated in a matrix of comparisons. The results can be examined to try to identify patterns in the degree of similarity between specimens.
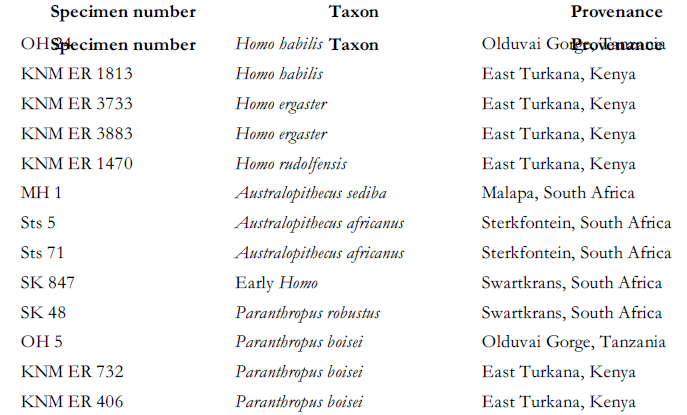
Where possible, more than 50 cranial measurements based on anatomical landmarks have been used in this study, based on data published by Reference WoodWood (1991) and Berger et al. (2010). The measurements have been analysed by means of least squares linear regression analysis in pair-wise comparisons. A low degree of scatter around a regression line, associated with the general equation y = mx + c, reflects a high degree of morphological similarity between pairs of specimens. The degree of scatter, quantified in terms of the standard error of the m-coefficient (s.e.m), reflects variability in shape, whereas the m-coefficient is a reflection of size. This technique has been applied to extinct hominin specimens attributed to Australopithecus africanus, A. sediba, Homo habilis, H. rudolfensis, H. erectus or H. ergaster as well as to robust australopithecines Paranthropus boisei and Paranthropus boisei. A list of specimens included in this study is given in Table 1.

Results
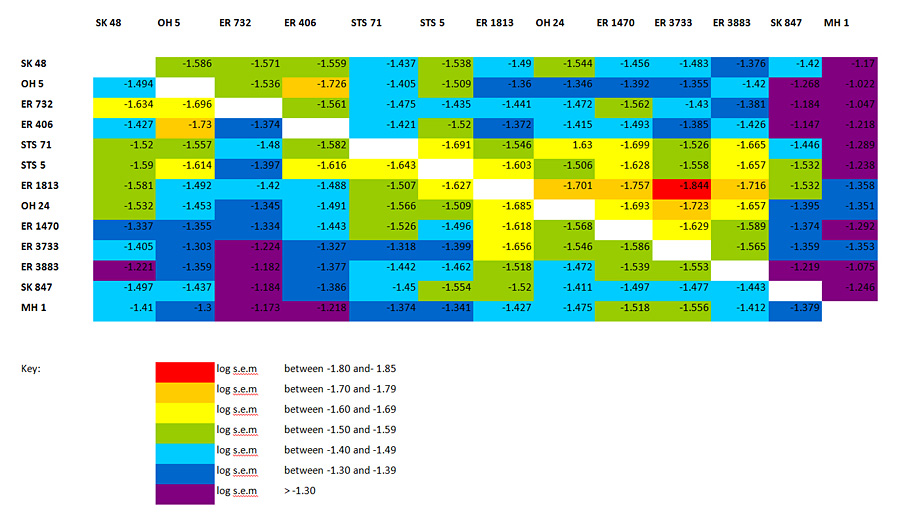
Figure 3 presents a matrix of log s.e.m values obtained from pair-wise comparisons. The results, reflecting degrees of similarity in shape and controlling for variability in size, are colour-coded in a spectrum such that red reflects a high degree of similarity, whereas purple reflects a low degree of similarity between specimens.
Discussion
Although there is no symmetry in this matrix based on comparisons of specimens A against B, and B against A, a high degree of similarity is obtained for comparisons between the relatively small cranium of KNM-ER 1813 (x axis) compared against the larger specimen KNM-ER 3733 (y axis), and vice versa, despite differences in size and despite the fact these specimens have been attributed to H. habilis and H. ergaster respectively. It has been suggested that KNM-ER 1813 is a female and that KNM-ER 3733 is a male of the same species (Odes & Thackeray 2012). Both date to about 1.6 million years ago, from Kenya.
High degrees of similarity are also obtained between KNM-ER 1813 (attributed to H. habilis) and KNM-ER 1470 (attributed to Homo habilis or H. rudolfensis). Sts 5 (Australopithecus africanus) and KNM-ER 1813 (H. habilis) are also very similar in terms of log s.e.m statistics.
The high degree of similarity (log s.e.m = ‑1.643) between Sts 5 (x axis) and Sts 71 (y axis), and between Sts 71 (x axis) and Sts 5 (y axis) where log s.e.m = ‑1.691, indicates that there is a high probability that these two specimens from Sterkfontein are conspecific, representing Australopithecus africanus.
Australopithecus sediba has recently been described as a new hominin species with Homo-like characteristics (Berger et al. 2010), dated to 1.98 million years ago (Pickering et al. 2011). In terms of log s.e.m statistics, MH1 (the type specimen of A. sediba) is different from other specimens, but is most similar to KNM-ER 3733, KNM-ER 1813 and OH 24 which have been placed in the genus Homo, although KNM-ER 1813 and OH 24 have been considered by some to better placed in Australopithecus (Wood & Collard 1999). MH1, incorporating a mosaic of characteristics found in specimens attributed to Australopithecus and Homo, reflects the lack of a clear boundary between the two genera.
Conclusion
A matrix of log s.e.m values reflecting a spectrum of variability in the degree of similarity between Early Pleistocene hominin crania from South and East Africa. The degree of similarity is colour-coded (red–high degree of similarity, associated with a high probability of conspecificity; purple–lower degree of similarity, associated with a lower probability of conspecificity).

In the Early Pleistocene in Africa, at least three hominin genera are represented: Australopithecus, Paranthropus and Homo. There is a lack of consensus regarding the taxonomy and phylogeny of specimens attributed to one or other of these genera. In this study we have used a statistical (probabilistic) definition of a species based on least squares linear regression analysis of measurements of modern species. The degree of scatter around the regression line is quantified using the s.e.m statistic (the standard error the m-coefficient associated with equations of the form y = mx + c). On the basis of measurements obtained from pairs of recognisable modern species, log-transformed s.e.m statistics display a normal distribution around a mean of ‑1.61±0.23. Our matrix of log s.e.m statistics based on pair-wise comparisons of Early Pleistocene crania (Figure 3) confirm the lack of clear boundaries between species, indicating a spectrum of variability in cranial morphology, changing through evolutionary time and geographical space on the African continent in the Plio-Pleistocene.
In the context of these results, it is pertinent to quote Buffon (1749: 150) who noted that variation may occur "from one species to another, and often from one genus to another, with imperceptible nuances" (from the first English translation of Premier Discours of Histoire Naturelle). Further, one may assess the results of this study in the context of the statement by Locke in 1689 (Book III, Part vi): "the boundaries of the species, whereby men sort them, are made by men" (see also Reference CainCain 1997).
Taken together, the data in the matrix presented in Figure 3 can be regarded as a first attempt to address the concept of a chronospecies using log s.e.m values, recognising that there are no clear boundaries between Early Pleistocene hominin taxa. We refer to this approach as palaeo-spectroscopy, and appeal for its application to address the problem of morphological changes through evolutionary time, associated with anagenesis, without relying on the Linnaean binomial system of nomenclature.
Acknowledgements
Francis Thackeray expresses his sincere appreciation to Professor Michel Brunet for the opportunity to present this paper at the historic N'Djamena colloquium in Chad in 2011. We thank George Ellis, Peter Knox-Shaw and an anonymous referee for their comments. We are grateful to Bernard Wood and Lee Berger for making measurements of crania accessible in published tables. This research has been supported by the National Research Foundation, the Andrew W. Mellon Foundation and the French Embassy in South Africa.