


1. INTRODUCTION
The behaviors of the Greenland and Antarctic ice sheets play fundamental roles in global climate change. Global warming causes ice sheets to flow and melt with subsequent sea level rise. Although ice-sheet flow is generally considered on large spatial and temporal scales, the importance of ice microstructure in relation to the flow has been recognized and investigated (e.g., Faria and others, Reference Faria, Weikusat and Azuma2014b). The flow law of coarse-grained polycrystalline ice has been investigated comprehensively through many laboratory-based mechanical experiments (Glen, Reference Glen1955; Jacka, Reference Jacka1984; Jacka and Maccagnan, Reference Jacka and Maccagnan1984; Budd and Jacka, Reference Budd and Jacka1989; Treverrow and others, Reference Treverrow, Budd, Jacka and Warner2012). It has been established that the steady-state strain rate is found to be proportional to the power of stress at low stresses. Typically, the power law relationship is expressed as:
 $$ \dot{\varepsilon} \propto A{\displaystyle{\sigma^n} \over {d^p}} \exp \left(- {\displaystyle{Q} \over {RT}} \right), $$
where  $\dot {\varepsilon }$ is the strain rate, A is a deformation parameter (flow-enhancement factor), σ isthe stress, n is a stress exponent, d is the grain size, p is a grain size exponent, Q is the activation energy, R is the gas constant and T is the absolute temperature. Deformation of isotropic polycrystalline ice at low stresses can be described by this simple power law. However, the flow law of an actual ice sheet is complicated further by various factors such as the local distribution of dissolved and undissolved impurities (microparticles) originated from volcanic ash, sea salt and other sources, and the mechanical anisotropy derived from the c-axis orientation of the ice.
Various analyses of ice cores have revealed that ice-age ice has finer ice grains and frequent cloudy bands (ice layers with turbid appearance), in comparison with ice formed more recently (Paterson, Reference Paterson1991; Thorsteinsson and others, Reference Thorsteinsson, Kipfstuhl, Eicken, Jonsen and Fuhrer1995; Faria and others, Reference Faria, Weikusat and Azuma2014a). For example, Thorsteinsson and others (Reference Thorsteinsson, Kipfstuhl and Miller1997) reported the mean grain size of Holocene ice is ≈ 4 mm, while that of Wisconsin ice is ≈ 2 mm in the ice core of the Greenland Ice Core Project. Detailed analysis of ice-age ice has revealed high concentrations of dissolved impurities and large amounts of microparticles compared with Holocene ice (e.g., Paterson, Reference Paterson1991). Impurities in polycrystalline ice restrict grain growth drastically via drag at the grain boundaries (GBs) (Alley and Woods, Reference Alley and Woods1996) and pinning (Kubo and others, Reference Kubo, Nakata and Kato2009), which is known as the Zener pinning effect. Focusing on the remarkable microstructures of the cloudy bands, Miyamoto and others (Reference Miyamoto1999) used samples of the Greenland Ice Core Project deep ice core to investigate ice-flow behavior via laboratory-based uniaxial compression tests. They found that specimens with cloudy band structures exhibited extremely rapid deformation (a large value of the flow-enhancement factor). Although the detailed mechanism of this rapid deformation remains unclear, they suggested that the cloudy bands could affect the deformation of ice-sheet ice. Rapid deformation of ice-age ice has also been observed in the Dye 3 ice core in both field measurements (Dahl-Jensen and Gundestrup, Reference Dahl-Jensen and Gundestrup1987) and laboratory experiments (Shoji and Langway, Reference Shoji and Langway1987). These studies found that the strain rate of ice-age ice is greater than Holocene ice by a factor of 2.5 in the Dye 3 ice core (Paterson, Reference Paterson1991).
It has been considered that a dominant deformation mechanism of ice-sheet ice that comprises ice grains with sizes of the order of 1 mm could be grain-insensitive dislocation creep (n = 3 and p = 0 in Glen's flow law) (e.g., Cuffey and Paterson, Reference Cuffey and Paterson2010). However, contributions by grain-size-sensitive deformation such as diffusional creep, GB sliding and superplastic flow have been suggested recently (Goldsby and Kohlstedt, Reference Goldsby and Kohlstedt1997, Reference Goldsby and Kohlstedt2001; Cuffey and others, Reference Cuffey2000). The ice-sheet conditions of Greenland and Antarctica are located within the boundary zone between dislocation and diffusional creep on the deformation mechanism map (e.g., Goodman and others, Reference Goodman, Frost and Ashby1981; Duval and others, Reference Duval, Ashby and Anderman1983); therefore, the influences of diffusion and GBs are considered important regarding the deformation processes of the ice-sheet ice. The rapid deformation of ice-age ice with fine grains could possibly provide a substantial proportion of the contribution of grain-size-sensitive deformation (Faria and others, Reference Faria, Weikusat and Azuma2014b). Using artificial polycrystalline ice, Goldsby and Kohlstedt (Reference Goldsby and Kohlstedt1997, Reference Goldsby and Kohlstedt2001) indicated that GB sliding or superplastic flow appears when ice grains are extremely fine (8–200 μm). They identified that GB sliding accommodates dislocation glide when n = 1.8. However, Montagnat and Duval (Reference Montagnat and Duval2000) argued that GB sliding could not be a dominant mechanism of ice-sheet ice deformation because the development of fabrics derived from intracrystalline dislocation glide cannot be explained by GB sliding. The lack of variation of microstructure and strain rate reported in Goldsby and Kohlstedt (Reference Goldsby and Kohlstedt1997, Reference Goldsby and Kohlstedt2001) reflects the lack of basic knowledge regarding GB sliding and GB diffusion of polycrystalline ice, and the poor understanding of the relationship between GBs and dislocation movement. In grain-size-sensitive deformation, impurities seem to play important roles because they can constitute fine-sized grains.
The effect of impurities on the mechanical properties of polycrystalline ice has been investigated in many laboratory experiments that have considered both dissolved impurities (e.g., Jones and Glen, Reference Jones and Glen1969; Cullen and Baker, Reference Cullen and Baker2001; Durand and others, Reference Durand2006; Hammonds and Baker, Reference Hammonds and Baker2016) and microparticles (Hooke and others, Reference Hooke, Dahlin and Kauper1972; Baker and Gerberich, Reference Baker and Gerberich1979; Durham and others, Reference Durham, Kirby and Stern1992; Song and others, Reference Song, Cole and Baker2005, Reference Song, Baker and Cole2008). However, the influence of microparticles remains highly obscure, with conflicting results reporting for both softening and hardening of particle-dispersed artificial ice (Cuffey and Paterson, Reference Cuffey and Paterson2010). Softening of artificial polycrystalline ice due to particle dispersion has been observed by Song and others (Reference Song, Cole and Baker2005, Reference Song, Baker and Cole2008). They considered samples of artificial ice with dispersed silt-sized particles, which were deformed under a load stress of 1.45 MPa at −10°C and 0.4 MPa at −5°C. The mean diameters of the silt particles and ice grains were 50 μm and 5 mm, respectively. It was reported that the deformation rate of granular ice that included mass concentrations of silt-sized particles of up to 4% increased in comparison with particle-free ice. It was concluded that the softening of ice was caused by the increase of mobile dislocation density and activation of recrystallization. Conversely, Hooke and others (Reference Hooke, Dahlin and Kauper1972) reported hardening of artificial polycrystalline ice with high concentrations of sand particles. The sand-dispersed ice was deformed at stresses between 0.53 and 0.64 MPa at temperatures between −7.4 and −9.4°C. The mean diameters of the sand particles and ice grains were 180 and 300–500 μm, respectively. It was argued that the hardening of ice is similar to the dispersion hardening of metals, and that the sand particles surrounded by tangled networks of dislocations impeded the passage of dislocation glide. Both experiments focused on the influence of microparticles on dislocation movement because deformed-ice samples have large-sized ice grains. To the best of our knowledge, little is known about the influence of impurities on grain-size-sensitive deformation. The grain sizes of the ice used in the deformation experiments by Song and others (Reference Song, Cole and Baker2005, Reference Song, Baker and Cole2008) and Hooke and others (Reference Hooke, Dahlin and Kauper1972) were too large for identification of the contribution of GBs. As for the sizes of microparticles, Kubo and others (Reference Kubo, Nakata and Kato2009) revealed that the Zener pinning effect and grain growth restriction become more prominent as the particle size becomes smaller. Actually, substantial numbers of submicron-sized particles are present in the Greenland ice cores (e.g., Steffensen, Reference Steffensen1997). The dispersed particles used in the deformation experiments of Song and others (Reference Song, Cole and Baker2005, Reference Song, Baker and Cole2008) and Hooke and others (Reference Hooke, Dahlin and Kauper1972) were reasonably large (50–180 μm).
This study investigated the influences of microparticles, grain size and GBs on polycrystalline ice deformation via laboratory-based deformation experiments and microstructural observations. The objective was to simulate the deformation mechanisms of ice-sheet ice in laboratory experiments. As strain rates in ice sheets are extremely small, the rate of accumulation of dislocations is considered very slow. For simulation of such deformation mechanisms using coarse-grained ice in a laboratory, experiments with very low stress might be required; however, the duration of such experiments is necessarily extremely long. In high-stress experiments, the deformation mechanisms are considered different from those in actual ice sheets because the rate of accumulation of dislocations might be too great. To resolve these problems and to retain a state of low dislocation density during deformation, we prepared fine-grained ice with many GBs. Fine-grained ice might reduce the rate of accumulation of dislocations because GBs act as sinks of dislocations. Active absorption at GBs might maintain a state of low dislocation density during deformation even if the ice is deformed under high stress. It is difficult to investigate the influence of GBs from deformation experiments using coarse-grained ice because typical dislocation creep is a grain-insensitive process. We can emphasize the influence of GBs on deformation by decreasing the grain sizes down to the order of 10 μm. We focused on the relationship between grain-size-sensitive creep and microparticles using samples of the prepared fine-grained ice. By controlling the ice grain sizes and amounts of dispersed microparticles, we could independently investigate the effect of each on the deformation and microstructural evolution of polycrystalline ice. Based on the findings of the deformation experiments and microstructural observations, we discuss the effects of microparticles and GBs on the deformation of ice-sheet ice, and we propose a possible reason for the observed rapid deformation of ice-age ice.
2. EXPERIMENTAL PROCEDURES
2.1. Sample preparations
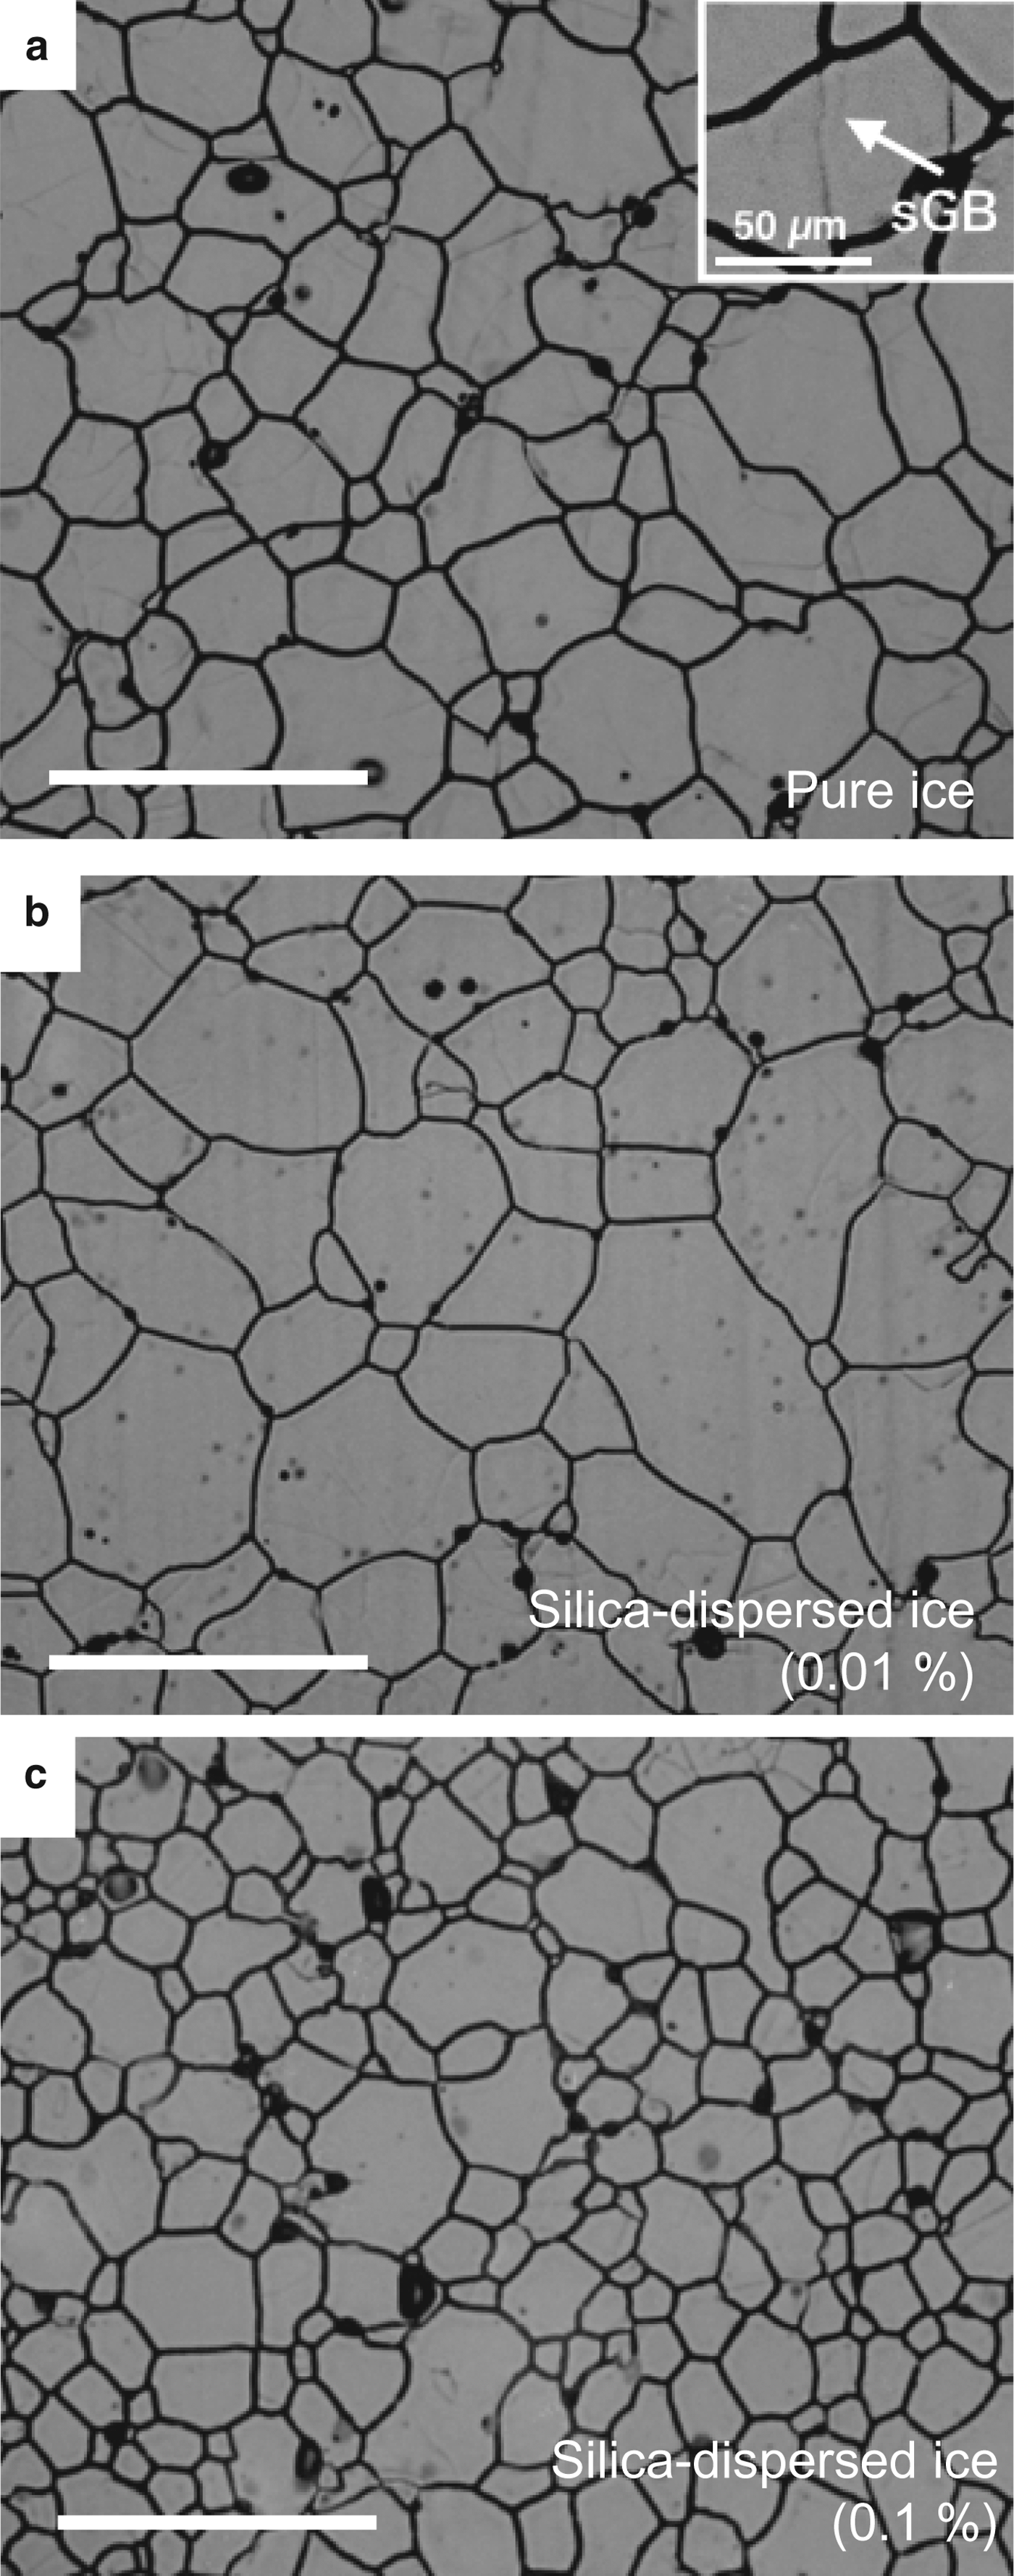
We performed deformation experiments using two types of artificial polycrystalline ice: one with and one without microparticles. Artificial silica particles (Admatechs Co. Ltd.) were used as the microparticles. We made powder ice by spraying ultrapure water (for pure ice samples) and silica-dispersed water (for impure ice samples) into liquid nitrogen, which was then compressed for 1 h under conditions of −10°C and 70 MPa to make solid ice. The diameter of the silica particles was 0.3 μm, and the mass concentrations were 0.01 and 0.1%. After compression of the powder ice, we cut sections from the ice samples for microstructural observation using an optical microscope. Figure 1 shows the initial microstructures of the ice samples, in which the black spots and solid lines reflect air bubbles and GBs, respectively. The GBs in the initial state were straight. Gray-colored thin lines are subgrain boundaries. The mean grain sizes were 60, 58 and 38 μm, and the subgrain boundary densities were 1.1 mm−1 for pure ice, and 0.7 and 0.5 mm−1 for 0.01 and 0.1% silica-dispersed ice, respectively. Here, subgrain boundary density is defined as the sum of all subgrain boundary lengths per unit area (Hamann and others, Reference Hamann, Weikusat, Azuma and Kipfstuhl2007). The smaller mean grain size of 0.1% silica-dispersed ice could be caused by the Zener pinning effect on grain growth during compression preparation. The ice samples were shaped to approximately 30 mm height and 15 mm diameter for the deformation experiments. For the grain-size-sensitive experiments, we changed the compression conditions to control the initial grain size and compression stresses of 40–70 MPa were applied for 1–3 h.
Initial microstructures of thin sections prepared for deformation test: (a) pure ice, (b) silica-dispersed ice with 0.01% and (c) silica-dispersed ice with 0.1%. Black spots represent air bubbles. Scale bar: 200 μm. Enlarged image at upper right in (a) shows subgrain boundary (sGB).
2.2. Deformation experiments and microstructural observations
We conducted uniaxial compression deformation experiments under constant temperature (−5, −10, −20, −30 and −50°C) and load stress (0.2, 0.3, 0.5, 0.7, and 1.0 MPa) in a freezer. Ice samples were placed in a silicone oil bath to prevent sublimation and to maintain the constant temperature. A displacement meter that measured the shortening of the ice samples was attached to the loading stage. Displacement of the ice samples and the temperature of the ambient oil were measured during the experiments. The microstructure of the ice samples was investigated before and after deformation. The GBs were visualized by the sublimation of the ice surface (≈ 15 minutes). The direction of microstructural observation was normal to the compression axis. We measured the mean grain diameter (equivalent round diameter) and the subgrain boundary density of the ice samples using ImageJ (Rasband, Reference Rasband1997) and Photoshop software.
3. RESULTS
3.1. Mechanical properties
Figure 2 shows diagrams of uniaxial compression strain rate (hereinafter strain rate) versus strain at −20°C for each applied load stress. In most experiments, the strain rate continues to decrease even if the total strain exceeds 1%. Unlike previous experiments (Budd and Jacka, Reference Budd and Jacka1989; Treverrow and others, Reference Treverrow, Budd, Jacka and Warner2012), a transition to tertiary creep and an increase of strain rate are not apparent in our results. Comparison examples of ice samples are shown in Fig. 3. At −20°C, the strain rate of 0.1% silica-dispersed ice with an initial grain size of 38 μm is significantly larger than that of both 0.01% silica-dispersed and pure ice. We could not observe a clear difference between the two samples (0.01% silica-dispersed and pure ice) with mean grain size of ≈ 60 μm. However, at −10°C, a clear difference in the strain rate between the 0.01% silica-dispersed and pure ice is evident at large strains (≈ 10%).
Results from deformation experiments ata temperature of −20°C.

Comparison of strain rate variations for ice samples under experimental conditions of: (a) −20°C and 1.0 MPa and (b) −10°C and 0.5 MPa.

Figure 4 shows diagrams of strain rate versus strain at each temperature with a load stress of 1.0 MPa. Similar to Fig. 2, the strain rates continue to decrease. Diagrams of strain rate versus load stress and Arrhenius plot diagrams are shown in Figs 5 and 6, respectively, and experimentally estimated flow-law parameters are presented in Table 1. For the estimation of the flow-law parameters, we used the strain rate measured at 3% of strain, because the minimum strain rate did not appear in our experiments. The stress exponent and activation energy were found to be nearly the same for all experiments. The stress exponent estimated from Fig. 5 was n ≈ 2 at both −10 and −20°C for all samples. The creep activation energy estimated from Fig. 6 is 60–66 kJ mol−1.
Results from deformation experiments at load stress of 1.0 MPa.

Strain rate against load stress at: (a) −10°C and (b) −20°C. Here, the strain rate at 3% strain is used.

Arrhenius plot deformed at: (a) 0.5 MPa and (b) 1.0 MPa. Here, the strain rate at 3% strain is used.

Stress exponent and activation energy estimated from deformation experiments.

3.2. Grain size dependence
We examined the grain size dependence of fine-grained ice deformation by controlling the initial mean grain size by changing the compression conditions for sample preparation. We prepared ice samples with initial mean grain sizes of 30, 38 and 103 μm for 0.1% silica-dispersed ice, 58 and 91 μm for 0.01% silica-dispersed ice, and 39, 60, 83 and 107 μm for pure ice. Figure 7 shows the strain rates at 3% strain against initial grain size when the ice was deformed under conditions of −20°C and load stress of 1.0 and 0.5 MPa. The mean grain sizes at 3% strain are almost the same as the initial values. The grain size exponent was p ≈ 1.4 for both 1.0 and 0.5 MPa experiments.
Grain size dependence of strain rate under experimental conditions of −20°C and load stress of 1.0 and 0.5 MPa. The strain rate at 3% strain is shown.

3.3. Microstructures
Microstructures of the deformed samples are shown in Fig. 8. Air bubbles (black spots) are apparent at the GBs during deformation. The thick and thin lines in the figure represent GBs and subgrain boundaries, respectively. It can be seen that the boundaries of ice grains are not irregular but relatively straight. Quantitative parameters analyzed from the microstructures of ice samples before and after deformation (10% strain) are shown in Table 2 for the experimental conditions of −20°C at 1.0 MPa and −10°C at 0.5 MPa. The mean grain sizes of samples deformed at −20°C until 10% strain are 62, 58 and 40 μm for pure ice and for 0.01 and 0.1% silica-dispersed ice, respectively, which are close to the initial values (60, 58 and 38 μm). However, the mean grain sizes of samples deformed at −10°C until 10% strain show a clear increase from the initial values, 73, 64 and 49 μm for pure ice, and for 0.01 and 0.1% silica-dispersed ice, respectively. The subgrain boundary densities increased during the deformation experiments at both −20 and −10°C, 2.0, 2.4 and 1.1 mm−1 at −20°C and 1.3, 1.6 and 0.8 mm−1 at −10°C for pure ice, and 0.01 and 0.1% for silica-dispersed ice, respectively. In particular, the subgrain boundary densities of the samples deformed at −20°C are more than double the initial values. Grain size distributions before and after the deformation tests are shown in Fig. 9 for ice deformed at −20°C with load stress of 1.0 MPa until 10% strain. There is almost no difference in the grain size distributions prior to and after deformation in all samples.
Microstructures deformed at −20°C and load stress of 1.0 MPa. The samples were deformed until ≈ 10% strain. Scale bar: 200 μm.

Grain size distributions of initial (gray bars) and deformed (open black line bars) ice samples: (a) pure ice, (b) silica-dispersed ice with 0.01% and (c) silica-dispersed ice with 0.01%. Samples were deformed under conditions of −20°C and load stress of 1.0 MPa until 10% strain.

Results from microstructural observations for initial and deformed ice samples. (sGB means subgrain boundary.)

4. INTERPRETATIONS AND DISCUSSIONS
4.1. Deformation mechanism of fine-grained ice
We observed continuous decrease of the strain rate with increasing strain during deformation of the investigated ice samples. This could be related to work hardening due to dislocation glide and pile-up. In typical laboratory experiments using coarse-grained ice, the strain rate is enhanced in the tertiary creep region when the strain exceeds 1–2% because of activation of dynamic recovery and recrystallization processes (Budd and Jacka, Reference Budd and Jacka1989; Treverrow and others, Reference Treverrow, Budd, Jacka and Warner2012). However, in our experiments, the strain rate continues to decrease even if the total strain exceeds 3%. The strain rates of our fine-grained ice are 1–2 orders of magnitude larger than found in previous studies using coarse-grained ice. For example, Jacka and Li (Reference Jacka, Li and Hondoh2000) reported strain rates ranging from 10−10 to 10−8 s−1 at −19°C with octahedral stresses of 0.1–0.8 MPa, whereas the strain rates of our fine-grained ice range from 10−8 to 10−6 s−1 at −20°C with load stresses of 0.2–1.0 MPa.
When dislocation movement dominates the deformation,  $\dot {\varepsilon }$ is described by the Orowan equation: $\dot {\varepsilon } \propto b \rho v$, where b is the Burgers vector, ρ is the dislocation density, and v is the average dislocation velocity (Weertman, Reference Weertman1983). When the dislocations are saturated, the density is proportional to the square of σ. As the average dislocation velocity is proportional to σ, a power-law creep relation of $\dot {\varepsilon }$ ∝ σ3 is derived. The value of n might vary with the crystal texture and deformation conditions: e.g., n = 1−2 for a single crystal and n = 4 for high-stress deformation; however, the assumption n = 3 is used widely in modeling of ice-sheet flow (e.g., Goldsby and Kohlstedt, Reference Goldsby and Kohlstedt2001; Cuffey and Paterson, Reference Cuffey and Paterson2010; Faria and others, Reference Faria, Weikusat and Azuma2014b). The stress exponent of our fine-grained ice was n ≈ 2 in both the −20 and the −10°C experiments for all investigated samples. As shown by the fact that the strain rate continues to decrease as the strain increases, the deformation mechanism of fine-grained ice is different from typical dislocation creep, often associated with n = 3.
We investigated the contribution of dislocation movement to deformation through microstructural observations. In our experiments, the subgrain boundary densities of the deformed samples increased (Table 2). A subgrain boundary is formed by dislocation glide and the climb of pile-up dislocations during recovery. Taking the increase of subgrain boundary density into consideration, dislocation glide could contribute to the deformation of fine-grained ice. As for the morphology of GBs, the ice grains of the deformed samples are nearly equiaxial and the GBs are rather straight. Furthermore, as shown in Fig. 9, the grain size distribution remains largely unchanged during deformation, and very fine grains (which could be potentially new nuclei) are rare. These results imply minimal accumulation of strain energy. When ice deforms under the dislocation creep mechanism, GBs sometimes become irregularly shaped because of strain-induced boundary migration, which is a recrystallization process driven by the minimization of the stored strain energy with dislocation (Hamann and others, Reference Hamann, Weikusat, Azuma and Kipfstuhl2007; Faria and others, Reference Faria, Weikusat and Azuma2014b). Such irregular GBs are well observed in ice-sheet ice (e.g., Kipfstuhl and others, Reference Kipfstuhl2006). Our straight boundaries and unchanged size distributions suggest that the amount of stored strain energy for boundary migration remains small. Duval (Reference Duval and Hondoh2000) argued that transition to tertiary creep is not initiated without boundary migration. Continuous decrease in the strain rate of our fine-grained ice is likely caused by the absence of boundary migration recrystallization. A similar trend was observed in the experiments by Jacka and Li (Reference Jacka, Li and Hondoh2000), who found no increase in strain rate between 1 and 7% strain in an experiment witha stress of 0.2 MPa at −21°C.
The deformation mechanism of fine-grained ice without microparticles has been investigated by Goldsby and Kohlstedt (Reference Goldsby and Kohlstedt1997, Reference Goldsby and Kohlstedt2001) using experimental procedures similar to our experiments (sample preparation and test conditions). Goldsby and Kohlstedt (Reference Goldsby and Kohlstedt1997, Reference Goldsby and Kohlstedt2001) suggested the occurrence of superplastic deformation characterized by n = 1.8 when fine grains are deformed under conditions of high temperature and low stress. They claimed that GB sliding is a rate-controlling process under such a regime, which accommodates dislocation glide. We obtained similar results in our experiments. However, the deformation mechanism of our fine-grained ice is probably different from the GB sliding mechanism. In our experiments, decreases of strain rate were observed across the entire strain range, even in the low-temperature experiments, when grain growth did not occur. When ice deforms under the dislocation creep mechanism, the strain rate decreases because of work hardening caused mainly by pile-up dislocations associated with the formation of subgrain boundaries (e.g., Hamann and others, Reference Hamann, Weikusat, Azuma and Kipfstuhl2007; Faria and others, Reference Faria, Weikusat and Azuma2014b). Our microstructural observations identified the formation of subgrain boundaries during deformation, suggesting the contribution of dislocation movement to deformation is large.
A stress exponent of n ≈ 2 is probably derived from low accumulation of dislocations. In our experiments, as suggested by the straight GBs, dislocations are not highly accumulated, which might be attributable to the high density of GBs of the fine grains. Although subgrain boundaries act as obstacles to dislocation movement, the GBs might act as sinks that absorb dislocations (Pimienta and Duval, Reference Pimienta and Duval1987). If the GBs act as sinks for dislocations in our experiments, the fine-grained ice with high density of GBs is advantageous for the reduction of dislocations by climb through lattice diffusion; thus, the accumulation of dislocations could be significantly restricted.
Activation energy is a clue to identification of the dominant deformation mechanism. The creep activation energy of fine-grained ice, estimated based on experimentation, is ≈ 60 kJ mol−1 at both −20 and −10°C for all samples, which is close to that for lattice diffusion of ice (59–60 kJ mol−1) (Cuffey and Paterson, Reference Cuffey and Paterson2010). If GB diffusion is a rate-controlling process, the activation energy should be ≈ 120 kJ mol−1 (Azuma and others, Reference Azuma, Miyakoshi, Yokoyama and Takata2012; Faria and others, Reference Faria, Weikusat and Azuma2014b). Accordingly, recovery of pile-up dislocations by lattice diffusion might be a rate-controlling process for creep in our fine-grained ice. Taking the findings of the reduction of strain rates, increase of subgrain boundary densities, and activation energy close to lattice diffusion into consideration, the predominant deformation process appears to be dislocation creep rather than GB sliding.
4.2. Grain size dependence and role of microparticles
For the grain size exponent p ≈ 1.4, estimated based on experimentation, several factors might contribute to the grain size dependence of the fine-grained ice. For example, the time and distance for a dislocation to reach a GB and to disappear via lattice diffusion are inversely proportional to grain size, leading to p ≈ 1. As another possibility, the mobile dislocation density ρ in the Orowan equation might be increased in fine-grained ice because GBs act not only as sinks but also as dislocation sources. To investigate the details of the grain size exponent and relations with the dominant deformation mechanism, further experiments are required using ice with finer grain size, in which diffusional creep dominates and ice with larger grain size, in which dislocation creep is dominant.
Microparticles can lead to softening behavior of polycrystalline ice because of the increase of mobile dislocation density, as suggested by Song and others (Reference Song, Cole and Baker2005, Reference Song, Baker and Cole2008), while particles sometimes induce dispersion hardening. Solid particles in polycrystalline materials can act as obstacles to dislocation glide, which is a process known as Orowan hardening (e.g., Ashby, Reference Ashby1966; Durham and others, Reference Durham, Kirby and Stern1992). Hooke and others (Reference Hooke, Dahlin and Kauper1972) concluded the decreased rate of creep of sand-dispersed ice observed in deformation experiments was caused by Orowan hardening. It is important to note that Orowan hardening acts when dislocation glide contributes to the deformation of polycrystalline materials. This hardening trend has been observed in some laboratory experiments (e.g., Hooke and others, Reference Hooke, Dahlin and Kauper1972; Durham and others, Reference Durham, Kirby and Stern1992). However, hardening behavior due to silica dispersion was not obtained in our experiments. The strain rate of 0.1% silica-dispersed ice with mean grain size of 38 μm is larger than that of both pure ice and 0.01% silica-dispersed ice. We could not detect a clear difference between 0.01% silica-dispersed ice and pure ice, which have equivalent mean grain sizes. As the respective samples have approximately identical values of the stress exponent and activation energy, the dominant deformation mechanism might be equivalent. Under the experimental conditions of −20°C and 1.0 MPa, the mean grain sizes of the deformed samples are the same as the initial state (Table 2). Comparing the 0.01% silica-dispersed ice and pure ice, whose initial grain sizes are almost equivalent, the strain rates are nearly identical until 10% strain (Fig. 3a). Conversely, we did observe difference in the strain rates of the high-temperature experiments (−10°C and 0.5 MPa), where the mean grain sizes increased during deformation to 64 and 73 μm for 0.01% silica-dispersed and pure ice, respectively. In this case, the difference of strain rate is gradually enhanced with the increase of strain (Fig. 3b). Figure 7 indicates that the strain rate depends only on grain size, irrespective of the silica dispersion. This implies that microparticles have no direct influence on the deformation of our fine-grained ice characterized by n ≈ 2, except for the restriction of grain growth.
4.3. Implication for ice-sheet ice deformation
Our results suggest that GBs play important roles in the deformation of fine-grained ice. In particular, the deformation regime characterized by n ≈ 2 has grain size dependence, which is not considered in typical dislocation creep with n = 3 used in ice-sheet flow models. In ice sheets, the strain rate is extremely small, e.g., of the order of 10−2 a−1 for ice of the Dye 3 core (Thorsteinsson and others, Reference Thorsteinsson, Waddington, Taylor, Alley and Blankenship1999), and the rate of accumulation of dislocations is considered as significantly slow as our fine-grained ice deformation. Actually, the subgrain boundary densities of deformed samples that reflect the accumulation of dislocations during deformation are close to those of the EDML ice core (≈ 2 mm−1) (Weikusat and others, Reference Weikusat, Kipfstuhl, Azuma, Faria, Miyamoto and Hondoh2009). If coarse-grained ice is deformed under high stress, the subgrain boundary density and the accumulation of dislocations become much higher because of the presence of fewer GBs (see in Appendix). This means the accumulation of dislocations is substantially reduced in fine-grained ice, even in high-stress experiments.
If the dislocation density is not saturated, the significant decrease of dislocation velocity or mobile dislocation density derived from dislocation pile-up might not appear. The annihilation of pile-up dislocation is likely to be activated at finer grains that have higher GB density; therefore, the strain rate of finer grains can become larger than that of coarser grains. In that situation, grain-size-sensitive creep characterized by n ≈ 2 might occur. Although the sizes of the ice grains in actual ice sheets are 2 orders of magnitude larger than in our fine-grained ice, both are likely to experience similar deformation mechanisms because they deform under the situation in which the accumulation of dislocations is not saturated. If ice-sheet ice is deformed by grain-size-sensitive creep, rapid deformation of ice-age ice and cloudy bands could be attributable to fine grains. In a situation of low dislocation density, microparticles might not act as obstacles that lead to hardening effects. Instead, the particles might restrict grain growth and maintain the fine grains that lead to softening effects. This trend is consistent with field observations at basal layers of an Antarctic glacier (Cuffey and others, Reference Cuffey2000). Based on those observations, deformation was reported dependent on grain size and independent of particle content, and it was argued that grain-size-sensitive deformation contributes to strain rate enhancement.
Glen's flow law underestimates the strain rates in ice sheets as indicated by the necessity of the flow-enhancement factor. The assumption of n = 3 in ice-sheet models is basically derived from the experiments using coarse-grained ice. If coarse-grained ice deforms under high-stress conditions, the strain rates could become small because of dislocation pile-up in associated with high accumulation of dislocations. This situation is probably far from that in ice sheets that have low dislocation densities. The derived strain rates of fine-grained ice are ≈ 1 order of magnitude larger than those of coarse-grained ice. The underestimation of Glen's flow law might be attributable to this discrepancy, which could be derived from the low accumulation of dislocations in ice sheets. The magnitude of the accumulation of dislocations in ice grains could be conjectured qualitatively from GB morphology; irregularities are increased under a state of higher dislocation density because of strain-induced boundary migration. In ice sheets, when the GBs are irregular, ice grains could deform under typical dislocation creep with n ≈ 3 because of the high accumulation of dislocations, as illustrated in previous work. Conversely, when GBs are straight, ice grains could deform under grain-size-sensitive creep with n ≈ 2 and grain size exponent p ≈ 1.4.
5. CONCLUSIONS
We conducted uniaxial compression deformation experiments and microstructural observations using fine-grained artificial ice both with and without silica particles. Pure ice and silica-dispersed ice were deformed at stresses between 0.2 and 1.0 MPa at temperatures between −5 and −50°C. The microstructures (grain size, subgrain boundary density and grain size distribution) of the ice samples were analyzed before and after deformation. To simulate the deformation mechanism under low accumulation of dislocations, as found in actual ice sheets, we used fine-grained ice that has manyGBs that act as sinks of dislocations. By controlling the ice grain sizes and dispersed amounts of microparticles, we could independently investigate the effect of each on the deformation and microstructural evolution of polycrystalline ice.
Our experiments revealed the following: (1) the strain rate continues to decrease even when the total strain exceeds 3%, (2) the deformation of fine-grained ice is characterized by the stress exponent of ≈ 2 and the creep activation energy of ≈ 60 kJ mol−1, (3) the strain rate depends only on the grain size, irrespective of silica dispersion, where the grain size exponent becomes ≈ 1.4, (4) the GBs are rather straight after deformation, and (5) the subgrain boundary density increases during deformation. These results indicate that dislocation movement contributes to the deformation processes, while other mechanisms such as GB sliding also probably act. In particular,GBs might play an important role in dislocation behavior. StraightGBs imply a lack of accumulation of dislocation energy to drive dynamic recrystallization. In our fine-grained ice, dislocation creep might dominate the deformation process because continuous work hardening and an increase of subgrain boundary density were observed during deformation. As the activation energy is close to that of lattice diffusion, annihilation of pile-up dislocations by lattice diffusion might control the rate of creep. In a situation of low accumulation of dislocations, microparticles might not act as obstacles that lead to hardening effect.
Although the grain sizes in actual ice sheets are 2 orders of magnitude greater than our fine-grained ice, ice-sheet ice might deform under a state of low dislocation density, as in our fine-grained ice, because of the extremely small strain rates. In that situation, strain rates in ice sheets might depend on grain size because the accumulation of dislocations could be controlled by GB densities. If ice sheets deform under the mechanism of grain-size-sensitive creep, rapid deformation of ice-age ice and cloudy bands could be attributable to fine grains. Microparticles could have no direct influence on the deformation of ice sheets, except for the restriction of grain growth.
ACKNOWLEDGEMENTS
We thank the scientific editor S.H. Faria for detailed and instructive comments, and improvement of the manuscript. The authors also thank K. Cuffey and A. Svensson for helpful reviews, and W. Shigeyama for useful discussions. This study was funded by MEXT Japan (Japanese Ministry of Education, Culture, Sports, Science and Technology) through the Arctic Challenge for Sustainability (ArCS) project, Grant-in-Aid for Scientific Research (B) (17H02957) and Grant-in-Aid for Challenging Exploratory Research (15K13567). T.S. was supported by the ArCS project.
APPENDIX
Figure 10 shows the microstructure of a coarse-grained ice sample deformed at −20°C and load stress of 1.0 MPa. It is evident that there are many subgrain boundaries. We put ice grains into a mold and drained ultrapure water. Ice grains were prepared by crushing bubble-free ice, which was then sieved between 0.7 and 1.4 mm. The initial grain size of the coarse-grained ice was ≈ 1 mm. The subgrain boundary density of the deformed coarse-grained ice was ≈ 9.7 mm−1. This value is several factors of magnitude higher than that of fine-grained ice (1–2 mm−1, Fig. 8) and found in ice core (2 mm−1 for EDML). This means that the accumulation of dislocations is much larger in coarse-grained ice. The deformation mechanism of coarse-grained ice inferred based on the high-stress experiments might be different from that of ice-sheet ice because the accumulation of dislocations is too great. In fine-grained ice, low subgrain boundary densities and low accumulation of dislocations are maintained during deformation, even in high-stress experiments, in comparison with coarse-grained ice.
Microstructure of coarse-grained ice deformed at −20°C and load stress of 1.0 MPa. The sample was deformed until ≈ 10% strain. Scale bar: 200 μm.


 Open access