

INTRODUCTION
Maternally derived antibodies interfere with the immunogenicity of measles vaccine. Consequently, vaccine efficacy increases with age, as the concentration of maternal antibodies declines. Surveys from a range of countries point to vaccination at 9 months successfully resulting in immunity in only ~85% of individuals, whereas for vaccination at 12 months, ~95% successfully retain immunity [Reference Gans1–Reference Wolfson7]. Vaccinating older children is therefore more efficient in terms of vaccine efficacy, but leaves children in the 9–12 months age group at risk, and these children have approximately double the mortality risk [Reference Wolfson8].
To achieve sustainable reduction in measles mortality, the World Health Organization (WHO) recommends as a baseline routine immunization of at least 90% of children at age 9 months or shortly thereafter [9]. Since vaccine efficacy is <100%, the WHO also recommends provision of a second opportunity for measles vaccination to ensure coverage both for children for which the vaccine has failed and unvaccinated children [Reference Wolfson7, Reference Rosenthal and Clements10]. Provision of a second dose has been implemented worldwide, and in many countries the resulting reduction of measles transmission and increase in the average age of infection has already allowed the age of first dose delivery to be increased from 9 to 12 months. However, there still are broad regions where routine availability of the second dose is the exception (e.g. sub-Saharan Africa, Madagascar, India). In these locations, the mortality burden associated with measles remains considerable [Reference Grais11] and measles mortality reduction (rather than measles elimination) is the main goal of vaccination. Although the WHO mainly recommends vaccination at 9 months in this context, this is not always achieved [Reference Clark and Sanderson12], e.g. more than a million infants were unvaccinated before their first birthday in Nigeria and Ethiopia [13]. The value of a more detailed understanding of how changes in the age of delivery of the first dose may alter the mortality burden is consequently high [Reference Grais11].
Here, we use an age-structured transmission model to identify the vaccination age or age window that minimizes incidence or mortality where only a single dose is available as a function of three important epidemiological drivers: demography (birth rate), seasonality, and vaccination coverage. Our goal was not to explore specific outcomes relative to specific vaccination scheduling (e.g. supplementary immunization activities (SIAs), etc. [Reference Bauch, Szusz and Garrison14]), but to explore the broad implications of different choices of age of vaccination in a simplified set of scenarios, focusing on vaccination at age ⩾9 months since earlier vaccination is not generally recommended in a single-dose routine situation [Reference Rosenthal and Clements10, Reference Garly15].
Generally, an increase in birth rate, an increase in disease transmission rate, or a decrease in vaccination coverage will have broadly similar effects [Reference Earn16], but these effects on incidence or epidemic severity may be nonlinear, and will depend on the magnitude of seasonal forcing [Reference Ferrari17]. We started by identifying which of two restricted strategies (vaccination only at 9–11 months, or only at 12–14 months) was preferred across a range of conditions. Since the initiation of vaccination may eventually drive the average age of infection sufficiently high that vaccination at a later age will leave no children exposed, we also explored the optimal timing of a switch from vaccinating at 9–11 months to vaccinating at 12–14 months over 10 years, across a range birth rates, seasonality and coverage. Finally, we explored whether vaccination across a range of ages (rather than at only the narrow window of 9–11 or 12–14 months) leads to greater case reduction. Successful immunization is a function both of efficacy at age of vaccination, and also the chance that a child of a given age be vaccinated, e.g. vaccination may be delivered on average much later in some countries than others [Reference Clark and Sanderson12], or concentrated at a considerably younger age for urban vs. rural communities. We therefore also explored the effect of different patterns of access to care on the optimal minimal upper age at vaccination.
Below, we first introduce an age-structured model for measles transmission. We then explore the outcome of vaccination at different ages, and then the optimal time of changing from 9–11 to 12–14 months vaccination as a function of seasonality, birth rate and vaccination coverage. Finally, we explore the optimal age range of vaccination and how different epidemiological parameters and patterns of access to care affect it.
METHODS
Model framework
If transmission rates vary by age, the dynamics of a disease over age and infectious category can be tracked by structuring the population into age and epidemic groups, and projecting the population forwards with a matrix framework that combines demographic and epidemic transitions [Reference Klepac18, Reference Klepac and Caswell19]. For measles, in the simplest analysis, epidemic groups are ‘susceptible’ and ‘infected’, as immunity to measles is lifelong, so that the recovered age group does not need to be explicitly tracked. The population vector is

where the first index (rows) refers to age group and a is the total number of age groups used, and the second index (columns) indicates infection category, with ‘1’ for susceptible and ‘2’ for infected. Ignoring for now the dynamics associated with ageing and mortality, and taking as a time step the generation time of the disease (~2 weeks for measles [Reference Bjørnstad, Finkenstädt and Grenfell20]), within each age group i, transmission follows the 2×2 matrix
where n(t) is the second column in the matrix defined above, and ϕi is the probability of becoming infected in one time-step for individuals in age group i,
where βi,j defines the rate of transmission from infected individuals in age group j to susceptible individuals in age group i, γ is a parameter that captures heterogeneities in mixing not directly modelled [Reference Finkenstädt and Grenfell21, Reference Grenfell, Bjørnstad and Finkenstädt22] and the effects of discretization of the underlying continuous time process [Reference Glass, Xia and Grenfell23], and N is total population size, appearing in the denominator in order to reflect frequency-dependent transmission [Reference Bjørnstad, Finkenstädt and Grenfell20]. Here, we set γ=0·97 following Bjørnstad et al. [Reference Bjørnstad, Finkenstädt and Grenfell20], and set the magnitude and pattern of the infection parameter over age, βi,j, to reflect estimates inferred from data from Niamey, Niger [Reference Ferrari24], (Fig. 1) which provides the best information currently available for characterizing measles in a developing world situation. A simulated population with these estimates and vaccine coverage approximating that reported for Niger (70% [Reference Ferrari17]) broadly captures incidence and average age of infection observed in this population [Reference Ferrari17, Reference Ferrari24]. There may in fact be regional variation in the magnitude of β [Reference Edmunds25], and our goal was to model the effect of measles vaccination age in general, and not specifically in Niamey; however, shifts in the magnitude of transmission rate can be equated to a shift in the birth rate [Reference Earn16], broadly explored here, so this was not addressed further. To capture seasonality in transmission, for every age group, we modelled βi,j,t=βi,j (1+α cos(2πt)). We tested outcomes using a broad range of values of α, where α=0 corresponds to no seasonality, and α=0·6 is very high seasonality, and captures the high amplitude seasonality observed in Niamey, Niger [Reference Ferrari17].
Force of infection over age, based on the pattern observed for Niamey, Niger that peaks at ~3 years [Reference Ferrari24].

Survival over age shapes the age profile of the population, and is therefore key to the effects of the age profile of vaccination. To incorporate ageing and mortality dynamics into the model, the matrix n was reorganized into a population vector ns by stacking the rows of the matrix, i.e. the population vector is of length 2 a since there are two epidemiological categories in each age group [Reference Klepac and Caswell19]. We then required a matrix to project the entire population forwards via ageing, mortality and infection dynamics. To do this we defined a 2 a×2 a matrix

where Ai is the 2 a×2 a matrix described above, u i governs the host's probability of ageing over the course of one generation of the disease and depends on the length of age group i, e.g. in the simplest formulation, if i is an age group of length 1 year, and the disease generation is 2 weeks, u i=1−exp(−1/26), as there are about 26 disease generations per year. The parameter u i can also be set to take the values 0 within a year and 1 when years change, to capture a situation of cohort ageing [Reference Schenzle26], which is of particular relevance where transmission is dominated by discrete rises in incidence and transmission modulated by school attendance (term-time forcing). In the absence of evidence for term-time-like forcing in the context of particular interests [Reference Ferrari17] we retained gradual ageing. The parameter s i is the survival probability for age group i over the same time-scale, obtained by adjusting the WHO life-table estimates of age-specific mortality for Niger for 2006 [27], to yearly age groups with a smoothing spline, and then converting the values to bi-weekly survival probabilities using s i=(1−qx i)l where qx i is the annual mortality probability of individuals in age group i, and l is the length of age group i in years, i.e. for a 1-year age group with a 2-week disease generation time, l=1/26. The parameter v is the proportion of individuals effectively vaccinated over the same time-scale, and is the product of the coverage attained in each time-step, c, and the age-specific efficacy of vaccination, e i set so that e i=0·85 at 9 months and e i=0·95 at 12 months. To obtain values for the coverage parameter, c, we converted yearly vaccination coverage probabilities into bi-weekly vaccination probabilities by integration.
To capture the detail of 9–11 vs. 12–14 months vaccination, we defined the first age groups in monthly increments, up to 10 years of age; after that age the groups are yearly. The last two rows and columns in the matrix capture infection dynamics in the last age group, here taken as being individuals aged ⩾21 years. Survival in age groups aged >15 years was adjusted to retain the population size at an equilibrium size. Since measles is predominantly a childhood infection, it was assumed that the detail in these later stages could be safely sacrificed for ease of computation. To define epidemiological and demographic dynamics, we write
where b is a vector composed of the number of births at time t and a – 1 zeros.
Specific age of vaccination
We first compared the mortality-weighted total number of cases over 10 years following the start of vaccination at either 9–11 or 12–14 months for different levels of birth rate, seasonality and vaccination coverage. We then identified the optimal time in terms of minimizing measles mortality for switching from a 9–11 to a 12–14 months vaccination strategy over 10 years. To reflect measles mortality, rather than simply measles incidence, the estimated numbers of cases occurring in individuals aged <1 year was multiplied by 2, as existing evidence points to measles mortality burden being twice as high in this group [Reference Wolfson8]. This value was then added to the number of cases occurring in individuals aged >1 year. The result is an index of the mortality burden that can be compared across different vaccination strategies.
Age range of vaccination
When an age range of first vaccination is considered (rather than a single age, or narrow age window, as above), modelling vaccine coverage as a probability is no longer sufficient, as the optimal strategy will be simply to vaccinate as broad an age range as possible. Instead, coverage is modelled via a number of doses (denoted D) available in each bi-week. Since one of the challenges in determining the age range of vaccination is the tension between vaccinating late enough so that efficacy is not diminished by maternal immunity, while still vaccinating early enough so that most children have not already experienced the infection, we explicitly allowed doses to be expended on vaccination of recovered individuals, R, whose immunization status was considered as unknown. To do this, we added a third epidemiological stage to the model described above. We assumed that previously vaccinated individuals are known and therefore not re-vaccinated.
At the start of each time-step, the total number of susceptible and recovered individuals, and the chosen age range of vaccination was used to estimate the value of coverage c i for each age group that will result in D doses being used, according to the scenario considered of age at vaccination. Initially, we assumed that children in every age group are vaccinated in proportion to the fraction of the total population in each age group, by solving D=cV c, where V c is the total number of individuals being considered for vaccination, V c=∑i∊ωS i+R i, and ω is the age range under consideration. The desired proportion vaccinated, or coverage in each age group i is then c i=c. As above, the value v i that enters the model is the product of the thus estimated age-group-specific coverage, c i and vaccine efficacy at that age, e i.
We modelled efficacy over age as being 0·85 at 9 months, and 0·95 at 12 months; the true pattern is debatable. Some suggest maternal antibodies may be low enough to start vaccinating before 9 months [Reference Altintas28], or that there is no difference between the effects of 9–11 months vaccination vs. 12–14 months [Reference Klinge29]. The magnitude of efficacy is also debatable, e.g. some studies suggest only 80% efficacy at 9 months [Reference Singh6] rather than 85%. Our model could easily be tuned to specific estimates for specific quantitative predictions, but the qualitative results are primarily shaped by the undisputed increase in efficacy with age, and are therefore likely to be robust.
A key consideration is that the age profile of first access to care may differ across populations, with for example many children only being vaccinated well after the recommended starting age for vaccination [Reference Clark and Sanderson12]. This affects estimates of coverage, as doses are only be used for children that access health centres. The formula for estimation of levels of coverage in each age group becomes c i=D/[∑i∊ωκi(S i+R i)], where κ captures the pattern of probability of access to care at each age, rescaled to the appropriate age range so that the sum of denominator remains equal to V c. As above, the proportion vaccinated at each age is set by v i=c ie i. We explored three different scenarios (i) no variability in access to care (vaccination proportional to the age structure); (ii) a narrow window of first access to care with a low mean age, likely to capture urban situations; and (iii) a broad window of access to care but with a higher mean age, likely to capture rural situations (Fig. 4 b). For each scenario, assuming that the minimum age of vaccination was 9 months, we identified an upper age of vaccination delivery that minimized the number of mortality-weighted cases for different dose availability over 10 years (i.e. weighting cases occurring in individuals aged <1 year by 2, see above).
RESULTS
First, in contrasting vaccination at 9–11 and 12–14 months, strategic models show that over 10 years, high birth rates and low vaccination coverage both shift the balance in favour of earlier vaccination for mortality-weighted cases; by contrast, with sufficient coverage, and low enough birth rates or transmission, vaccination at 12–14 months generally results in fewer cases (Fig. 2). The proportion of the population infected varies between 2% (low birth, high vaccination coverage) and 22% (high birth, low vaccination coverage). The ratio of numbers of cases obtained with one strategy vs. another is generally close to 1 (e.g. ~1·13) but given the burden of infection, this may translate into a large difference in number of cases, ranging between 1000–15 000 over 10 years along the contour describing the switch between strategies in a population of 750 000 (Fig. 2, bottom panel). Higher amplitude of seasonal fluctuations increases the range where vaccination at 12–14 months results in fewer cases than vaccination at 9–11 months, since increasing the amplitude of seasonal fluctuations increases the amplitude of fluctuations in the average age of infection, which in turn increases incidence in higher age groups (Fig. 2, top two panels vs. bottom panel). This occurs since maternal immunity sets a lower bound on age of infection but no upper age; fluctuations thus drive the upper age up. The irregularity of the pattern (Fig. 2, upper panel) is attributable to complex dynamics and transients obtained for high magnitude seasonality. For raw case numbers (as opposed to mortality-weighted cases) the region of parameter space for which vaccination at 12–14 months is preferable expands, particularly for high vaccination coverage, but the overall features remain similar. Vaccination over 5 or 20 years, as well as for vaccination at only 9, or only 12 months (rather than 9–11 vs. 12–14 months) all yield qualitatively similar results.
Best strategy (red for 9–11 months and green for 12–14 months) obtained using the ratio of cases weighted by mortality rate over 10 years following initiation of vaccination at 9–11 months, or at 12–14 months, for varying degrees of seasonality (α=0, α=0·2, α=0·6) across a range of vaccination coverage (x axis) and birth rate/1000 per year (y axis). Vaccination at 12–14 months performed poorly at low coverage and high birth rates (top left panel, red), but well over a range of higher vaccination coverage and lower birth rate (bottom right, green). The right-hand panels show time-series plots following the start of vaccination (the timing of which is indicated by a vertical red line) for vaccination at 9–11 months (red) or 12–14 months (green) of total incidence (top) and average age of infection (bottom) for two different locations for the graph indicating intermediate seasonality (symbols: •, ▪). The dashed box in the bottom left panel indicates the range taken in Figure 3 for comparison.

Across 10 years, the optimal switch time from vaccination at 9–11 months to vaccination at 12–14 months to minimize mortality-weighted cases increases with decreasing coverage and increasing birth rates (Fig. 3), in accordance with Fig. 2. The range where an intermediate switch is optimal is amplified by seasonal variation, also as a result of the amplification in fluctuations of age at infection. Qualitatively similar patterns are obtained over longer or shorter time-spans; and with vaccination at only 9 or only 12 months.
Optimal time in years, over 10 years, for switching from 9–11 to 12–14 months vaccination as a function of the birth rate/1000 per year (x axis) and vaccination coverage (y axis), identified as the switching time leading to the fewest number of cases weighted by mortality risk; shown for three different levels of seasonality, as in Fig. 1. The time series in the right-hand panels show incidence and average age of infection where α=0·2, for the three main cases: (i) never switch to 12–14 months [top panel, corresponding to the birth and vaccination level shown by the circle (•)]; (ii) switch at an intermediate level (middle panel, ▪); (iii) switch immediately (bottom panel, ▴).

(a) Pattern of efficacy used in estimating the optimal upper age of vaccination; (b) Patterns of first access to care set to capture a more urban (–––) and rural (- - -) community.

Assuming that the lowest age of vaccination implemented is 9 months, the optimal maximum age of vaccination delivery to minimize mortality-weighted cases over 10 years is generally greater than a year, suggesting that vaccination at only 9 months or 9–11 months is never optimal if the option is available to vaccinate a broader age range (Fig. 5 a–c). If vaccination over age is proportional to numbers of susceptible and recovered individuals in every age group (Fig. 5 a), at all birth rates the upper age of vaccination rises from relatively low ages (between 1 and 2 years) to high ages (>2 years) when sufficient doses are available to cover the birth cohort. Accordingly, the rise occurs when there are higher numbers of doses available for higher birth rates. Below and above this dosage level, the upper age is higher for higher birth rates. This occurs since higher birth rates concentrate individuals in low age groups where vaccine efficacy is lower. With increasing amplitude of seasonal variation in transmission, qualitatively similar patterns are obtained (not shown).
Optimal upper age of vaccination over 10 years for different parameter combinations for different birth rates/1000 per year (colours corresponding to each birth rate are provided in the legend) with (a) no differences in patterns of access to care over age (vaccination is proportional to the number of susceptible individuals in each age group); (b) with ‘urban-like’ patterns of access to care; and (c) with ‘rural-like’ patterns of access to care (see Fig. 4); horizontal dotted lines (······) show the range of age where transmission is highest according to data estimated from Niamey, Niger.
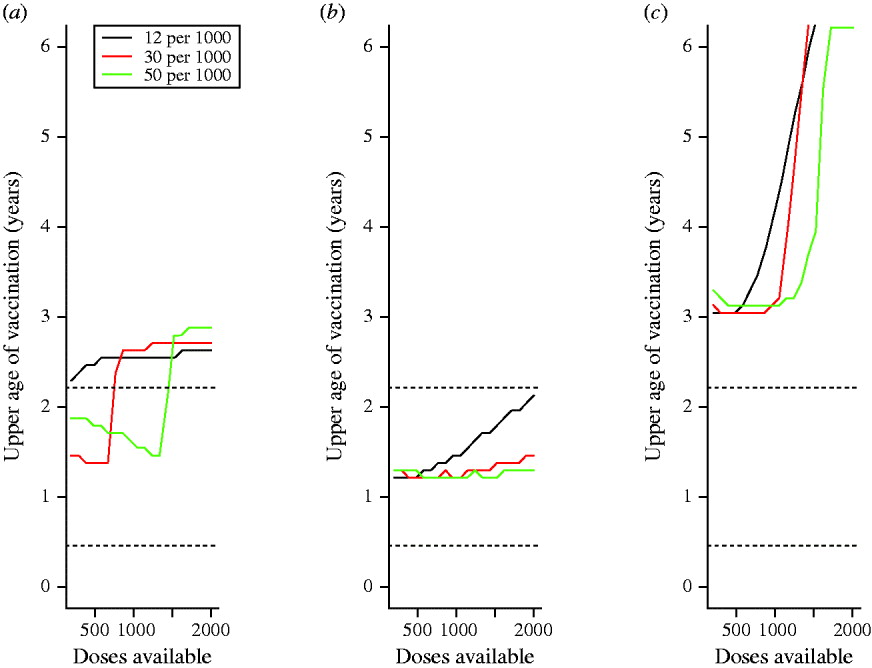
If realistic patterns of access to care are considered, for the case where access to care is concentrated in younger age groups (e.g. urban communities), the upper age of vaccination is low relative to the situation where access to care is even over age (Fig. 5 b vs. Fig. 5 a). This occurs because very few children attend clinics for the first time at ages >1 year. Conversely, for the case mimicking a rural community, where the first age of access to care has a higher mean and greater variability, the optimal upper age is higher (Fig. 5 c). In all situations, vaccination of children up to an age that is either a year later, or a year earlier than the optimal age can considerably increase the number of cases (Table 1, up to 14 000 more cases).
Dose availability and age range of vaccination
For combinations of dose availability (rows) and birth rates (columns), the optimal upper age of vaccination in months (see also Fig. 5 a), and the total number of cases per 1000 of the population over 10 years recorded at the optimal, 1 year larger than optimal, and either 1 year smaller than optimal or 9 months, depending on which is larger, for a population the size of Niamey (750 000), raw numbers of cases for the optimal, and differences are presented in parentheses. Similar patterns are obtained for specific patterns of access to care. Note that since the optimal is defined by the minimum number of cases where children aged <12 months are weighted by 2, the absolute number of cases at the optimal may exceed numbers 1 year later or earlier. Since decreased birth rates increase the average age of infection, more cases may be obtained at low birth rates, since the vaccination range cannot encompass them.
DISCUSSION
Regionally targeted vaccination dose allocation strategies may be hard to justify ethically, as they often amplify inequalities in care across populations. Varying the age range targeted regionally, rather than the allocation per se, according to local variation in birth rate, seasonality, coverage, and access to care may be more defensible. Our results show that this can make substantial differences in the number of cases averted (see Results section, Table 1), depending on dose availability and birth rate/1000. For strategies focusing on specific ages of vaccination, higher birth rates and lower coverage both shift the balance in favour of earlier vaccination (at 9–11 months), but with sufficient coverage and low enough birth rates or transmission, vaccination at 12–14 months results in fewer cases. The optimal time for switching between vaccination at 9–11 and 12–14 months shows similar patterns. Results are broadly in line with current WHO AFRO region guidelines that recommend retaining 9 months vaccination under a single dose context; e.g. in Niger, where the birth rate is around 50/1000 per year. Figure 3 indicates that switching the age of vaccination from 9–11 to 12–14 months would increase case numbers at any point over the next 10 years.
Although contrasting 9–11 vs. 12–14 months vaccination provides insight into the dynamics of age and vaccination across demographic and epidemiological contexts (Figs 1, 2), in most situations, a broader age range of vaccination is optimal (Fig. 5). The width of the optimal age range may become narrower or broader when specific patterns of first access to care are considered (Fig. 5 b, c). The increase in case numbers resulting from upper ages of infection that differ from the optimal can be substantial (Table 1, up to 10 000 cases at high birth rates, with intermediate dose availability) pointing to a large benefit of tuning the chosen upper age according to each populations' characteristics. The sensitivity of quantitative predictions to patterns of access to care highlights the importance of country-specific and region-specific models for strategic planning of age at vaccination. This conclusion is amplified both by evidence for considerable variation in patterns of access to care [Reference Clark and Sanderson12] and by the fact that tactics described by the WHO for providing routine immunization services will shape the age profile of access to care.
Although the qualitative relationships linking success of the first dose and epidemiological or demographic drivers (Figs 2, 3, 5) should be fairly robust, the sensitivity of the exact optimal age strategy to the epidemiological and demographic conditions precludes clear quantitative recommendations in the absence of further data. Furthermore, we considered only routine vaccination, and we omitted explicit modelling of the second dose. More detailed modelling of how age of vaccination can be optimized in the context of both these complications would be of great value, particularly since non-routine vaccination activities such as ‘pulse campaigns’ generally target specific ages determined by the age profile of susceptibility within the population [9], thus feeding back onto the optimal age for routine vaccination. Generally, strategic models like the one presented here need to be supplemented by specific models for particular key regions to guide optimal delivery of first and second doses via both routine vaccination and special campaigns, e.g. SIAs, or triggered campaigns occurring once susceptibility in the population exceeds a certain level. Serological estimates of population age profiles of susceptibility, as well as seasonally disaggregated historical time-series of measles incidence, are key data needs for this exercise.
ACKNOWLEDGEMENTS
We thank Justin Lessler and two anonymous reviewers for comments on the manuscript. This work was funded by the Bill and Melinda Gates Foundation (C.J.E.M., P.K., B.T.G.); B.T.G. and M.F. were also supported by the Research and Policy for Infectious Disease Dynamics Program (RAPIDD) of the Science and Technology Directorate, Department of Homeland Security, and the Fogarty International Center, National Institutes of Health.
DECLARATION OF INTEREST
None.


