




Introduction
The end of the western Roman Empire in AD 476 ushered in a new period of uncertainty and dynamism in the Italian peninsula that was characterized by political instability, population movements, pandemic disease, and military conflict. The early medieval period, here defined as AD 500–800, included significant historical events such as the rise of Ostrogothic kingship in AD 476, the Byzantine reconquest of Italy and Gothic wars of AD 535–554, the First Plague Pandemic of AD 542–750, the Longobard invasion of AD 568, and subsequent conflicts between the Longobards, Byzantines, Papal Rome, and Franks that lasted until Charlemagne (Christie Reference Christie2016). These societal changes took place during a period of increased climatic fluctuation, especially the so-called Late Antique Little Ice Age of AD 535–660, a period understood to contain the 10 coldest winters of the last two millennia (Büntgen et al. Reference Büntgen, Myglan, Ljungqvist, McCormick, Di Cosmo, Sigl, Jungclaus, Wagner, Krusic and Esper2016; Zonneveld et al. Reference Zonneveld, Harper, Klügel, Chen, De Lange and Versteegh2024). This period is marked across Italy by site abandonment and urban decay, often concomitant with the installation of new cemeteries which were frequently located within the ruins of previously inhabited Roman-era settlements. These cemeteries have been the focus of much archaeological research, particularly those containing richly furnished graves with elaborate metalwork or weaponry, though the human remains have received less attention. Dating has been most often relatively established using grave good typology, often resulting in coarse chronological resolution that favors only the furnished graves—those individuals buried without grave goods are typically often more coarsely dated.
Despite the importance of mortuary contexts and human remains in understanding the societal impact of major historical events, few absolute dating chronologies exist for early medieval Italy that allow for close correlation. Only 20 radiocarbon dates from human remains dated between AD 500 and 999 in Italy are recorded in the PAGES People3000 Archaeological Radiocarbon Database (p3k14c), the largest database of archaeological radiocarbon dates (Bird et al. Reference Bird, Miranda, Vander Linden, Robinson, Bocinsky, Nicholson, Capriles, Finley, Gayo and Gil2022). These dates were collected from the earlier database assembled by (Palmisano et al. Reference Palmisano, Bevan and Shennan2018) and come from a total of five sites. There are several other published dates that were not included in these databases, including that from a burial at “Pieve di Pava,” San Giovanni d’Asso, Siena (Ricci et al. Reference Ricci, Mongelli, Vitiello, Campana, Sirignano, Rubino, Fornaciari and Lubritto2012) or, more recently, dates for three individuals from early medieval Verona (Laffranchi et al. Reference Laffranchi, Mazzucchi, Thompson, Delgado-Huertas, Granados-Torres and Milella2020). Other early medieval dates have been published since (Bird et al. Reference Bird, Miranda, Vander Linden, Robinson, Bocinsky, Nicholson, Capriles, Finley, Gayo and Gil2022), including those of 14 individuals from a cemetery at Collegno in Piedmont (Tian et al. Reference Tian, Koncz, Defant, Giostra, Vyas, Sołtysiak, Pejrani Baricco, Fetner, Posth and Brandt2024), and two from San Vito al Tagliamento (Capuzzo et al. Reference Capuzzo, Fiorin, Beck De Lotto, Betto, Tasca, Di Tonto, Forlin, Snoeck and Cheung2025). Radiocarbon analysis has also been carried out on some early medieval individuals from the Campo della Fiera cemetery at Orvieto (Leone et al. Reference Leone, Di Biase, Cosimo and Rubini2018) though the dates have not been fully published and therefore comparisons are limited, as is the case with four dates from Lamon (Fiorin et al. Reference Fiorin, Moore, Montgomery, Lippi, Nowell and Forlin2023), two dates from Torino-Lavazza (Tian et al. Reference Tian, Koncz, Defant, Giostra, Vyas, Sołtysiak, Pejrani Baricco, Fetner, Posth and Brandt2024), and one from Jesolo (Viva et al. Reference Viva, Lonoce, Bigo, Cadamuro and Gelichi2025).
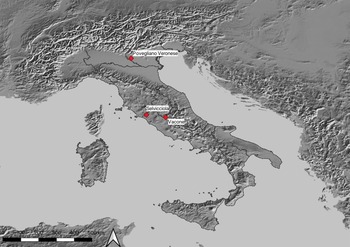
To address this lack of absolutely dated chronologies in early medieval cemeteries in Italy, we present 56 AMS radiocarbon dates from three early medieval sites in Italy (Figure 1): nine from the Roman Villa of Vacone in Vacone (RI), Lazio; 29 from the Roman Villa of Selvicciola in Ischia di Castro (VT), Lazio; and 18 from the necropolis of Povegliano Veronese (VR), Veneto.
Locations of sites used in study.

The production of these radiocarbon dates has three immediate outcomes: first, these dates allow archaeologists to move beyond the tradition of dating cemeteries based solely on the style of the grave goods found in burials, providing more secure dates for grave goods and thus avoiding circular dating. Second, they provide an independent chronological framework that enables the dating of graves lacking grave goods. Given the large proportion of the early medieval population buried in unadorned graves, this represents a significant advancement in reconstructing the social and cultural narratives of post-Roman Italy. Third, they allow for detailed chronological analysis of graves that contained multiple individuals.
Background
The sites of Vacone, Selvicciola and Povegliano Veronese were selected for this study because of the availability of samples for analysis due to either active excavations, as at Vacone, or continuing post-excavation study in a laboratory setting, as with Selvicciola and Povegliano Veronese, the skeletal collections of which are housed at the Museo di Antropologia Giuseppe Sergi (MGS) in the Department of Environmental Biology, Sapienza University of Rome. The sites are geographically dispersed, with Vacone and Selvicciola both located in central Italy, while Povegliano Veronese is in northern Italy. All three sites share a similar early medieval chronology, and a similar material culture deposited as grave goods. Furthermore, all three sites have previously been studied together in a paleoparasitological context (Ledger et al. Reference Ledger, Micarelli, Ward, Prowse, Carroll, Killgrove, Rice, Franconi, Tafuri and Manzi2021) and the cemeteries of Selvicciola and Povegliano Veronese were the subject of bioarchaeological study of Longobard cemeteries (Micarelli Reference Micarelli2020).
Site descriptions: Vacone
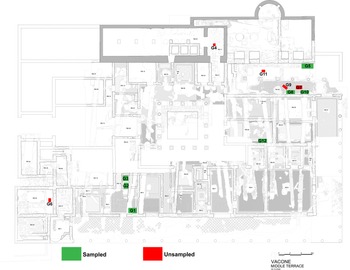
Excavations have been conducted at Villa Romana di Vacone in Lazio (RI), approximately 70 km northeast of Rome, since 2012 as part of the Upper Sabina Tiberina (UST) Project under the auspices of the Soprintendenza Archeologia, Belle arti e Paesaggio per l’area metropolitana di Roma e la provincia di Rieti (Franconi et al. Reference Franconi, Rice, Bloy, Farney and Sfameni2019; Rice et al. Reference Rice, Franconi, Bloy, Farney, Sfameni and Colosi2023). This fieldwork has uncovered a multi-phase Roman villa that was first constructed in the late second century BC on a large, artificial terrace on the southern slope of Monte Cosce (Figure 2). The Republican villa was largely dismantled and rebuilt at a larger scale in the early imperial period, with subsequent modifications in the later first and second centuries AD. The imperial villa consisted of a substantial domestic area, arranged around a central peristyle, with more than 50 rooms, over half of which were elaborately decorated with polychrome mosaics and vibrant painted walls arranged around a central peristyle and a bath complex, as well as an upper terrace devoted to agricultural production, initially specialized in olive oil production and later converted to wine production. The villa seems to have suffered seismic damage on multiple occasions including one in the first century AD after which multiple repairs were carried out successfully, followed by a probable earthquake by the end of the second century AD that resulted in the destruction and abandonment of the villa.
Site plan of Vacone showing distribution of sampled burials (plan drawn by S. Copp).

Apart from four neonates, which by Roman custom could be buried within a domestic structure during its occupation, the burials must post-date the villa’s destruction. The ruins of the villa were first used as a cemetery in the third and fourth centuries AD when a small cemetery for the burial of children was cut into the collapse of a large room on the northeastern corner of the villa. Some parts of the villa continued to be occupied during this period, but on a much smaller scale. The ruins were again used as a cemetery in the sixth and seventh centuries, with numerous graves dispersed across the entire central terrace. In total, a minimum number of 15 individuals have been identified from 12 graves, including four neonates, five subadults between the ages of 2 and 11, five adult males and one probable adult female. Additionally numerous fragmented human remains have been identified in disturbed, non-funerary contexts across the site, accounting for a minimum of 10 additional individuals. These individuals are currently under bioarchaeological study in preparation for the final site publication, but initial studies of the human remains as well as waste water channels have produced evidence of paleoparasitic gastrointestinal infection in both the Roman and early medieval periods, with the adult male of Grave 5 preserving evidence of roundworm (Ascaris sp.) infection (Ledger et al. Reference Ledger, Micarelli, Ward, Prowse, Carroll, Killgrove, Rice, Franconi, Tafuri and Manzi2021, Reference Ledger, Murchie, Dickson, Kuch, Haddow, Knüsel, Stein, Pearson, Ballantyne and Knight2025).
Ten of the 12 graves are primary inhumations, while two (Graves 2 and 3) are secondary burials that were redeposited when they were disturbed by later activity on site. Grave 2 is the only multiple burial on site, presumably the result of a decision to combine human remains from multiple disturbed graves during reburial, evident from the fact that none of the skeletons were complete, suggesting they had been moved from another location. Most of the individuals at Vacone were buried in simple graves that were cut lengthwise against a villa wall and often lined with stones or tiles. Three of the four late Roman children were buried in such graves, including Graves 8 and 10 sampled here, which were cut against the southernmost wall of the now collapsed room 50. Grave 8 also had tiles lining the foot of the grave, and the sub-adult individual was probably placed on a wooden slab, and Grave 10 was marked with a rough, unadorned headstone. Graves 7 and 8 were the only graves located in the middle of a room. Grave 7 is the sole example at Vacone of an amphora burial (enchytrismos), in which the sub-adult individual was placed inside an Africana 2C amphora, while Grave 9 was simply cut into the collapse with no lining or demarcation preserved. Only one of the four neonate burials, Grave 4, was associated with a constructed grave: an ovular cut into a drain and surrounding floor surface.
Very few burials contained grave goods; the adult male of Grave 5 was buried with a copper alloy ring, and the adult female of Grave 12 was buried with a copper alloy fibula and earrings. The child in Grave 8 was buried with a young bird (Gallus sp.) between their left shoulder and head, a practice known from both Italy and the provinces (Corbino et al. Reference Corbino, De Grossi Mazzorin, Minniti and Albarella2022; Maltby et al. Reference Maltby, Allen, Best, Fothergill and Demarchi2018). Nine individuals from Vacone were selected for radiocarbon dating, including the six adult burials and the three oldest subadults.
Site descriptions: Selvicciola
Archaeological investigations at Selvicciola, located in the territory of Ischia di Castro in Lazio (VT), some 120 km NW of Rome, were initiated in 1982 by the Soprintendenza Archeologica per l’Etruria Meridionale to investigate remains exposed by illicit digging the previous year (Gazzetti Reference Gazzetti and Christie1995). The findings led to a full excavation by the Soprintendenza and the Gruppo Archeologico Romano that revealed an expansive multi-phase Roman villa with residential and productive zones, constructed initially in the late third or second century BC atop earlier phases of occupation including a fourth–third century BC Etruscan farm and third century BC settlement, and inhabited through the fifth century AD. The excavations also revealed a large necropolis as well as early medieval settlement and a church (Gazzetti Reference Gazzetti and Christie1995; Patera Reference Patera and Laura2008; Toiati Reference Toiati and Laura2008) (Figure 3).
Site plan of Selvicciola with sampled graves highlighted in green (modified from Micarelli Reference Micarelli2020, fig. 2.2.7).

Figure 3 Long description
The site plan of Selvicciola shows the layout of the area with various graves marked. The sampled graves are highlighted in green. The plan includes labels for different sections and graves, such as 86/15, 86/16, 86/17, 86/18, 86/19, 86/20, 85/1, 85/2, 85/3, 85/4, 85/5, 85/6, 85/7, 85/8, 85/9, 85/10, 85/11, 85/12, 85/13, 85/14, 85/15, 85/16, 85/17, 85/18, 85/19, 89/1, 89/2, 89/3, 89/4, 89/5, 89/6, 89/7, 89/8, 90/1, 90/2, 90/3, 90/4, 90/5, 90/6, 90/7, 90/8, 90/9, 90/10, 90/11, 90/12, 90/13, 91/1, 91/2, 91/3, 91/4, 91/5, 91/6, 91/7, 91/8, 91/9, 91/10, 91/11, 91/12. The plan also includes a compass rose indicating the north direction and a scale bar for distance measurement.
The cemetery was investigated throughout several campaigns throughout the 1980s and the early 1990s, revealing a multi-phase cemetery, dated to between the early fourth and eighth centuries AD, with 100 graves containing 110 individuals. At least some of the graves containing multiple burials were documented as having been reopened for secondary burials (Incitti Reference Incitti and Paroli1997). The excavation results were initially summarized in two brief reports (Incitti Reference Incitti, Herring, Whitehouse and Wilkins1992, Reference Incitti and Paroli1997), followed by another short but more detailed analysis of the graves as distinguished by grave goods (Incitti Reference Incitti, Carandini and Cambi2002). Additional illustrated publications were produced in conjunction with the installation of material from the excavations in Il Museo Civico Archeologico “Pietro e Turiddo Lotti” di Ischia di Castro (Patera Reference Patera and Laura2008, Reference Patera2009). The skeletal remains were deposited in the MGS at Sapienza University of Rome, where the initial bioarchaeological investigations were carried out, documenting 110 individuals, including 73 adults (49 males, 20 females, and 4 of indeterminate sex) and 37 subadults (Manzi et al. Reference Manzi, Salvadei, Sperduti, Santandrea and Passarello1995). Research on the human remains continued but was limited by the scant publication of the archaeological investigations and a lack of documentation related to the excavation. Recently, however, several palaeopathological and dietary studies have been conducted on these remains (Buzi et al. Reference Buzi, Micarelli, Paine, Profico, Messineo, Tafuri and Manzi2020; Micarelli Reference Micarelli2017, Reference Micarelli2020; Micarelli et al. Reference Micarelli, Paine, Tafuri and Manzi2019; Panella Reference Panella2018; Tafuri et al. Reference Tafuri, Goude and Manzi2018). Micarelli Reference Micarelli2020 is the most detailed study of the Selvicciola cemetery and the first study to collect and analyze the excavation notes and documentation with the bioarchaeological study of the skeletal remains.
The cemetery has been separated into three chronological phases based on excavation records and grave goods: Phase 1: late fourth–early sixth century AD; Phase 2: late sixth–early seventh century AD; and Phase 3: mid-seventh–early eighth century AD (Micarelli Reference Micarelli2020). The initial phase of the cemetery is associated with the final phase of the villa’s occupation and the early period of abandonment. The church, built directly on top of early burials, is thought to have been constructed in the seventh century AD, with the final phase of burials dating to the seventh and eighth centuries AD, corresponding to Longobard activity in the area. Parts of the villa were repurposed, and the archaeological findings suggest the construction of huts characteristic of the Longobard period within the villa’s ruins (Gazzetti Reference Gazzetti and Christie1995). The burials associated with the Longobard occupation were clustered near the church’s apse and on its western edge. Graves near the apse primarily include males buried with weapons and other typical Longobard grave goods, whereas female graves lack such items, possibly due to a lack of ornaments or differing cultural origins.
Stable isotope analysis of bone collagen (Tafuri et al. Reference Tafuri, Goude and Manzi2018) indicates a consistent C3 plant-based diet with little variation in protein intake. Manzi et al. (Reference Manzi, Salvadei, Sperduti, Santandrea and Passarello1995) reported frequent dental caries and enamel hypoplasia, reflecting a grain-heavy diet with limited meat consumption. Further analysis by Salvadei et al. (Reference Salvadei, Ricci and Manzi2001) linked osteological conditions such as cribra orbitalia, porotic hyperostosis, and reduced cortical bone thickness to dietary deficiencies, likely exacerbated by famines, epidemics, and the sociopolitical decline following the Roman Empire’s collapse (Walker et al. Reference Walker, Bathurst, Richman, Gjerdrum and Andrushko2009). Similar nutritional challenges were widespread in this period (Killgrove Reference Killgrove, Murphy and Klaus2017, Reference Killgrove, Erdkamp and Holleran2019; Quade and Gowland Reference Quade and Gowland2021). Paleoparasitological analysis was conducted on pelvic soil samples from several of the Selvicciola graves, including seven of the burials in this study, the soil from three of which Ascaris sp. (roundworm) eggs (85/13 B, 90/5, and 90/6), one of which, 90/6, also had Taenia sp. (tapeworm) eggs (Ledger et al. Reference Ledger, Micarelli, Ward, Prowse, Carroll, Killgrove, Rice, Franconi, Tafuri and Manzi2021).
The Selvicciola necropolis illustrates a complex social landscape involving individuals associated with the villa’s productive phase, those who remained during its abandonment, and Longobard-related groups interred with distinctive burial practices. This phased development highlights differences in living conditions across gender and social roles within the same period. During the Roman phase, most individuals were likely farmers. By the Longobard period, the site appears to have functioned as a strategic hub for controlling regional productivity (Micarelli Reference Micarelli2020).
Site descriptions: Povegliano Veronese
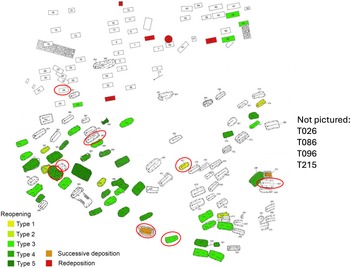
The early medieval necropolis of Povegliano Veronese, located in northern Italy, some 15 km southwest of Verona, has been the focus of multiple archaeological and bioarchaeological investigations (Bruno and Giostra Reference Bruno, Giostra, Redi and Forgione2012; Francisci et al. Reference Francisci, Micarelli, Iacumin, Castorina, Di Vincenzo, Di Matteo, Giostra, Manzi and Tafuri2020; Giostra Reference Giostra2014; Giostra et al. Reference Giostra, Micarelli and Vergine2024; Micarelli Reference Micarelli2020; Micarelli et al. Reference Micarelli, Paine, Giostra, Tafuri, Profico, Boggioni, Di Vincenzo, Massani, Papini and Manzi2018; Panella Reference Panella2018; Zeppilli et al. Reference Zeppilli, Micarelli, Bernardini, Profico, di Giannantonio, Giostra, Paine, Manzi and Tafuri2023) though no radiocarbon analysis had been carried out prior to the present study. Excavations conducted between 1985–1986 and 1992–1993 revealed 162 burials (148 single, 14 multiple) (Figure 4). The typology of the burials, some of which were so-called Tottenbret graves (wooden-lined), along with the topographical layout of the cemetery and material culture associated with the graves and the presence of a ritual features such as a headless horse burial led scholars to argue that the cemetery was associated with one of the earliest Longobard settlements in Italy and in use from the end of the sixth through to the early eighth centuries AD (Francisci et al. Reference Francisci, Micarelli, Iacumin, Castorina, Di Vincenzo, Di Matteo, Giostra, Manzi and Tafuri2020).
Site plan of Povegliano Veronese with sampled graves circled in red (modified from Giostra, Micarelli, and Vergine Reference Giostra, Micarelli and Vergine2024, fig. 2).

Analysis of grave goods and burial types identified three chronological phases within the cemetery: Phase 1 (circa 570–620 CE), Phase 2 (circa 620–670 CE), and Phase 3 (circa 670–720 CE) (Giostra et al. Reference Giostra, Micarelli and Vergine2024; Micarelli Reference Micarelli2020). In the northern sector, burials are aligned in a north-south orientation and spaced at regular intervals. This area includes the deposition of the headless horse and two greyhounds, which appear to serve as a focal point around which graves are concentrated. The burials in this sector comprise single inhumations, multiple reductions, and reinterments, though none are directly aligned with the horse pit.
Different areas of the cemetery were used for family burials for an extended period, evident in the arrangement of graves across the site. The burial groups in areas distant from the cemetery’s center can be summarized briefly. The largest funerary sector appears to house a family group probably associated with the first generations settled in Povegliano, as suggested by the presence of graves with corner postholes and grave goods, particularly those belonging to armed individuals. However, a masonry tomb in this area suggests that the sector continued to be used during later phases. The area farthest from the cemetery’s center contains only two burials, one single and one multiple, both in masonry tombs, which have been dated to the late seventh century. In Area E, several graves were identified, all simple inhumations, including two reinterments.
Isotopic analyses (87Sr/86Sr) were conducted to further investigate the origins of the individuals buried in Povegliano Veronese (Francisci et al. Reference Francisci, Micarelli, Castorina and Tafuri2019, Reference Francisci, Micarelli, Iacumin, Castorina, Di Vincenzo, Di Matteo, Giostra, Manzi and Tafuri2020). These analyses identified three distinct groups corresponding to different geochemical signatures (referred to as Group A, Group B, and Group C, respectively), indicating individuals of varied origins. Approximately 63% of the individuals exhibit Sr values consistent with local signatures, forming the so-called local group. Around 29%, dating to the cemetery’s earliest phase, display higher Sr ratios than those of the local background, suggesting a different place of origin—classified as non-locals. Notably, isotopic values from Lake Balaton in Hungary align with this group’s signature. Finally, two individuals—a male (T23) and a female (T US426)—show the highest Sr ratios compared to the other groups. These individuals probably originated from a region distinct from both the locals and non-locals. In conclusion, the mobility model suggests high mobility among the first-phase individuals buried at Povegliano Veronese, supporting the hypothesis of migration from Pannonia. Dietary isotopes have not yet been published, though we report five new values below as part of this study.
Artifacts recovered from the graves include gold S-shaped buckles in female graves and Germanic weapons in male graves, supporting the association of the cemetery with the first generation of Longobard settlers in Italy (Giostra Reference Giostra2014). Some burials contained minimal grave goods, suggesting social or ritual variability. The site also yielded evidence of repurposed graves, such as disarticulated remains in circular pits and reused burial structures.
Osteological analyses identified 55 sub-adults and 169 adults (45 males, 44 females, and 80 individuals of indeterminate sex), with a significant number of commingled remains in collective burials (Micarelli Reference Micarelli2020). Examination of degenerative joint disease (DJD) revealed a probable gendered division of labor, with males engaging in more physically demanding tasks. DJD was more prevalent during the cemetery’s initial phase (late sixth to early seventh century CE), corresponding to the migration period, than in later phases (early seventh to early eighth century CE). Finally, the necropolis has been the subject of studies on severe health conditions, addressing both metabolic stress and intestinal infections. In the first case, research on metabolic diseases identified the probable presence of scurvy, especially in the later-phase individuals, a condition attributed to vitamin C deficiency (Panella Reference Panella2018) (Panella Reference Panella2018)—an aspect that still needs to be investigated for the necropolis and will soon be explored through new dietary analyses of its individuals. In the second, a paleoparasitological analysis of sediment from skeletal remains and sewer drains from the Povegliano Veronese necropolis revealed no evidence of parasites—pathogens that in other contexts are typically transmitted via the fecal–oral route or acquired through the consumption of undercooked meat (Ledger et al. Reference Ledger, Micarelli, Ward, Prowse, Carroll, Killgrove, Rice, Franconi, Tafuri and Manzi2021).
Methods
Sampling
All 56 radiocarbon samples were taken from inhumed human bone in order to create a uniform dataset for study as well as to remove any possible interference from heirloom or intrusive objects. Samples of >2 g were taken from burials that preserved enough collagen to not require significant destruction of the overall skeleton, and thus did not sample neonates, resulting in a bias towards older children, subadults, and adults in our dataset. In the cases of graves containing multiple individuals, samples were taken that avoided any possibility of sampling the same individual twice. Ethical considerations were thoroughly addressed throughout the research: wherever possible, non-destructive approaches were prioritized, and in several cases, isotopic analyses were performed on previously extracted collagen, thus avoiding any additional impact on the skeletal material. All samples—whether from fragmented bones or collagen—were analyzed in full compliance with Italian and international ethical and legal guidelines. The study and related analyses were carried out under the framework of official agreements currently in place with the Soprintendenza Archeologia Belle Arti e Paesaggio per la provincia di Viterbo e per l’Etruria Meridionale, the Soprintendenza Archeologia, Belle Arti e Paesaggio per le province di Verona, Rovigo e Vicenza, and the Soprintendenza Archeologia, Belle arti e Paesaggio per l’area metropolitana di Roma e la provincia di Rieti.
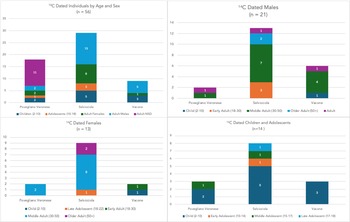
Male burials have tended to dominate the discussion of early medieval mortuary archaeology in Italy, especially as they are most commonly buried with grave goods. The burials of women and children have received less detailed attention, especially those without grave goods, and thus their relative dates have been less reliably conceived. This study provides 14C dates for 10 children between the ages of 2–10, and five adolescents (Figure 5). Adolescents are particularly underrepresented in the archaeological record, in part because of the narrow age range of 13–17 years typically used to define adolescents which coincides with a relatively low-risk period of life (Lewis Reference Lewis2022). The five adolescents in this study include an early adolescent between the ages of 10–12 (SLV 85/4A), two middle adolescents around 15 years of age (PV 405; SLV 86/15), and two late adolescents between the ages of 18–22 (SLV 85/9; VAC G12I1).
Sex and Age distribution of samples from study sites.

The samples from Vacone were able to be chosen from the total cemetery assemblage, while samples from Selvicciola and Povegliano were limited by archive collections available for study at the MGS, Sapienza University of Rome. Samples of bone were taken from burials at Vacone and Selvicciola and their collagen extracted at the radiocarbon laboratories prior to analysis, while pre-extracted collagen was used for 13 of the 19 samples from Povegliano Veronese.
Laboratories
Eight samples from Vacone (VAC1-G1I1; VAC1-G2I1; VAC1-G2I2; VAC1-G2I3; VAC1-G3I1; VAC1-G5I1; VAC1-G8I1; VAC1-G10I1) were prepared and analyzed at Poznań Radiocarbon Laboratory and 14C AMS Laboratory (https://radiocarbon.pl/en/) at the Adam Mickiewicz University in Poznań, Poland. Collagen preservation was determined using a ThermoScientific Flash EA 1112 Series and was then extracted using standard procedures (Longin Reference Longin1971; Piotrowska and and Goslar Reference Piotrowska and Goslar2002). Once extracted, processed, and filtered, the carbon isotope ratios of the collagen were then determined using a 1.5 SDH-Pelletron Model “Compact Carbon AMS.” All other samples from Vacone, Selvicciola, and Povegliano Veronese were processed and analyzed at Vilnius Radiocarbon Laboratory in Vilnius, Lithuania (https://vilniusradiocarbon.com/). Samples requiring collagen extraction were ultrasonicated and treated with a standard acid-base-acid procedure using NIST-OXII and phthalic anhydride before gelatinization, filtration, and freeze drying. Samples were then graphitized with Automated Graphitization Equipment AGE-3 (Ionplus AG, Zürich) before measuring carbon isotope ratios in a Single Stage Accelerator Mass Spectrometer (SSAMS, NEC, USA) or Low-Energy Accelerator (LEA, Ionplus AG, Zürich).
Analysis
The results were calibrated in OxCal v.4.4 (Bronk Ramsey Reference Bronk Ramsey2009) using the OxCal20 calibration curve (Reimer et al. Reference Reimer, Austin, Bard, Bayliss, Blackwell, Bronk Ramsey, Butzin, Cheng, Edwards and Friedrich2020). Individual dates were calibrated and plotted in OxCal, and the results from each site were then analyzed using sequenced phases, summed probability distributions (SPD), and kernel density estimates (KDE) in order to understand inter- and intra-site trends in burial chronology. The OxCal code for each of these analyses is included in Appendix 2 to allow full transparency and replicability of our results (Appendix 2).
While there has been ample debate about the utility of SPD analysis of radiocarbon datasets (Bronk Ramsey Reference Bronk Ramsey2017; Contreras and Meadows Reference Contreras and Meadows2014; Crema Reference Crema2022; Crema and Bevan Reference Crema and Bevan2021; Hinz Reference Hinz2020; McLaughlin Reference McLaughlin2019) the dataset under consideration here sidesteps some issues of qualitative differences in archaeological practice since all of the dates come from the single material type of human bone. Moreover, because we use the dates to investigate chronological trends in mortality, the issues inherent to using SPDs to reconstruct palaeodemography of the living are not applicable. The SPD results are still potentially biased by sample availability on individual sites, and so Bayesian KDE modeling was also used on each site’s dataset to separate out any potential “noise” from the SPD (Bronk Ramsey Reference Bronk Ramsey2017; Brownlee Reference Brownlee2023; Crema Reference Crema2022). These analyses were performed in OxCal v.4.4, using the commands Sum and KDE_model, following the methods outlined by (Bronk Ramsey Reference Bronk Ramsey2017). The results of the KDE modeling are presented in figures below, and both unmodeled and modeled dates and confidence intervals are included in Appendix 1.7. The relatively small size of our dataset does not allow for a reliable “dates as data” approach and, as such, we did not pursue advanced KDE modeling using the Rcarbon package of R (Brownlee Reference Brownlee2023; Crema and Bevan Reference Crema and Bevan2021). While we recognize the larger range of analyses possible with that program due to kernel adjustability, we reserve those analyses for the future with a larger dataset to consider.
We considered the possible impact of a marine reservoir effect on date calibration in these analyses based on the availability of carbon and nitrogen isotopes. Twenty-two of the samples under consideration from Selvicciola have previously published isotopic data (Tafuri et al. Reference Tafuri, Goude and Manzi2018), with δ1 3C values between –21.15 to –19.01‰ and δ1⁵N values between 4.98 and 10.23‰, consistent with a C3 terrestrial plant-based diet (Appendix 1.1). No carbon or nitrogen values have been published for Poveglianio Veronese, though we present five new values here (Table 1 and Appendix 1.2), with δ1 3C values between –16.57 and –14.06‰ and δ1 5N values between 7.97 to 9.17‰, consistent with a mixed terrestrial diet that is more heavily C4-based than the individuals from Selvicciola. The cemetery at Vacone has not yet been subjected to isotopic study, though we might expect similarities with Selvicciola based on geographic proximity. Based on these isotopic data and following precedent from other studies (Brownlee Reference Brownlee2023, 1237; Hines Reference Hines2024, 254), we exclude the possibility of a reservoir effect and the need for marine calibration of radiocarbon results.
New dietary isotopes from Povegliano Veronese

Finally, it must be remembered that our samples represent only portions of the larger site assemblages, and that the shape of the results that we present here are a direct result of that sampling strategy. The phases and chronological trends revealed through radiocarbon analysis may well change if more data are added to the models, but this study provides a starting point for the construction of an absolute chronology for burials in early medieval Italy.
Results
Results: Vacone
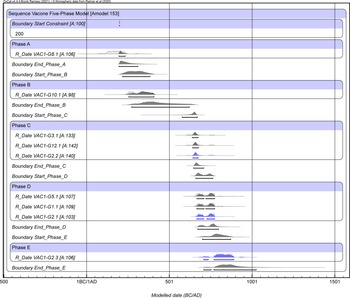
Phased sequence analysis of the nine dates from Vacone revealed that a five-phase model best fit the site, with an agreement index of Amodel 154.7 (Figure 6, Appendix 1.3). Phases A and B have significant uncertainty in their boundaries partially due to the complications of the calibration curve for the period ca. AD 60–230 (Bayliss et al. Reference Bayliss, Brown, Dee, Marshall and Wacker2024), though both must postdate the collapse of the villa ca. AD 200. Introducing the Boundary Start Constraint of AD 200 forces the sample’s probability to fall after this date, resulting in a modeled date of cal AD 196–235 (2σ) for Grave 8, and a modeled end of Phase A at cal AD 196–323 (2σ). Phase B, consisting here of only the single date from Grave 10, begins with a modeled cal AD 216–383 (2σ) and modeled end of cal AD 274–629.
Five-phased Bayesian model of samples from Vacone (n = 9) with Amodel = 153. Individuals from multiple burial colored coded. See Appendix 1.3 for data table.

Figure 6 Long description
Panel A: A line graph showing the boundary start constraint for Phase A. The horizontal axis represents the modeled date in BC AD, ranging from 500 BC to 1500 AD. The vertical axis represents the probability distribution. The graph includes a single data line labeled Boundary Start Constraint A 100, showing a peak around 200 AD. Panel B: A line graph showing the boundary end of Phase A and the start of Phase B. The horizontal axis represents the modeled date in BC AD, ranging from 500 BC to 1500 AD. The vertical axis represents the probability distribution. The graph includes two data lines labeled Boundary End Phase A and Boundary Start Phase B, showing peaks around 400 AD and 500 AD respectively. Panel C: A line graph showing the boundary end of Phase B and the start of Phase C. The horizontal axis represents the modeled date in BC AD, ranging from 500 BC to 1500 AD. The vertical axis represents the probability distribution. The graph includes two data lines labeled Boundary End Phase B and Boundary Start Phase C, showing peaks around 600 AD and 700 AD respectively. Panel D: A line graph showing the boundary end of Phase C and the start of Phase D. The horizontal axis represents the modeled date in BC AD, ranging from 500 BC to 1500 AD. The vertical axis represents the probability distribution. The graph includes two data lines labeled Boundary End Phase C and Boundary Start Phase D, showing peaks around 800 AD and 900 AD respectively. Panel E: A line graph showing the boundary end of Phase D and the start of Phase E. The horizontal axis represents the modeled date in BC AD, ranging from 500 BC to 1500 AD. The vertical axis represents the probability distribution. The graph includes two data lines labeled Boundary End Phase D and Boundary Start Phase E, showing peaks around 1000 AD and 1100 AD respectively. Panel F: A line graph showing the boundary end of Phase E. The horizontal axis represents the modeled date in BC AD, ranging from 500 BC to 1500 AD. The vertical axis represents the probability distribution. The graph includes a single data line labeled Boundary End Phase E, showing a peak around 1200 AD.
Phase C is more chronologically constrained, beginning some three centuries later with a modeled start of cal AD 582–671 (2σ) and an end of cal AD 648–707 (2σ). This phase contains individuals 2.2, 3.1, and 12.1, each with modeled dates between cal AD 639–676 (2σ). Phase D follows with a modeled start of cal AD 661–765 (2σ) and end of cal AD 673–799 (2σ). This phase contains individuals 1.1, 2.1, and 5.1, each with modeled dates between cal AD 667–774 (2σ), indicating a difference of only a few decades with the preceding burials. The final Phase E has a modeled start of cal AD 705–873 (2σ) and end of cal AD 718–1037 (2σ), with individual 2.3 having a modeled date of cal AD 716–891 (2σ). Importantly, the fact that the three individuals buried in Grave 2 fall into three different phases of the site use confirms that this is a secondary burial composed of individuals probably disturbed by more recent agricultural activity and subsequently reburied.
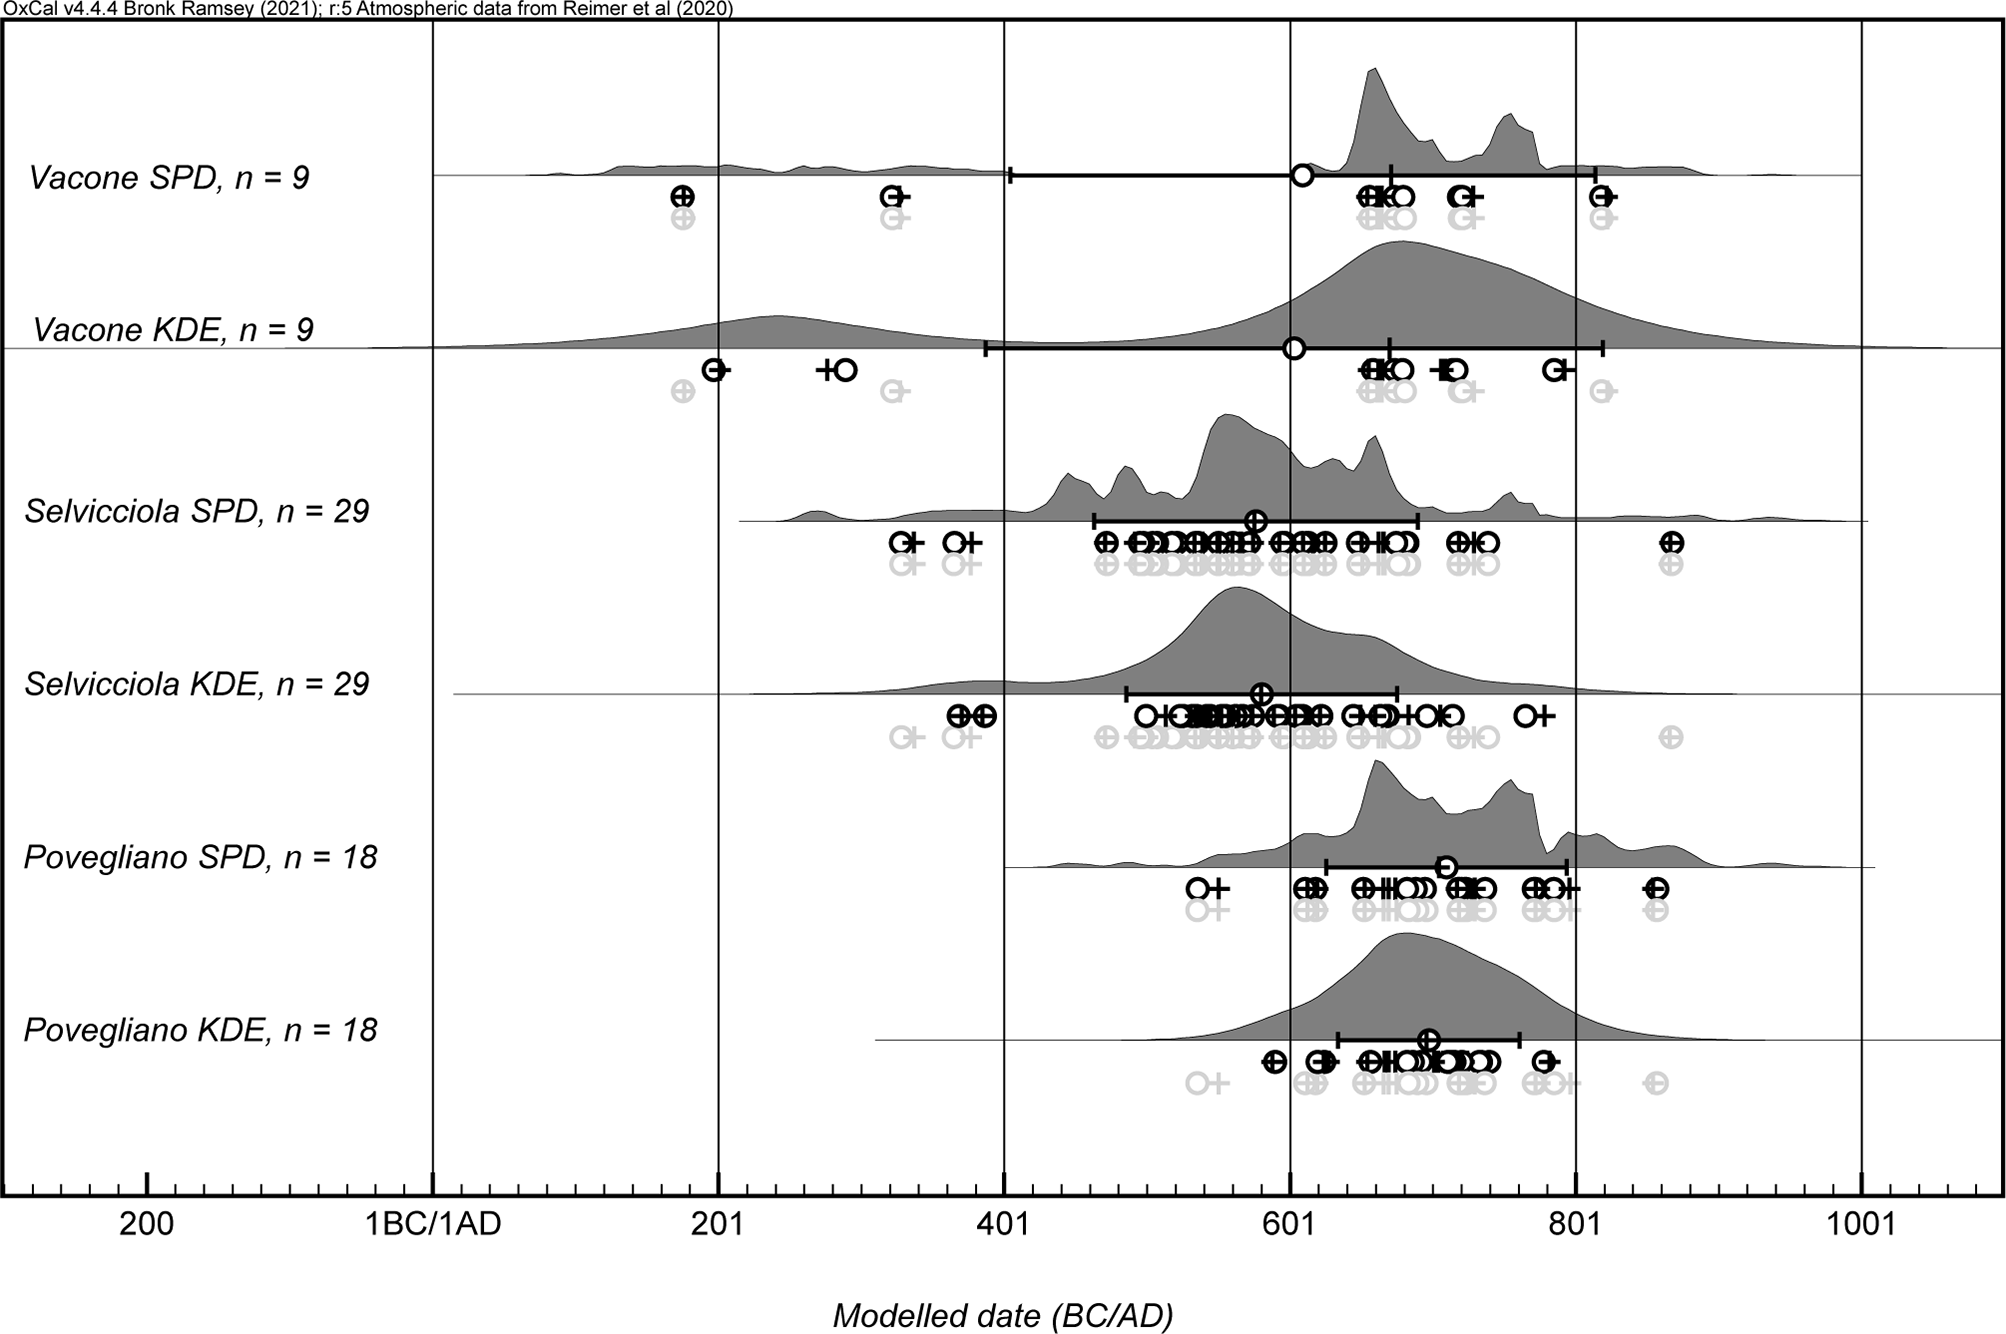
The SPD and KDE models from Vacone ably capture the distinct periods of cemetery use between the later Roman and the early medieval periods (Figure 9). The SPD shows sharp peaks in the early medieval period ca. AD 660 and 760 corresponding to Phases C and D, while the KDE smooths this early medieval variation to a single peak ca. AD 680. The difference in sample size between the two periods (two later Roman vs. seven early medieval) undoubtedly contributes to the difference in the size of their respective peaks, though the chronological trend remains generally consistent between the two methods. It is also noteworthy that the highest early medieval peak in the SPD ca. AD 660 corresponds to a steeper portion of the IntCal20 calibration curve between AD 630–690, while the secondary peak ca. AD 760 corresponds to the spike in the curve preceding the AD 774 Miyake event (Miyake et al. Reference Miyake, Nagaya, Masuda and Nakamura2012; Reimer et al. Reference Reimer, Austin, Bard, Bayliss, Blackwell, Bronk Ramsey, Butzin, Cheng, Edwards and Friedrich2020)—this latter spike is not visible in the KDE model.
Results: Selvicciola
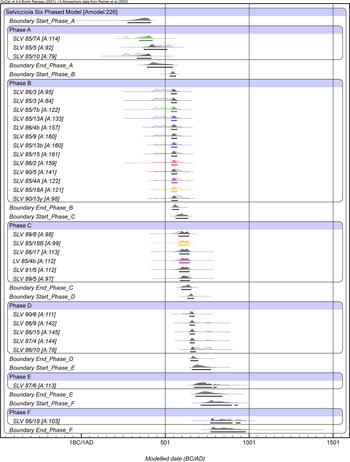
Twenty-eight of the 29 samples from Selvicciola returned valid results (sample SLV 86/2 returned an unreliable collagen range, see Appendix 1) that ranged from the third to tenth centuries AD. Phased sequence analysis revealed that a six-phase model best fit the site, with an agreement index of Amodel 226.5 (Figure 7, Appendix 1.4). Phase A contained three burials with a modeled start of cal AD 275–414 (2σ) and modeled end of cal AD 395–542, corresponding to the late Roman period and final phases of the villa occupation. Thirteen burials fell into Phase B, with a relatively tightly modeled start of cal AD 531–562 (2σ) and end of cal AD 545–581 (2σ). Phase C included six burials, with a modeled start of cal AD 656–634 (2σ) and modeled end of cal AD 599–654 (2σ). Phase D included five burials, with a modeled start of cal AD 636–669 (2σ) and a modeled end of cal AD 655–695 (2σ). The two youngest dates from the final two phases; Phase E has a modeled start of cal AD 662–770 (2σ) and a modeled end of cal AD 682–840 (2σ), while Phase F has a modeled start of cal AD 712–928 (2σ) and a modeled end of cal AD 773–983 (2σ).
Six-phased Bayesian model of samples from Selvicciola (n = 29) with Amodel = 226. Individuals from multiple burials color coded by grave. Individual in red returned insufficient collagen and is marked as unreliable. See Appendix 1.4 for data table.

Two individuals stand out as particularly important for the broader phasing of the site. The earliest grave, 85/10, was an a cappuccina grave located inside the apse of the church containing a male over the age of 50 buried with an unidentifiable coin and lamp fragments (Micarelli Reference Micarelli2020). This individual had been relatively dated to the first phase of the cemetery, thought to begin at the end of the fourth century AD. The date of this individual, 1727 ± 26 BP or modeled cal AD 275–414 (2σ), is therefore perhaps somewhat earlier than might have been expected.
The second grave, 86/3, was another a cappuccina burial that was located under the apse of the church, providing a terminus post quem for the construction of the church. The grave contained the burial of a female individual between the ages of 40–50 buried with two bronze arm bands, a one-handled ceramic jug, and a pair of bronze earrings, suggesting a date between the mid fifth and early sixth centuries AD. This grave returned a date of 1563 ± 27 BP, or modeled cal AD 537–568 (2σ), which agrees with refines the dating of the mid-fifth to early-sixth century suggested by the grave goods. This date thus suggests that the terminus post quem for the construction of the church may be slightly later than originally thought, after the middle of the sixth century.
To return to the dating of women and children, we obtained dates for seven subadults at Selvicciola (85/4A; 85/13A; 85/7B; 85/13B; 85/18B; 86/15; 87/6). Burial SLV 87/6, a subadult between the ages of 2 and 3 years, is noted in the original excavation reports only as post-dating the construction of the church. This individual returned a radiocarbon date of 1263 ± 27 BP, or modeled cal AD 675–803 (2σ), making it the second latest burial from Selvicciola dated by this study.
The multiple burials from Selvicciola show interesting patterns. Individual 85/7A was buried in Phase A, that is the Late Roman period, before Individual 87/7b was added to the grave in Phase B. Both individuals in Grave 85/13 were interred in Phase B, and Graves 85/4 and 85/18 were first used. These latter two were then added to in Phase C. These chronological relationships are explored further below.
The SPD model of the Selvicciola burials reflect the multi-phase nature of the site and the relatively long duration of use of the cemeteries (Figure 9). The SPD captures the early beginnings of the cemetery in the third and fourth centuries corresponding to Phase A before showing the much higher probabilities during the early medieval period, particularly the largest peak ca. AD 540–560 in Phase B and a slightly lower peak at ca. AD 660 in Phases C and D. The SPD then drops off to capture the final dates from Phases E and F in the eighth, ninth, and tenth centuries. The KDE model shows the same trends but removes much of the signal variation in the fifth century. The highest peak is slightly later, ca. AD 570, and then the later history of the cemetery is shown as a much smoother decline, with a slight bump ca. AD 660. Overall, these models highlight the tight clustering of dates in the later sixth and seventh centuries, while the KDE smooths what came before and after.
Results: Povegliano Veronese
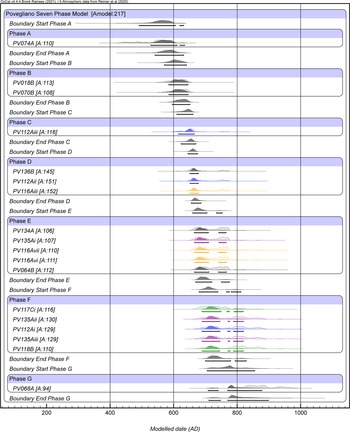
The 18 new dates from Povegliano Veronese ranged from the mid sixth to ninth centuries, and phased sequence analysis suggests seven phases of burial with an agreement index of Amodel 215.6 (Figure 8, Appendix 1.5). Phase A has a modeled start of cal AD 492–631 (2σ) and modeled end of cal AD 540–631, containing the single sample PV074A from Grave T362. Phase B contained two individuals with a modeled start of cal AD 571–640 (2σ) and modeled end of cal AD 596–652 (2σ). Phase C contained the single sample PV112Aiii from grave T348 with a modeled start of cal AD 610–660 (2σ) and modeled end of cal AD 623–670 (2σ), the individual itself with a modeled date of cal AD 616–664 (2σ). Phase D, with three individuals, begins cal AD 645–675 (2σ) and ends cal AD 655–686 (2σ). Phase E, with five individuals, begins cal AD 660–756 (2σ) and ends cal AD 670–775 (2σ). Phase F with five individuals begins cal AD 680–810 (2σ) and ends cal AD 698–828 (2σ). The final Phase G, with one individual, begins cal AD 706–856 (2σ) and ends 710–897 (2σ), with a modeled date of cal AD 708–881 (2σ).
Seven-phased Bayesian model of samples from Povegliano Veronese (n = 18) with Amodel = 217. Individuals from multiple burials are color coded by grave. By grave See Appendix 1.5 for data table.

Comparison of SPD and KDE models for each site. Open circles represent mean ages, crosses represent median ages, and horizontal bars represent σ. Black symbols indicate modeled dates, light gray unmodeled, note that these only differ on KDE plots.

Figure 9 Long description
The image contains multiple graphs comparing SPD and KDE models for three sites: Vacone, Selvicciola, and Povegliano. Each site has two graphs: one for SPD and one for KDE. Open circles represent mean ages, crosses represent median ages, and horizontal bars represent modeled dates. Black symbols indicate modeled dates, while light gray symbols indicate unmodeled dates. Panel A: Vacone SPD and KDE graphs. The x-axis represents modeled dates in BC/AD, and the y-axis represents the frequency. The SPD graph shows a relatively flat distribution with a slight peak around 600 AD. The KDE graph shows a more pronounced peak around 600 AD. Panel B: Selvicciola SPD and KDE graphs. The x-axis represents modeled dates in BC/AD, and the y-axis represents the frequency. The SPD graph shows multiple peaks, with the most significant around 600 AD. The KDE graph also shows multiple peaks, with the most significant around 600 AD. Panel C: Povegliano SPD and KDE graphs. The x-axis represents modeled dates in BC/AD, and the y-axis represents the frequency. The SPD graph shows a peak around 600 AD. The KDE graph shows a similar peak around 600 AD.
It is difficult to know what to make of these phases with one or two individuals, as they are undoubtedly constrained by our sample size and selection. Were we to date further samples from the site, these would probably fill in or maybe even reduce to fewer overall phases. As it is, however, we can currently say that most of these samples fall into the seventh century and cluster into four separate burial phases with such tight chronologies that we may imagine four separate burial events.
Several individuals from the Povegliano necropolis, previously identified as being locally born based on isotopic data (Francisci et al. Reference Francisci, Micarelli, Iacumin, Castorina, Di Vincenzo, Di Matteo, Giostra, Manzi and Tafuri2020), have now been radiocarbon dated, reinforcing the site’s occupational sequence. All of these single burials, with the exception of one, are dated to the earlier phases of the necropolis, which spans from the late 6th to the early 7th century AD. Specifically, this includes the adult male (sample PV074A) from Grave T362 in Phase A, the very young individual (PV070B) from Grave T427, and an adult female (PV018B) from T349, both in Phase B. In contrast, the adolescent PV068A from Grave T405 is dated to the latest phase of the necropolis, tentatively placed between the 8th and 9th centuries AD.
The SPD and KDE from Povegliano Veronese are very similar to that of Vacone. The SPD shows two significant peaks, one ca. AD 660 corresponding to site Phases D and E and the other ca. AD 760 corresponding to Phase F as well as the steepest sections of the IntCal20 curve for the period. The sharp dip after the second peak also reflects the Miyake event ca. AD 774. Outside this core zone of the seventh and eighth centuries, the SPD shows minor anterior and posterior tails related to the sparse earlier (Phases A–C) and later dates (Phase G). The KDE model smooths this variability to show one significant peak ca. AD 660–680 with a fairly evenly shaped bell curve distribution for the rest of the data on either side.
Results: Synthesis of all sites
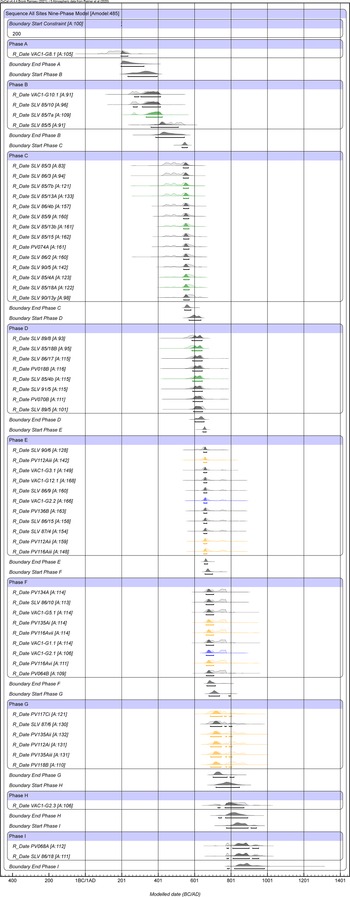
When all 56 dates are combined and studied synthetically, we find that they fall into nine phases shared between the different cemeteries with an agreement index of Amodel 484.5 (Figure 10, Appendix 1.6). Phase A contains only the earliest burial from Vacone, constrained again with a starting boundary of AD 200, resulting in a modeled end of the phase at cal AD 196–323 (2σ). Phase B is shared between Vacone and Selvicciola and includes three individuals with a modeled start at cal AD 234–395 (2σ) and modeled end at cal AD 387–545 (2σ). Phase C includes 13 individuals from Selvicciola and one from Povegliano Veronese, with a modeled start at cal AD 531–562 (2σ) and modeled end at cal AD 545–581 (2σ). Phase D includes six dates from Selvicciola and two from Povegliano Veronese with a modeled start of cal AD 570–635 (2σ) and a modeled end of cal AD 602–653 (2σ). Phase E includes 11 individuals and is the first to span all three sites, with four from Selvicciola, three from Vacone, and four from Povegliano Veronese, with a modeled start of cal AD 646–664 (2σ) and a modeled end of cal AD 654–672 (2σ). Phase F includes one individual from Selvicciola and five from Povegliano Veronese, and three from Vacone with a modeled start of cal AD 659–696 (2σ) and a modeled end of cal AD 670–713 (2σ). Phase G includes five individuals from Povegliano Veronese and one from Selvicciola with a modeled start of cal AD 678–739 and a modeled end of cal AD 701–808. Phase H contains only the latest individual from Vacone with a modeled date of cal AD 728–870 (2σ), and Phase I contains the latest individuals from Selvicciola and Povegliano Veronese, with a modeled start of AD 775–937 and modeled end of cal AD 782–977.
Nine-phased Bayesian model for all sites (n = 56) with Amodel = 485. Individuals in multiple burials are color coded by site. See Appendix 1.6 for data table.

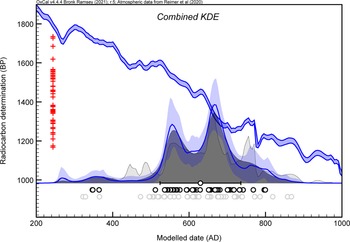
When the SPD and KDE models of each site are combined (Figure 11, Appendix 1.7), general patterns emerge that unite the three sites into a tentative narrative of early medieval burial in Italy with an agreement index of Amodel 123.7. The SPD reflects the peak at Selvicciola in the middle of the 6th century as well as the later peaks at Vacone and Povegliano ca. AD 660 and 760. The vast majority of the burials from all three sites fall between AD 520–760, corresponding to Phases C-G from the total phased model and including 48 out of 56 dates, with only sparse outliers on either side of this bulk. These main phases of all three sites have a modeled start of cal AD 531–562 (2σ) and modeled end of cal AD 701–808 (2σ). The earlier outliers come from the later Roman cemeteries at Vacone and Selvicciola, while the latest come from all three sites. The KDE model similarly reflects the peaks at ca. AD 560 and 660 but smooths out the eighth century probability from Vacone and Povegliano into a more gently declining curve that also does not reflect the Miyake event of AD 774. Taken together, these synthetic models ably identify the large cluster of activity in the sixth and seventh centuries, while also removing some of the “noise” of the SPD from the eighth.
Comparison of SPD (dark gray) and KDE (blue with 95% confidence envelope), with Amodel = 123.7. See Appendix 1.7 for data table.

Figure 11 Long description
Panel A: A line graph showing the comparison of SPD and KDE models over time. The horizontal axis represents the modeled date in A D, ranging from 200 to 1000. The vertical axis represents radiocarbon determination in B P, ranging from 1000 to 1800. The SPD model is represented by a dark gray line, while the KDE model is represented by a blue line with a 95% confidence envelope in light blue. The graph shows multiple peaks and troughs, indicating variations in radiocarbon determination over the modeled dates. Red plus signs on the left side of the graph indicate specific data points. Black circles at the bottom of the graph represent individual data points used in the models.
Discussion
Grave goods
Groups such as the Longobards are known largely from grave goods such as weapons, brooches, buckles, and combs that were uncovered by 19th and early 20th century cemetery explorations and are now housed in museum collections where they are rarely connected to the graves from which they came (Christie Reference Christie2016). Grave goods are traditionally used to date not only graves but settlements, a practice that is especially problematic when considering that grave goods indicate how an individual was treated after death and not necessarily during their life.
Only one of the Vacone graves, VAC1 G12, contained a datable grave good—a bronze “omega fibula” with volute terminals and incised numerals and an iron clasp. This type of brooch becomes popular from the end of fifth century AD and remains so through the end of the seventh century AD therefore supplying only a very broad chronological range for the burial (Von Hessen Reference Von Hessen1983). The 14C date of this individual, 1361 ± 31 BP, or cal AD 642–677 (2σ), falls within the stylistic range of the brooch, but provides a much more refined date for the burial in the mid to late seventh century AD. When placed in context with the other burials at Vacone, we are able to recognize a small cluster of burials in this period.
Numerous graves at Selvicciola contained burial goods, including those of 18 of the sampled individuals, 10 of which had been dated or phased based on these goods. Some of the individuals returned dates that were well aligned with the dating provided by the grave goods, such as 87/4 and 86/9, both “armor burials” (Micarelli Reference Micarelli2020). SLV 87/4 is an adult male between the ages of 30–40, dated to the latter half of the seventh century AD by two characteristic belts that were buried with the individual, returned a radiocarbon date of 1349 ± 26 BP, or cal AD 650–675 (2σ). SLV 86/9 is a male between the ages of 20–30, dated to the latter half of the seventh/early eighth century on the basis of the grave goods including a scramasax and belt fittings, returned a date of 1357 ± 28 BP, or cal AD 648–675 (2σ).
Others provide a slight revision of the stylistically suggested date. SLV 86/17, a female over the age of 50, was buried with a bone comb and an iron pin, neither of which have a secure typological dating and the individual was thus very broadly dated between the end of the sixth and beginning of the eighth centuries AD. This individual returned a radiocarbon date of 1461 ± 27 BP, or cal AD 586–642 (2σ), allowing this individual to be placed more securely in the first half of the seventh c. AD.
Two individuals at Selvicciola, both females between the ages of 30 and 40, were buried in a cappuccina tombs along with several grave goods including items of bronze and glass paste jewellery that were used to provide a stylistic date range from the mid-sixth to mid-seventh AD for their burials: SLV 85/3 was buried with a pair of bronze earrings with a glass paste bead, and SLV 85/15 with two bronze rings, each with a glass paste bead. These individuals returned radiocarbon dates of 1566 + 27, or cal AD 537–568 (2σ), and 1534 + 28, or cal AD 539–570 (2σ) respectively. These dates suggest that the first individual (SLV 85/3) died prior to the mid-sixth century AD, perhaps some 100 years earlier than the date originally suggested based on an assessment of grave goods.
The most striking adjustment to a date from a grave good is seen in Selvicciola grave 86/18, which had previously been dated to the first decades of the seventh century AD on the basis of a bronze and silver pin (Micarelli Reference Micarelli2020). This individual, a male between the ages of 30–40, returned a date of 1168 ± 28, or cal AD 771–950 (2σ).
At Povegliano Veronese, a young child (PV070B from Tomb 427) was buried with two so-called “S” brooches, a characteristic type of brooch known from Pannonia and northern Italy (Giostra Reference Giostra2014). This individual, archaeologically dated to the first phase of the cemetery, returned a 14C date of 1442 ± 29 BP, or cal AD 585–645 (2σ). The 14C date confirms the archaeological date, and importantly also marks the first independent date of an “S”-brooch of which the authors are aware.
Multiple burials
Graves with multiple burials are a common occurrence in early medieval cemeteries in Italy (51 identified in (Franconi and Larkin Reference Franconi and Larkin2021; Giostra et al. Reference Giostra, Micarelli and Vergine2024). While there are multiple explanations for the phenomenon, including later reuse of a previously constructed grave, there are circumstances in which two or more individuals were interred simultaneously. While episodes of reopening and reuse can be identified from the stratigraphic situation of a grave, such information is of 10 unavailable from published reports, particularly from older excavations. A recent analysis of 34 Longobard open-field (in campo aperto) cemeteries in Italy, each with more than 20 known tombs, found that a quantification of reopened tombs was possible in only half these cemeteries (Giostra et al. Reference Giostra, Micarelli and Vergine2024). Absolute dating provides the most reliable method for determining whether such burials are concurrent or reuse.
The simultaneous burial of multiple individuals in a single grave raises the possibility that the individuals’ circumstances of death were in some way exceptional and represent some kind of societal crisis in which traditional burial style was abandoned. Considering the complicated nature of the early medieval period in Italy, there are many possible explanations for societal disruptions, not the least of which was war. However, none of the burials here considered show any signs of violent deaths, and so we may also consider episodes of death caused by plague. The First Pandemic of Bubonic Plague, caused by the bacterium Yersinia Pestis, struck the Mediterranean and Europe in AD 541, and returned at least 20 times over the following 200 years. The initial outbreak of this pandemic in the Mediterranean (ca. AD 541–544) is commonly known as the Justinianic Plague, and contemporary written sources record the horror of widespread “inguinal plague” that killed, according to their observations, thousands by the day (Harper Reference Harper2018, Reference Harper2023; Keller et al. Reference Keller, Spyrou, Scheib, Neumann, Kröpelin, Haas-Gebhard, Päffgen, Haberstroh, Ribera i Lacomba and Raynaud2019; McCormick Reference McCormick2021). This first wave of the pandemic arrived in Italy at least by AD 542, and historical references suggest at least nine and perhaps as many as 14 subsequent outbreaks during the First Pandemic (Harper Reference Harper2023).
Drawing on parallels from the Second Plague Pandemic (AD 1347–1772 in Europe) and especially the Black Death (AD 1347–1351), scholars researching the First Plague Pandemic have especially sought “mass graves,” defined as a burial containing more than five individuals (McCormick Reference McCormick2015, Reference McCormick2016), as archaeological indicators of increased mortality from the plague. Examples from the Second Plague Pandemic are known from various locations: in England at the East Smithfield cemetery in London (Grainger Reference Grainger2008; Pfizenmaier Reference Pfizenmaier2016) where an estimated 2400 plague victims were buried between 1349–1350 and from whence the first ancient genome of Yersinia pestis was developed (Bos et al. Reference Bos, Schuenemann, Golding, Burbano, Waglechner, Coombes, McPhee, DeWitte, Meyer and Schmedes2011a, Reference Bos, Schuenemann, Golding, Burbano, Waglechner, Coombes, McPhee, DeWitte, Meyer and Schmedes2011b). Despite these Second Plague Pandemic models and ample textual reference, archaeological data for mass graves during the First Plague Pandemic is rare. McCormick identified four mass burials in Italy: at Brescia, Lombardia (seventh c. AD), Castro dei Volsci, Lazio (sixth-seventh c. CE), Carminiello ai Mannesi, Napoli (eighth c. AD), and Plaza de Almoina, Venosa, Basilicata (sixth–eighth c. AD) (McCormick Reference McCormick2016). None of these are clearly linked to the First Plague Pandemic, and at least the samples analyzed from Venosa did not preserve genetic evidence of Yersinia Pestis infection at the time of death (Posth et al. Reference Posth, Zaro, Spyrou, Vai, Gnecchi-Ruscone, Modi, Peltzer, Mötsch, Nägele and Vågene2021).
While some 50 positive identifications of First Plague Pandemic victims from aDNA are currently known from roughly 10 sites in Germany, France, Spain, and Britain (note that not all genomes are fully published though they are sometimes referenced in text, hence the numeric ambiguity) (Hines Reference Hines2024), only burials from Lunel-Viel, France, were found in anything like a mass grave, as eight individuals were buried in a ditch separate from the rest of the cemetery (Raynaud Reference Raynaud2011). The vast majority of currently known deaths from the First Plague Pandemic are thus not from mass graves, but rather from single burials or from graves containing fewer than five individuals, here referred to as multiple burials. The Anglo-Saxon cemetery at Edix Hill is a case in point, where 12 positive identifications of plague victims came from seven individual and five double burials (Hines Reference Hines2024). This is strongly suggestive that mass graves should not be the guiding archaeological material for evidence of plague death and is now paralleled by detailed evidence from Second Plague Pandemic era Cambridge, where most plague victims were buried in single, normative graves and multiple or mass burials were rare exceptions (Cessford et al. Reference Cessford, Scheib, Guellil, Keller, Alexander, Inskip and Robb2021).
That said, the appearance of multiple or mass burials are obviously worth detailed attention. All three cemeteries included graves that contained multiple burials. In some cases, it was clear from excavation how these individuals related to each other in deposition, though in others we lack the stratigraphic information to know for sure. With this in mind, we sampled multiple burials at each site: one at Vacone, four at Selvicciola, and three at Povegliano Veronese.
Vacone only produced one multiple burial, Grave 2, which contained the incomplete remains of three adult males that had been deposited into a roughly constructed cist grave which used Roman roof tiles and rubble which was set upon the villa floor. While it was clear during excavation that these fragmented individuals were placed in this grave secondarily, radiocarbon analysis returned three significantly different dates (1300 ± 30 BP, 1355 ± 30 BP, and 1210 ± 30 BP, belonging to site Phases C, D, and E respectively), further solidifying this interpretation as a secondary deposition made by combining disturbed partial remains of three original graves.
We sampled four double burials (Graves 85/13, 85/18, 85/4, and 85/7) from Selvicciola in order to determine the contemporaneity of interment. Grave 85/13 contained the remains of two children of indeterminate sex, Individual A was roughly nine years old and Individual B roughly 4–5; Individual A returned a date of 1553 ± 27 BP, or cal AD 539–568 (2σ), while Individual B returned a date of 1535 ± 26 BP, or cal AD 539–570 (2σ). This possibly confirms excavation documentation that suggested the later addition of Individual B to the pre-existing grave, though the probability distribution of each date is such that it remains possible that these two individuals could have been buried very closely together in time.
Grave 85/18 contained the remains of a woman of roughly 30–40 years of age (Individual A) as well as the remains of a roughly 3 year old child of indeterminate sex (Individual B); the adult woman returned a date of 1517 ± 27 BP, or cal AD 540–571 (2σ) from Phase B, while the child returned a date of 1479 ± 27 BP, or cal AD 582–641 (2σ) from Phase C, again suggesting the later addition of Individual B to the pre-existing grave.
Grave 85/4 contained the remains of a 10–12-year-old subadult of indeterminate sex (Individual A) as well as those of a roughly 50-year-old woman. The subadult returned a date of 1518 ± 26 BP, or cal AD 540–571 (2σ), while the woman returned a date of 1457 ± 27 BP, or cal AD 587–642 (2σ). Here, the adult was added to the pre-existing grave of the subadult.
Finally, Grave 85/7 contained the remains of a woman of roughly 50 years of age and a male of indeterminate age. The woman returned a date of 1685 ± 27 BP, or cal AD 348–423 (2σ) from Phase A, while the male returned a date of 1556 ± 27 BP, or cal AD 538–568 (2σ) from Phase B, indicating again that the grave had been re-opened and re-used. In no case was any analyzed multiple burial found to be definitively contemporaneous.
The cemetery at Povegliano Veronese has the largest number of multiple burial graves known in early medieval Italy. It is clear from excavation that some of these multiple burials were the result of re-opening graves, leading to so-called “reduction burials” where the earlier remains are pushed to one side to allow for the new interment. We sampled 11 individuals from four of these multiple burials for this study.
Tomb 348 was a sub-circular grave that contained the reduced remains of a minimum of four individuals, including three adults and one subadult. This grave was cut into an earlier grave (T347, undated here) and was cut above T349 (individual PV018B, 1457 ± 29 BP, or cal AD 585–645 (2σ)), which was undamaged due to its depth (Giostra et al. Reference Giostra, Micarelli and Vergine2024; Micarelli Reference Micarelli2020). The samples from Grave T348 suggest multiple re-openings for the deposition of the three adult individuals under consideration. Individual Aiii, an unsexed adult, is the earliest (1379 ± 30 BP, or cal AD 616–664 (2σ) in Phase C), while Individual Ai, another unsexed adult, is the latest (1242 ± 30 BP, or cal AD 689–819 (2σ) in Phase F). One of the unsexed adults from T348 has been identified as local and dated to the transitional period between the earlier and later phases of the necropolis. In contrast, the other adult individual—whose isotopic provenance is unknown—is more recent and falls entirely within the later phase. This pattern aligns well with the stratigraphy: T349, a deeply cut and undisturbed burial directly beneath T348, is the earliest of the group and clearly belongs to the first phase of the cemetery’s use.
Tomb 86, located in Sector E, another sub-circular pit grave, contained the reduced remains of seven adults, including at least two females, who had been redeposited after decomposition, with a row of skulls along the eastern edge of the grave and long bones aligned in a N–S direction (Micarelli Reference Micarelli2020). The three sampled individuals, all unsexed adults, from Grave T086 are much closer in time. One of these individuals (PV116Aiii), dated to 1341 ± 29 BP or cal AD 652–678 (2σ) in site Phase D, has been identified as local based on isotopic data (Francisci et al. Reference Francisci, Micarelli, Iacumin, Castorina, Di Vincenzo, Di Matteo, Giostra, Manzi and Tafuri2020). The other two (PV116Avii and PV116Avi) fall into the succeeding Phase E, both with modeled dates of cal AD 666–766 (2σ). These latter individuals could have been contemporaneous burials, though, due to the secondary nature of the deposition, stratigraphic information offers limited interpretive value in reconstructing the relative sequence of interments within the grave.
Tomb 403, a rectangular grave lined with bricks and stones characteristic of the seventh century AD, contained one individual interred in a supine position atop bricks with the reduced remains of four individuals placed along one of the long sides of the grave (Giostra et al. Reference Giostra, Micarelli and Vergine2024; Micarelli Reference Micarelli2020).The three individuals from T403, all unsexed adults, differ slightly, with individual Ai dating to 1304 ± 29 BP, or cal AD 666–765 (2σ) in Phase E, while individuals Aii and Aiii are nearly identical in Phase F at 1243 ± 31 BP, or cal AD 689–818 (2σ), and 1242 ± 30 BP, or cal AD 689–819 (2σ). These later individuals could have been contemporaneous burials but, again, the stratigraphic relationship is lost due to the disturbed nature of the reduction grave.
Finally, Tomb 96 is a multiple burial containing at least 10 individuals that included nine adults and one child of roughly three years age (Micarelli Reference Micarelli2020, 222). The grave was the only example in the necropolis of a constructed tomb, with stone walls and a brick-lined bottom (Micarelli Reference Micarelli2020, 94). The tomb was re-opened for successive depositions, with the latest displacing the others to the south side of the grave. The two individuals analyzed from T096 are both adults of indeterminate sex. Individual PV118B returned a date of 1234 ± 29 BP, or cal AD 689–819 (2σ), while individual PV117Ci returned a date of 1269 ± 30 BP, or cal AD 688–819 (2σ), both in Phase F. Individual PV118B was noted by excavators as the primary burial, while PV117Ci was noted as secondary and a result of grave reuse. The calibrated radiocarbon dates of both individuals fall within broadly overlapping ranges, indicating that they were likely interred within a similar time frame. While stratigraphic observations suggest sequential use of the grave, the radiocarbon evidence does not allow us to definitively determine which burial came first. Interestingly, the individual identified as the primary burial (PV118B) belongs to the later phase of the necropolis, yet the mobility isotopic value of this person falls outside the reference local range (Francisci et al. Reference Francisci, Micarelli, Iacumin, Castorina, Di Vincenzo, Di Matteo, Giostra, Manzi and Tafuri2020). Thus, our results demonstrate that the multiple burials at Povegliano Veronese are both the result of grave reopening as well as simultaneous burial of multiple individuals within the same cemetery.
Explaining grave re-use and multiple simultaneous burial is not straightforward from archaeological evidence alone. While radiocarbon dating helps clarify the chronology of deposition of individuals within a tomb, it can neither elucidate the social or familial relations between the interred, nor the causes of death. Were graves periodically reopened to add newly deceased family members, or was it considered appropriate to bury complete strangers in pre-existing tombs? If multiple burials were contemporaneous, what led to the simultaneity of death for those individuals? Certainly, within this time period, it is possible that Plague made some contribution to increased mortality, but we cannot tell from radiocarbon alone what led to the creation of these multiple burials. We can, however, highlight both inter and intra-site patterns using the combined all site model (Figure X, Appendix 1.6). For instance, the multiple burials at Selvicciola occur during Phases B, C, and D and thus entirely predate those at Povegliano Veronese in Phases E, F, and G. This chronological differentiation makes it clear that, at least in the burials sampled here, multiple burials as the result of either contemporaneous burial or grave re-opening occurred only within specific periods, and these periods were distinct to individual sites. Are these patterns evidence of societal crisis within these populations that led to a breakdown in normative, individual burials? The burials at Selvicciola correlate well with the eight known plague outbreaks in Italy between AD 543–592, while those at Povegliano Veronese correlate well with the outbreaks of AD 678–680 (Harper Reference Harper2023, 50). As always, correlation is not causation and these issues need to be further addressed through the study of ancient DNA (aDNA) from the individuals within these graves, though that work has yet to be carried out on these sites. Perhaps this study can provide motivation for future research in this vein. It should also be remembered that absence of multiple burials does not imply absence of disease, and any future aDNA analysis should not exclude normative, individual burials.
Conclusion
This study has provided the largest dataset of radiocarbon dates yet produced for early medieval Italy, with 56 new dates coming from the cemeteries at Vacone, Selvicciola, and Povegliano Veronese. These cemeteries were broadly contemporaneous in usage and spread across the central and northern regions of the peninsula, and this paper provides new, absolutely-dated chronologies for their usage during a turbulent time in Italian history. These dates allow not only for a higher resolution understanding of burial practice at these sites but also clarify important issues relating to the chronology of material culture used as grave goods as well as the presence of multiple burials. We were able to redate several graves previously dated by grave good stylistic criteria, and we were further able to clarify patterns of grave re-use, probably indicating repeated (familial?) interment rather than any simultaneous mass casualty event. It should be clarified that while most of these individual graves tested for this study do not indicate single-phase multiple burials, they also do not rule out the possibility of mass casualty events like pandemics, it is simply the case that they are not visible in burial practice in these cemeteries. The fact that the phased, SPD, and KDE models show peaks ca. AD 540–80 and 660–80 may well indicate periods of increased mortality due to Plague outbreaks in AD 561–62, 565, 571, or 588 recorded by Paul the Deacon, Gregory the Great, and Gregory of Tours or those of 678 and 680 as recorded in the Liber Pontificalis (Harper Reference Harper2023).
With these chronological advances, future research should aim to sample more of the cemetery populations to ensure robusticity of results while also extending to other early medieval cemeteries across Italy. These 56 new dates are a relatively large advancement for Italy but still pale in comparison to the thousands available for this same time period in other regions like Britain. More data would allow for more complex statistical analyses as well as interregional comparisons across Western Europe. It is also clear that multidisciplinary investigation of these sites is necessary to fully tell their stories, especially evident in the graves that were re-opened for multiple generations. Only aDNA analysis can clarify whether this was done for familial purposes or some other explanation, and only genetic material can shed further light on pathogenic cause of death where other obvious signs are absent. Finally, aDNA and isotopic evidence can shed light on human movement during a period long-noted for its waves of human migration, and these methods must be combined with radiocarbon chronologies to construct a more finely detailed historical record of political and ethnic change in the Italian peninsula.
Supplementary material
To view supplementary material for this article, please visit https://doi.org/10.1017/RDC.2026.10214.
Acknowledgments
This study was funded primarily by the Salomon OVPR Award for the project “Investigating Plague and societal change in early medieval central Italy” (PI: Candace M. Rice, co-PIs: Tyler V. Franconi and Ileana Micarelli). The UST project, co-directed by Candace M. Rice and Tyler V. Franconi, Dylan Bloy, and Gary D. Farney, is a collaboration between Rutgers University, Brown University, and the Soprintendenza archeologia, belle arti e paesaggio per l’area metropolitana di Roma e per la provincia di Rieti, with past participation of the University of Edinburgh (2015–2016) and the University of Alberta (2018–2019). We thank Julius Paužolis from Vilnius Radiocarbon and Tomasz Goslar from Poznań Radiocarbon Laboratory for their analyses of our samples. Finally, we are grateful for the helpful comments of the two reviewers which strengthened the final paper.
Author statements
Candace M. Rice and Tyler V. Franconi were responsible for the research conception and design. Writing has been done by Candace M. Rice, Tyler V. Franconi, and Ileana Micarelli. Data collection, processing, and study were carried out for Vacone by Candace M. Rice, Tyler V. Franconi, and Devin Ward; for Selvicciola and Povegliano Veronese by Martina Farese, Giorgio Manzi, Ileana Micarelli, Sofia Panella, Mary Anne Tafuri, and Caterina Giostra (only for Povegliano Veronese). We thank Elisabetta Aloisi Masella for assistance in collecting samples at the MGS, Sapienza University of Rome.
Competing interests
The authors have no competing interests to declare.



 Open access

