


1. Introduction
Observations of supernova remnants (SNRs) place important constraints on star and galaxy formation. SNRs evolve to be relatively bright at radio wavelengths as charged particles are ejected and accelerated by shock waves interacting with interstellar medium (ISM). Radio SNRs provide a pathway to explore cosmic magnetic fields and test models of galaxy evolution (Filipovic & Bozzetto Reference Filipovic and Bozzetto2017; Filipović & Tothill Reference Filipović and Tothill2021). They are characterised by non-thermal radio continuum emission (Sturner et al. Reference Sturner, Skibo, Dermer and Mattox1997).
The LMC is among the closest face-on galaxies to the Milky Way. Its distance has been reliably measured at $\sim$
50 kpc (di Benedetto Reference di Benedetto2008). It lies away from the Galactic Plane where extinction is minimal, making the LMC an excellent research laboratory for investigating objects such as SNRs.
$\sim$
50 kpc (di Benedetto Reference di Benedetto2008). It lies away from the Galactic Plane where extinction is minimal, making the LMC an excellent research laboratory for investigating objects such as SNRs.
In the past decades, hundreds of radio sources have been catalogued in the LMC via radio, X-ray, optical, and IR surveys. Most are classified as either H ii regions, Planetary Nebulae (PNe) or SNRs, appearing at different evolutionary stages (Filipovic et al. Reference Filipovic, Jones, White and Haynes1998b; Bozzetto et al. Reference Bozzetto2017; Leverenz et al. Reference Leverenz, Filipović, Vukotić, Urošević and Grieve2017; Maggi et al. Reference Maggi2016; Leverenz et al. Reference Leverenz2016; Bozzetto et al. Reference Bozzetto2015; Lakićević et al. Reference Lakićević2015; Filipović et al. Reference Filipović2009).
N 49 (LHA 120-N 49; DEM L190 or MCSNR J0526–6605) was the first extragalactic SNR discovered, over half a century ago (Mathewson & Healey Reference Mathewson and Healey1963). It is one of the brightest extragalactic radio SNRs. It is located near the northern boundary of the LMC; centred on RA (J2000) = 05 $^{h}$
26
$^{h}$
26 $^{m}$
00.1
$^{m}$
00.1 $^{s}$
and Dec (J2000)= –66
$^{s}$
and Dec (J2000)= –66 $^{\circ}$
05′00.4′′ (Bozzetto et al. Reference Bozzetto2017) and has a diameter of
$^{\circ}$
05′00.4′′ (Bozzetto et al. Reference Bozzetto2017) and has a diameter of $\sim$
18 pc (di Benedetto Reference di Benedetto2008; Pietrzyński et al. Reference Pietrzyński2019). The Sedov (Reference Sedov1959) age of this young to mid-age LMC SNR is estimated to be about 7 600 yr, with explosion energy of
$\sim$
18 pc (di Benedetto Reference di Benedetto2008; Pietrzyński et al. Reference Pietrzyński2019). The Sedov (Reference Sedov1959) age of this young to mid-age LMC SNR is estimated to be about 7 600 yr, with explosion energy of $E_{0}$ $\sim$
1.2
$\sim$
1.2 $\times$
10
$\times$
10 $^{51}$
erg (Leahy Reference Leahy2017).
$^{51}$
erg (Leahy Reference Leahy2017).
The morphology of N 49 is somewhat unusual for an SNR. Earlier observations show an asymmetric shell; the east southeastern side of the SNR is several times brighter than the rest of the object (Vancura et al. Reference Vancura1992b;Williams, Chu, & Gruendl Reference Williams, Chu and Gruendl2006; Dickel & Milne Reference Dickel and Milne1998). The most likely explanation for this asymmetry is that the blast wave is expanding into a higher density Inter Cloud Medium (ICM), causing the shocked material to appear bright in X-ray, UV, and optical wavelengths (Vancura et al. Reference Vancura1992b) see Fig. 1.
Combined RGB map of N 49 where Red is radio (5.5 GHz ATCA), Green is optical (HST) and Blue is X-ray (Chandra).
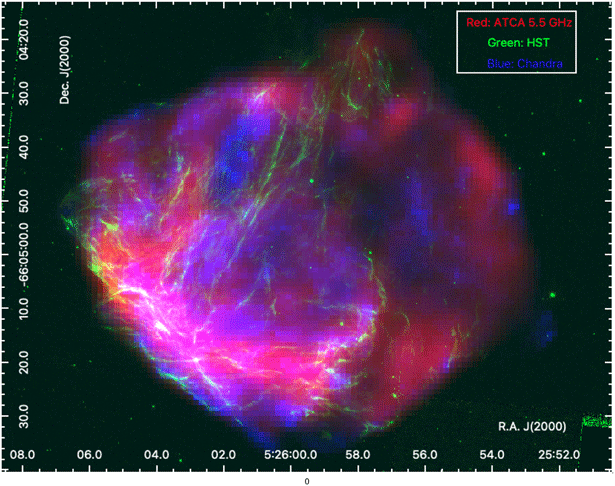
N 49 is an ideal object for scientific studies because it is bright across multiple wavelength windows including X-ray (Park et al. Reference Park2003), ultraviolet (UV) (Vancura et al. Reference Vancura1992b), optical (Vancura et al. Reference Vancura, Blair, Long and Raymond1992a), infrared (Williams et al. Reference Williams, Chu and Gruendl2006), and radio (Dickel & Milne Reference Dickel and Milne1998). Despite having a large amount of data, several key features remain poorly studied. Additionally, their interpretation remains controversial, including a ‘bullet’ feature in the south-west side of the SNR and a Soft Gamma Repeater (SGR) in the north.
Studies using CO data, provide evidence that N 49 is interacting with a nearby cloud located to the southeast with a tracer of cold molecular hydrogen gas (Yamane Reference Yamane2018; Sano et al. Reference Sano2023). High-excitation optical iron emission lines indicate substantial dust grain destruction occurring in this region (Dopita et al. 2016). Cluster searches in $\gamma$
-ray images reveal high energy photons originating from hadronic processesFootnote
a
through interactions with dense H ii regions (Campana et al. Reference Campana2022).
$\gamma$
-ray images reveal high energy photons originating from hadronic processesFootnote
a
through interactions with dense H ii regions (Campana et al. Reference Campana2022).
Details of ATCA Observations of SNR N 49 used in this study. Source 1934–638 was used as a primary (bandpass and flux density) calibrator in all observations.
Chandra observations show metal-rich ejecta at both the centre and periphery of N 49 (Park et al. Reference Park2003, Reference Park2012). Beyond the southwestern boundary and towards the eastern boundary are two metal-rich ‘bullet‘ features (also known in the literature as shrapnel or knots) detected in earlier radio and X-ray studies (Dickel & Milne Reference Dickel and Milne1998). The southwestern bullet is an extended feature with a head ( $\sim$
4′′ in radius or 23 pc at 50 kpc) and a tail that connects to the main SNR shell (Fig. 4). Spectral analysis of the head region indicates Silicon (Si) and Sulphur (S) enhancement most likely caused by multiple evolutionary phases. The enhanced Si lines in the eastern boundary suggest another ejecta-rich region (Park et al. Reference Park2012). In general, earlier morphological studies based on radio data (e.g. Dickel&Milne Reference Dickel and Milne1998) show similarity to later X-ray studies (Park et al. Reference Park2003).
$\sim$
4′′ in radius or 23 pc at 50 kpc) and a tail that connects to the main SNR shell (Fig. 4). Spectral analysis of the head region indicates Silicon (Si) and Sulphur (S) enhancement most likely caused by multiple evolutionary phases. The enhanced Si lines in the eastern boundary suggest another ejecta-rich region (Park et al. Reference Park2012). In general, earlier morphological studies based on radio data (e.g. Dickel&Milne Reference Dickel and Milne1998) show similarity to later X-ray studies (Park et al. Reference Park2003).
There has been controversy regarding N 49′s thermonuclear versus core-collapse origin. Park et al. (Reference Park2012) argued that the observed Si/S ratio in the ejecta suggests a thermonuclear (type Ia) origin. Other results seem to imply a core-collapse origin. For example, the recombining plasma (RP) state of N 49 determined from Suzaku observations appears consistent with a core-collapse model from a massive star (Uchida, Koyama, & Yamaguchi Reference Uchida, Koyama and Yamaguchi2015). In this scenario, shocks travelled through a dense circumstellar medium created by a massive progenitor. The high radio brightness of N 49 also suggests a core-collapse origin, since the radio luminosity of a thermonuclear SNR is somewhat less (Bozzetto et al. Reference Bozzetto2017, their fig. 16).
X-ray observations show that the point source SGR 0526 $-$
66 (PSR B0525
$-$
66 (PSR B0525 $-$
66) is located in the middle of the northern part of N 49. This particular SGR is only one of two known magnetars in the LMC (Park et al. Reference Park2004; Badenes et al. Reference Badenes, Harris, Zaritsky and Prieto2009; Imbrogno et al. Reference Imbrogno2023) The position of this SGR is RA (J2000) = 05
$-$
66) is located in the middle of the northern part of N 49. This particular SGR is only one of two known magnetars in the LMC (Park et al. Reference Park2004; Badenes et al. Reference Badenes, Harris, Zaritsky and Prieto2009; Imbrogno et al. Reference Imbrogno2023) The position of this SGR is RA (J2000) = 05 $^{h}$
26
$^{h}$
26 $^{m}$
00.7
$^{m}$
00.7 $^{s}$
and Dec (J2000)=
$^{s}$
and Dec (J2000)= $-$
66
$-$
66 $^{\circ}$
04′35.0′′ and its age has been estimated to
$^{\circ}$
04′35.0′′ and its age has been estimated to $\sim$
1 900 yr (Park et al. Reference Park2012; Vink&Kuiper Reference Vink and Kuiper2006). The close proximity of SGR 0526
$\sim$
1 900 yr (Park et al. Reference Park2012; Vink&Kuiper Reference Vink and Kuiper2006). The close proximity of SGR 0526 $-$
66 would normally be sufficient evidence to classify N 49 as a core-collapse SNR (Badenes et al. Reference Badenes, Harris, Zaritsky and Prieto2009). However, stars more massive than 21.5 M
$-$
66 would normally be sufficient evidence to classify N 49 as a core-collapse SNR (Badenes et al. Reference Badenes, Harris, Zaritsky and Prieto2009). However, stars more massive than 21.5 M $_\odot$
are very scarce near N 49, implying that either SGR 0526
$_\odot$
are very scarce near N 49, implying that either SGR 0526 $-$
66 came from a progenitor with a mass below 30 M
$-$
66 came from a progenitor with a mass below 30 M $_\odot$
(Hill et al. Reference Hill1995) or that the magnetar is merely a chance projection along the line of sight. Support for the latter is found in Dickel et al. (Reference Dickel1995). They note the location and spectral indices of the X-ray hot spots of N 49 and SGR 0526
$_\odot$
(Hill et al. Reference Hill1995) or that the magnetar is merely a chance projection along the line of sight. Support for the latter is found in Dickel et al. (Reference Dickel1995). They note the location and spectral indices of the X-ray hot spots of N 49 and SGR 0526 $-$
66 are probably not related. Further, Gaensler et al. (Reference Gaensler, Slane, Gotthelf and Vasisht2001) suse radio observations of N 49 and SGR 0526
$-$
66 are probably not related. Further, Gaensler et al. (Reference Gaensler, Slane, Gotthelf and Vasisht2001) suse radio observations of N 49 and SGR 0526 $-$
66 to conclude that existing claims of associations between the two are implausible.
$-$
66 to conclude that existing claims of associations between the two are implausible.
Motivated by previous studies and a desire to understand N 49′s features, we obtained new ATCA radio observations at 2.1, 5.5, and 9 GHz to create higher resolution and more sensitive images. We also use this data to construct polarisation maps to understand its magnetic fields better. Data and reduction techniques are presented in Section 2, results in Section 3, and a discussion in Section 4. Finally, conclusions and future prospects are presented in Section 5.
2. Observational data and reductions
2.1. Radio data
Our new ATCA observations of N 49 were performed in 30 November 2019, 2 January, 10 February 2020, and 23 February 2020 (project codes C3275, CX454, CX459, and C3292). These observations utilised a frequency switching mode (between 2 100 MHz and 5 500/9 000 MHz) in 6A, 1.5C, and EW367 configurations. Observations were carried out in ‘snap-shot’ mode, with 1-h integrations over a 12-h period minimum, using the Compact Array Broadband Backend (CABB) (2 048 MHz bandwidth) centred at wavelengths of 3/6 cmFootnote
b
and 13 cm ( $\nu$
= 2 100 MHz).
$\nu$
= 2 100 MHz).
Our data reductions also used available ATCA archival observations from the Australia Telescope National Facility (ATNF) online archive.Footnote c Two different data sets were combined for analysis. The first was before the CABB upgrade from project C177 (pre-CABB; 1990s, with 128-MHz bandwidth) and included observations at Intermediate frequencies (IFS) 2.4, 4.5, 4.79, 6, and 8.64 GHz (Dickel et al. Reference Dickel1995; Dickel & Milne Reference Dickel and Milne1998). As the remnant is so evolved combining data from 25 yr will not introduce errors. The second data set, C520 (pre-CABB), includes observations at IFS 4.79 and 8.64 GHz (Fender, Southwell, & Tzioumis Reference Fender, Southwell and Tzioumis1998). Each 128 MHz–wide frequency band was correlated in 33 separate channels of equal width. Details of these observations are listed in Table 1.
Data reduction and imaging were performed using the miriad Footnote d (Sault, Teuben, & Wright Reference Sault, Teuben, Wright, Shaw, Payne and Hayes1995), karma Footnote e (Gooch Reference Gooch and Systems1995), and DS9 Footnote f (Joye & Mandel Reference Joye, Mandel, Payne, Jedrzejewski and Hook2003) packages. We measured N 49 flux densities (Table 2) as described in Hurley-Walker et al. (Reference Hurley-Walker2019, Section 2.4) and Filipović et al. (Reference Filipović2022), Bozzetto et al. (Reference Bozzetto2023).
To obtain the 5.5 and 9 GHz frequency images, four sets (‘12-h days’) of observational data (projects C3275, CX454, CX459, and C3292) were combined. In all cases, 1934–638 was used as the standard bandpass and flux density calibrator while the phase calibrator was 0530–727. Automated task pgflag was used to flag errors in the data; tasks blflag and uvflag were used for minor manual flagging. A robust weighting of 0.5 created the best radio images at 5.5 and 9 GHz.
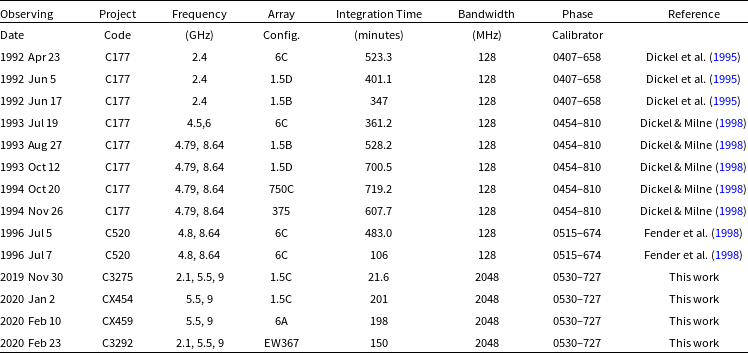
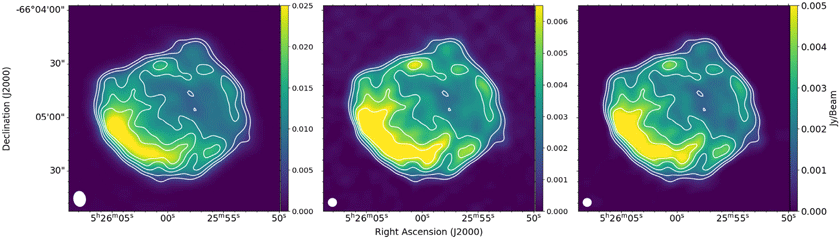
Likewise, to create the 2.1 GHz image, two observational sets (days) of data were combined from projects C3275 and C3292. Two array configurations were available: 1.5C and 6A. Imaging processing was similar to that used above for the 5.5 and 9 GHz images. Fig. 2 shows total intensity images at 2.1, 5.5, and 9 GHz, respectively.
Details of CABB and pre-CABB radio continuum N 49 images created and used in this study.
CABB radio continuum images of SNR N 49. 5.5 GHz contour levels overlaid on each of the 3 images are 1, 2, 3, 4, and 5 mJy beam $^{-1}$
. Left: 2.1 GHz image with a resolution (beam size) of 4′′
$^{-1}$
. Left: 2.1 GHz image with a resolution (beam size) of 4′′ $\times$
4′′ Middle: 5.5 GHz image with a resolution (beam size) of 5′′
$\times$
4′′ Middle: 5.5 GHz image with a resolution (beam size) of 5′′ $\times$
5′′ Right: 9 GHz image with a resolution (beam size) of 4′′
$\times$
5′′ Right: 9 GHz image with a resolution (beam size) of 4′′ $\times$
4′′. White circles in the lower left corner scale the synthesised beam.
$\times$
4′′. White circles in the lower left corner scale the synthesised beam.
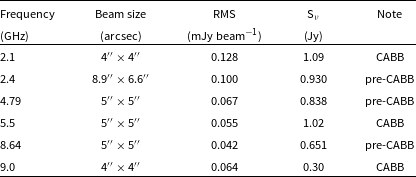
Pre-CABB update radio continuum images of SNR N 49. 4.79 GHz contour levels overlaid on each of the 3 images are 0.85, 1.5, 2.5, 3.5, and 4.5 mJy beam $^{-1}$
. Left: 2.4 GHz image with a resolution (beam size) of 8.9′′
$^{-1}$
. Left: 2.4 GHz image with a resolution (beam size) of 8.9′′ $\times$
6.6′′. Middle: 4.79 GHz image with a resolution (beam size) of 5′′
$\times$
6.6′′. Middle: 4.79 GHz image with a resolution (beam size) of 5′′ $\times$
5′′. Right: 8.64 GHz image with a resolution (beam size) of 5′′
$\times$
5′′. Right: 8.64 GHz image with a resolution (beam size) of 5′′ $\times$
5′′. White circles in the lower left corner scale the synthesised beam.
$\times$
5′′. White circles in the lower left corner scale the synthesised beam.
To compare new CABB data with pre-CABB upgrade observations, three sets of pre-CABB data (project C177) were combined to obtain a 2.4 GHz frequency image of N 49. Array configurations at this frequency included 1.5B, 1.5D, and 6C. Again, a robust weighting of 0.5 created the best radio images. The miriad task selfcal was also applied to perform self-calibration of the visibility data (Briggs Reference Briggs1995). Phase selfcal was performed 3 times which improved image resolution compared to the previous work of Dickel et al. (Reference Dickel1995).
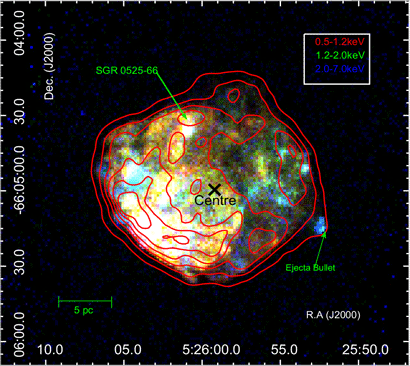
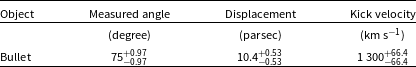
An X-ray three-colour image of N 49 that shows our new Radio data superimposed as contours. Red represents the energy band 0.5–1.2 keV (soft), green corresponds to the energy band 1.2–2.0 keV (Medium) and blue represents the energy band 2.0–7.0 keV (hard). This X-ray image is overlaid with 5.5 GHz radio contours at 0.25, 1.4, 2.6, 3.8, and 5 mJy beam $^{-1}$
. The distance between SNR centre to the ‘bullet’ feature is used to estimate the upper and lower angular displacement values as explained in Table 3.
$^{-1}$
. The distance between SNR centre to the ‘bullet’ feature is used to estimate the upper and lower angular displacement values as explained in Table 3.
To obtain 4.79 and 8.64 GHz images, data from projects C177 and C520 utilising configurations 1.5B, 1.5D, 6C, 750C, and 375 were all combined for their respective frequencies. A robust weighting of –0.5 was used for 4.79 GHz and 0.5 for 8.64 GHz image reduction. The resolution of both 4.79 and 8.64 GHz images were smoothed to 5′′ $\times$
5′′ using the miriad task invert. Tasks pmosmem and restor created the resulting convolved mosaic images. Integrated N 49 flux densities at 4.79 and 8.64 GHz are
$\times$
5′′ using the miriad task invert. Tasks pmosmem and restor created the resulting convolved mosaic images. Integrated N 49 flux densities at 4.79 and 8.64 GHz are $0.838 \pm 0.1$
Jy and
$0.838 \pm 0.1$
Jy and $0.651 \pm 0.1$
Jy, respectively. Most of the uncertainties reported are systematic due to calibration and statistical fluctuations.
$0.651 \pm 0.1$
Jy, respectively. Most of the uncertainties reported are systematic due to calibration and statistical fluctuations.
Fig. 3 shows the total intensity of pre-CABB images at 2.4, 4.79, and 8.64 GHz. Details of the images used in this study are listed in Table 2.
2.1.1. Polarimetry
SNR polarimetry can provide details on the intensity of the polarised emission, polarisation degree, and magnetic field orientation. Moreover, SNRs magnetic fields play a significant role in the cosmic ray acceleration mechanism (Reynoso, Velázquez, & Cichowolski Reference Reynoso, Velázquez and Cichowolski2018) By combining radio with X-ray data, the strength of the actual magnetic field can be determined (Dubner Reference Dubner2011).
Polarisation maps can be created from full Stokes parameters, including I, Q, U, and V data that describe multiple wave components (Robishaw & Heiles Reference Robishaw and Heiles2018 and Burke & Graham-Smith Reference Burke and Graham-Smith1997).
Formally, the linear polarisation state of a radio wave as an observable quantity can be described as
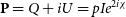 \begin{equation} \textbf{P}=Q + iU = pIe^{2i\chi} \end{equation}
where I is the flux density of the radio emission (in units of Jy beam $^{-1}$
), p the linear fractional polarisation, and
$^{-1}$
), p the linear fractional polarisation, and $\chi$
the observed position angle of the radio wave given by:
$\chi$
the observed position angle of the radio wave given by:
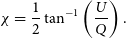 \begin{equation}\chi=\frac{1}{2}\tan^{-1}\left(\frac{U}{Q}\right).\end{equation}
Our polarised intensity maps produced by the vector combination of the Stokes Q and U maps were statistically corrected for bias using the miriad task impol. The mean fractional polarisation has been evaluated in two ways: (1) by dividing the polarised intensity map by the total intensity map, determined as a mean ratio, and (2) by dividing the integrated polarised intensity of the source by the integrated total intensity.impol was used to calculate the Stokes I, Q, and U parameters, from which were derived the polarised emission, position angle, and resultant uncertainty maps (Equations 1 and 2).
Whenever an electromagnetic wave passes through magnetised plasma or magneto–ionic material, the polarisation angle of the wave is rotated from its intrinsic value ( $\chi_{0}$
), due to the different phase velocities of the two opposite-hand polarisation modes. This effect is known as Faraday rotation. For an astronomical radio source, the total observed Faraday rotation along the line of sight can be estimated from the variation of the position angle with respect to the observing wavelength,
$\chi_{0}$
), due to the different phase velocities of the two opposite-hand polarisation modes. This effect is known as Faraday rotation. For an astronomical radio source, the total observed Faraday rotation along the line of sight can be estimated from the variation of the position angle with respect to the observing wavelength, ${\Delta\chi}/{\Delta\lambda_{obs}^2}$
. This quantity is known as rotation measure (RM).
${\Delta\chi}/{\Delta\lambda_{obs}^2}$
. This quantity is known as rotation measure (RM).
The measured change in position angle of radiation, ${\Delta\chi}$
, for an electromagnetic wave arriving at an observer, assuming a single magnetic field with only one source along the line of sight and no internal Faraday rotation or beam depolarisation is defined as:
${\Delta\chi}$
, for an electromagnetic wave arriving at an observer, assuming a single magnetic field with only one source along the line of sight and no internal Faraday rotation or beam depolarisation is defined as:
 \begin{equation}\Delta\chi=\chi_{obs}-\chi_{0}=RM\lambda_{obs}^{2},\end{equation}
where $\chi_{obs}$
and
$\chi_{obs}$
and $\chi_{0}$
(rotation angle of the source) are in radians and the wavelength of the observed radiation,
$\chi_{0}$
(rotation angle of the source) are in radians and the wavelength of the observed radiation, $\lambda_{obs}$
, in metres.
$\lambda_{obs}$
, in metres.
Using the assumptions above and the equation for Faraday depth, the RM (rad m $^{-2}$
) can be normalised to physical parameters:
$^{-2}$
) can be normalised to physical parameters:
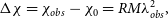
 \begin{equation}RM=0.81\int_{0(source)}^{L(observer)} n_{e}B_{||}dl, \end{equation}
where $n_{e}$
is the number density of thermal electrons (in units of cm
$n_{e}$
is the number density of thermal electrons (in units of cm $^{-3}$
),
$^{-3}$
), $B_{||}$
is the magnetic field component in the direction of the line of sight to the source (in
$B_{||}$
is the magnetic field component in the direction of the line of sight to the source (in $\mu$
G), and l is the displacement (in pc) between the source and observer. Equation (4) indicates that the RM represents a relation between the observed position angle,
$\mu$
G), and l is the displacement (in pc) between the source and observer. Equation (4) indicates that the RM represents a relation between the observed position angle, $\chi_{obs}$
, and the magneto-ionic properties of plasma in radio sources. (Burn Reference Burn1966).
$\chi_{obs}$
, and the magneto-ionic properties of plasma in radio sources. (Burn Reference Burn1966).
To determine the RM and the true orientation of the magnetic field (B), observations at two or more frequencies are required. This is to resolve a degeneracy of the unknown number of half cycles of rotations of the position angle between the source and observer; that is, the measurements of the position angles are uncertain by $\pm n\pi$
. More details on how to remove this ambiguity and determine an accurate rotation measure by careful selection of observational wavelengths can be found in Clarke (Reference Clarke2004). However, one still can argue that the entire source cannot be described by a single RM (O’Sullivan et al. Reference O’Sullivan2012).
$\pm n\pi$
. More details on how to remove this ambiguity and determine an accurate rotation measure by careful selection of observational wavelengths can be found in Clarke (Reference Clarke2004). However, one still can argue that the entire source cannot be described by a single RM (O’Sullivan et al. Reference O’Sullivan2012).
The miriad task imrm fits the position angle image vectors from at least two position angle images up to five different frequencies on a pixel-by-pixel basis. In the same process, the task computes the unrotated angle $\chi_{0}$
. In this study, we used combined images at 5.5 and 9 GHz (CABB images) to obtain a reasonable RM estimate.
$\chi_{0}$
. In this study, we used combined images at 5.5 and 9 GHz (CABB images) to obtain a reasonable RM estimate.
There was no reliable evidence of polarisation emission at 2.1 GHz image, most likely, because the depolarisation at these frequencies is caused by Faraday rotation. miriad task uvsplit was used to break these wide-band frequencies (2.048 GHz) into two narrower bands, each with a maximum bandwidth of 1 GHz. The cumulative effect of these four smaller frequencies can help identify the overall trend more accurately and reduce the ambiguity in the RM calculation. While using only two broadband frequencies leads to ambiguities due to the periodic nature of the polarisation angle, splitting these into smaller frequencies can help mitigate but not fully resolve these ambiguities. Each additional frequency provides more data points, improving the fit and potentially identifying the correct RM. In all four bands, we only calculated RM when the signal-to-noise ratio was at least 10 $\sigma$
. Furthermore,
$\sigma$
. Furthermore, $\sim$
10% error is due to the
$\sim$
10% error is due to the $n\pi$
ambiguity in measurements of the position angle (Brentjens & de Bruyn Reference Brentjens and de Bruyn2005) as we use four bands in our RM estimation.
$n\pi$
ambiguity in measurements of the position angle (Brentjens & de Bruyn Reference Brentjens and de Bruyn2005) as we use four bands in our RM estimation.
2.2. X-Ray data
Park et al. (Reference Park2012) presented an X-ray study on N 49 using the Advanced CCD Imaging Spectrometer (ACIS) on board the Chandra X-Ray Observatory. The SNR was observed on 18 July 2009 and 19 September 2009 (ObsIDs 1023, 10806, 10807, and 10808) during AO10. To compare these with our new radio data, we re-processed the original X-ray data using the CIAO v4.9 software package with CALDB v4.7.6 (Fruscione et al. Reference Fruscione2006). The merge-obsFootnote
g
and chandra-reproFootnote
h
scripts (Fruscione et al. Reference Fruscione2006) were used to create the combined energy-filtered and exposure-corrected images. The total effective exposure time after data reduction is $\sim$
108 ksec which matches the effective exposure time of the original reduced image stated in Park et al. (Reference Park2012). The re-reduced three-colour (RGB) X-ray image of the soft (0.5–1.2 keV), medium (1.2–2.0 keV), and hard (2.0–7.0 keV) energy bands is presented in Fig. 4.
$\sim$
108 ksec which matches the effective exposure time of the original reduced image stated in Park et al. (Reference Park2012). The re-reduced three-colour (RGB) X-ray image of the soft (0.5–1.2 keV), medium (1.2–2.0 keV), and hard (2.0–7.0 keV) energy bands is presented in Fig. 4.
2.3. Optical data
Optical HST images (H $\alpha$
, [S ii], and [O iii]) were downloaded from the Mikulski Archive for Space Telescopes.Footnote
i
All information regarding these HST observations and their data reduction are given in Bilikova et al. (Reference Bilikova, Williams, Chu, Gruendl and Lundgren2007). These data have been used to create our optical images in this study.
$\alpha$
, [S ii], and [O iii]) were downloaded from the Mikulski Archive for Space Telescopes.Footnote
i
All information regarding these HST observations and their data reduction are given in Bilikova et al. (Reference Bilikova, Williams, Chu, Gruendl and Lundgren2007). These data have been used to create our optical images in this study.
3. Results and analysis
3.1. Morphology
Fig. 4 shows the three-colour Chandra ACIS image of N 49 where complex and asymmetric X-ray emission features are evident. It is evident from the RGB image that the softest X-rays are significantly inside the SNR. The outer boundary of the N 49 shell exhibits extensive regions of green and blue, which are notably harder. In most cases, the outer shock tends to be harder compared to the reverse shock within the ejected material (Leahy, Ranasinghe, & Gelowitz Reference Leahy, Ranasinghe and Gelowitz2020). Two metal-rich ejecta as suggested by Park et al. (Reference Park2012) have been detected: one towards the southwest and another, less obvious one (not studied here) towards the east to northeast. The western (to southwestern) half of N 49 is dominated by hard X-rays, which indicates the blast wave is expanding into low-density ISM. Our radio data also suggest this. Uchida et al. (Reference Uchida, Koyama and Yamaguchi2015) noted that the X-ray images of N 49 show an irregular morphology that is brightest inside the radio shell, as is a typical characteristic of a mixed morphology SNR. Also, optical images suggest an outflow pointing up to the north direction, which could be indicative of some asymmetry in the progenitor SN event.
In Fig. 4, Using a method byFootnote
j
Collischon et al. (Reference Collischon, Sasaki, Mecke, Points and Klatt2021),s we estimated the geometrical centre of the N 49 radio image as RA (J2000) = 05 $^{h}$
25
$^{h}$
25 $^{m}$
59.2
$^{m}$
59.2 $^{s}$
and Dec (J2000)= –66
$^{s}$
and Dec (J2000)= –66 $^{\circ}$
04′59.6′′. We note there is a soft gamma repeater, SGR 0526–66, positioned at RA (J2000) = 05
$^{\circ}$
04′59.6′′. We note there is a soft gamma repeater, SGR 0526–66, positioned at RA (J2000) = 05 $^{h}$
26
$^{h}$
26 $^{m}$
00.9
$^{m}$
00.9 $^{s}$
and Dec (J2000)= –66
$^{s}$
and Dec (J2000)= –66 $^{\circ}$
04′31.6′′.
$^{\circ}$
04′31.6′′.
The hard X-ray knot in the southwestern part of N 49, beyond the remnant’s shock boundary has been called the ‘bullet’ and is located at RA (J2000) = 05 $^{h}$
25
$^{h}$
25 $^{m}$
52.4
$^{m}$
52.4 $^{s}$
and Dec (J2000)= –66
$^{s}$
and Dec (J2000)= –66 $^{\circ}$
05′14.7′′. This feature has emission lines that dominate the knot’s X-ray spectrum which can be modelled by a metal-rich hot thermal plasma (Park et al. Reference Park2003). Based on this result, it appears it was created by ejected fragments from the SN explosion that produced N 49. Additionally, there is evidence of a weak trail behind the head of the bullet (Park et al. Reference Park2003).
$^{\circ}$
05′14.7′′. This feature has emission lines that dominate the knot’s X-ray spectrum which can be modelled by a metal-rich hot thermal plasma (Park et al. Reference Park2003). Based on this result, it appears it was created by ejected fragments from the SN explosion that produced N 49. Additionally, there is evidence of a weak trail behind the head of the bullet (Park et al. Reference Park2003).
Park et al. (Reference Park2003) notes strong Si enhancement in the eastern region of the remnant corresponding to an internal cloud(area of a low density region between clouds of interstellar material within N 49) which resembles the spectral properties of the head of the ‘bullet’. This region may be a candidate ejecta feature (positioned at RA (J2000) = 05 $^{h}$
25
$^{h}$
25 $^{m}$
52.2
$^{m}$
52.2 $^{s}$
and Dec (J2000)= –66
$^{s}$
and Dec (J2000)= –66 $^{\circ}$
05′16.7′′), probably isolated from the complex emission due to shocked dense clumpy clouds (Park et al. Reference Park2003).
$^{\circ}$
05′16.7′′), probably isolated from the complex emission due to shocked dense clumpy clouds (Park et al. Reference Park2003).
3.1.1. The ‘Bullet’s’ Muzzle (kinetic) energy
N 49 exhibits features rarely seen in SNRs of similar age and type. Most prominent is the X-ray ejecta ‘bullet’ (Fig. 4) extending beyond the remnant’s shell in the southwest. This feature has predominantly hard emission (2.0–7.0 keV), as shown in blue. Outer shell-like X-ray features in N 49 are largely coincident with radio shell contours as seen in Fig. 4, most likely indicating regions of blast wave shock. In fact, hard X-ray emission is reasonably correlated with radio and appears to peak towards the southeast edge.
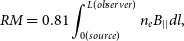
The average velocity of the ‘bullet’ has been estimated at $\sim$
1 300 km s
$\sim$
1 300 km s $^{-1}$
, assuming its distance to the SNR centre of
$^{-1}$
, assuming its distance to the SNR centre of $\sim$
10 pc and remnant age of 7 600 yr (Leahy Reference Leahy2017). The ‘bullet’s displacement and the measured angle indicate how far and in which direction the SNR’s centre might have shifted over time. In this case, we note the SN explosion centre of N 49 inferred from the projection of the southwest ‘bullet’ trail is shifted the geometrical centre by
$\sim$
10 pc and remnant age of 7 600 yr (Leahy Reference Leahy2017). The ‘bullet’s displacement and the measured angle indicate how far and in which direction the SNR’s centre might have shifted over time. In this case, we note the SN explosion centre of N 49 inferred from the projection of the southwest ‘bullet’ trail is shifted the geometrical centre by $\sim$
10.4 pc, and forming an angle of
$\sim$
10.4 pc, and forming an angle of $\sim$
75
$\sim$
75 $^{\circ}$
with the initial centre.
$^{\circ}$
with the initial centre.
The high temperature and large ionisation timescale of this bright X-ray knot support its origin as a high-speed (bow-shock) ejecta. As the SNR encounters regions of varying density in the ISM, these interactions contribute to the asymmetrical shape that leads to a bow shock. After the SNR expands and interacts with the surrounding ISM, influenced by factors such as relative motion and ISM density variations, a bow shock can eventually develop.
In an SNR with a density gradient in the surrounding ISM, the centre of the remnant is positioned towards the high-density emission. This occurs because the shock wave decelerates more in the denser region, leading to an asymmetrical expansion and accumulation of material on the high-density side. The side facing the denser medium appears more compressed, while the side facing the lower-density medium is more extended, all resulting in the different geometric and mass centres of the SNR (Janka et al. Reference Janka2012).
To constrain the knot’s precise origin is difficult since the original supernova (SN) might neither be in the geometrical centre (although still possible) nor at the ‘midpoint’. Bearing this in mind, we estimate a somewhat crude ‘bullet’ kinetic energy, $E_K$
, assuming a pre-shock density, as measured by Park et al. (Reference Park2012), of 2 cm
$E_K$
, assuming a pre-shock density, as measured by Park et al. (Reference Park2012), of 2 cm $^{-3}$
with an increase by a factor of 4 assumed for the post-shock region. We estimate the ‘bullet’ volume using our Chandra image, assuming an ellipsoid with semi-minor and semi-major axes of 3′′ and 5′′, respectively. Combined with the velocity estimates listed in Table 3, this gives a possible
$^{-3}$
with an increase by a factor of 4 assumed for the post-shock region. We estimate the ‘bullet’ volume using our Chandra image, assuming an ellipsoid with semi-minor and semi-major axes of 3′′ and 5′′, respectively. Combined with the velocity estimates listed in Table 3, this gives a possible $E_K$
range of 0.3–5
$E_K$
range of 0.3–5 $\times10^{49}$
erg, or a fraction to a few per cent of the total SN energy. Our mass estimate is likely an upper limit assuming a filling fraction less than 1 or a non-uniform density profile (i.e. not a monolithic ‘bullet’). The kinetic energy uncertainty budget is dominated by the poorly constrained velocity as it enters the calculation squared. Although large, our crude
$\times10^{49}$
erg, or a fraction to a few per cent of the total SN energy. Our mass estimate is likely an upper limit assuming a filling fraction less than 1 or a non-uniform density profile (i.e. not a monolithic ‘bullet’). The kinetic energy uncertainty budget is dominated by the poorly constrained velocity as it enters the calculation squared. Although large, our crude $E_K$
is similar to that estimated for the jet of Cas A (Willingale et al. Reference Willingale, Bleeker, van der Heyden and Kaastra2003; Orlando et al. Reference Orlando, Miceli, Pumo and Bocchino2016). On the other hand, this is more than measured for ‘shrapnel’ from the Vela SNR (García et al. Reference García2017).
$E_K$
is similar to that estimated for the jet of Cas A (Willingale et al. Reference Willingale, Bleeker, van der Heyden and Kaastra2003; Orlando et al. Reference Orlando, Miceli, Pumo and Bocchino2016). On the other hand, this is more than measured for ‘shrapnel’ from the Vela SNR (García et al. Reference García2017).
N 49 kick velocity estimate. Upper and lower angular displacement values were estimated using the SNR centre as an upper limit, and the ‘midpoint’ as the lower limit (see Fig. 4). We assume a distance to the LMC of 50 kpc to calculate the physical displacement and an SNR age of 7 600 yr to calculate the kick velocity.
What alternative scenario could explain the ‘bullet’? Its morphology could suggest a bow-shock Pulsar Wind Nebulae (PWN) origin. The main difference would be that a bow-shock PWN would not be expected to have such strong Si and S lines, as seen in the X-ray spectrum (Park et al. Reference Park2012). While a PWN origin is unlikely, one way to distinguish such a scenario is through high-resolution and high-sensitivity radio observations that measure the change in the spectral index within this region. Specifically, a more flat spectral index ( $-0.3\unicode{x003C}\alpha\unicode{x003C}0$
) would favour a PWN origin, while a steeper index (
$-0.3\unicode{x003C}\alpha\unicode{x003C}0$
) would favour a PWN origin, while a steeper index ( $\alpha\unicode{x003C}-0.5$
) would point towards a SN explosion origin. In Fig. 8 we can see some flattening of the spectral index (
$\alpha\unicode{x003C}-0.5$
) would point towards a SN explosion origin. In Fig. 8 we can see some flattening of the spectral index ( $-0.45\unicode{x003C}\alpha\unicode{x003C}-0.35$
), compared to the rest of the remnant. But, this spectral index range falls into the ‘grey’ area where neither scenario can be favoured.
$-0.45\unicode{x003C}\alpha\unicode{x003C}-0.35$
), compared to the rest of the remnant. But, this spectral index range falls into the ‘grey’ area where neither scenario can be favoured.
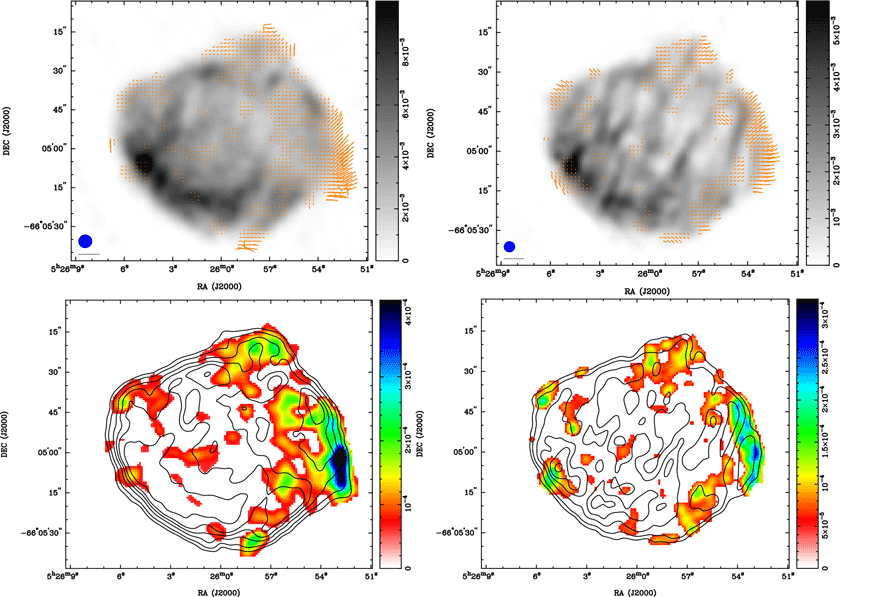
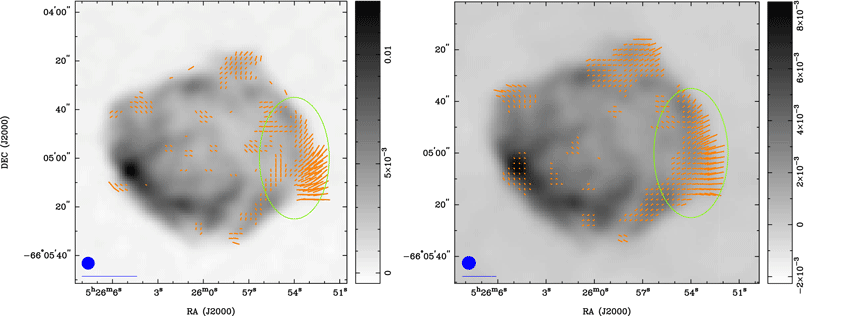
The polarisation map of N 49 at 5.5 GHz (left column) and at 9 GHz (right column) where respective fractional polarisation vectors shown on the top images are overlaid on corresponding intensity ATCA images. The blue circles in the lower left corner represent a synthesised beam of $5''\times\,5''$
and
$5''\times\,5''$
and $4''\times\,4''$
, for 5.5 and 9 GHz, respectively. The blue line below the circles represents 100% polarisation. The bar on the right side represents the greyscale intensity gradients for the ATCA images in Jy beam
$4''\times\,4''$
, for 5.5 and 9 GHz, respectively. The blue line below the circles represents 100% polarisation. The bar on the right side represents the greyscale intensity gradients for the ATCA images in Jy beam $^{-1}$
. Polarisation intensity maps at 5.5 GHz (bottom left) and at 9 GHz (bottom right) are shown in the bottom images with radio intensity contour lines overlaid; radio contours are 0.05, 1, 2, 4, and 6 mJy beam
$^{-1}$
. Polarisation intensity maps at 5.5 GHz (bottom left) and at 9 GHz (bottom right) are shown in the bottom images with radio intensity contour lines overlaid; radio contours are 0.05, 1, 2, 4, and 6 mJy beam $^{-1}$
for 5.5 and 9 GHz, respectively.
$^{-1}$
for 5.5 and 9 GHz, respectively.
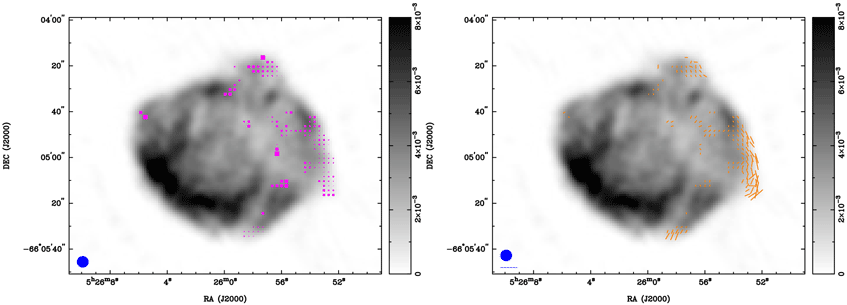
Fractional polarisation vectors overlaid on their corresponding ATCA intensity images. The image on the left is at 4.79 GHz (pre-CABB). large green ellipse in these images indicates an enhanced polarisation region around the proposed ‘bullet ejecta’ or bow-shock PWN. The image on the right is at 8.64 GHz (pre-CABB). The blue circle in the lower left corner of this image represents the synthesised beam width of $5''\times\,5''$
and the blue line below, a fractional polarisation vector of 100%.
$5''\times\,5''$
and the blue line below, a fractional polarisation vector of 100%.
The rotation measure map (left) of N 49 overlaid on 5.5 GHz image. The pink boxes represent RM values estimated from the position angles associated with linear polarisation. The maximum value of RM is $\sim$
591 rad m
$\sim$
591 rad m $^{-2}$
. The blue ellipse in the lower left corner represents the synthesised beam width of
$^{-2}$
. The blue ellipse in the lower left corner represents the synthesised beam width of $5''\times\,5''$
. The image on the right shows magnetic field vectors overlaying the 5.5 GHz radio image.
$5''\times\,5''$
. The image on the right shows magnetic field vectors overlaying the 5.5 GHz radio image.
Several galactic SNRs are characterised by knot-like ejecta, and such clumps have been observed in both major types of SNe. Examples include the Tycho SNR as type Ia (Yamaguchi et al. Reference Yamaguchi2017), and Cas A, G292.0+1.8, Puppis A and big-Vela as core-collapse (García et al. Reference García2017). These Galactic SNRs exhibit a large range of ages – from a few hundred to tens of thousands of years old. Knots from ejecta have been detected beyond the main shock in big-Vela (DeLaney et al. Reference DeLaney2010) and Tycho (Yamaguchi et al. Reference Yamaguchi2017). Also, supersonic speeds in either bow-shock PWN or ‘bullets’ are not unusual, as is documented in several studies (Kargaltsev et al. Reference Kargaltsev, Pavlov, Klingler and Rangelov2017, see their table 1). X-ray morphology and radio polarisation indicate a strong physical connection of this feature to the SNR similar to many known Galactic SNR such as Vela and Cas A.
3.2. Polarisation and Faraday rotation
Polarisation fraction and Faraday rotation provide powerful tracers of magnetic field orientation and strength.
In Fig. 5 we show fractional polarisation vectors and polarisation intensity maps at 5.5 and 9 GHz. Fractional polarisation vectors for pre-CABB update images at 4.79 and 8.64 GHz are shown in Fig. 6. We did not detect reliable polarisation emissions at 2.1 and 2.4 GHz. This is likely a result of depolarisation induced by Faraday rotation, which is prominent at these frequencies. Fig. 7. (left) illustrates the Faraday rotation of N 49 which is determined from the position angles from the CABB data set as described above. The mean value for the Faraday rotation of SNR N 49 is 212 $\pm$
65 rad m
$\pm$
65 rad m $^{-2}$
and the maximum value of RM is 591
$^{-2}$
and the maximum value of RM is 591 $\pm$
103 rad m
$\pm$
103 rad m $^{-2}$
. This RM value is suggestive of a denser medium (as RM is linear with
$^{-2}$
. This RM value is suggestive of a denser medium (as RM is linear with $n_e$
) as also evidenced by brightness in both radio and X-rays. The resulting magnetic field map shown in Fig. 7 (right) is a relative zero-level image obtained in the same way as for U and Q stokes. The magnetic field is stronger on the western side and coincides with the enhanced total intensity emission.
$n_e$
) as also evidenced by brightness in both radio and X-rays. The resulting magnetic field map shown in Fig. 7 (right) is a relative zero-level image obtained in the same way as for U and Q stokes. The magnetic field is stronger on the western side and coincides with the enhanced total intensity emission.
We estimate a mean fractional polarisation at 5.5 GHz of 7 $\pm$
1% with a maximum of 82
$\pm$
1% with a maximum of 82 $\pm$
10% (in the west). The mean fractional polarisation at 9 GHz is 10
$\pm$
10% (in the west). The mean fractional polarisation at 9 GHz is 10 $\pm$
1% with a maximum of 85
$\pm$
1% with a maximum of 85 $\pm$
13%. Pre-CABB data has significantly better uv coverage because 10 days of data were combined using different arrays. At 4.79 GHz we estimate a mean fractional polarisation of 8
$\pm$
13%. Pre-CABB data has significantly better uv coverage because 10 days of data were combined using different arrays. At 4.79 GHz we estimate a mean fractional polarisation of 8 $\pm$
3% with a maximum of 33%. The mean fractional polarisation at 8.64 GHz is even higher at 10
$\pm$
3% with a maximum of 33%. The mean fractional polarisation at 8.64 GHz is even higher at 10 $\pm$
1% with a maximum of 47%. This is somewhat higher than a previous study of N 49 by Dickel & Milne (Reference Dickel and Milne1998) who found a mean fractional polarisation across the remnant of 2.5% at 4.79 GHz and 4.8% at 8.64 GHz. This polarisation structure suggests a highly organised magnetic field strongly aligned with the ‘bullet’ feature and its trail (see Fig. 7).
$\pm$
1% with a maximum of 47%. This is somewhat higher than a previous study of N 49 by Dickel & Milne (Reference Dickel and Milne1998) who found a mean fractional polarisation across the remnant of 2.5% at 4.79 GHz and 4.8% at 8.64 GHz. This polarisation structure suggests a highly organised magnetic field strongly aligned with the ‘bullet’ feature and its trail (see Fig. 7).
We use the equipartition formulaeFootnote
k
(Arbutina et al. Reference Arbutina, Urošević, Andjelić, Pavlović and Vukotić2012; Arbutina et al. Reference Arbutina, Urošević, Vučetić, Pavlović and Vukotić2013; Urošević, Pavlović, & Arbutina Reference Urošević, Pavlović and Arbutina2018) to estimate the magnetic field strength for N 49. The average equipartition field over the whole shell of N 49 is $\sim$
90
$\sim$
90 $\mu$
G with an estimated minimum energyFootnote
l
of E
$\mu$
G with an estimated minimum energyFootnote
l
of E $_\textrm{min}$
=1.7
$_\textrm{min}$
=1.7 $\times10^{48}$
erg, assuming a power-law distribution for electrons, denoted in the model by ‘kappa’,
$\times10^{48}$
erg, assuming a power-law distribution for electrons, denoted in the model by ‘kappa’, $\kappa$
, equal to zero.
$\kappa$
, equal to zero.
Although N 49 is most likely a middle-aged SNR, the equipartition assumption is not ideal for the determination of the magnetic field strength (perhaps only valid as an order of magnitude estimate, as used in Urošević et al. Reference Urošević, Pavlović and Arbutina2018). In any case, the estimated value of $\sim$
90
$\sim$
90 $\mu$
G can be explained by the magnetic field amplification at the strong shocks in relatively young to middle-aged and highly luminous SNRs.
$\mu$
G can be explained by the magnetic field amplification at the strong shocks in relatively young to middle-aged and highly luminous SNRs.
3.3. N 49 spectral index
Radio SNRs often follow a power-law spectrum in which the spectral index, $\alpha$
, is steep as defined by
$\alpha$
, is steep as defined by $S_{\nu}$ $\propto$ $\nu^\alpha$
; where
$\nu^\alpha$
; where $S_{\nu}$
represents flux density at
$S_{\nu}$
represents flux density at $\nu$
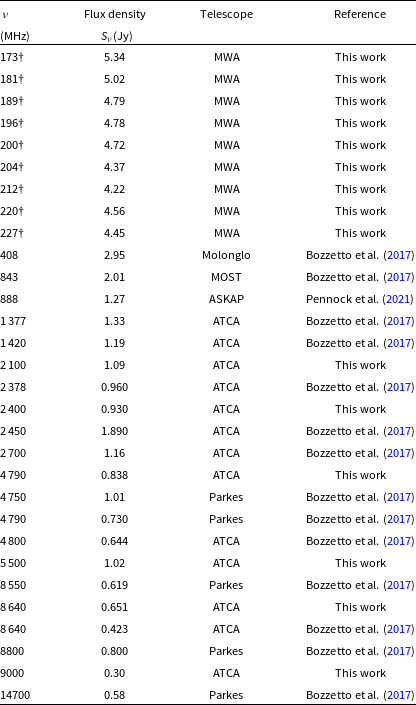
frequency. To accurately measure the spectral index of N 49, we combined our observations with integrated flux density measurements across a wide range of frequencies obtained from the Murchison Widefield Array (MWA; 84--200 MHz; For et al. Reference For2018), Molonglo, Parkes, and ATCA (408–14 700 MHz) radio telescopes, as shown in Table 4.
$\nu$
frequency. To accurately measure the spectral index of N 49, we combined our observations with integrated flux density measurements across a wide range of frequencies obtained from the Murchison Widefield Array (MWA; 84--200 MHz; For et al. Reference For2018), Molonglo, Parkes, and ATCA (408–14 700 MHz) radio telescopes, as shown in Table 4.
Flux density measurements of SNR N 49 at multiple radio frequencies. † indicates that we used images from For et al. (Reference For2018) to measure N 49 flux densities.
Radio continuum spectrum of N 49 using MWA, ASKAP, and ATCA data (Table 4). The black solid line shows a linear least squares fit in logarithmic space, giving a spectral index of $\alpha= -0.55 \pm 0.03$
. The relative errors (assumed to be 10%) are shown as vertical bars.
$\alpha= -0.55 \pm 0.03$
. The relative errors (assumed to be 10%) are shown as vertical bars.
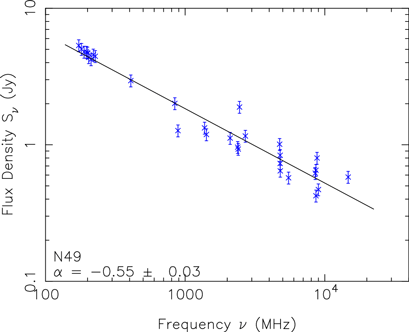
In Fig. 8, we plot integrated flux densities vs. frequency. Relative errors, assumed to be 10%, are used as error bars on the logarithmic plot. The resulting radio spectral index, $\alpha= -0.55 \pm 0.03$
, is typical of middle-age SNRs (Filipovic et al. Reference Filipovic, Haynes, White and Jones1998a; Urošević Reference Urošević2014; Bozzetto et al. Reference Bozzetto2017).
$\alpha= -0.55 \pm 0.03$
, is typical of middle-age SNRs (Filipovic et al. Reference Filipovic, Haynes, White and Jones1998a; Urošević Reference Urošević2014; Bozzetto et al. Reference Bozzetto2017).
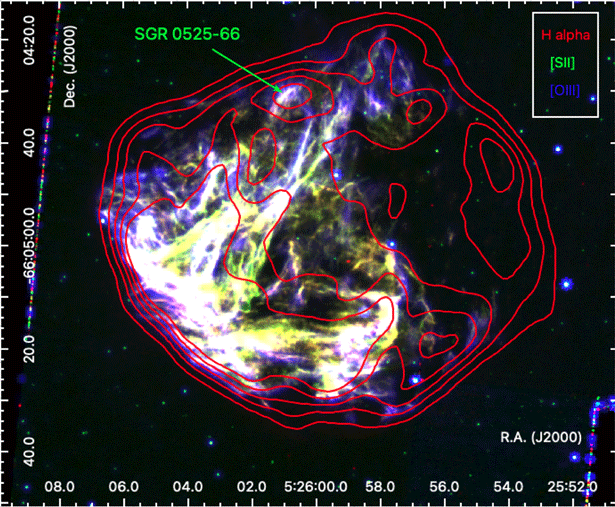
The HST optical image of N 49 as described in Bilikova et al. (Reference Bilikova, Williams, Chu, Gruendl and Lundgren2007) (RGB = H $\alpha$
(red), [S ii] (green), and [O iii] (blue) overlaid with 5.5 GHz radio contours (0.25, 1.4, 2.6,3.8,5 and 5 mJy beam
$\alpha$
(red), [S ii] (green), and [O iii] (blue) overlaid with 5.5 GHz radio contours (0.25, 1.4, 2.6,3.8,5 and 5 mJy beam $^{-1}$
).
$^{-1}$
).
SNR N 49 has an apparent diameter of 75′′, which at the LMC distance of 50 kpc corresponds to 18.2 pc. We estimate its flux density at 1 GHz to be S $_\textrm{1\,GHz}=1.82\pm0.04$
Jy, the surface brightness to be 1.75
$_\textrm{1\,GHz}=1.82\pm0.04$
Jy, the surface brightness to be 1.75 $\times10^{-19}$
W m
$\times10^{-19}$
W m $^{-2}$
Hz
$^{-2}$
Hz $^{-1}$
sr
$^{-1}$
sr $^{-1}$
, and the total radio luminosity (10 MHz–100 GHz) 9.22
$^{-1}$
, and the total radio luminosity (10 MHz–100 GHz) 9.22 $\times10^{27}$
W. The position of N 49 within the surface brightness to diameter (
$\times10^{27}$
W. The position of N 49 within the surface brightness to diameter ( $\Sigma$
–D) diagram (
$\Sigma$
–D) diagram ( $\Sigma$
=1.8
$\Sigma$
=1.8 $\times10^{-19}$
W m
$\times10^{-19}$
W m $^{-2}$
Hz
$^{-2}$
Hz $^{-1}$
sr
$^{-1}$
sr $^{-1}$
, D=18.2 pc) by Pavlović et al. (Reference Pavlović2018) suggests that this remnant is in its earlytomid Sedov phase (Urošević Reference Urošević2020, Reference Urošević2022). This is consistent with an explosion energy of
$^{-1}$
, D=18.2 pc) by Pavlović et al. (Reference Pavlović2018) suggests that this remnant is in its earlytomid Sedov phase (Urošević Reference Urošević2020, Reference Urošević2022). This is consistent with an explosion energy of $2\times10^{51}$
erg evolving in an environment having a density of
$2\times10^{51}$
erg evolving in an environment having a density of $\sim$
0.02 cm
$\sim$
0.02 cm $^{-3}$
Such a low-density environment, however, is not consistent with our estimate of the remnant’s RM. This is because a low-density medium would not provide enough electrons to produce significant Faraday rotation. Therefore, for an SNR with a high RM, the surrounding environment must have a relatively higher electron density, suggesting interaction with denser regions of the ISM. This denser medium would contribute to the higher electron density required to explain the observed RM values, however, RM also depends on the strength of the magnetic field along the line of sight (
$^{-3}$
Such a low-density environment, however, is not consistent with our estimate of the remnant’s RM. This is because a low-density medium would not provide enough electrons to produce significant Faraday rotation. Therefore, for an SNR with a high RM, the surrounding environment must have a relatively higher electron density, suggesting interaction with denser regions of the ISM. This denser medium would contribute to the higher electron density required to explain the observed RM values, however, RM also depends on the strength of the magnetic field along the line of sight ( $B_{||}$
) where a stronger magnetic field could, in principle, increase the RM.
$B_{||}$
) where a stronger magnetic field could, in principle, increase the RM.
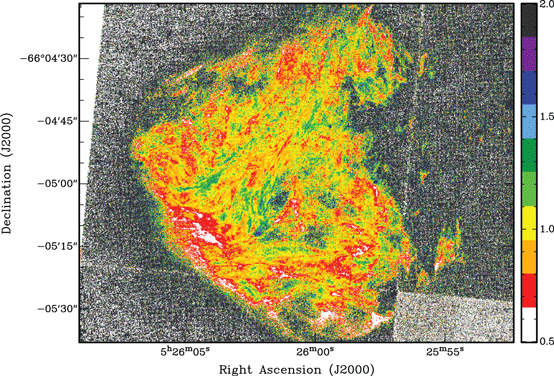
The [S ii]/H $\alpha$
ratio map indicates the bright filaments and extent of emission.
$\alpha$
ratio map indicates the bright filaments and extent of emission.
4. Discussion
4.1. N 49 emission features
N 49 is one of the brightest optical SNR in the LMC. While its semi-circled distinctive filamentary crescent opens to the northwest and emits very faint emission, a bright emission ridge can be seen in the east and southeast as shown in Fig. 9. Such filamentary structures in optical images indicate that optical filaments observed at distances of 5–10 pc may not be directly associated with the material that was initially surrounding the progenitor star but rather with the more general ISM that the shockwave has encountered and interacted with as it expanded. Massive progenitor stars usually clear most of their surrounding material during their lifetimes, due to their powerful stellar winds (Bilikova et al. Reference Bilikova, Williams, Chu, Gruendl and Lundgren2007).
N 49 is located within a high column density Hi ridge between two kpc-scale super-giant shells, LMC4 and LMC5 (Meaburn Reference Meaburn1980). These are thought to have formed from multiple generations of stellar feedback (Fujii et al. Reference Fujii2021). Multi-wavelength observations show clear evidence of interaction between the remnant and dense clumpy interstellar clouds on the eastern side (Vancura et al. Reference Vancura, Blair, Long and Raymond1992a). This interaction leads to bright emission in radio, optical, infrared, ultraviolet, and X-ray bands (Park et al. Reference Park2003; Bilikova et al. Reference Bilikova, Williams, Chu, Gruendl and Lundgren2007). The radio morphology of N 49 is generally consistent with trends seen at optical and X-ray wavelengths.
In the optical image, a line of brilliant filaments is seen as a ridge that runs south-east from the SNR. We have overlaid 5.5 GHz radio contours on the optical image (Fig. 9) to show the association between the optical and radio continuum emissions. We re-emphasise that N 49 lacks bright filaments in its western part; this may be due to a cooler low-density environment of dust and gas.
The emission line ratio of singularly ionised sulphur to hydrogen-alpha ([S ii]/H $\alpha$
> 0.4) is primarily used in optical extragalactic searches for SNR, as expected for shock-heated regions (Mathewson & Clarke Reference Mathewson and Clarke1973; D’Odorico, Perinotto & Benvenuti Reference D’Odorico, Perinotto, Benvenuti and Macchetto1980; Matonick & Fesen Reference Matonick and Fesen1997; Blair & Long Reference Blair and Long1997). As it can be seen in Fig. 10, [S ii]/H
$\alpha$
> 0.4) is primarily used in optical extragalactic searches for SNR, as expected for shock-heated regions (Mathewson & Clarke Reference Mathewson and Clarke1973; D’Odorico, Perinotto & Benvenuti Reference D’Odorico, Perinotto, Benvenuti and Macchetto1980; Matonick & Fesen Reference Matonick and Fesen1997; Blair & Long Reference Blair and Long1997). As it can be seen in Fig. 10, [S ii]/H $\alpha$
ratios of 0.45–1.1 have been measured for this SNR using HST images. The bullet feature shows only weak patches of H
$\alpha$
ratios of 0.45–1.1 have been measured for this SNR using HST images. The bullet feature shows only weak patches of H $\alpha$
emission on the west side of the remnant.
$\alpha$
emission on the west side of the remnant.
N 49′s X-ray/radio boundary of diffuse emission extends to the south and east along its circumference (Fig. 4). A diffuse emission component also appears to be embedded in the outermost emission patches which follow the X-ray/radio boundary. X-ray and radio data confirm the cavity’s presence in the remnant and asymmetric expansion of the gas has been observed in this region. This is associated with irregular density distributions of materials surrounding the explosion (Campana et al. Reference Campana2022).
4.2. Comparison with other similar SNRs
Studies of SNRs, including N 49, are essential because they provide unique constraints on the properties of these systems (Gaensler et al. Reference Gaensler, Hendrick, Reynolds and Borkowski2003). We compare N 49 with several well-studied SNRs and PWNe in the Small & Large Magellanic Clouds (MCs) and the Milky Way Galaxy. For example, both MCSNR J0540–693 and MCSNR J0453–6829 in the LMC have PWNe; the former hosting a 50 ms pulsar (Gotthelf & Wang Reference Gotthelf and Wang2000), while the latter has an estimated spectral index $\alpha=-0.39\pm0.03$
, consistent with non-thermal radio shell emission (Haberl et al. Reference Haberl2012). N 206 (B 0532–71.0) is an SNR in the LMC suggested to be in the middle to late stage of its evolution (Klinger et al. Reference Klinger, Dickel, Fields and Milne2002) with a small X-ray and radio continuum knot at the outer tip. This feature’s elongated morphology and the surrounding wedge-shaped X-ray enhancement suggest a possible bow-shock PWN structure, with a spectral index over the remnant of –0.33. This value is fairly flat for an SNR; spectral indices for PWNe tend to be greater than –0.4, as compared to a typical shell SNR that tends to be between –0.8 and –0.3. An X-ray study of N 206 suggests this SNR-PWN system is generated by an eastward moving pulsar (Williams et al. Reference Williams2005).
$\alpha=-0.39\pm0.03$
, consistent with non-thermal radio shell emission (Haberl et al. Reference Haberl2012). N 206 (B 0532–71.0) is an SNR in the LMC suggested to be in the middle to late stage of its evolution (Klinger et al. Reference Klinger, Dickel, Fields and Milne2002) with a small X-ray and radio continuum knot at the outer tip. This feature’s elongated morphology and the surrounding wedge-shaped X-ray enhancement suggest a possible bow-shock PWN structure, with a spectral index over the remnant of –0.33. This value is fairly flat for an SNR; spectral indices for PWNe tend to be greater than –0.4, as compared to a typical shell SNR that tends to be between –0.8 and –0.3. An X-ray study of N 206 suggests this SNR-PWN system is generated by an eastward moving pulsar (Williams et al. Reference Williams2005).
We observe a much wider range of PWNe and SNR in our Galaxy. For example, IC 443 is a mixed-morphologyFootnote
m
Galactic SNR is notable for its interaction with surrounding molecular clouds. The PWN is detected in the southern edge of the SNR and is suggested to be associated; it was produced around 30 000 yr ago in a core-collapse SN event (Olbert et al. Reference Olbert, Clearfield, Williams, Keohane and Frail2001). Observational characteristics of this PWN show a flat spectrum radio emission ( $\alpha$
= –0.1 to –0.3), a steep X-ray spectrum (
$\alpha$
= –0.1 to –0.3), a steep X-ray spectrum ( $\alpha_{x}$
= 1.0–1.5) and a high degree of linear polarisation (
$\alpha_{x}$
= 1.0–1.5) and a high degree of linear polarisation ( $>$
5%). The tail of the nebula does not point towards the geometric centre of the SNR (Olbert et al. Reference Olbert, Clearfield, Williams, Keohane and Frail2001). The pulsar B 1951+32A is associated with a bullet-shaped PWN having a bow-shocked morphology, seen in radio and X-ray as moving with a supersonic velocity. This pulsar is associated with the strongly polarised (
$>$
5%). The tail of the nebula does not point towards the geometric centre of the SNR (Olbert et al. Reference Olbert, Clearfield, Williams, Keohane and Frail2001). The pulsar B 1951+32A is associated with a bullet-shaped PWN having a bow-shocked morphology, seen in radio and X-ray as moving with a supersonic velocity. This pulsar is associated with the strongly polarised ( $\sim$
15–30%) non-thermal Galactic radio SNR CTB 80 (Castelletti et al. Reference Castelletti2003).The radio spectral index of this SNR has been estimated to be
$\sim$
15–30%) non-thermal Galactic radio SNR CTB 80 (Castelletti et al. Reference Castelletti2003).The radio spectral index of this SNR has been estimated to be $\alpha=-0.36\pm0.02$
(Castelletti & Dubner Reference Castelletti and Dubner2005; Downes Reference Downes1970).
$\alpha=-0.36\pm0.02$
(Castelletti & Dubner Reference Castelletti and Dubner2005; Downes Reference Downes1970).
N 49 contrasts with IC 443, N 206 (MCSNR J0531–7100) and CTB 80 which show similarities in radio spectral index, radio emission, and morphology. N49s typical SNR radio spectral index ( $\alpha=-0.54\pm0.02$
) and its high radio polarisation in the southwestern part suggests a knot scenario is more probable than a PWN explanation.
$\alpha=-0.54\pm0.02$
) and its high radio polarisation in the southwestern part suggests a knot scenario is more probable than a PWN explanation.
5. Conclusions and future studies
We present new radio continuum intensity and polarisation images of the well-known LMC SNR N 49. A high fractional polarisation region is found around the area where the proposed ‘bullet’ ejecta is positioned with moderate levels of mean fractional polarisation at 5.5 and 9 GHz of 7 $\pm$
1% and 10
$\pm$
1% and 10 $\pm$
1%, respectively, throughout the remnant as a whole. In the vicinity of the so-called ‘bullet’ knot, these polarisation values are noticeably larger than found in previous studies.
$\pm$
1%, respectively, throughout the remnant as a whole. In the vicinity of the so-called ‘bullet’ knot, these polarisation values are noticeably larger than found in previous studies.
The mean value for the Faraday rotation of SNR N 49 from combining CABB data is 212 $\pm$
65 rad m
$\pm$
65 rad m $^{-2}$
and the maximum value of RM is 591
$^{-2}$
and the maximum value of RM is 591 $\pm$
103 rad m
$\pm$
103 rad m $^{-2}$
. The strong RM near the southwest of the SNR might correspond with strong hard X-rays positioned to the southeast.
$^{-2}$
. The strong RM near the southwest of the SNR might correspond with strong hard X-rays positioned to the southeast.
Together with Chandra X-ray observations, our analyses of new and archival (pre-CABB; 1990s) ATCA observations has allowed further study of prominent features of the ‘bullet’ found beyond the southwestern boundary. This presumed ejecta knot is possibly interacting with a molecular cloud, causing increased brightness in this region while no polarisation can be seen in the cloud proper. Thermal soft X-ray emissions may barely be seen within this region in the three-colour image of N 49 (Fig. 4).
We note the explosion centre of N 49, based on the knot’s trail projection is offseted from the geometrical centre of the SNR ( $\sim$
44′′ or
$\sim$
44′′ or $\sim$
10.4 pc). The next generation’s high dynamic range and resolution radio observations of N 49 are essential for establishing the connection and nature of the knot’s polarisation, magnetic field, and Faraday rotation.
$\sim$
10.4 pc). The next generation’s high dynamic range and resolution radio observations of N 49 are essential for establishing the connection and nature of the knot’s polarisation, magnetic field, and Faraday rotation.
Acknowledgment
The ATCA is part of the Australia Telescope National Facility which is funded by the Australian Government for operation as a National Facility managed by Australian Commonwealth Scientific and Industrial Research Organisation (CSIRO). This paper includes archived data obtained through the Australia Telescope Online Archive (http://atoa.atnf.csiro.au). We used the karma and miriad software packages developed by the ATNF. MDF and GR acknowledge ARC funding through grant DP200100784. D.U. acknowledges the Ministry of Education, Science and Technological Development of the Republic of Serbia through contract No. 451-03-68/2022-14/200104, and for the support through the joint project of the Serbian Academy of Sciences and Arts and Bulgarian Academy of Sciences on the detection of extragalactic SNR and H ii regions. We thank Jane Kaczmarek for her suggestions and support. We thank an anonymous referee for comments and suggestions that greatly improved our paper.
Data availability
We used archival data from the Australia Telescope Compact Array (ATCA), which was accessed through the online archives of the Australia Telescope National Facility (ATNF)Footnote
n
. The X-ray imaging results were derived from the Chandra Data Archive (CDA) dataFootnote
o
. Additionally, optical HST images (H $\alpha$
, [S ii], and [O iii]) were downloaded from the Mikulski Archive for Space Telescopes (MAST)Footnote
p
$\alpha$
, [S ii], and [O iii]) were downloaded from the Mikulski Archive for Space Telescopes (MAST)Footnote
p


 Open access