


1. Introduction: The known knowns
1.1. The age of population genomics
With technological advances, recent projects aim to build reference genomes for all pro- and eukaryotic species on Earth, including global initiatives such as the Earth BioGenome Project and regional efforts such as the Darwin Tree of Life Project (Darwin Tree of Life Project Consortium et al., Reference Blaxter, Mieszkowska, Di Palma, Holland, Durbin, Richards, Berriman, Kersey, Hollingsworth, Wilson, Twyford, Gaya, Lawniczak, Lewis, Broad, Howe, Hart, Flicek and Barnes2022; Lewin et al., Reference Lewin, Richards, Lieberman Aiden, Allende, Archibald, Bálint, Barker, Baumgartner, Belov, Bertorelle, Blaxter, Cai, Caperello, Carlson, Castilla-Rubio, Chaw, Chen, Childers, Coddington, Conde and Zhang2022). Consequently, population genomics based on reference genomes and population polymorphism data is, and will increasingly be, used as a major tool to inform conservation biology from populations up to ecosystem levels (Darwin Tree of Life Project Consortium et al., Reference Blaxter, Mieszkowska, Di Palma, Holland, Durbin, Richards, Berriman, Kersey, Hollingsworth, Wilson, Twyford, Gaya, Lawniczak, Lewis, Broad, Howe, Hart, Flicek and Barnes2022; Formenti et al., Reference Formenti, Theissinger, Fernandes, Bista, Bombarely, Bleidorn, Ciofi, Crottini, Godoy, Höglund, Malukiewicz, Mouton, Oomen, Paez, Palsbøll, Pampoulie, Ruiz-López, Svardal, Theofanopoulou, de Vries and Zammit2022; Hohenlohe et al., Reference Hohenlohe, Funk and Rajora2021; Lewin et al., Reference Lewin, Richards, Lieberman Aiden, Allende, Archibald, Bálint, Barker, Baumgartner, Belov, Bertorelle, Blaxter, Cai, Caperello, Carlson, Castilla-Rubio, Chaw, Chen, Childers, Coddington, Conde and Zhang2022; Theissinger et al., Reference Theissinger, Fernandes, Formenti, Bista, Berg, Bleidorn, Bombarely, Crottini, Gallo, Godoy, Jentoft, Malukiewicz, Mouton, Oomen, Paez, Palsbøll, Pampoulie, Ruiz-López, Secomandi and Zammit2023). Conservation genomics as a predictive science aims to 1) quantify the available neutral and selective genetic diversity of species (Waldvogel et al., Reference Waldvogel, Feldmeyer, Rolshausen, Exposito-Alonso, Rellstab, Kofler, Mock, Schmid, Schmitt, Bataillon, Savolainen, Bergland, Flatt, Guillaume and Pfenninger2020), 2) link this diversity to the past and current geographic range of species (Aitken et al., Reference Aitken, Jordan and Tumas2024; Benestan et al., Reference Benestan, Ferchaud, Hohenlohe, Garner, Naylor, Baums, Schwartz, Kelley and Luikart2016), 3) assess the impact of future changes in species range, landscape and habitats on genetic diversity (Hohenlohe et al., Reference Hohenlohe, Funk and Rajora2021; Theissinger et al., Reference Theissinger, Fernandes, Formenti, Bista, Berg, Bleidorn, Bombarely, Crottini, Gallo, Godoy, Jentoft, Malukiewicz, Mouton, Oomen, Paez, Palsbøll, Pampoulie, Ruiz-López, Secomandi and Zammit2023), and 4) anticipate the future adaptive potential of species (Aitken et al., Reference Aitken, Jordan and Tumas2024; Theissinger et al., Reference Theissinger, Fernandes, Formenti, Bista, Berg, Bleidorn, Bombarely, Crottini, Gallo, Godoy, Jentoft, Malukiewicz, Mouton, Oomen, Paez, Palsbøll, Pampoulie, Ruiz-López, Secomandi and Zammit2023). More specifically, this research program attempts to quantify the genome-wide effects of demographic events (bottlenecks), spatial structuring and gene flow (introgression and hybridization) (Waldvogel et al., Reference Waldvogel, Feldmeyer, Rolshausen, Exposito-Alonso, Rellstab, Kofler, Mock, Schmid, Schmitt, Bataillon, Savolainen, Bergland, Flatt, Guillaume and Pfenninger2020) to explain and predict inbreeding, mutational load, diversity loss and responses to disease and management (e.g., genetic rescue), ultimately guiding conservation actions (Hohenlohe et al., Reference Hohenlohe, Funk and Rajora2021; Schmidt et al., Reference Schmidt, Thia and Hoffmann2024; Theissinger et al., Reference Theissinger, Fernandes, Formenti, Bista, Berg, Bleidorn, Bombarely, Crottini, Gallo, Godoy, Jentoft, Malukiewicz, Mouton, Oomen, Paez, Palsbøll, Pampoulie, Ruiz-López, Secomandi and Zammit2023). Over the last decades, major developments in theoretical (starting with Hudson, Reference Hudson1983, McVean & Cardin, Reference McVean and Cardin2005a, and Wiuf & Hein, Reference Wiuf and Hein1999a, Reference Wiuf and Hein1999b) and simulation (Adrion et al., Reference Adrion, Cole, Dukler, Galloway, Gladstein, Gower, Kyriazis, Ragsdale, Tsambos, Baumdicker, Carlson, Cartwright, Durvasula, Gronau, Kim, McKenzie, Messer, Noskova, Ortega-Del Vecchyo and Kern2020; Baumdicker et al., Reference Baumdicker, Bisschop, Goldstein, Gower, Ragsdale, Tsambos, Zhu, Eldon, Ellerman, Galloway, Gladstein, Gorjanc, Guo, Jeffery, Kretzschumar, Lohse, Matschiner, Nelson, Pope, Quinto-Cortés and Kelleher2022; Haller & Messer, Reference Haller and Messer2019) approaches for population genomics have allowed the development of methods to use full genome polymorphism data for the inference of past demographic and introgression events (Korfmann et al., Reference Korfmann, Gaggiotti and Fumagalli2023; Li & Durbin, Reference Li and Durbin2011; Schiffels & Durbin, Reference Schiffels and Durbin2014; Sheehan et al., Reference Sheehan, Harris and Song2013; Terhorst et al., Reference Terhorst, Kamm and Song2017; Wang et al., Reference Wang, Mathieson, O’Connell and Schiffels2020). As a consequence, the fields of biogeography and population genetics are merging, allowing us to correlate past changes in the species/population demography and ecological niche (reconstructed via niche modelling methods) with past climatic data (obtained from geological records). Thereby, unprecedented insights are gained into the role of environmental and climatic conditions in driving the evolutionary history of species, namely, the demographic and selective events underpinning (local) adaptation to novel and changing habitats (Hohenlohe et al., Reference Hohenlohe, Funk and Rajora2021; Theissinger et al., Reference Theissinger, Fernandes, Formenti, Bista, Berg, Bleidorn, Bombarely, Crottini, Gallo, Godoy, Jentoft, Malukiewicz, Mouton, Oomen, Paez, Palsbøll, Pampoulie, Ruiz-López, Secomandi and Zammit2023). Nonetheless, several pitfalls remain. First, the comparisons between the timing of these events estimated from genetic data and climatic ones remain inaccurate in species where life spans, mutation rates or life-history traits are not known (Árnason et al., Reference Árnason, Koskela, Halldórsdóttir and Eldon2023; Freund et al., Reference Freund, Kerdoncuff, Matuszewski, Lapierre, Hildebrandt, Jensen, Ferretti, Lambert, Sackton and Achaz2023; Lennon et al., Reference Lennon, den Hollander, Wilke-Berenguer and Blath2021; Möst et al., Reference Möst, Oexle, Marková, Aidukaite, Baumgartner, Stich, Wessels, Martin-Creuzburg and Spaak2015; Sellinger et al., Reference Sellinger, Abu Awad, Moest and Tellier2020; Tellier et al., Reference Tellier, Laurent, Lainer, Pavlidis and Stephan2011). Second, the genetic architecture of selection (e.g., local adaptation) may range from selective sweeps at one locus (starting from one mutation) up to complex polygenic selection over many loci (with or without standing variation) (reviewed in Barghi et al., Reference Barghi, Hermisson and Schlötterer2020). It is notoriously more difficult to detect footprints of selection in polymorphism data under polygenic selection rather than at single major loci (Barghi et al., Reference Barghi, Hermisson and Schlötterer2020; Pavlidis et al., Reference Pavlidis, Metzler and Stephan2012; Sella & Barton, Reference Sella and Barton2019). Third, past changes in population size, especially bottlenecks, can decrease the accuracy of genome scans for selection. Accurate demographic inference is thus required to subsequently improve the downstream inference of regions under selection in the genome (see the analyses in Soni et al., Reference Soni, Johri and Jensen2023 and recommendations in Johri et al., Reference Johri, Aquadro, Beaumont, Charlesworth, Excoffier, Eyre-Walker, Keightley, Lynch, McVean, Payseur, Pfeifer, Stephan and Jensen2022).
1.2. Population genomics theory and inference
However, the majority of statistical inference methods, based on neutral evolutionary models, are developed primarily for the inference of past demography and gene flow of human populations. Specifically, inference methods do assume human life-history traits, such as diploidy, outcrossing, non-overlapping generations and a small variance in offspring production. We argue here that these strong modelling assumptions are violated by many plant, fungal and invertebrate species. In spite of this, a handful of recent statistical inference methods allow us to move beyond these limitations and to broaden the applicability of population genomics methods. Realistic genomic features are also accounted for, such as variation in mutation and recombination rates along the genome (Barroso et al., Reference Barroso, Puzović and Dutheil2019), and additional genomic markers (beyond single nucleotide polymorphisms; SNPs) such as DNA methylation (Korfmann et al., Reference Korfmann, Zauchner, Huo, Grünke, Wang, Tellier and Arunkumar2024b; Sellinger et al., Reference Sellinger, Johannes and Tellier2024). New methods also account for ecological and evolutionary (often overlooked) life-history traits, such as seed banking and dormancy (Lennon et al., Reference Lennon, den Hollander, Wilke-Berenguer and Blath2021; Tellier, Reference Tellier2019), self-fertilization (Blischak et al., Reference Blischak, Sajan, Barker and Gutenkunst2023; Daigle & Johri, Reference Daigle and Johri2025; Gilbert et al., Reference Gilbert, Zdraljevic, Cook, Cutter, Andersen and Baer2022; Sellinger et al., Reference Sellinger, Abu Awad, Moest and Tellier2020; Strütt et al., Reference Strütt, Sellinger, Glémin, Tellier and Laurent2023) or large variance in offspring production (Árnason et al., Reference Árnason, Koskela, Halldórsdóttir and Eldon2023; Eldon, Reference Eldon2020; Korfmann et al., Reference Korfmann, Sellinger, Freund, Fumagalli and Tellier2024a; Tellier & Lemaire, Reference Tellier and Lemaire2014). As a result of these advances, it is becoming possible to jointly estimate ecological parameters and past demographic events (Blischak et al., Reference Blischak, Sajan, Barker and Gutenkunst2023; Gilbert et al., Reference Gilbert, Zdraljevic, Cook, Cutter, Andersen and Baer2022; Sellinger et al., Reference Sellinger, Abu Awad, Moest and Tellier2020; Strütt et al., Reference Strütt, Sellinger, Glémin, Tellier and Laurent2023) as well as speciation (with or without gene flow) events (Dittberner et al., Reference Dittberner, Tellier and de Meaux2022). Applying appropriate methods accounting for life-history traits improves the inference accuracy of the past demographic history for a wide range of species (Árnason et al., Reference Árnason, Koskela, Halldórsdóttir and Eldon2023; Blischak et al., Reference Blischak, Sajan, Barker and Gutenkunst2023; Korfmann et al., Reference Korfmann, Sellinger, Freund, Fumagalli and Tellier2024a; Sellinger et al., Reference Sellinger, Abu Awad, Moest and Tellier2020, Reference Sellinger, Abu-Awad and Tellier2021; Strütt et al., Reference Strütt, Sellinger, Glémin, Tellier and Laurent2023). It is not the aim of this study to provide an in-depth review of statistical inference methods in population genomics and we thus redirect interested readers to Dutheil (Reference Dutheil2020), Ignatieva et al. (Reference Ignatieva, Favero, Koskela, Sant and Myers2025), Johri et al. (Reference Johri, Aquadro, Beaumont, Charlesworth, Excoffier, Eyre-Walker, Keightley, Lynch, McVean, Payseur, Pfeifer, Stephan and Jensen2022), Mather et al. (Reference Mather, Traves and Ho2020) and Peede et al. (Reference Peede, Cousins, Durvasula, Ignatieva, Kovacs, Nieto, Puckett and Chevy2026). In the following, we only sketch the general theoretical ingredients underpinning the inference of non-standard life-history and ecological traits, before suggesting new questions that can be addressed by extending such methodologies.
Simply put, the frequency and number of SNPs along the genome and their correlations can be summarized through the ratio of
 $\rho $
over
$\rho $
over
 $\theta $
shaping the coalescent process (Hudson, Reference Hudson1983) and more specifically the so-called ancestral recombination graph (ARG; Griffiths & Marjoram, Reference Griffiths and Marjoram1997). The population recombination rate
$\theta $
shaping the coalescent process (Hudson, Reference Hudson1983) and more specifically the so-called ancestral recombination graph (ARG; Griffiths & Marjoram, Reference Griffiths and Marjoram1997). The population recombination rate
 $\rho = 4N_er$
expresses the total amount of crossing-over (recombination) events in the diploid population of effective size
$\rho = 4N_er$
expresses the total amount of crossing-over (recombination) events in the diploid population of effective size
 $N_e$
and depends on the per-site recombination rate r. The population mutation rate
$N_e$
and depends on the per-site recombination rate r. The population mutation rate
 $\theta =4N_e\mu $
is based on the effective size
$\theta =4N_e\mu $
is based on the effective size
 $N_e$
(determining genetic drift) and the mutation rate
$N_e$
(determining genetic drift) and the mutation rate
 $\mu $
. This ratio is important, as in the neutral theory of evolution, it defines the number of SNPs, their frequency and the distance between recombination events along the genome (linkage disequilibrium (LD) or identity by descent (IBD) tracks; Hudson, Reference Hudson1983; Wiuf & Hein, Reference Wiuf and Hein1999a). The genealogy, or coalescent tree, of a sample/population at a given locus is summarized by its length (time of coalescent events) and topology (order of branching; Griffiths & Marjoram, Reference Griffiths and Marjoram1997; Tavaré et al., Reference Tavaré, Balding, Griffiths and Donnelly1997). The time to the most recent common ancestor (TMRCA) of a coalescent tree depends on the population size (
$\mu $
. This ratio is important, as in the neutral theory of evolution, it defines the number of SNPs, their frequency and the distance between recombination events along the genome (linkage disequilibrium (LD) or identity by descent (IBD) tracks; Hudson, Reference Hudson1983; Wiuf & Hein, Reference Wiuf and Hein1999a). The genealogy, or coalescent tree, of a sample/population at a given locus is summarized by its length (time of coalescent events) and topology (order of branching; Griffiths & Marjoram, Reference Griffiths and Marjoram1997; Tavaré et al., Reference Tavaré, Balding, Griffiths and Donnelly1997). The time to the most recent common ancestor (TMRCA) of a coalescent tree depends on the population size (
 $N_e$
) and can be estimated by the number of SNPs observed in the sample. Furthermore, recombination at the locus generates the ARG, which covers the full population history of a chromosome, including all recombination and coalescence events. The ARG can be decomposed, for simplicity, as a series of coalescent trees linked by recombination events, or in other words, changes in tree topology along a sequence following a Markov process. This yields the sequentially Markovian coalescent (SMC) approximation (Li & Durbin, Reference Li and Durbin2011; Marjoram & Wall, Reference Marjoram and Wall2006; McVean & Cardin, Reference McVean and Cardin2005b; Wiuf & Hein, Reference Wiuf and Hein1999a, Reference Wiuf and Hein1999b). A portion of the genome (i.e., a locus) with a given ancestral genealogy (the coalescent tree) is thus delineated by two recombination events. The genealogical properties of a locus and transitions between loci are defined by the ratio
$N_e$
) and can be estimated by the number of SNPs observed in the sample. Furthermore, recombination at the locus generates the ARG, which covers the full population history of a chromosome, including all recombination and coalescence events. The ARG can be decomposed, for simplicity, as a series of coalescent trees linked by recombination events, or in other words, changes in tree topology along a sequence following a Markov process. This yields the sequentially Markovian coalescent (SMC) approximation (Li & Durbin, Reference Li and Durbin2011; Marjoram & Wall, Reference Marjoram and Wall2006; McVean & Cardin, Reference McVean and Cardin2005b; Wiuf & Hein, Reference Wiuf and Hein1999a, Reference Wiuf and Hein1999b). A portion of the genome (i.e., a locus) with a given ancestral genealogy (the coalescent tree) is thus delineated by two recombination events. The genealogical properties of a locus and transitions between loci are defined by the ratio
 $\rho / \theta $
, which are used in inference methods based on the ARG to estimate past demographic events (Li & Durbin, Reference Li and Durbin2011; Marjoram & Wall, Reference Marjoram and Wall2006; McVean & Cardin, Reference McVean and Cardin2005a). SMC-based inference methods are sensitive to the ratio
$\rho / \theta $
, which are used in inference methods based on the ARG to estimate past demographic events (Li & Durbin, Reference Li and Durbin2011; Marjoram & Wall, Reference Marjoram and Wall2006; McVean & Cardin, Reference McVean and Cardin2005a). SMC-based inference methods are sensitive to the ratio
 $\rho / \theta $
departing from one, the value observed in humans, especially when
$\rho / \theta $
departing from one, the value observed in humans, especially when
 $\rho / \theta>1$
. In the latter, there is an excess of recombination events which cannot be recovered because of the lack of information (Ishigohoka & Liedvogel, Reference Ishigohoka and Liedvogel2025; Sellinger et al., Reference Sellinger, Abu Awad, Moest and Tellier2020, Reference Sellinger, Abu-Awad and Tellier2021). High
$\rho / \theta>1$
. In the latter, there is an excess of recombination events which cannot be recovered because of the lack of information (Ishigohoka & Liedvogel, Reference Ishigohoka and Liedvogel2025; Sellinger et al., Reference Sellinger, Abu Awad, Moest and Tellier2020, Reference Sellinger, Abu-Awad and Tellier2021). High
 $\rho / \theta $
ratios lead to inference inaccuracies as most SMC-based methods assume a value of this ratio close to 1. Furthermore, the methods assume the mutation and recombination rates to be constant across the genome and through time, which may not be true in most species (Ishigohoka & Liedvogel, Reference Ishigohoka and Liedvogel2025; Sellinger et al., Reference Sellinger, Johannes and Tellier2024). An important argument we develop in the following is that life-history traits influence this ratio (see Table 1 for an overview), and this influence can be understood and accounted for using recent inference methods.
$\rho / \theta $
ratios lead to inference inaccuracies as most SMC-based methods assume a value of this ratio close to 1. Furthermore, the methods assume the mutation and recombination rates to be constant across the genome and through time, which may not be true in most species (Ishigohoka & Liedvogel, Reference Ishigohoka and Liedvogel2025; Sellinger et al., Reference Sellinger, Johannes and Tellier2024). An important argument we develop in the following is that life-history traits influence this ratio (see Table 1 for an overview), and this influence can be understood and accounted for using recent inference methods.
Overview of different life-history traits influencing population recombination (
 $\rho $
) and mutation (
$\rho $
) and mutation (
 $\theta $
) rates, when known
$\theta $
) rates, when known

Note: Baseline: Random mating, no dormancy, obligate sex and discrete generations (
 $\rho _0=4Nr$
,
$\rho _0=4Nr$
,
 $\theta _0=4N\mu $
). Entries show rescaling relative to baseline. For clonality, long life span and sweepstake reproduction, theoretical work is at times available for scaling the coalescent rate or recombination rate, but no intuitive formula could be provided (NA). a
$\theta _0=4N\mu $
). Entries show rescaling relative to baseline. For clonality, long life span and sweepstake reproduction, theoretical work is at times available for scaling the coalescent rate or recombination rate, but no intuitive formula could be provided (NA). a
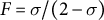 $F=\sigma /(2-\sigma )$
(inbreeding coef.). Note that the scaling by F breaks down with high selfing and recombination rates (Roze, Reference Roze2009). b A. Tellier unpublished data. c
$F=\sigma /(2-\sigma )$
(inbreeding coef.). Note that the scaling by F breaks down with high selfing and recombination rates (Roze, Reference Roze2009). b A. Tellier unpublished data. c
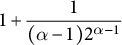 $1+\dfrac {1}{(\alpha -1) 2^{\alpha -1}}$
.
$1+\dfrac {1}{(\alpha -1) 2^{\alpha -1}}$
.
1.3. Evolution of ecological traits in the age of population genomics
Most population models assume fixed and constant mutation and recombination rates as well as ecological life-history trait values in time, thus a constant ratio
 $\rho / \theta $
. Namely, a given plant species is expected to exhibit a fixed rate of dormancy or selfing since its evolutionary origin. This is, in part, a bias due to the study of evolutionary transitions at the macro-evolutionary level, thereby tracing the evolution of traits across phylogenies spanning millions of years (e.g., Willis et al., Reference Willis, Baskin, Baskin, Auld, Venable, Cavender-Bares, Donohue and Rubio de Casas2014 for dormancy and Duncan et al., Reference Duncan, Ellis, Forest and Verboom2024 for selfing). However, by definition, the evolution of an ecologically relevant life-history trait occurs over much shorter timescales of hundreds to thousands of years. The evolution of life-history traits occurs as a cause or consequence of changes in climatic conditions, abiotic factors and landscape characteristics which define 1) biotic and trophic interactions, 2) spatial structure, 3) positive selection pressure for local adaptation, and 4) fluctuating selection pressures (see Figure 1). In order to apprehend the impact of the future climatic, landscape and habitat changes on species resilience and adaptation, we argue for a more precise investigation of how life-history traits change over population genetics timescales of tens to thousands of generations.
$\rho / \theta $
. Namely, a given plant species is expected to exhibit a fixed rate of dormancy or selfing since its evolutionary origin. This is, in part, a bias due to the study of evolutionary transitions at the macro-evolutionary level, thereby tracing the evolution of traits across phylogenies spanning millions of years (e.g., Willis et al., Reference Willis, Baskin, Baskin, Auld, Venable, Cavender-Bares, Donohue and Rubio de Casas2014 for dormancy and Duncan et al., Reference Duncan, Ellis, Forest and Verboom2024 for selfing). However, by definition, the evolution of an ecologically relevant life-history trait occurs over much shorter timescales of hundreds to thousands of years. The evolution of life-history traits occurs as a cause or consequence of changes in climatic conditions, abiotic factors and landscape characteristics which define 1) biotic and trophic interactions, 2) spatial structure, 3) positive selection pressure for local adaptation, and 4) fluctuating selection pressures (see Figure 1). In order to apprehend the impact of the future climatic, landscape and habitat changes on species resilience and adaptation, we argue for a more precise investigation of how life-history traits change over population genetics timescales of tens to thousands of generations.
Schematic of interactions between ecological and evolutionary forces upon changes in the abiotic environment and landscape (top box). Environmental modifications trigger neutral and selective changes in the evolvable parameters of the species interactions (green box on the left) and in the ecological life-history traits (green box on the right), via conventional evolutionary forces (orange). The evolutionary forces under the influence of ecological life-history traits generate observable polymorphism patterns in the genome and define the genetic and epigenetic diversity (purple).

In the plant literature, there is a wealth of theoretical and empirical studies dissecting the causes and consequences of transition from outcrossing to selfing (see Abu Awad & Billiard, Reference Abu Awad and Billiard2017; Abu Awad & Roze, Reference Abu Awad and Roze2020; Brazier et al., Reference Brazier, Stetsenko, Roze and Glémin2025 and references therein). For example, selfing promotes the survival of populations at the margin of species ranges, and thus favours the establishment of populations during the colonization of novel isolated habitats (Pannell, Reference Pannell2016). The presence of a constant selfing rate within one or between several populations can be inferred along with the demographic history and distribution of fitness effects of mutations (Blischak et al., Reference Blischak, Sajan, Barker and Gutenkunst2023; Dittberner et al., Reference Dittberner, Tellier and de Meaux2022; Gilbert et al., Reference Gilbert, Zdraljevic, Cook, Cutter, Andersen and Baer2022; Sellinger et al., Reference Sellinger, Abu Awad, Moest and Tellier2020 but see Daigle & Johri, Reference Daigle and Johri2025 for possible biases). However, to our knowledge, so far only one pioneering method allows the inference of changing selfing/outcrossing rate in time (Strütt et al., Reference Strütt, Sellinger, Glémin, Tellier and Laurent2023). The main finding of that study is that the transition from outcrossing to selfing is observed by studying the transitions in TMRCA of consecutive coalescent trees (and the genomic span of a tree) along the genome (Figure 2). 1) Transitions can occur in recent times between short coalescent trees that exhibit low nucleotide diversity and span relatively long genomic regions (hundreds to thousands of bp) due to the low effective recombination rate under the selfing regime. 2) Transitions between old coalescent trees that exhibit high nucleotide diversity and span very short genomic regions (tens of bp) because of the higher recombination rate under the outcrossing regime. This information is reflected as sub-structuring in the density of the so-called transition matrix, which summarizes changes in coalescent times along the genome (see below). In other words, polymorphism data exhibit unusual clustering patterns of mutation (SNPs) and recombination events along the genome upon a change of the ratio
 $\rho / \theta $
in time (Strütt et al., Reference Strütt, Sellinger, Glémin, Tellier and Laurent2023). We also note that such structuring in the transition matrix can also occur due to changes in the ancestral population spatial structure (Cousins et al., Reference Cousins, Scally and Durbin2025; Nieto et al., Reference Nieto, Lao and Mona2025; see below for a discussion of non-identifiability).
$\rho / \theta $
in time (Strütt et al., Reference Strütt, Sellinger, Glémin, Tellier and Laurent2023). We also note that such structuring in the transition matrix can also occur due to changes in the ancestral population spatial structure (Cousins et al., Reference Cousins, Scally and Durbin2025; Nieto et al., Reference Nieto, Lao and Mona2025; see below for a discussion of non-identifiability).
Comparison of genome-wide TMRCA patterns for two haploid samples from distinct individuals. (a) Constant outcrossing (no transition; constant s=0.001). (b) Transition from outcrossing to high selfing during the final
 $20{,}000$
generations before sampling (
$20{,}000$
generations before sampling (
 $s: 0.001\rightarrow 0.95$
). The blue step curve shows the TMRCA of the two lineages along the genome; steps occur at recombination breakpoints. The dashed red line marks the transition time. (The Y-axis is on a log scale.) Brief methods: We simulated diploid populations forward in SLiM (Haller & Messer, Reference Haller and Messer2019) with time-varying selfing rate and tree-sequence recording on. The recorded genealogies were recapitated with msprime (Baumdicker et al., Reference Baumdicker, Bisschop, Goldstein, Gower, Ragsdale, Tsambos, Zhu, Eldon, Ellerman, Galloway, Gladstein, Gorjanc, Guo, Jeffery, Kretzschumar, Lohse, Matschiner, Nelson, Pope, Quinto-Cortés and Kelleher2022) (ancestral
$s: 0.001\rightarrow 0.95$
). The blue step curve shows the TMRCA of the two lineages along the genome; steps occur at recombination breakpoints. The dashed red line marks the transition time. (The Y-axis is on a log scale.) Brief methods: We simulated diploid populations forward in SLiM (Haller & Messer, Reference Haller and Messer2019) with time-varying selfing rate and tree-sequence recording on. The recorded genealogies were recapitated with msprime (Baumdicker et al., Reference Baumdicker, Bisschop, Goldstein, Gower, Ragsdale, Tsambos, Zhu, Eldon, Ellerman, Galloway, Gladstein, Gorjanc, Guo, Jeffery, Kretzschumar, Lohse, Matschiner, Nelson, Pope, Quinto-Cortés and Kelleher2022) (ancestral
 $N_e=10{,}000$
, recombination rate
$N_e=10{,}000$
, recombination rate
 $r=5\times 10^{-8}$
bp
$r=5\times 10^{-8}$
bp
 $^{-1}$
gen
$^{-1}$
gen
 $^{-1}$
), and neutral mutations were added at
$^{-1}$
), and neutral mutations were added at
 $\mu =10^{-8}$
bp
$\mu =10^{-8}$
bp
 $^{-1}$
gen
$^{-1}$
gen
 $^{-1}$
. For each panel, we computed TMRCA along the genome between two haploid genomes (one from each diploid individual) using tskit (Kelleher et al., Reference Kelleher, Etheridge and McVean2016).
$^{-1}$
. For each panel, we computed TMRCA along the genome between two haploid genomes (one from each diploid individual) using tskit (Kelleher et al., Reference Kelleher, Etheridge and McVean2016).

It is a central hypothesis and argument of this manuscript that inference of the ratio
 $\rho / \theta $
in time by means of population genomics can, therefore, help reveal the timing of changes in life-history traits and population structure (Cousins et al., Reference Cousins, Scally and Durbin2025), and highlight possible links of causality with environmental changes. We further suggest leveraging genome-wide polymorphism data from plant populations to study additional eco–evo feedback processes, such as niche construction and species interaction networks. In the following, we first highlight how ecological and environmental changes can drive the evolution of important and common plant life-history traits and how such adaptations affect the ratio
$\rho / \theta $
in time by means of population genomics can, therefore, help reveal the timing of changes in life-history traits and population structure (Cousins et al., Reference Cousins, Scally and Durbin2025), and highlight possible links of causality with environmental changes. We further suggest leveraging genome-wide polymorphism data from plant populations to study additional eco–evo feedback processes, such as niche construction and species interaction networks. In the following, we first highlight how ecological and environmental changes can drive the evolution of important and common plant life-history traits and how such adaptations affect the ratio
 $\rho / \theta $
(Figure 1 and Table 1). Second, we describe extensions of inference methods that could be used to reconstruct this evolutionary history.
$\rho / \theta $
(Figure 1 and Table 1). Second, we describe extensions of inference methods that could be used to reconstruct this evolutionary history.
2. The known unknowns: Causes and consequences of changes in eco–evo traits
2.1. Change in life-history traits which decrease the ratio
 $N_e/N$

Several life-history traits, such as clonality, selfing, longer life-span (and generation overlap) and sweepstakes reproduction, decrease the ratio
 $N_e/N$
(Waples et al., Reference Waples, Luikart, Faulkner and Tallmon2013; Waples, Reference Waples2025). In other words, the census (or ecological abundance) size of the population (N) appears much higher than its effective population size (
$N_e/N$
(Waples et al., Reference Waples, Luikart, Faulkner and Tallmon2013; Waples, Reference Waples2025). In other words, the census (or ecological abundance) size of the population (N) appears much higher than its effective population size (
 $N_e$
), the latter reflecting the amount of genetic drift and nucleotide diversity (Charlesworth & Charlesworth, Reference Charlesworth and Charlesworth2010). Generation overlap promoted by long life spans decreases the
$N_e$
), the latter reflecting the amount of genetic drift and nucleotide diversity (Charlesworth & Charlesworth, Reference Charlesworth and Charlesworth2010). Generation overlap promoted by long life spans decreases the
 $N_e$
versus the population size N because few individuals effectively reproduce each generation compared to the total size N (Alexandre et al., Reference Alexandre, Abbara, Fruet, Loverdo and Bitbol2025; Charlesworth, Reference Charlesworth1994; Waples, Reference Waples2025), and consequently decreases the population recombination and mutation rates. Nonetheless, the lower expected population mutation rate can be compensated by an inflated mutation rate per individual, if the mutational output increases during the life span of the plant (for example, possible mutations between branches of a tree plant; Antolin & Strobeck, Reference Antolin and Strobeck1985; Iwasa et al., Reference Iwasa, Tomimoto and Satake2024).
$N_e$
versus the population size N because few individuals effectively reproduce each generation compared to the total size N (Alexandre et al., Reference Alexandre, Abbara, Fruet, Loverdo and Bitbol2025; Charlesworth, Reference Charlesworth1994; Waples, Reference Waples2025), and consequently decreases the population recombination and mutation rates. Nonetheless, the lower expected population mutation rate can be compensated by an inflated mutation rate per individual, if the mutational output increases during the life span of the plant (for example, possible mutations between branches of a tree plant; Antolin & Strobeck, Reference Antolin and Strobeck1985; Iwasa et al., Reference Iwasa, Tomimoto and Satake2024).
Similarly, as a first approximation, clonality in plants, invertebrates or fungi results in a low effective population size as few lineages are found in the present time (see Table 1, Hartfield et al., Reference Hartfield, Wright and Agrawal2016). However, we note that the effects of clonality on mutation, drift and recombination can generate more complex scenarios and outcomes in terms of underpinning coalescent trees, especially for very high rates yielding high within-individual diversity (Abdalrahem et al., Reference Abdalrahem, Noûs, Duplessis, Frey, Stoeckel and Halkett2025; Halkett et al., Reference Halkett, Simon and Balloux2005; Hartfield et al., Reference Hartfield, Wright and Agrawal2016; Hartfield, Reference Hartfield2021). Clonality may evolve as a reproductive assurance strategy in crop pathogens (as in the pathogen of potato and tomato, Phytophthora infestans; Ludwiczewska et al., Reference Ludwiczewska, Janiszewska, Yin and Śliwka2025) or plants with long-lived survival strategies (e.g., as ramets connected by stolons or rhizomes; Franklin et al., Reference Franklin, Alpert, Salguero-Gómez, Janovsk, Herben, Klimešová and Douhovnikoff2021; Klimešová et al., Reference Klimešová, Ottaviani, Charles-Dominique, Campetella, Canullo, Chelli, Janovsk, Lubbe, Martınková and Herben2021). Meanwhile the effect of selfing is to decrease
 $N_e$
by at least a factor two (accounting for background selection can result in much lower
$N_e$
by at least a factor two (accounting for background selection can result in much lower
 $N_e$
; Roze, Reference Roze2016) and diminish the effective recombination rate (Table 1, Nordborg, Reference Nordborg2000) but in contrast to clonality, high selfing rates decrease heterozygosity.
$N_e$
; Roze, Reference Roze2016) and diminish the effective recombination rate (Table 1, Nordborg, Reference Nordborg2000) but in contrast to clonality, high selfing rates decrease heterozygosity.
Finally, sweepstakes reproduction occurs in species producing a large number of offspring per parent (of the order of the population size) but exhibiting a (very) low survival rate of juveniles to the next generation. This high amount of seeds, spores or propagules promotes reproductive assurance (so-called ecological K strategy or type III survivorship) and is possibly common to airborne plant pathogens or plant species with short life cycles (Freund et al., Reference Freund, Kerdoncuff, Matuszewski, Lapierre, Hildebrandt, Jensen, Ferretti, Lambert, Sackton and Achaz2023). A relationship between the propagule number and size, and genetic diversity has been shown in invertebrate animal species (Romiguier et al., Reference Romiguier, Gayral, Ballenghien, Bernard, Cahais, Chenuil, Chiari, Dernat, Duret and Faivre2014; Waples et al., Reference Waples, Luikart, Faulkner and Tallmon2013). Sweepstakes reproduction also decreases the ratio
 $N_e/N$
(Árnason et al., Reference Árnason, Koskela, Halldórsdóttir and Eldon2023; Eldon et al., Reference Eldon, Riquet, Yearsley, Jollivet and Broquet2016; Freund et al., Reference Freund, Kerdoncuff, Matuszewski, Lapierre, Hildebrandt, Jensen, Ferretti, Lambert, Sackton and Achaz2023; Tellier & Lemaire, Reference Tellier and Lemaire2014; Waples, Reference Waples2025).
$N_e/N$
(Árnason et al., Reference Árnason, Koskela, Halldórsdóttir and Eldon2023; Eldon et al., Reference Eldon, Riquet, Yearsley, Jollivet and Broquet2016; Freund et al., Reference Freund, Kerdoncuff, Matuszewski, Lapierre, Hildebrandt, Jensen, Ferretti, Lambert, Sackton and Achaz2023; Tellier & Lemaire, Reference Tellier and Lemaire2014; Waples, Reference Waples2025).
We now propose a set of general predictions on the timing, speed and likelihood of the evolution of these life-history traits, which can be tested. On the one hand, clonality and selfing can frequently appear in fungi (e.g., fungal pathogens of plants) by mutations or loss of the mating-type genes as observed in crop pathogens, which can exhibit some clonal lineages with one type (Ludwiczewska et al., Reference Ludwiczewska, Janiszewska, Yin and Śliwka2025). Fungi, especially pathogens of plants, do present the ability to produce large amounts of dispersing and infectious spores, making them likely to exhibit sweepstakes reproduction (Tellier & Lemaire, Reference Tellier and Lemaire2014). This is especially true for crop pathogens, in particular, which exhibit frequent boom and bust cycles, selection due to fungicide treatment, seasonal bottlenecks and a great influence of the climate on their infection rate (Jigisha et al., Reference Jigisha, Ly, Minadakis, Freund, Kunz, Piechota, Akin, Balmas, Ben-David, Bencze, Bourras, Bozzoli, Cotuna, Couleaud, Cséplo, Czembor, Desiderio, Dörnte, Dreiseitl, Feechan and Menardo2025; Tellier & Lemaire, Reference Tellier and Lemaire2014). The evolution of selfing in plants is relatively common by mutation of the self-incompatibility genes (Charlesworth et al., Reference Charlesworth, Vekemans, Castric and Glémin2005; Pannell, Reference Pannell2016). Thus, clonality/selfing/sweepstakes reproduction may emerge relatively rapidly through genetic modifications and be subsequently selected by environmental changes, leading to sharp temporal transitions in reproduction mode. For example, we speculate that clonal pathogens currently infecting crops may have originally infected wild species with fewer annual clonal cycles (or outcrossing) due to unfavourable conditions and limited resource availability. Transitioning to crop hosts, with their abundant and more favourable conditions (a longer growing season), could have increased their clonal reproductive cycles. Such a transition in clonality rates could coincide with the advent of agriculture and the domestication of crops and livestock. The speed of evolution of such traits may be similar to transitions in outcrossing/selfing rates, which, in families of flowering plants with self-incompatibility, occur through a mutation at a self-incompatibility locus. Transitions to selfing are punctual events (Strütt et al., Reference Strütt, Sellinger, Glémin, Tellier and Laurent2023) which are uncovered when studying recent population/splits (less than a million years ago, e.g., in Arabis sp.; Dittberner et al., Reference Dittberner, Tellier and de Meaux2022 and Capsella sp.; Koenig et al., Reference Koenig, Hagmann, Li, Bemm, Slotte, Neuffer, Wright and Weigel2019), or population dynamics at the species margins (Pannell, Reference Pannell2016). Thus, we speculate that studying the population genomics of recent population split or population expansion in new habitats (including agricultural landscape) would reveal more cases of transition in life-history traits (and their genetic bases) beyond the known cases of outcrossing/selfing in plants. On the other hand, we note that the evolution of the same traits, long life-span, clonality and sweepstakes reproduction in plants also requires specific physiological mechanisms of reproduction and vegetative multiplication: for example, the existence of ramets and rhizomes, perennial physiological structures or the production of large amounts of pollen in gymnosperms. We speculate that in these cases, the changes in life-history trait may be more gradual and occur over longer periods of time beyond a few hundreds/thousands of generations via the evolution of novel physiological pathways and rewiring of gene networks. Such life-history traits change may be better revealed using functional phylogenomic comparisons between species (see Delaux et al., Reference Delaux, Hetherington, Coudert, Delwiche, Dunand, Gould, Kenrick, Li, Philippe, Rensing, Rich, Strullu-Derrien and de Vries2019 for an overview).
2.2. Dormancy and dispersal as bet-hedging strategies which increase the ratio
$N_e/N$

Dormancy and dispersal (of pollen or seeds) are well-known plant bet-hedging strategies in space and time, respectively (Buoro & Carlson, Reference Buoro and Carlson2014; Vitalis et al., Reference Vitalis, Rousset, Kobayashi, Olivieri and Gandon2013). In particular, dormancy (long-term seed banking) evolves in response to unpredictable habitats (e.g., desertic; Adondakis & Venable, Reference Adondakis and Venable2004), competition (Blath & Tóbiás, Reference Blath and Tóbiás2020) or to coevolution with antagonistic species (Verin & Tellier, Reference Verin and Tellier2018), and has important consequences for the genetic diversity and evolutionary potential of populations (Lennon et al., Reference Lennon, den Hollander, Wilke-Berenguer and Blath2021; Tellier, Reference Tellier2019). Dormancy delays the time to fixation or loss of alleles as alleles in the seed bank are hidden from genetic drift (the diversity storage effect of dormancy; Kaj et al., Reference Kaj, Krone and Lascoux2001; Lennon et al., Reference Lennon, den Hollander, Wilke-Berenguer and Blath2021; Tellier, Reference Tellier2019). As a result, dormancy lengthens the TMRCA of a population, allowing for the inference of older demographic events than would be possible in the absence of seed banking (Möst et al., Reference Möst, Oexle, Marková, Aidukaite, Baumgartner, Stich, Wessels, Martin-Creuzburg and Spaak2015; Sellinger et al., Reference Sellinger, Abu Awad, Moest and Tellier2020; Živković & Tellier, Reference Živković and Tellier2012). Concomitantly, seed banking increases the effective population size
 $N_e$
relative to the census size N, as encapsulated for the weak seed bank by the formula
$N_e$
relative to the census size N, as encapsulated for the weak seed bank by the formula
 $N_e=N/b^2$
, with
$N_e=N/b^2$
, with
 $0<b<1$
being the germination rate (Kaj et al., Reference Kaj, Krone and Lascoux2001; Tellier et al., Reference Tellier, Laurent, Lainer, Pavlidis and Stephan2011). Simultaneously, the recombination rate is multiplied by the germination rate (b) because only active above-ground plants can perform meiosis (so that
$0<b<1$
being the germination rate (Kaj et al., Reference Kaj, Krone and Lascoux2001; Tellier et al., Reference Tellier, Laurent, Lainer, Pavlidis and Stephan2011). Simultaneously, the recombination rate is multiplied by the germination rate (b) because only active above-ground plants can perform meiosis (so that
 $\rho =4N_erb$
). Overall, seed banking with smaller values of germination rate (b) decreases the ratio
$\rho =4N_erb$
). Overall, seed banking with smaller values of germination rate (b) decreases the ratio
 $\rho / \theta =rb/\mu $
for fixed r and
$\rho / \theta =rb/\mu $
for fixed r and
 $\mu $
values (Sellinger et al., Reference Sellinger, Abu Awad, Moest and Tellier2020; Živković & Tellier, Reference Živković and Tellier2018). Long-term dormancy is widespread across plant species, though it is unclear at what speed it evolves. Most seeds of land plants have the ability to stay dormant, but long-term dormancy also entails the ability to remain dormant even if conditions are favourable (Baskin & Baskin, Reference Baskin and Baskin2000). Different physiological and morphological adaptations are necessary for long-term dormancy. The so-called morphophysiological dormancy is likely ancestral to all seed plants (Willis et al., Reference Willis, Baskin, Baskin, Auld, Venable, Cavender-Bares, Donohue and Rubio de Casas2014). The appearance of several types of dormancy likely evolved from this ancestral state, such as morphological, physiological, physical dormancy and nondormancy (Willis et al., Reference Willis, Baskin, Baskin, Auld, Venable, Cavender-Bares, Donohue and Rubio de Casas2014). However, it remains unknown how rapidly such transitions in dormancy rates occur, and whether variations in dormancy rates across populations of a given species are neutral, adaptive or maladaptive (Lampei et al., Reference Lampei, Metz and Tielbörger2017; Tomiolo et al., Reference Tomiolo, Van der Putten and Tielbörger2015). We thus advocate that novel inference methods can be used to test for recent timing of dormancy adaptation in plants.
$\mu $
values (Sellinger et al., Reference Sellinger, Abu Awad, Moest and Tellier2020; Živković & Tellier, Reference Živković and Tellier2018). Long-term dormancy is widespread across plant species, though it is unclear at what speed it evolves. Most seeds of land plants have the ability to stay dormant, but long-term dormancy also entails the ability to remain dormant even if conditions are favourable (Baskin & Baskin, Reference Baskin and Baskin2000). Different physiological and morphological adaptations are necessary for long-term dormancy. The so-called morphophysiological dormancy is likely ancestral to all seed plants (Willis et al., Reference Willis, Baskin, Baskin, Auld, Venable, Cavender-Bares, Donohue and Rubio de Casas2014). The appearance of several types of dormancy likely evolved from this ancestral state, such as morphological, physiological, physical dormancy and nondormancy (Willis et al., Reference Willis, Baskin, Baskin, Auld, Venable, Cavender-Bares, Donohue and Rubio de Casas2014). However, it remains unknown how rapidly such transitions in dormancy rates occur, and whether variations in dormancy rates across populations of a given species are neutral, adaptive or maladaptive (Lampei et al., Reference Lampei, Metz and Tielbörger2017; Tomiolo et al., Reference Tomiolo, Van der Putten and Tielbörger2015). We thus advocate that novel inference methods can be used to test for recent timing of dormancy adaptation in plants.
Similarly, gene flow between populations of a metapopulation, namely, the dispersal ability, is a (neutral, adaptive or maladaptive) trait that evolves and varies across land plants (Vitalis et al., Reference Vitalis, Rousset, Kobayashi, Olivieri and Gandon2013) and which can be negatively correlated with dormancy (Buoro & Carlson, Reference Buoro and Carlson2014). The rate of gene flow and the contribution of each sub-population to offspring production determine the effective population size of a metapopulation (
 $N_e$
) based on the local population sizes (N) of each sub-population (deme). If all demes contribute similarly to the offspring production, low levels of gene flow increase
$N_e$
) based on the local population sizes (N) of each sub-population (deme). If all demes contribute similarly to the offspring production, low levels of gene flow increase
 $N_e$
compared to the sum of all local N values because genetic differentiation increases between demes (Caballero, Reference Caballero2020; Charlesworth & Charlesworth, Reference Charlesworth and Charlesworth2010). Changes in dispersal rates, or in offspring production between demes, are in part adaptive and a response to environmental pressures, such as habitat fragmentation, changes in species range and niche due to abiotic and biotic factors. Changes in time of gene flow between demes or in the population spatial structure (deme sizes, the number of demes and existence of gene flow between demes) is reflected in changes in the ratio
$N_e$
compared to the sum of all local N values because genetic differentiation increases between demes (Caballero, Reference Caballero2020; Charlesworth & Charlesworth, Reference Charlesworth and Charlesworth2010). Changes in dispersal rates, or in offspring production between demes, are in part adaptive and a response to environmental pressures, such as habitat fragmentation, changes in species range and niche due to abiotic and biotic factors. Changes in time of gene flow between demes or in the population spatial structure (deme sizes, the number of demes and existence of gene flow between demes) is reflected in changes in the ratio
 $N_e/N$
over time, the ratio
$N_e/N$
over time, the ratio
 $\rho / \theta $
and the sub-structuring of the transition matrix (Cousins et al., Reference Cousins, Scally and Durbin2025). The principle for inference of changes in gene flow and/or spatial structure in time is based on inferring the ratio between the cross-population and within-population coalescence rates per hidden state (time interval) (Schiffels & Durbin, Reference Schiffels and Durbin2014). This relative cross coalescence rate measures genetic exchanges between historical populations and is expected to be close to one when the two populations are effectively one panmictic unit (e.g., under high gene flow), and close to zero when populations are fully separated (under very low gene flow). It is important to note that changes in gene flow and/or spatial structure can be confounded with one another and with changes in
$\rho / \theta $
and the sub-structuring of the transition matrix (Cousins et al., Reference Cousins, Scally and Durbin2025). The principle for inference of changes in gene flow and/or spatial structure in time is based on inferring the ratio between the cross-population and within-population coalescence rates per hidden state (time interval) (Schiffels & Durbin, Reference Schiffels and Durbin2014). This relative cross coalescence rate measures genetic exchanges between historical populations and is expected to be close to one when the two populations are effectively one panmictic unit (e.g., under high gene flow), and close to zero when populations are fully separated (under very low gene flow). It is important to note that changes in gene flow and/or spatial structure can be confounded with one another and with changes in
 $N_e$
in time (Chikhi et al., Reference Chikhi, Rodrıguez, Grusea, Santos, Boitard and Mazet2018; Mazet & Noûs, Reference Mazet and Noûs2023). There is thus some amount of non-identifiability between models of changes in rates of gene flow, changes in ancestral spatial structure and population size variation (
$N_e$
in time (Chikhi et al., Reference Chikhi, Rodrıguez, Grusea, Santos, Boitard and Mazet2018; Mazet & Noûs, Reference Mazet and Noûs2023). There is thus some amount of non-identifiability between models of changes in rates of gene flow, changes in ancestral spatial structure and population size variation (
 $N_e$
) (Chikhi et al., Reference Chikhi, Rodrıguez, Grusea, Santos, Boitard and Mazet2018; Cousins et al., Reference Cousins, Scally and Durbin2025; Jouniaux et al., Reference Jouniaux, Arredondo, Boitard, Chikhi and Mazet2026; Mazet & Noûs, Reference Mazet and Noûs2023), leading to different interpretations regarding the reason for the observed shared polymorphism between species (Tournebize & Chikhi, Reference Tournebize and Chikhi2025): namely, introgression or shared ancestral polymorphism (due to population structure, see below for further discussion on non-identifiability).
$N_e$
) (Chikhi et al., Reference Chikhi, Rodrıguez, Grusea, Santos, Boitard and Mazet2018; Cousins et al., Reference Cousins, Scally and Durbin2025; Jouniaux et al., Reference Jouniaux, Arredondo, Boitard, Chikhi and Mazet2026; Mazet & Noûs, Reference Mazet and Noûs2023), leading to different interpretations regarding the reason for the observed shared polymorphism between species (Tournebize & Chikhi, Reference Tournebize and Chikhi2025): namely, introgression or shared ancestral polymorphism (due to population structure, see below for further discussion on non-identifiability).
2.3. Changes in mutation and recombination rates
A major assumption of all statistical inference methods is that the per-site mutation (
 $\mu $
) and recombination (r) rates are constant in time and follow a homogeneous Poisson process along the genome (Johri et al., Reference Johri, Aquadro, Beaumont, Charlesworth, Excoffier, Eyre-Walker, Keightley, Lynch, McVean, Payseur, Pfeifer, Stephan and Jensen2022; Sellinger et al., Reference Sellinger, Johannes and Tellier2024; Soni et al., Reference Soni, Johri and Jensen2023, Reference Soni, Pfeifer and Jensen2024). Accounting for variation in these rates along the genome can be done by using empirical rates (mutation or recombination maps if available), or for example, by a first round of inference via iSMC (Barroso et al., Reference Barroso, Puzović and Dutheil2019) and a second round of demographic inference for windows of given estimated rates. If the assumptions of Markovian and Poissonian properties along the genome and in time are not met, the accuracy of the inference decreases as the fundamental hypotheses of the coalescent model are violated (Soni et al., Reference Soni, Johri and Jensen2023, Reference Soni, Pfeifer and Jensen2024). This phenomenon was discussed and highlighted when using gene body methylation data in Arabidopsis thaliana for demographic inference (Sellinger et al., Reference Sellinger, Johannes and Tellier2024), or for assessing the reliability of selective sweep scans (Johri et al., Reference Johri, Aquadro, Beaumont, Charlesworth, Excoffier, Eyre-Walker, Keightley, Lynch, McVean, Payseur, Pfeifer, Stephan and Jensen2022; Soni et al., Reference Soni, Johri and Jensen2023) or estimation of the distribution of fitness effects (Soni et al., Reference Soni, Pfeifer and Jensen2024). Regarding methylation, the property of cytosine methylation to mutate per site but also over genomic regions (group of cytosines) violates the model assumption and yields problematic results in the SMC (Sellinger et al., Reference Sellinger, Johannes and Tellier2024). An imperfect but practical solution is to use only polymorphic methylated sites (single methylated polymorphisms) within coding genes (Vidalis et al., Reference Vidalis, Živković, Wardenaar, Roquis, Tellier and Johannes2016) to perform demographic inference using SMC (Sellinger et al., Reference Sellinger, Johannes and Tellier2024) or deep learning methods (Korfmann et al., Reference Korfmann, Zauchner, Huo, Grünke, Wang, Tellier and Arunkumar2024b). To make use of full genome data, additional markers, such as microsatellites, methylation and insertion–deletions (indels), if they fulfil the mentioned assumptions, can be used to increase the statistical power to infer past demographic events as well as changes in
$\mu $
) and recombination (r) rates are constant in time and follow a homogeneous Poisson process along the genome (Johri et al., Reference Johri, Aquadro, Beaumont, Charlesworth, Excoffier, Eyre-Walker, Keightley, Lynch, McVean, Payseur, Pfeifer, Stephan and Jensen2022; Sellinger et al., Reference Sellinger, Johannes and Tellier2024; Soni et al., Reference Soni, Johri and Jensen2023, Reference Soni, Pfeifer and Jensen2024). Accounting for variation in these rates along the genome can be done by using empirical rates (mutation or recombination maps if available), or for example, by a first round of inference via iSMC (Barroso et al., Reference Barroso, Puzović and Dutheil2019) and a second round of demographic inference for windows of given estimated rates. If the assumptions of Markovian and Poissonian properties along the genome and in time are not met, the accuracy of the inference decreases as the fundamental hypotheses of the coalescent model are violated (Soni et al., Reference Soni, Johri and Jensen2023, Reference Soni, Pfeifer and Jensen2024). This phenomenon was discussed and highlighted when using gene body methylation data in Arabidopsis thaliana for demographic inference (Sellinger et al., Reference Sellinger, Johannes and Tellier2024), or for assessing the reliability of selective sweep scans (Johri et al., Reference Johri, Aquadro, Beaumont, Charlesworth, Excoffier, Eyre-Walker, Keightley, Lynch, McVean, Payseur, Pfeifer, Stephan and Jensen2022; Soni et al., Reference Soni, Johri and Jensen2023) or estimation of the distribution of fitness effects (Soni et al., Reference Soni, Pfeifer and Jensen2024). Regarding methylation, the property of cytosine methylation to mutate per site but also over genomic regions (group of cytosines) violates the model assumption and yields problematic results in the SMC (Sellinger et al., Reference Sellinger, Johannes and Tellier2024). An imperfect but practical solution is to use only polymorphic methylated sites (single methylated polymorphisms) within coding genes (Vidalis et al., Reference Vidalis, Živković, Wardenaar, Roquis, Tellier and Johannes2016) to perform demographic inference using SMC (Sellinger et al., Reference Sellinger, Johannes and Tellier2024) or deep learning methods (Korfmann et al., Reference Korfmann, Zauchner, Huo, Grünke, Wang, Tellier and Arunkumar2024b). To make use of full genome data, additional markers, such as microsatellites, methylation and insertion–deletions (indels), if they fulfil the mentioned assumptions, can be used to increase the statistical power to infer past demographic events as well as changes in
 $\rho / \theta $
(Sellinger et al., Reference Sellinger, Johannes and Tellier2024).
$\rho / \theta $
(Sellinger et al., Reference Sellinger, Johannes and Tellier2024).
Furthermore, we note that the per-site mutation and recombination rates are also subject to evolutionary change. In fact, these rates are likely under constraint and depend on the strength of selection to maintain them at reasonable levels. One such mechanism is termed the drift barrier hypothesis (Sung et al., Reference Sung, Ackerman, Miller, Doak and Lynch2012), which specifically deals with the evolution of the mutation rate. Genetic drift and the efficacy of selection would, by extension, define the balance between the advantages and disadvantages of higher mutation and recombination rates (Barton, Reference Barton2010; Sung et al., Reference Sung, Ackerman, Miller, Doak and Lynch2012). We speculate here that changing life-history traits and the ratio
 $N_e/N$
affects the efficacy of selection in controlling the mutation and recombination rates. Changing life-history traits, such as clonality, selfing, life-span, sweepstakes reproduction or dormancy, would in turn affect the genomic control for optimum per-site mutation or recombination rates (thus the reciprocal arrows in Figure 1): this has been theoretically explored in the case of selfing (Gervais & Roze, Reference Gervais and Roze2017; Stetsenko & Roze, Reference Stetsenko and Roze2022). Such subtle changes due to eco–evo feedback loops may be detected by estimating the empirical per-site rates r and
$N_e/N$
affects the efficacy of selection in controlling the mutation and recombination rates. Changing life-history traits, such as clonality, selfing, life-span, sweepstakes reproduction or dormancy, would in turn affect the genomic control for optimum per-site mutation or recombination rates (thus the reciprocal arrows in Figure 1): this has been theoretically explored in the case of selfing (Gervais & Roze, Reference Gervais and Roze2017; Stetsenko & Roze, Reference Stetsenko and Roze2022). Such subtle changes due to eco–evo feedback loops may be detected by estimating the empirical per-site rates r and
 $\mu $
at present, and comparing these to the inferred ratios
$\mu $
at present, and comparing these to the inferred ratios
 $\rho / \theta $
over time. The statistical accuracy of such analyses is yet unknown.
$\rho / \theta $
over time. The statistical accuracy of such analyses is yet unknown.
2.4. Unknown unknowns: From the extended phenotype to community eco–evo genomics
We have focused on changes in ecological life-history traits decreasing or increasing the ratio
 $N_e/N$
. Such changes not only influence patterns in genome transmission but are the results (or the consequences) of species adaptation to the environment (Figure 1). Furthermore, changes in life-history traits can, in return, modify the abiotic and biotic environment itself. Evolutionary mechanisms, such as the extended phenotype (Dawkins, Reference Dawkins2016) or niche construction (Odling-Smee et al., Reference Odling-Smee, Erwin, Palkovacs, Feldman and Laland2013; Scott-Phillips et al., Reference Scott-Phillips, Laland, Shuker, Dickins and West2014), rely on adaptation by organisms to modify not only their biotic but also their abiotic environment: for example, changes in soil texture and soil microbiome due to earthworm activity and plant roots. These changes are not without consequences, either from the point of view of a focal plant species or from the point of view of several interacting species, and thus changes percolate to higher levels of biological organization (species community up to ecosystems). We envision three examples of environmental changes and eco-evolutionary feedback in multi-species systems. First, plant transition from outcrossing to selfing can promote the colonization of new habitats (Pannell, Reference Pannell2016), accompanied by a founding event and a possible novel population spatial structuring. In doing so, the abiotic and biotic habitats are transformed by the presence of the selfing plant species, potentially facilitating the colonization by other plant and invertebrate species, paving the way for new species community compositions and the evolution of new trophic levels. This scenario assumes, therefore, founder events and possible changes in life-history traits for each species, which we suggest can be detected by applying inference methods on full genome polymorphism data (see below). Second, at the scale of species communities, changes in the abiotic environment (say, an extended drought period or a glacial age) could promote simultaneous and/or correlated responses in adaptive traits across different plant species. For example, a study reveals the joint demographic response of plant and insect species of the Eurasian steppe biota to environmental changes (Kirschner et al., Reference Kirschner, Perez, Záveská, Sanmartín, Marquer, Schlick-Steiner, Alvarez, Arthofer, Frajman, Gamisch, Hilpold, Paun, Trucchi, Steiner and Schönswetter2022). This exemplifies that plant species in a community do show correlated demographic responses to habitat change. Third, eco–evo dynamics occur in a multi-species community. A specific case is co-evolution between antagonistic species (hosts and parasites, prey–predators), which is expected to yield co-demographic changes in both species at short- and long-term time scales (Živković et al., Reference Živković, John, Verin, Stephan and Tellier2019). A first attempt to capture such multi-species co-demographic history has been made using inference from SMC methods and correlating
$N_e/N$
. Such changes not only influence patterns in genome transmission but are the results (or the consequences) of species adaptation to the environment (Figure 1). Furthermore, changes in life-history traits can, in return, modify the abiotic and biotic environment itself. Evolutionary mechanisms, such as the extended phenotype (Dawkins, Reference Dawkins2016) or niche construction (Odling-Smee et al., Reference Odling-Smee, Erwin, Palkovacs, Feldman and Laland2013; Scott-Phillips et al., Reference Scott-Phillips, Laland, Shuker, Dickins and West2014), rely on adaptation by organisms to modify not only their biotic but also their abiotic environment: for example, changes in soil texture and soil microbiome due to earthworm activity and plant roots. These changes are not without consequences, either from the point of view of a focal plant species or from the point of view of several interacting species, and thus changes percolate to higher levels of biological organization (species community up to ecosystems). We envision three examples of environmental changes and eco-evolutionary feedback in multi-species systems. First, plant transition from outcrossing to selfing can promote the colonization of new habitats (Pannell, Reference Pannell2016), accompanied by a founding event and a possible novel population spatial structuring. In doing so, the abiotic and biotic habitats are transformed by the presence of the selfing plant species, potentially facilitating the colonization by other plant and invertebrate species, paving the way for new species community compositions and the evolution of new trophic levels. This scenario assumes, therefore, founder events and possible changes in life-history traits for each species, which we suggest can be detected by applying inference methods on full genome polymorphism data (see below). Second, at the scale of species communities, changes in the abiotic environment (say, an extended drought period or a glacial age) could promote simultaneous and/or correlated responses in adaptive traits across different plant species. For example, a study reveals the joint demographic response of plant and insect species of the Eurasian steppe biota to environmental changes (Kirschner et al., Reference Kirschner, Perez, Záveská, Sanmartín, Marquer, Schlick-Steiner, Alvarez, Arthofer, Frajman, Gamisch, Hilpold, Paun, Trucchi, Steiner and Schönswetter2022). This exemplifies that plant species in a community do show correlated demographic responses to habitat change. Third, eco–evo dynamics occur in a multi-species community. A specific case is co-evolution between antagonistic species (hosts and parasites, prey–predators), which is expected to yield co-demographic changes in both species at short- and long-term time scales (Živković et al., Reference Živković, John, Verin, Stephan and Tellier2019). A first attempt to capture such multi-species co-demographic history has been made using inference from SMC methods and correlating
 $N_e$
of the host and pathogen populations at different time steps (Hecht et al., Reference Hecht, Thompson and Rosenthal2018, Reference Hecht, Thompson and Rosenthal2020). We suggest below extensions of the existing inference methods to infer co-demographic, co-evolutionary and co-structure changes for multi-species communities, thereby dissecting the causes and consequences of eco–evo feedback over time.
$N_e$
of the host and pathogen populations at different time steps (Hecht et al., Reference Hecht, Thompson and Rosenthal2018, Reference Hecht, Thompson and Rosenthal2020). We suggest below extensions of the existing inference methods to infer co-demographic, co-evolutionary and co-structure changes for multi-species communities, thereby dissecting the causes and consequences of eco–evo feedback over time.
3. Inference methods to reveal the unknowns
We highlight some inference methods to estimate demographic events and possible changes in ecological life-history traits in single or assemblage of species, as well as future developments needed. From a conceptual point of view, we assume that time in the past is split into discrete periods, each of which is characterized by a given value of the life-history trait per species, namely, a given ratio
 $ \rho / \theta $
, which is to be estimated.
$ \rho / \theta $
, which is to be estimated.
3.1. SMC-based methods
Methods based on the SMC (McVean & Cardin, Reference McVean and Cardin2005b) make use of hidden Markov models (HMMs), where the observed genetic data (SNPs) are considered to be a signal produced by an underlying unobservable genealogy. The genealogy is modelled as a series of hidden states in a Markov process. A key component of this process is the estimation of the so-called transition matrix, which contains the predicted transition probabilities from one hidden state to another. It reflects the likelihood of transitioning from one coalescent tree (with a given TMRCA) to the next tree (along the genome) by recombination. Each coalescent tree depends only on the tree at the previous position along the genome, leading to a computationally simplified process. We refer to several reviews on SMC methods for more details on the computations (e.g., Dutheil et al., Reference Dutheil, Ganapathy, Hobolth, Mailund, Uyenoyama and Schierup2009; Ignatieva et al., Reference Ignatieva, Favero, Koskela, Sant and Myers2025; Mather et al., Reference Mather, Traves and Ho2020; Peede et al., Reference Peede, Cousins, Durvasula, Ignatieva, Kovacs, Nieto, Puckett and Chevy2026; Spence et al., Reference Spence, Steinrücken, Terhorst and Song2018) and recommendations for analyses (Hilgers et al., Reference Hilgers, Liu, Jensen, Brown, Cousins, Schweiger, Guschanski and Hiller2025; Sellinger et al., Reference Sellinger, Abu-Awad and Tellier2021). The transition matrix is thus a summary of the changes of genealogies and coalescent trees along the genome. The structure of the transition matrices, that is, the density of observations, is determined by past changes in demography as well as ecological life-history traits affecting the ratio
 $\rho / \theta $
as shown for transition to selfing (Strütt et al., Reference Strütt, Sellinger, Glémin, Tellier and Laurent2023) and changes in population structure (Cousins et al., Reference Cousins, Scally and Durbin2025; Nieto et al., Reference Nieto, Lao and Mona2025). SMC-based methods are thus methods of choice to infer changes in ecological life-history traits in time per species.
$\rho / \theta $
as shown for transition to selfing (Strütt et al., Reference Strütt, Sellinger, Glémin, Tellier and Laurent2023) and changes in population structure (Cousins et al., Reference Cousins, Scally and Durbin2025; Nieto et al., Reference Nieto, Lao and Mona2025). SMC-based methods are thus methods of choice to infer changes in ecological life-history traits in time per species.
A first inference of co-demographic or co-evolutionary history between species can be performed by correlating the population sizes
 $N_e$
at different time points (hidden states) for different species based on independent specific inferences (Hecht et al., Reference Hecht, Thompson and Rosenthal2018, Reference Hecht, Thompson and Rosenthal2020). The accuracy of such comparisons relies on the correct scaling of the generation time and mutation rate to match between the studied species. We suggest to go one step further by directly correlating the densities of coalescent times (TMRCA) in the transition matrix for each studied species. Using a likelihood approach (or other algorithms), one should be able to obtain an estimate of the correlation between demographic histories across multiple species for which full-genome polymorphism data are available. In the case of closely related sister species, this multi-species SMC outcome could be compared to the results from multi-species coalescent analyses. We speculate that a similar analysis could be performed using also the density of cross-coalescent rates at different hidden states between populations of each species in order to detect changes in the species’ spatial structure. The advantage of using the transition matrix (and density of IICR) is that time is already scaled by the underlying coalescent framework, allowing comparisons across species independently of knowing the generation and mutation rate. The coalescent scaling would need to be defined based on the current population size of one (reference) species, or based on the average current population size of the studied species. Extensions of SMC methods to analyse multi-species data would therefore allow for a preliminary inference of the important co-demographic and co-evolutionary (life-history traits) changes in several species of the community, albeit not demonstrating the underlying causal eco–evo mechanism.
$N_e$
at different time points (hidden states) for different species based on independent specific inferences (Hecht et al., Reference Hecht, Thompson and Rosenthal2018, Reference Hecht, Thompson and Rosenthal2020). The accuracy of such comparisons relies on the correct scaling of the generation time and mutation rate to match between the studied species. We suggest to go one step further by directly correlating the densities of coalescent times (TMRCA) in the transition matrix for each studied species. Using a likelihood approach (or other algorithms), one should be able to obtain an estimate of the correlation between demographic histories across multiple species for which full-genome polymorphism data are available. In the case of closely related sister species, this multi-species SMC outcome could be compared to the results from multi-species coalescent analyses. We speculate that a similar analysis could be performed using also the density of cross-coalescent rates at different hidden states between populations of each species in order to detect changes in the species’ spatial structure. The advantage of using the transition matrix (and density of IICR) is that time is already scaled by the underlying coalescent framework, allowing comparisons across species independently of knowing the generation and mutation rate. The coalescent scaling would need to be defined based on the current population size of one (reference) species, or based on the average current population size of the studied species. Extensions of SMC methods to analyse multi-species data would therefore allow for a preliminary inference of the important co-demographic and co-evolutionary (life-history traits) changes in several species of the community, albeit not demonstrating the underlying causal eco–evo mechanism.
3.2. Approximate Bayesian computation methods
In principle, the information contained in the transition matrix (IICR and cross-coalescent rates) can also be used in other inference methods, such as approximate Bayesian computation (ABC; Strütt et al., Reference Strütt, Sellinger, Glémin, Tellier and Laurent2023) or deep learning (Korfmann et al., Reference Korfmann, Zauchner, Huo, Grünke, Wang, Tellier and Arunkumar2024b), especially when the analytical computation of the transition and emission probabilities for the HMM is difficult to obtain. The term ‘approximate’ highlights that the method does not rely on a direct likelihood function (Beaumont et al., Reference Beaumont, Zhang and Balding2002; Tavaré et al., Reference Tavaré, Balding, Griffiths and Donnelly1997). In ABC methods, the explicit computation of the likelihood
 $P(D | \theta )$
is replaced with an approximate approach. This is because, for models with complex and multiple demographic events, the likelihood is often difficult or even impossible to compute directly. Instead, ABC methods rely on generating simulated data similar to the observed data and measuring the distance between the simulated and real datasets. Polymorphism data are thus summarized using a set of summary statistics computed on simulated and real data. The model fit is then obtained by matching large sets of simulated statistics with those derived from real data (Beaumont et al., Reference Beaumont, Zhang and Balding2002; Csillery et al., Reference Csillery, Francois and Blum2012). The choice of summary statistics being crucial for ABC performance, well-tested and useful sets of summary statistics and strategies for selecting these exist (Csillery et al., Reference Csillery, Francois and Blum2012; Jay et al., Reference Jay, Boitard and Austerlitz2019), with the latest utilizing random forest (RF) methods (Pudlo et al., Reference Pudlo, Marin, Estoup, Cornuet, Gautier and Robert2016; Raynal et al., Reference Raynal, Marin, Pudlo, Ribatet, Robert and Estoup2019).
$P(D | \theta )$
is replaced with an approximate approach. This is because, for models with complex and multiple demographic events, the likelihood is often difficult or even impossible to compute directly. Instead, ABC methods rely on generating simulated data similar to the observed data and measuring the distance between the simulated and real datasets. Polymorphism data are thus summarized using a set of summary statistics computed on simulated and real data. The model fit is then obtained by matching large sets of simulated statistics with those derived from real data (Beaumont et al., Reference Beaumont, Zhang and Balding2002; Csillery et al., Reference Csillery, Francois and Blum2012). The choice of summary statistics being crucial for ABC performance, well-tested and useful sets of summary statistics and strategies for selecting these exist (Csillery et al., Reference Csillery, Francois and Blum2012; Jay et al., Reference Jay, Boitard and Austerlitz2019), with the latest utilizing random forest (RF) methods (Pudlo et al., Reference Pudlo, Marin, Estoup, Cornuet, Gautier and Robert2016; Raynal et al., Reference Raynal, Marin, Pudlo, Ribatet, Robert and Estoup2019).
In addition to classic population genetic (genotypic) statistics, it is now possible to incorporate coalescent statistics into an ABC framework, thus summarizing more accurately the variation of genealogies along the genome. More precisely, for our purpose, coalescent statistics should summarize more accurately the ARG and thus the influence of
 $\rho $
and
$\rho $
and
 $\theta $
on the distribution of SNPs and their LD. It is thus important to choose a large region of the genome with sufficient coalescent trees to capture regions with different
$\theta $
on the distribution of SNPs and their LD. It is thus important to choose a large region of the genome with sufficient coalescent trees to capture regions with different
 $\rho / \theta $
ratios (Strütt et al., Reference Strütt, Sellinger, Glémin, Tellier and Laurent2023). In Table 2, we list a set of statistics that we consider particularly useful for eco–evo questions discussed here, together with their main signals. The main advantage of ABC is that it can allow for the simulation of precise eco–evo scenarios, meaning to gain insight into possible causal relationships between changes percolating across the community. For example, one can draw simultaneous inference of the parameter of coevolution between hosts and their parasites based on ad hoc mathematical models (Märkle & Tellier, Reference Märkle and Tellier2020; Nuismer & Week, Reference Nuismer and Week2019; Nuismer et al., Reference Nuismer, Week and Harmon2022; Tellier et al., Reference Tellier, Moreno-Gámez and Stephan2014; Živković et al., Reference Živković, John, Verin, Stephan and Tellier2019). We suggest developing ABC based on 1) genome-wide polymorphism statistics to decipher the co-demographic history of hosts and their parasites (Živković et al., Reference Živković, John, Verin, Stephan and Tellier2019) and 2) gene-specific statistics to uncover genes underpinning host–parasite interactions (Märkle et al., Reference Märkle, John, Metzger, Ansari, Pedergnana and Tellier2024; Märkle & Tellier, Reference Märkle and Tellier2020). While the mentioned ABC methods focus on pairs of interacting species, the ABC framework can, in principle, accommodate multi-species community-level mathematical and stochastic models and the resulting large set of statistics across species. The flexibility of the ABC framework and especially the model-choice step can be used to test for the occurrence of co-demographic history, co-changes in population structure or co-evolution in life-history traits (e.g., sweepstake reproduction in parasites) for specific models of interactions (accounting for trophic network, parasitism, commensalism and mutualism). Using the relevant co-demographic and co-evolutionary histories as a baseline for the genomic background, a second round of ABC analysis can then focus on deciphering the genes underpinning parasitic or mutualistic interactions across pairs (or perhaps triplets) or species.
$\rho / \theta $
ratios (Strütt et al., Reference Strütt, Sellinger, Glémin, Tellier and Laurent2023). In Table 2, we list a set of statistics that we consider particularly useful for eco–evo questions discussed here, together with their main signals. The main advantage of ABC is that it can allow for the simulation of precise eco–evo scenarios, meaning to gain insight into possible causal relationships between changes percolating across the community. For example, one can draw simultaneous inference of the parameter of coevolution between hosts and their parasites based on ad hoc mathematical models (Märkle & Tellier, Reference Märkle and Tellier2020; Nuismer & Week, Reference Nuismer and Week2019; Nuismer et al., Reference Nuismer, Week and Harmon2022; Tellier et al., Reference Tellier, Moreno-Gámez and Stephan2014; Živković et al., Reference Živković, John, Verin, Stephan and Tellier2019). We suggest developing ABC based on 1) genome-wide polymorphism statistics to decipher the co-demographic history of hosts and their parasites (Živković et al., Reference Živković, John, Verin, Stephan and Tellier2019) and 2) gene-specific statistics to uncover genes underpinning host–parasite interactions (Märkle et al., Reference Märkle, John, Metzger, Ansari, Pedergnana and Tellier2024; Märkle & Tellier, Reference Märkle and Tellier2020). While the mentioned ABC methods focus on pairs of interacting species, the ABC framework can, in principle, accommodate multi-species community-level mathematical and stochastic models and the resulting large set of statistics across species. The flexibility of the ABC framework and especially the model-choice step can be used to test for the occurrence of co-demographic history, co-changes in population structure or co-evolution in life-history traits (e.g., sweepstake reproduction in parasites) for specific models of interactions (accounting for trophic network, parasitism, commensalism and mutualism). Using the relevant co-demographic and co-evolutionary histories as a baseline for the genomic background, a second round of ABC analysis can then focus on deciphering the genes underpinning parasitic or mutualistic interactions across pairs (or perhaps triplets) or species.
Overview of genome-wide and per gene statistics that can be used for ABC inference of co-demographic or co-evolutionary history in a multi-species system, assuming samples from different species containing numerous genomic windows of fixed size spread across the genomes (e.g., Jay et al., Reference Jay, Boitard and Austerlitz2019; Märkle & Tellier, Reference Märkle and Tellier2020; Pudlo et al., Reference Pudlo, Marin, Estoup, Cornuet, Gautier and Robert2016; Raynal et al., Reference Raynal, Marin, Pudlo, Ribatet, Robert and Estoup2019)

3.3. Inference with deep learning
New developments in the field of deep learning have opened the way for novel inference using many samples and inference of the TMRCA of a sample along the genome (e.g., Korfmann et al., Reference Korfmann, Sellinger, Freund, Fumagalli and Tellier2024a, Reference Korfmann, Pope, Meleghy, Tellier and Kern2026; Speidel et al., Reference Speidel, Forest, Shi and Myers2019). Deep learning methods for population genomics inference (reviewed in Korfmann et al., Reference Korfmann, Gaggiotti and Fumagalli2023) can be trained on genotypic data (convolutional neural networks; CNNs; Sanchez et al., Reference Sanchez, Cury, Charpiat and Jay2021; Sheehan et al., Reference Sheehan, Harris and Song2013), on an empirical transition matrix built using the statistics
 $\theta _W$
(Watterson’s estimator) as a proxy for the TMRCA (Korfmann et al., Reference Korfmann, Zauchner, Huo, Grünke, Wang, Tellier and Arunkumar2024b) or directly on the inferred coalescent trees (Korfmann et al., Reference Korfmann, Sellinger, Freund, Fumagalli and Tellier2024a). A pioneering study used a combination of CNN and ABC based on restriction-site associated DNA sequencing (RADseq) revealed the common demographic response to environmental changes of two angiosperm and three insect Eurasian steppe species (Kirschner et al., Reference Kirschner, Perez, Záveská, Sanmartín, Marquer, Schlick-Steiner, Alvarez, Arthofer, Frajman, Gamisch, Hilpold, Paun, Trucchi, Steiner and Schönswetter2022). To move beyond correlations and dissect the possible mechanisms underlying common changes in multi-species communities, we suggest expanding deep learning to test and infer co-demographic and co-evolutionary scenarios based directly on distributions (and transition matrices) of TMRCA along the genomes of the studied species. Furthermore, one could in a second step scan the genomes of the different species to reveal gene trees (topology and TMRCA) correlated with environmental responses, and thus pinpoint genes involved in these adaptations. The advantages of the deep learning method are that 1) they can be trained on sets of tested models (Adrion et al., Reference Adrion, Cole, Dukler, Galloway, Gladstein, Gower, Kyriazis, Ragsdale, Tsambos, Baumdicker, Carlson, Cartwright, Durvasula, Gronau, Kim, McKenzie, Messer, Noskova, Ortega-Del Vecchyo and Kern2020) which can be expanded to multi-species systems and 2) these are flexible with regard to sample size and the stochastic noise in the polymorphism data (Korfmann et al., Reference Korfmann, Gaggiotti and Fumagalli2023, Reference Korfmann, Pope, Meleghy, Tellier and Kern2026).
$\theta _W$
(Watterson’s estimator) as a proxy for the TMRCA (Korfmann et al., Reference Korfmann, Zauchner, Huo, Grünke, Wang, Tellier and Arunkumar2024b) or directly on the inferred coalescent trees (Korfmann et al., Reference Korfmann, Sellinger, Freund, Fumagalli and Tellier2024a). A pioneering study used a combination of CNN and ABC based on restriction-site associated DNA sequencing (RADseq) revealed the common demographic response to environmental changes of two angiosperm and three insect Eurasian steppe species (Kirschner et al., Reference Kirschner, Perez, Záveská, Sanmartín, Marquer, Schlick-Steiner, Alvarez, Arthofer, Frajman, Gamisch, Hilpold, Paun, Trucchi, Steiner and Schönswetter2022). To move beyond correlations and dissect the possible mechanisms underlying common changes in multi-species communities, we suggest expanding deep learning to test and infer co-demographic and co-evolutionary scenarios based directly on distributions (and transition matrices) of TMRCA along the genomes of the studied species. Furthermore, one could in a second step scan the genomes of the different species to reveal gene trees (topology and TMRCA) correlated with environmental responses, and thus pinpoint genes involved in these adaptations. The advantages of the deep learning method are that 1) they can be trained on sets of tested models (Adrion et al., Reference Adrion, Cole, Dukler, Galloway, Gladstein, Gower, Kyriazis, Ragsdale, Tsambos, Baumdicker, Carlson, Cartwright, Durvasula, Gronau, Kim, McKenzie, Messer, Noskova, Ortega-Del Vecchyo and Kern2020) which can be expanded to multi-species systems and 2) these are flexible with regard to sample size and the stochastic noise in the polymorphism data (Korfmann et al., Reference Korfmann, Gaggiotti and Fumagalli2023, Reference Korfmann, Pope, Meleghy, Tellier and Kern2026).
3.4. Additional markers may increase the inference accuracy
With the advances in full genome sequencing, especially long read sequencing, it has become feasible to integrate several types of genetic (SNPs) and epigenetic (DNA methylation) markers for evolutionary inference (Korfmann et al., Reference Korfmann, Zauchner, Huo, Grünke, Wang, Tellier and Arunkumar2024b; Sellinger et al., Reference Sellinger, Johannes and Tellier2024). In principle, other markers, such as microsatellites and indels, can also be added (Ignatieva et al., Reference Ignatieva, Favero, Koskela, Sant and Myers2025). As these markers exhibit a wide range of mutation rates, the resolution of past inference would be improved across a larger time span than can be done based on SNPs alone (Sellinger et al., Reference Sellinger, Johannes and Tellier2024). ABC and deep learning methods are well-suited to integrate additional markers to infer changes in ecological life-history traits based on an empirical transition matrix or inference of the coalescent trees. An additional advantage of ABC and deep learning is the possible integration of several types of samples, for example, temporal data obtained from ancient DNA or museum samples, which can be integrated in the coalescent simulations and training set. Integrating such heterogeneous datasets in time is challenging but would be expected to enhance the resolution of the transition matrix and of the inference of co-demographic and co-evolutionary history. Such data provide time sample series with known dating and are thus useful in tracking genetic changes and allele frequencies in host and parasite populations (Živković et al., Reference Živković, John, Verin, Stephan and Tellier2019). The analyses we highlight would open the fascinating insights into how ecological and evolutionary mechanisms feedback with the environment to drive adaptive changes across interacting species. The inference of changes in ecological life-history traits and their timing across several species of a given community, and across trophic levels, can then be linked to environmental changes to understand how species networks change in time.
3.5. Limitations of inference methods
Nonetheless, we wish to finish with a word of caution on the expected difficulty in conducting and interpreting such inferences. First, such inference can only point out the possible co-occurrence of events, even when using ABC or deep learning model test, but cannot prove the ultimate causation between events. Second, like any statistical inference method, they yield confidence intervals in their estimates (of
 $N_e$
and of the timing of events; Bansal & Nichols, Reference Bansal and Nichols2025; Hilgers et al., Reference Hilgers, Liu, Jensen, Brown, Cousins, Schweiger, Guschanski and Hiller2025), which should be carefully interpreted when compared to estimates from past climatic conditions (and past niche modelling predictions). Third, several changes in life-history traits as well as demographic events can yield similar effects (or compensate one another) on the genomic polymorphism data, so that non-identifiability of complex past events may remain a challenge despite the wealth of new data. In other words, polymorphism data exhibit unusual clustering patterns of mutation (SNPs) and recombination events along the genome upon a change of the ratio
$N_e$
and of the timing of events; Bansal & Nichols, Reference Bansal and Nichols2025; Hilgers et al., Reference Hilgers, Liu, Jensen, Brown, Cousins, Schweiger, Guschanski and Hiller2025), which should be carefully interpreted when compared to estimates from past climatic conditions (and past niche modelling predictions). Third, several changes in life-history traits as well as demographic events can yield similar effects (or compensate one another) on the genomic polymorphism data, so that non-identifiability of complex past events may remain a challenge despite the wealth of new data. In other words, polymorphism data exhibit unusual clustering patterns of mutation (SNPs) and recombination events along the genome upon a change of the ratio
 $\rho / \theta $
in time (Strütt et al., Reference Strütt, Sellinger, Glémin, Tellier and Laurent2023). Such structuring in the transition matrix can also be due to changes in the ancestral population spatial structure (Cousins et al., Reference Cousins, Scally and Durbin2025; Nieto et al., Reference Nieto, Lao and Mona2025), which can yield wrong interpretation of the introgression patterns between species (Chikhi et al., Reference Chikhi, Rodrıguez, Grusea, Santos, Boitard and Mazet2018; Tournebize & Chikhi, Reference Tournebize and Chikhi2025). Additional work is thus needed to disentangle between confounding factors in the estimation of
$\rho / \theta $
in time (Strütt et al., Reference Strütt, Sellinger, Glémin, Tellier and Laurent2023). Such structuring in the transition matrix can also be due to changes in the ancestral population spatial structure (Cousins et al., Reference Cousins, Scally and Durbin2025; Nieto et al., Reference Nieto, Lao and Mona2025), which can yield wrong interpretation of the introgression patterns between species (Chikhi et al., Reference Chikhi, Rodrıguez, Grusea, Santos, Boitard and Mazet2018; Tournebize & Chikhi, Reference Tournebize and Chikhi2025). Additional work is thus needed to disentangle between confounding factors in the estimation of
 $N_e$
in time. We suggest, for example, to combine statistics based on the transition matrix with other classic population genetics statistics (Table 2) using the ABC or deep learning framework, which may prove more powerful than the SMC and IICR methods for in-depth analysis of co-demographic and co-evolutionary scenarios. Finally, we caution about the influence of selection in the genome on the accuracy and outcome of inference. Indeed, background selection (due to linkage with sites under purifying selection) as well as hitch-hiking and genetic draft (due to linkage with sites under positive selection) do affect the accuracy of past demographic inference (Daigle & Johri, Reference Daigle and Johri2025; Hilgers et al., Reference Hilgers, Liu, Jensen, Brown, Cousins, Schweiger, Guschanski and Hiller2025; Johri et al., Reference Johri, Aquadro, Beaumont, Charlesworth, Excoffier, Eyre-Walker, Keightley, Lynch, McVean, Payseur, Pfeifer, Stephan and Jensen2022; Soni et al., Reference Soni, Johri and Jensen2023, Reference Soni, Pfeifer and Jensen2024). We note that the effect of linked selection on inference accuracy does change depending on the considered life-history trait and its influence on the ratio
$N_e$
in time. We suggest, for example, to combine statistics based on the transition matrix with other classic population genetics statistics (Table 2) using the ABC or deep learning framework, which may prove more powerful than the SMC and IICR methods for in-depth analysis of co-demographic and co-evolutionary scenarios. Finally, we caution about the influence of selection in the genome on the accuracy and outcome of inference. Indeed, background selection (due to linkage with sites under purifying selection) as well as hitch-hiking and genetic draft (due to linkage with sites under positive selection) do affect the accuracy of past demographic inference (Daigle & Johri, Reference Daigle and Johri2025; Hilgers et al., Reference Hilgers, Liu, Jensen, Brown, Cousins, Schweiger, Guschanski and Hiller2025; Johri et al., Reference Johri, Aquadro, Beaumont, Charlesworth, Excoffier, Eyre-Walker, Keightley, Lynch, McVean, Payseur, Pfeifer, Stephan and Jensen2022; Soni et al., Reference Soni, Johri and Jensen2023, Reference Soni, Pfeifer and Jensen2024). We note that the effect of linked selection on inference accuracy does change depending on the considered life-history trait and its influence on the ratio
 $\rho / \theta $
. For example, on the one hand, dormancy is expected to decrease linkage effects around sites under selection (yielding weaker background selection and genetic draft; Živković & Tellier, Reference Živković and Tellier2018). On the other hand, selfing enhances the effect of linked selection (Roze, Reference Roze2016), thus likely decreasing the accuracy of past demographic inference (Daigle & Johri, Reference Daigle and Johri2025; Strütt et al., Reference Strütt, Sellinger, Glémin, Tellier and Laurent2023). The results of inference of co-demographic and co-evolutionary histories need to be critically evaluated using regions with various recombination and mutation rates, especially in communities or assemblages containing species with different life-history traits, generation times and genomic characteristics (genome size, gene density and proportion of transposable elements).
$\rho / \theta $
. For example, on the one hand, dormancy is expected to decrease linkage effects around sites under selection (yielding weaker background selection and genetic draft; Živković & Tellier, Reference Živković and Tellier2018). On the other hand, selfing enhances the effect of linked selection (Roze, Reference Roze2016), thus likely decreasing the accuracy of past demographic inference (Daigle & Johri, Reference Daigle and Johri2025; Strütt et al., Reference Strütt, Sellinger, Glémin, Tellier and Laurent2023). The results of inference of co-demographic and co-evolutionary histories need to be critically evaluated using regions with various recombination and mutation rates, especially in communities or assemblages containing species with different life-history traits, generation times and genomic characteristics (genome size, gene density and proportion of transposable elements).
4. Conclusions
The developed research avenues are key to fully develop an explanatory and predictive science of conservation biology at the scale of individual species and species networks/communities in times of global changes (climatic, landscape and habitat). The first consequence is that we are now able to better understand changes in ecological and life-history traits in the past and their correlation with past climatic events; thus demonstrating the tight feedback loop between changes at the evolutionary and ecological levels, and their consequences on genome evolution. The second consequence is that we can also infer ecological and life-history traits predominantly affecting genome evolution of species and thus better predict species’ adaptive potential in the face of climate change and habitat fragmentation. The third consequence is to extend our framework to community genomics perspectives (host–pathogens, host–mutualists, species communities and trophic networks). The type of approach we suggest to develop is still in its infancy, and further developments will require inter-disciplinary collaborations between plant ecologists, evolutionary biologists, population geneticists, mathematicians and statisticians to embrace the complexity of the causes and consequences of eco–evo feedback at the genome level.
Acknowledgments
The authors thank two reviewers for their useful and insightful comments.
Competing interests
The authors do not declare any competing interests. The authors did not use any AI tools in the writing of this manuscript.
Data availability statement
The code used to generate Figure 2 has been archived on GitHub: https://github.com/Luker121/life-history-traits-review-qpb.
Author contributions
L.M. and A.T. prepared the initial draft, which was subsequently revised and improved by T.S. and D.A.-A.
Funding statement
A.T. acknowledges funding from the German Research Foundation (Deutsche Forschungsgemeinschaft) grant numbers 317616126, 254587930 and 447121532. D.A.-A. benefited from funding by the Alexander von Humboldt Stiftung and the TUM Fellowship Foundation.
Supplementary material
To view supplementary material for this article, please visit http://doi.org/10.1017/qpb.2026.10046.

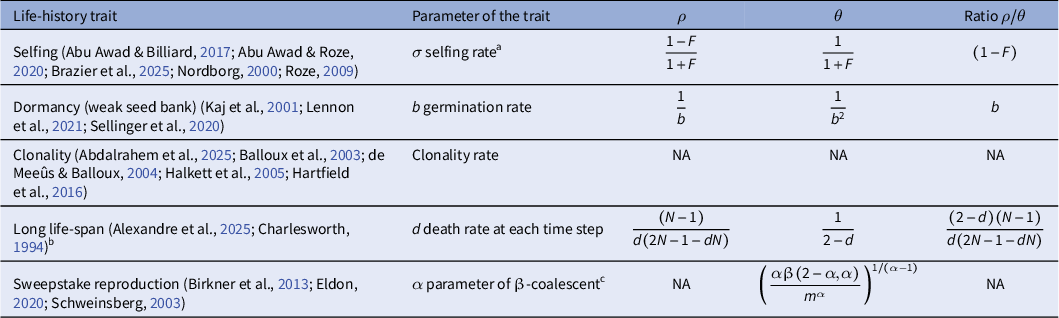


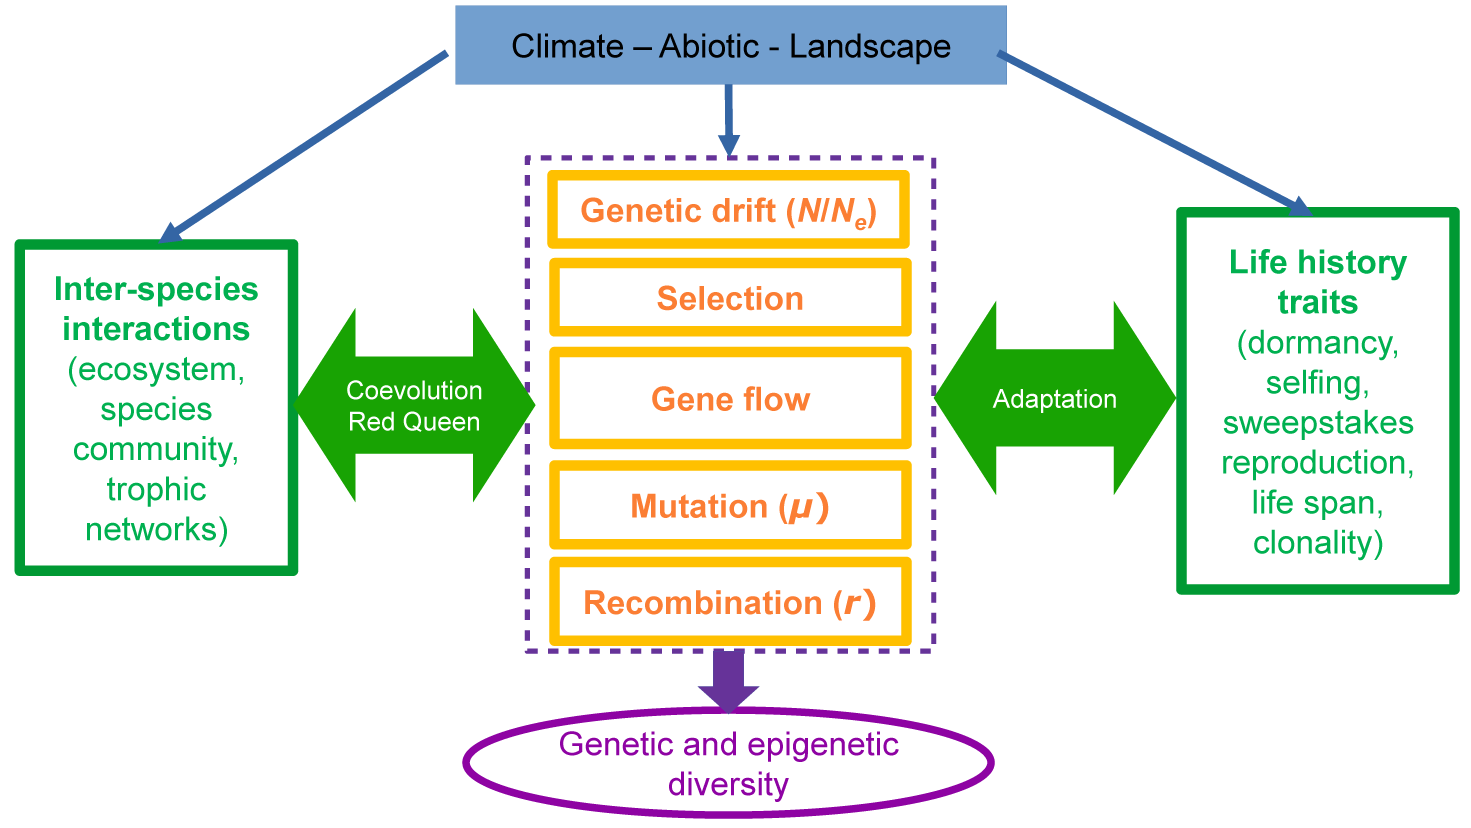
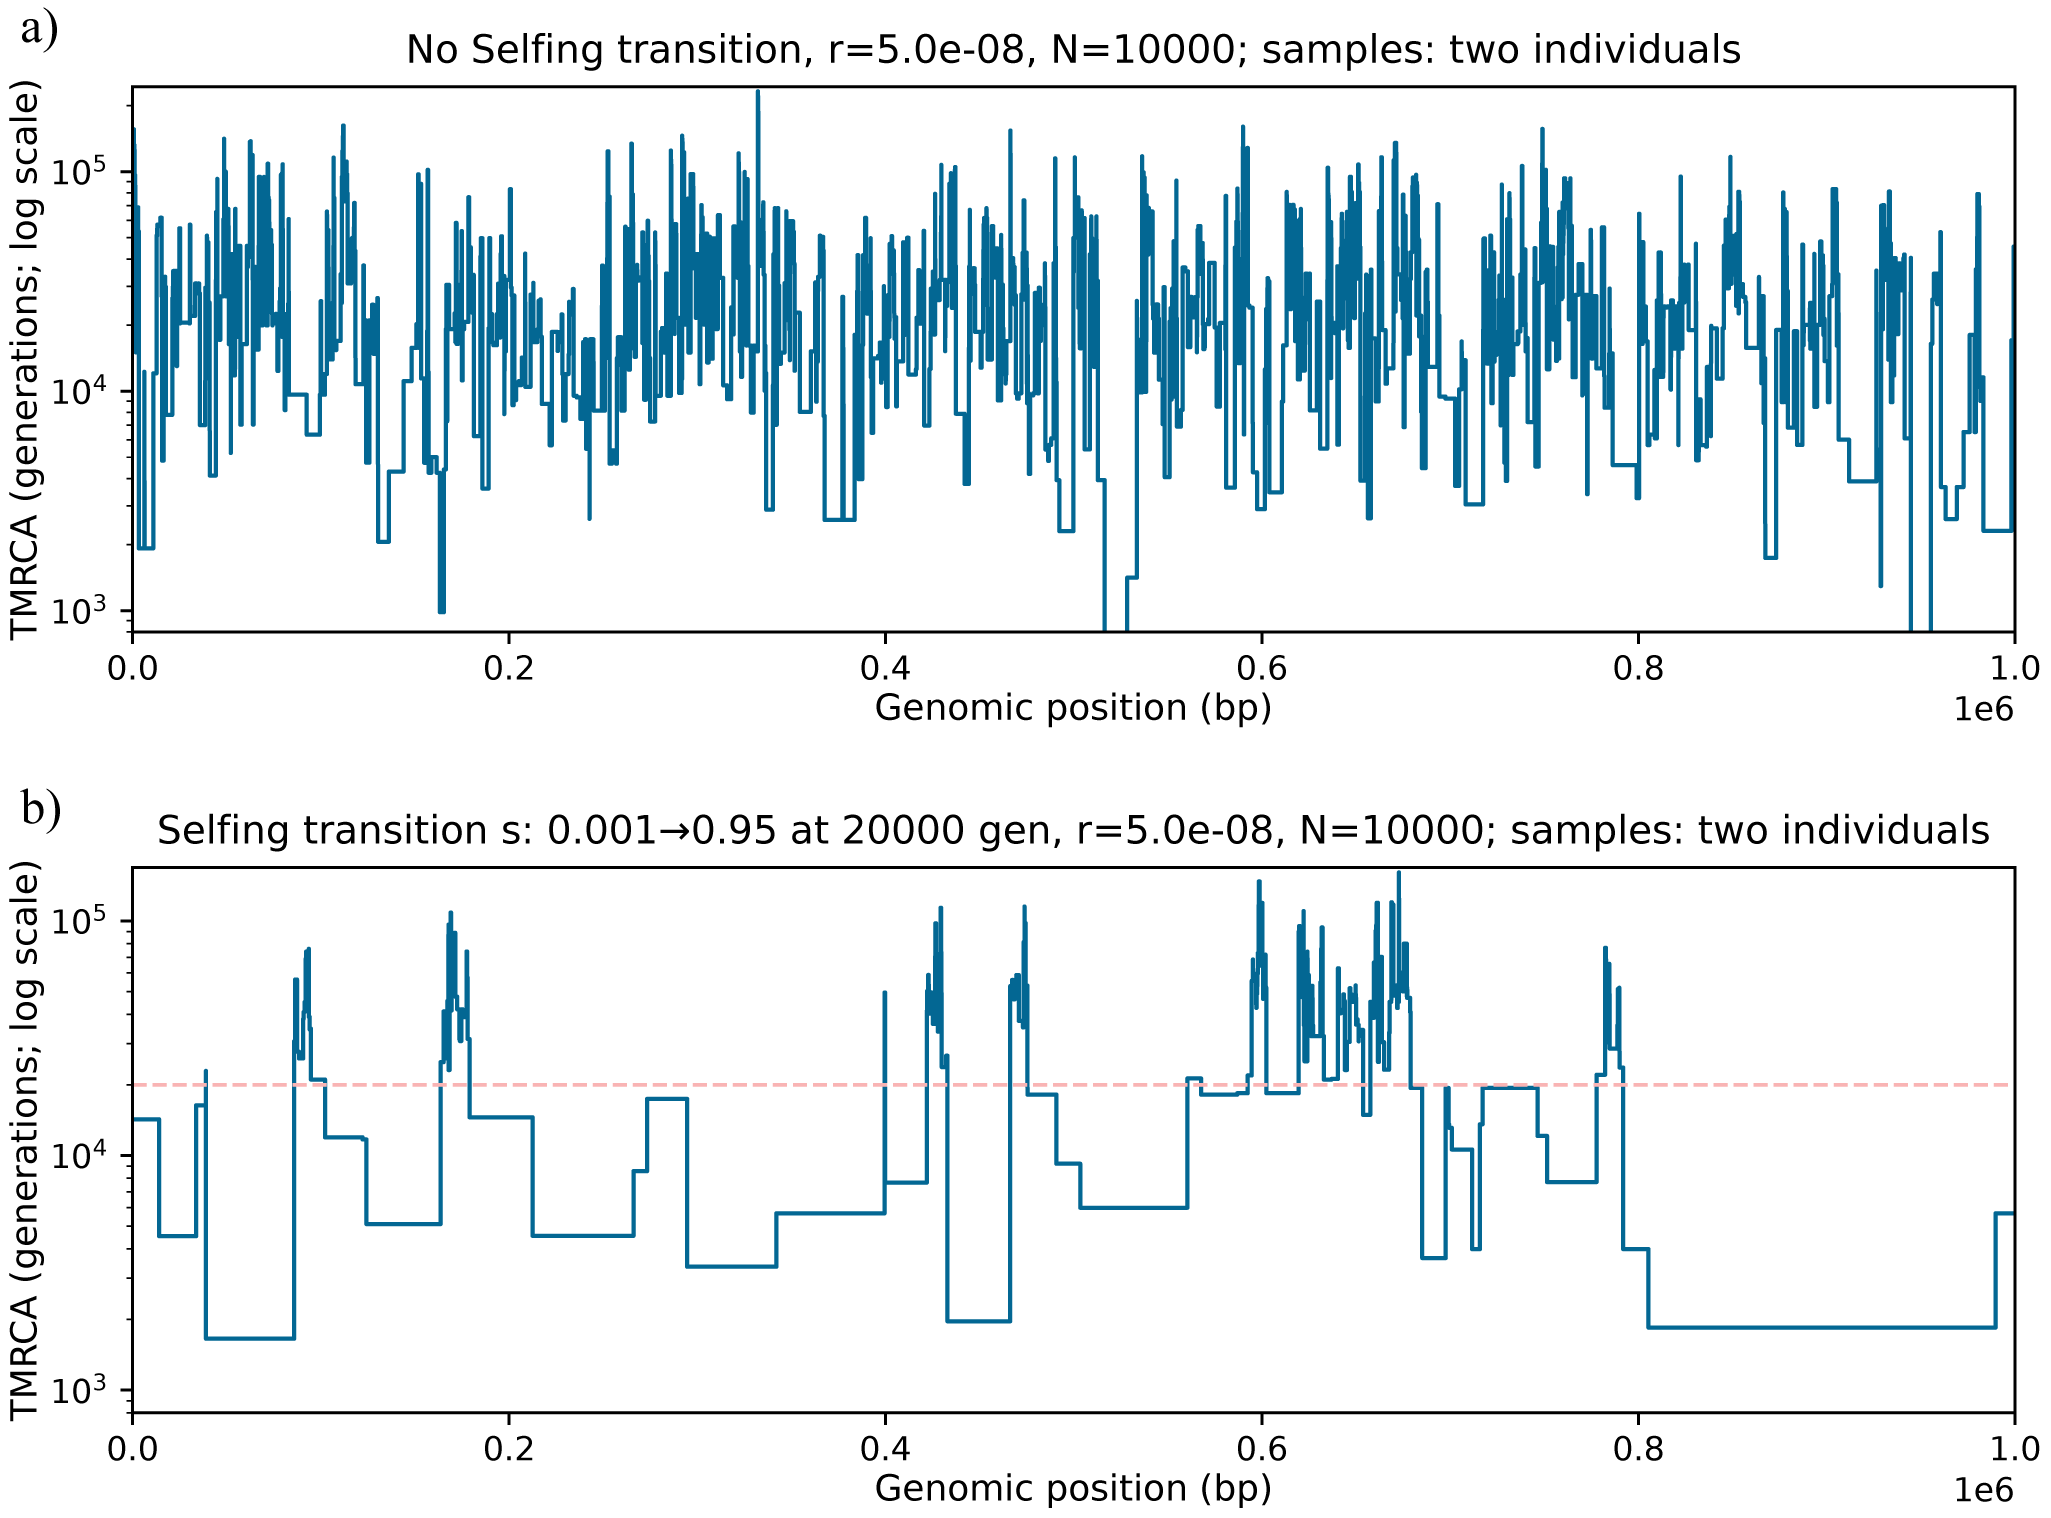


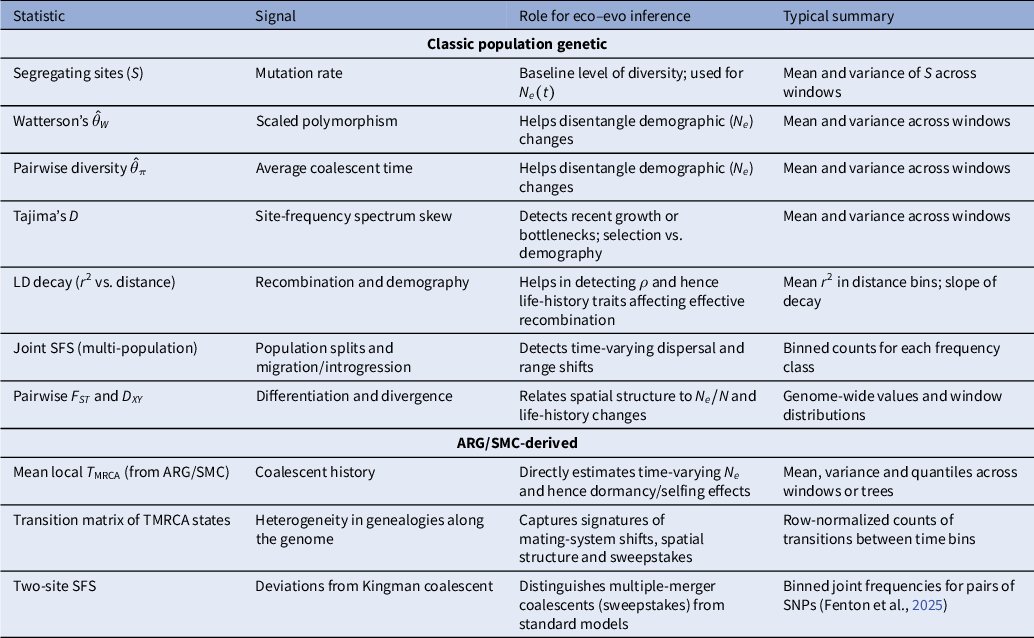


 Open access
Comments
Dear Editorial board of QPB,
We are pleased to submit a thought-provoking review and perspective on the topic of using genome inference methods in population genetics to infer the evolution of plant life-history traits at short time scales.
We believe the field of plant ecology and conservation needs to assess the impact of changes in plant life-history traits more thoroughly to predict changes in plant populations due to climate change.
Thank you for considering our manuscript,
Sincerely,
Prof Aurelien Tellier