

Although both the Infectious Diseases Society of America and the Society for Healthcare Epidemiology of America still recommend contact precautions (CP) to decrease the transmission of methicillin-resistant Staphylococcus aureus (MRSA) and vancomycin-resistant Enterococcus (VRE) in acute-care hospitals, recent data have indicated a need to question whether this should remain the standard of care.Reference Calfee, Salgado and Milstone 1 – Reference McKinnell, Eells and Clark 8
Several institutions have eliminated routine CP for MRSA and VRE; instead, they solely employ horizontal infection prevention strategies to decrease spread of resistant organisms, such as improved hand hygiene and targeted or universal decolonization with products like chlorhexidine gluconate (CHG).Reference Morgan, Murthy and Munoz-Price 3 , Reference Martin, Russell and Rubin 6 – Reference McKinnell, Eells and Clark 8 Three studies specifically looking at infectious outcomes of removing routine CP have reported no increase in infectious complications, such as device-associated infections, MRSA acquisitions, MRSA environmental contamination, and healthcare-associated infections with MRSA and/or VRE.Reference Martin, Russell and Rubin 6 – Reference McKinnell, Eells and Clark 8 Although some data support CP in combination with other horizontal strategies, data on gowns and gloves alone are lacking.Reference Morgan, Murthy and Munoz-Price 3 , Reference Bearman, Marra and Sessler 9 – Reference De Angelis, Cataldo and De Waure 20
Multiple studies have shown potential patient harms associated with the use of CP, including increased preventable adverse events, such as falls, pressure ulcers, medication administration errors, and deep vein thrombosis.Reference Stelfox, Bates and Redelmeier 21 – Reference Reed, Ferguson and Peng 23 CP have also been associated with fewer healthcare provider visits, shorter healthcare provider contact time, and lack of appropriate documentation.Reference Stelfox, Bates and Redelmeier 21 , Reference Dashiell-Earp, Bell, Ang and Uslan 24 – Reference Saint, Higgins, Nallamothu and Chenoweth 28 These patients can experience delays in admission from the emergency room, delays in discharge to skilled nursing facilities, and increased hospital length of stay.Reference Stelfox, Bates and Redelmeier 21 , Reference Gilligan, Quirke, Winder and Humphreys 29 – Reference Tran, Bell and Stall 32 Patients under CP also exhibited increased anxiety, increased depression, and lower satisfaction compared to patients not in isolation.Reference Stelfox, Bates and Redelmeier 21 , Reference Day, Morgan, Himelhoch, Young and Perencevich 33 , Reference Mehrotra, Croft and Day 34 Although the patient harms data are concerning, newer studies have revealed conflicting results. Another 2 recent studies found no increase in adverse events in patients on CP; such results have fostered ongoing uncertainty about the impact of CP on hospital adverse events.Reference Croft, Liquori and Ladd 35 , Reference Croft, Harris and Pineles 36
The University of California–Los Angeles (UCLA) Health eliminated routine CP for endemic MRSA and VRE in 2014. Researchers there published a quasi-experimental study evaluating the impact of discontinuing CP for these organisms on healthcare-associated infections with MRSA and VRE.Reference Martin, Russell and Rubin 6 Endemic was defined as a nonoutbreak setting, with stable baseline rates of MRSA (0.43 laboratory-identified clinical cultures per 100 admissions) and VRE (0.62 clinical cultures per 100 admissions). The study showed no increase in MRSA or VRE laboratory-identified clinical cultures, colonization, or rates of drug resistance, as well as significant savings in healthcare worker time and $643,776 per year on materials.
The purpose of the present study was to determine the impact of discontinuing routine CP for endemic MRSA and VRE on infectious and noninfectious adverse events.
METHODS
Hospital Setting
This study was conducted at the Ronald Reagan UCLA Medical Center (RRUCLA), a 540-bed, tertiary-care, academic hospital with 154 intensive care unit (ICU) beds, a large transplant population, and a level 1 trauma center. All rooms are single occupancy and have alcohol-based hand rubs and sinks for hand hygiene. Contact precaution (CP) rooms are additionally equipped with signage, isolation gowns, and gloves.
Study Design
We performed a retrospective, nonrandomized, observational, quasi-experimental study comparing infectious and noninfectious adverse events at RRUCLA. The preintervention period was from June 1, 2013, to May 31, 2014, and the postintervention period was from July 1, 2014, to June 30, 2015. Routine CP were discontinued on July 1, 2014 for endemic MRSA and VRE, including infection, colonization, and prior history of MRSA and/or VRE.Reference Martin, Russell and Rubin 6 Chlorhexidine gluconate (CHG) bathing had been required in ICUs since 2012, except in the neonatal ICU. Daily 2% CHG bathing was expanded throughout the preintervention period to eventually include all patients by May 2014, except neonates and perinatal patients. Compliance with CHG bathing was documented in the medical record and was regularly audited. Adverse events data were collected for both periods. The calendar month of June 2014 was excluded from evaluation given that the new isolation policy changes were implemented during this month and CP was less consistent, making the data from this month less reliable.
Adverse event data were collected retrospectively from 4 database sources: the Center for Medicare & Medicaid Service Hospital Acquired Conditions (HAC), Agency for Healthcare Research and Quality Patient Safety Indicators (PSI), National Healthcare Safety Network (NHSN), and the internal UCLA adverse-events reporting system. 37 – 39 Prior to data extraction and analysis, our team reviewed all routinely reported adverse event categories in these databases and selected event types most likely to be impacted by lack of contact with healthcare providers. Adverse events deemed independent of provider contact time were excluded (Table 1). Noninfectious adverse events included falls and trauma, postoperative hemorrhage and/or hematoma, postoperative respiratory failure, wound dehiscence, pressure ulcer, and pulmonary embolism (PE) and/or DVT. Infectious adverse events included hospital onset Clostridium difficile infection (CDI), catheter-associated urinary tract infection (CAUTI), central-line–associated bloodstream infection (CLABSI), postoperative sepsis, surgical site infection (SSI), and ventilator-associated pneumonia (VAP). Table 1 describes the source of each adverse event. If data could be collected from >1 source, the data were aggregated, and duplicate events were removed. Adverse events were defined and collected according to the standardized definitions provided by each agency prior to the study for regulatory reporting purposes by hospital employees. The date used for inclusion in either the preintervention or postintervention period was the exact event date entered into the database, or if not available, the date of discharge. There were no major changes in collection methodology or reporting during the study period, except CAUTI which excluded yeast and colony counts less than 100,000 in 2015.
Sources of Adverse Event DataFootnote a
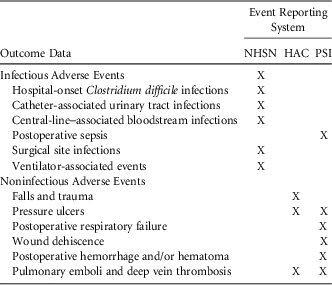
NOTE. NHSN, National Healthcare Safety Network; HAC, hospital-acquired conditions; PSI, patient safety indicators.
a An internal reporting system checked for all listed events if not otherwise reported to one of these agencies. Given the differences in reporting definitions, all events found in each system were included. If data could be collected from >1 source, data from all sources were included and duplicates of the same event were removed. Excluded conditions: accidental puncture or laceration, air embolism, birth trauma, blood incompatibility, death rate among surgical inpatients with serious treatable complications, death rate in low-mortality diagnosis related groups, foreign object retained after surgery, iatrogenic pneumothorax, manifestations of poor glycemic control, obstetric trauma rate, postoperative acute kidney injury requiring dialysis rate, transfusion reaction rate.
This study was deemed exempt by the UCLA Institutional Review Board as nonhuman subject research given that the data were collected for quality improvement purposes prior to the study.
Each adverse event was associated with an isolation type, either “MRSA and/or VRE,” “other isolation” (ie, multidrug-resistant Acinetobacter, carbapenem-resistant Enterobacteriaceae, aminoglycoside-resistant Pseudomonas, and CDI), “combination” (ie, other isolation + MRSA/VRE), and “no isolation.” Additional isolation statuses, including droplet, airborne, or syndromic indications for isolation, were not evaluated in this study. The data regarding isolation status were collected from the electronic health record. In the postintervention period, patients were not isolated for MRSA/VRE, so they did not have an electronic isolation alert. Instead, investigators applied previous criteria for MRSA/VRE isolation (history of MRSA/VRE alerts in the electronic health record in the previous 5 years, positive MRSA/VRE screening culture or clinical culture in the previous 2 years) to determine who would have previously qualified for isolation. A chart review was performed to collect demographic and hospitalization-specific data for patients with an adverse event.
Statistical Analysis
Patient characteristics for those who experienced infectious or noninfectious adverse events were summarized preintervention and postintervention (ie, before and after CP discontinuation) using means for continuous variables and frequencies (%) for categorical variables (Table 2).
Demographics of Patients With an Adverse Event
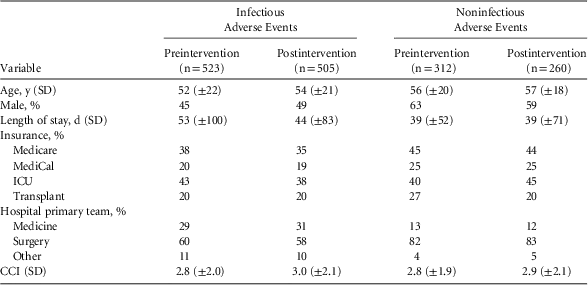
NOTE. SD, standard deviation; MediCal, California Medicaid; CCI, Charlson comorbidity index.
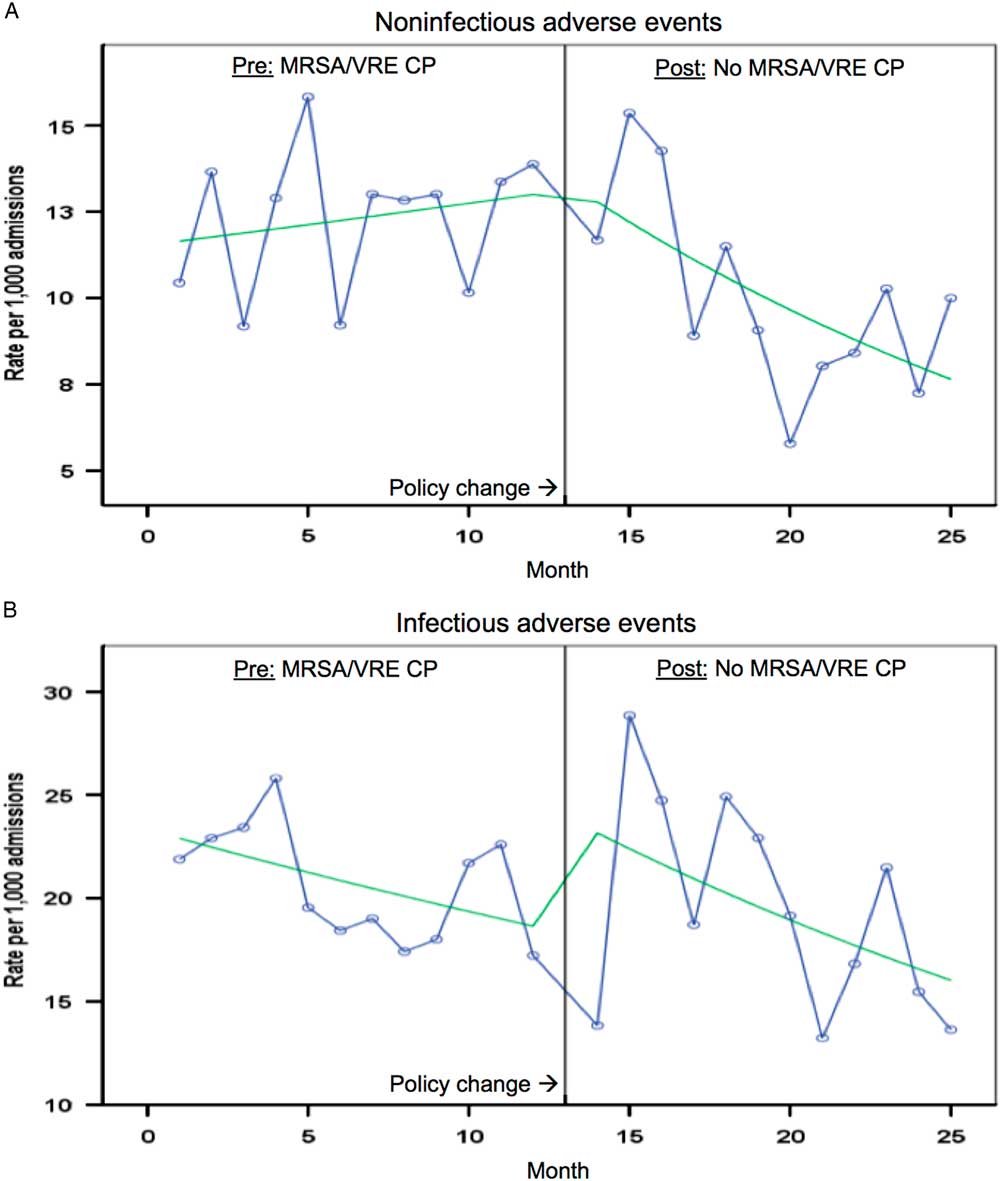
We assessed the effect of a policy change in which CP was discontinued on adverse events using 2 approaches. First, we tested for overall differences in adverse event rates preintervention and postintervention using Poisson regression models by including only a preintervention and postintervention predictor variable (Tables 3 and 4). We then ran longitudinal Poisson models considering monthly trends in adverse event incidence to test for immediate effects of the intervention as well as compute slope differences preintervention and postintervention. This analysis was carried out using interrupted time series analysis (segmented regression analysis) as described by Wagner et al.Reference Wagner, Soumerai, Zhang and Ross-Degnan 40 Specifically, we used Poisson mixed-effects models with the outcome as the adverse event of interest and predictor terms for the baseline trend, level change after the intervention, trend change after intervention, and a patient random effect. The rates are reported per 1,000 admissions unless otherwise noted. Statistical summaries (incidence rate ratios, 95% confidence intervals, P values) and figures from these models are presented in Figures 1 and 2 and Tables 3 and 4.
Monthly rates of infectious and noninfectious adverse events before and after contact precautions were discontinued for methicillin-resistant Staphylococcus aureus (MRSA) and vancomycin-resistant Enterococcus (VRE). NOTE. CP, contact precautions; pre, with contact precautions for both MRSA and VRE; post, no contact precautions for MRSA or VRE; trend lines, slopes of the monthly incidence rate ratios for the preintervention and postintervention periods, as well as the change point for immediate effect.
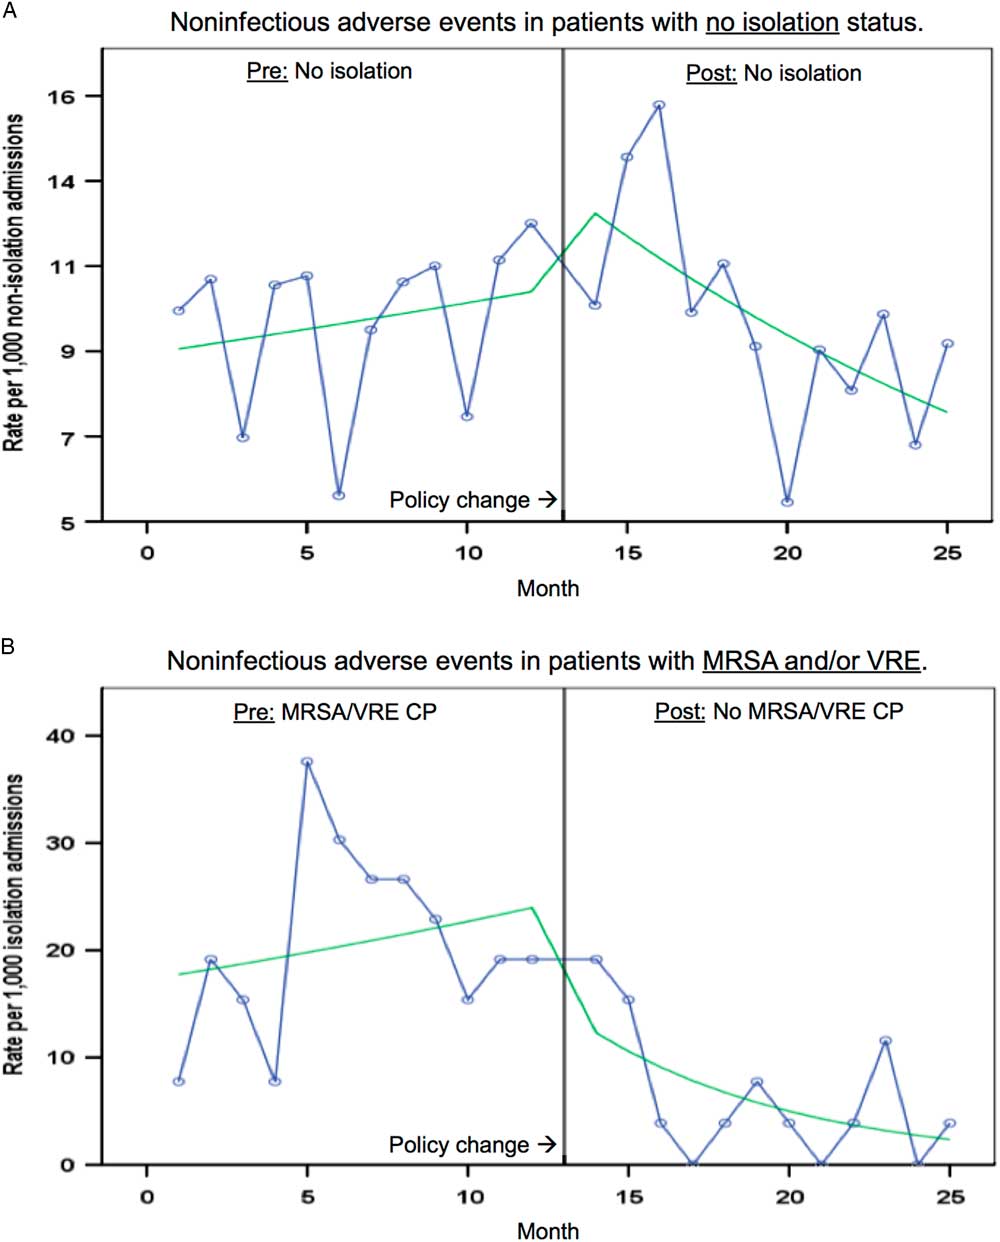
Comparison of isolation status and rate of noninfectious adverse events. NOTE. CP, contact precautions; pre, with contact precautions for both methicillin-resistant Staphylococcus aureus (MRSA) and vancomycin-resistant Enterococcus (VRE); post, no contact precautions for MRSA or VRE; trend lines, slopes of the monthly incidence rate ratios for the preintervention and postintervention periods, as well as the change point for immediate effect; MRSA/VRE, 12% of admissions; non–MRSA/VRE, 88% of admissions. Denominators: (A) based on admissions with no MRSA; (B) based on rate of admission with MRSA/VRE.
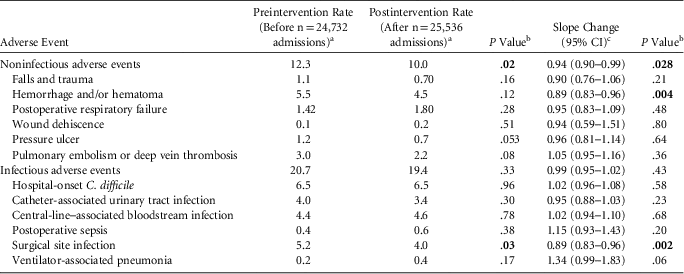
Change in the Rate of Infectious and Noninfectious Adverse Events After the Policy Change
a Rate per 1,000 admissions.
b Bold values are statistically significant.
c Slope change is the incidence rate ratio, shown with 95% confidence interval.
Change in the Rate of Noninfectious Adverse Events After the Policy Change Based on Isolation Status

NOTE. MRSA, methicillin-resistant Staphylococcus aureus; VRE, vancomycin-resistant Enterococcus.
a Rates are noninfectious adverse events per 1,000 admissions.
b MRSA/VRE, 12% of admissions; non-MRSA/VRE, 88% of admissions. These denominators were used to calculate the respective rates.
c Bold values are statistically significant.
d Slope change is the incidence rate ratio (with 95% confidence interval).
Statistical analyses were performed using SAS version 9.4 software (SAS Institute, Cary, NC) and SPSS version 24 software (IBM, Armonk, NY). P values<.05 were considered statistically significant.
RESULTS
Overall, there were 24,732 admissions in the preintervention period and 25,536 admissions in the postintervention period after CP discontinuation. In the preintervention period, ~12% admissions were isolated for MRSA and/or VRE, and the monthly rate remained relatively constant. No patients were isolated for MRSA/VRE in the postintervention period. Overall, 835 adverse events occurred in the preintervention period and 765 adverse events occurred in the postintervention period. The events were divided into infectious and noninfectious adverse events. The demographics of patients with adverse events are displayed in Table 2.
Noninfectious adverse events declined after CP discontinuation from 12.3 to 10.0 events per 1,000 admissions (P=.022), which is a 19% decrease in noninfectious adverse events after 1 year. No statistically significant change in infectious adverse events was detected (20.7 to 19.4 adverse events per 1,000 admissions; P=.33) (Figure 1).
No change in the rate of hospital adverse events was observed after the intervention. The monthly incidence rate ratio for noninfectious adverse events was 1.02 per 1,000 admissions (95% CI, 0.71–1.46; P=.913) and for infectious adverse events, the monthly incidence rate ratio was 1.31 per 1,000 admissions (95% CI, 1.00–1.71; P=.051), indicating no significant change in this rate immediately after CP discontinuation.
The slope change was significant for noninfectious adverse events and demonstrated a decrease in monthly adverse events after the CP change, with an incidence rate ratio of 0.94 adverse events per 1,000 admissions (95% CI, 0.90–0.99; P=.028) (Figure 1). No significant slope change was observed for infectious adverse events, and the monthly incidence rate ratio was 0.99 adverse events per 1,000 admissions (95% CI, 0.95–1.02; P=.43).
Each adverse event in the composite end-point analysis was evaluated individually, accounting for repeated observations in the same person in the model (Table 3). Although we detected trends toward fewer falls and trauma, postoperative hemorrhage and/or hematoma, pressure ulcers, and PE/DVT, these trends were not statistically significant. Even though we observed no change in the rate of overall infectious adverse events, SSI decreased by 24% after CP were discontinued, from 5.2 to 4.0 events per 1,000 admissions (P=.03). We detected a trend toward an increase in CLABSI, postoperative sepsis, and VAP, but these changes were small and did not reach statistical significance.
The slope change was calculated for each adverse event as well. The slope change was significant for postoperative hemorrhage and hematoma, SSI, and it indicated a decline in monthly events after the CP change for both adverse events (Table 3). The slope change was not significant for the remaining adverse events.
No significant rate changes for any individual adverse events were observed, except for hospital onset C. difficile (data not shown). An initial increase in the rate of C. difficile occurred directly after the policy change, with an incidence rate ratio of 1.96 (95% CI, 1.23–3.14; P=.005), but after the initial increase, the rate declined to a level similar to that observed prior to the intervention.
The CP status of each patient with a noninfectious adverse event was evaluated. When comparing patients with MRSA/VRE who were isolated in the preintervention period and not isolated in the postintervention period, a 72% decline was observed in noninfectious adverse events (P<.001) (Figure 2). This rate decline was driven by falls and trauma, postoperative hemorrhage and/or hematoma, and deep vein thrombosis or pulmonary embolism, which exhibited the largest declines in this population. No significant change was observed for nonisolation patients, who remained off CP in both the preintervention and postintervention periods (Table 4). Patients on either “other isolation” or “combination isolation” remained in isolation for both the preintervention and postintervention periods. The sample sizes were small (<2% of admissions), and very few noninfectious adverse events occurred in these groups. Thus, no statistically significant changes in noninfectious adverse events occurred after CP discontinuation (data not shown).
DISCUSSION
Controversy surrounds both the efficacy of and patient harms associated with CP. Recent data suggest that discontinuing routine CP for MRSA and VRE can be performed without increasing healthcare-associated infections with these organisms, but whether removing CP reduces overall patient harms remains unclear.Reference Morgan, Murthy and Munoz-Price 3 , Reference Martin, Russell and Rubin 6 – Reference McKinnell, Eells and Clark 8 This study demonstrated that removing routine CP for MRSA and VRE was associated with a decline in noninfectious adverse events, including falls and trauma, postoperative hemorrhage and/or hematoma, wound dehiscence, pressure ulcers, and PE/DVTs. None of the secondary end points were statistically significant, which is likely due to the low overall rates of the individual events. These data support prior research indicating that the use of CP can be a barrier to access to healthcare providers and that this can impact adverse event rates.
Importantly, the populations with the largest decline in noninfectious adverse events were the patients with MRSA and VRE, who they were no longer isolated during the postintervention period. While this population was isolated, the average rate of noninfectious adverse events was 21.4 per 1,000 MRSA/VRE admissions, and after the policy change, the adverse event rate decreased to 6.08 per 1,000 MRSA/VRE admissions. While an argument could be made that the decline in adverse events was multifactorial and may have been due to other quality-improvement interventions, the large decline in noninfectious adverse events was observed only in the MRSA/VRE population and not in the “no isolation” group. In addition, Figure 2b shows that the decline began shortly after the policy change and that the lower rate remained months after the intervention. Also, no change in the rate was observed in the other isolation statuses, who remained in isolation in the postintervention period, but events in these populations were rare, making this aspect difficult to fully assess.
In our prior study, we showed that MRSA and VRE clinical cultures, as a marker of healthcare-associated infections, did not increase after CP discontinuation and CHG bathing was expanded to all units.Reference Martin, Russell and Rubin 6 This study further demonstrates that other reportable infectious adverse events did not increase after CP were discontinued, including infections with other organisms and device-associated infections. Prior to the collection of these data, there was a theoretical concern that having fewer patients on CP could lead to increases in hospital-acquired infections, but our study results did not show an increase after the policy change. This finding may be due to the other horizontal infection prevention strategies, including near-universal CHG bathing and our high hand hygiene rate (>90%). This study also showed a significant decline in the SSI rate after the policy was changed. The reason for the improvement is unclear, and it may be related to improved access to healthcare providers, decreased microbial burden from expanded CHG bathing, or both. Further research is needed in this area.
While these initial data are encouraging, our study has some limitations. First, this study was performed at a single acute-care hospital with single-patient rooms and a high hand hygiene compliance rate (>90%).Reference Martin, Russell and Rubin 6 Whether these data on infectious adverse events are generalizable to other hospitals with shared patient rooms or a lower hand hygiene rate is unclear. Further research in other hospitals is necessary to determine the additional factors necessary for this new policy to be successful.
Our institution also has a robust quality-control department that is focused on reducing adverse events. Although no specific hospital-wide interventions occurred during this study, it is unclear whether the results are generalizable to other institutions that do not have established programs focused on reducing falls, DVTs, postsurgical adverse events, etc. To see a significant decline in noninfectious adverse events among MRSA/VRE patients, a combination of quality-improvement strategies and removal of CP may be necessary to improve outcomes. Further research in this area should be conducted.
This study was quasi-experimental; therefore, it was not possible to demonstrate causality. Although the data suggest that removing CP and expanding CHG bathing contributed to a decline in noninfectious adverse events, further research is necessary with a more robust study design, such as a prospective, randomized control trial or a cross-over study.
To determine the composite end points, our team reviewed the list of all reportable events and selected the events with a plausible link to healthcare worker contact time. Although our team considered this list thoughtfully, it is unclear how many of these events were truly due to lack of healthcare contact, given that the amount of time each spent with their providers was not evaluated in this study. These events, in general, are all likely multifactorial, and contact with providers is likely just 1 factor.
The data used were also collected for public reporting and not specifically for research or patient care. While these findings may be generalizable to other hospitals that report based on the same definitions, the data were collected based on reporting criteria and may not have captured all actual events. However, this limitation likely impacted both the preintervention and postintervention periods equally because the definitions were relatively constant, except for CAUTI, which was not statistically significant.
To determine which patients would have qualified for MRSA/VRE in the postintervention period, we used specific criteria that would have triggered an isolation alert in the preintervention period. This approach has some limitations. First, it is possible that a patient had history of MRSA/VRE from another hospital that would have been missed in the postintervention period, but this group likely represents only a small portion of the MRSA/VRE population. It is also possible that some VRE patients may have been missed, given that routine screening was no longer performed in the postintervention period (1.3% of patients were VRE screen positive in the preintervention period). However, given the California mandate, MRSA screening was continued in the postintervention period, so our data are likely reasonably accurate. Although incorrect isolation status is a concern, only a small portion of cases would have been affected. Even if patients were missed, the overall rate of noninfectious adverse events did decline.
This study showed that 1 year after discontinuing routine CP for endemic MRSA and VRE and expanding CHG bathing, a significant decline in noninfectious adverse events occurred, with the largest decline in patients who no longer required isolation for MRSA and VRE. Also, no increase in infectious adverse events was observed, including device-associated infections. These data and prior data indicating that the removal of routine CP can be performed without an increase in infectious complications suggest that the removal of MRSA/VRE CP can contribute to improved patient safety and reduction of preventable adverse events.Reference Martin, Russell and Rubin 6 – Reference McKinnell, Eells and Clark 8 More data on the optimal hospital conditions and quality improvement programs are needed to make this intervention successful. Given that CP are likely still necessary for specific populations, strategies to increase contact with healthcare providers and decrease noninfectious adverse events in these patients should be developed.
ACKNOWLEDGMENTS
Financial support: The study was self-funded. No financial support was provided relevant to this article. Statistical collaboration was supported by NIH/National Center for Advancing Translational Science (NCATS) UCLA CTSI (grant no. UL1TR001881).
Potential conflicts of interest: All authors report no conflicts of interest relevant to this article.



