


Introduction
As healthcare seeks to improve patient experience and reduce costs, central venous catheters (CVCs) are increasingly maintained in homes via home infusion therapy. 1 Examples of home infusion therapies include parenteral chemotherapy, Reference Ardura, Bibart and Mayer2,Reference Kelada, Foster and Gagliano3 hydration, parenteral nutrition, outpatient parenteral antimicrobial therapy, Reference Norris, Shrestha and Allison4 intermittent infusions (eg, iron, factor, immunoglobulin, etc), and life-sustaining inotropic therapies. Over three million patients receive home infusion therapy annually in the United States. 1,Reference Kramer, Santaromita and Shelton5 Patients with CVCs in homes are at risk of central line-associated bloodstream infections (CLABSI). Home infusion CLABSI have been estimated to occur at a rate of 0.2–0.24/1000 CVC-days, less than that reported in acute care hospitals. Reference Keller, Hannum and Weems6,7 CLABSI in ambulatory settings have high morbidity and mortality, with 24% of patients presenting to hospitals with CLABSI admitted to an intensive care unit and 11% dying. Reference Ching, Oladapo-Shittu and Hsu8
Evidence-based guidelines for CLABSI prevention are well-established and routinely implemented in acute care, Reference Yokoe, Advani and Anderson9,Reference Buetti, Marschall and Drees10 but the dramatically different environment of the home presents unique challenges. While many hospital-based prevention strategies may not translate effectively to homes due to these differences, Reference Buetti, Marschall and Drees10,Reference Huang, Singh and McKinnell11 one approach that has proven essential across healthcare settings is continuous monitoring of infection rates. 12,Reference Shehab, Alschuler and Mc13 No systematic framework exits for implementing such monitoring in home care, where definitions, surveillance methods, and data collection processes differ substantially from acute care. Reference Keller, Hannum and Weems6,Reference Oladapo-Shittu, Klein and Shpitser14–Reference Hannum, Oladapo-Shittu and Salinas17 Consequently, it remains unclear whether monitoring strategies that have succeeded in hospitals can be adapted to reduce infections in home infusion. Reference Keller, Hannum and Weems6 There is no national strategy to collect standardized data from home infusion agencies, 12 and no national, or even multi-site, longitudinal home infusion CLABSI surveillance data using a validated CLABSI definition.
An additional fundamental difference between home infusion and acute care regarding CLABSI prevention is that patients and caregivers [rather than trained healthcare workers (HCWs)] carry out much of the day-to-day CVC maintenance activities. Patients are in a less controlled home environment (and often traveling outside the home environment for work, school, and other activities), are usually not critically ill, and often maintain their CVCs for months or years rather than days. Reference Burden, Hemstock and Taylor18 Patients may have multiple caregivers and multiple healthcare locations (eg, clinics, infusion centers, etc.) accessing their CVCs. Although home infusion agencies have developed bundles of strategies to train patients and caregivers on CLABSI prevention, their efficacy has not been well evaluated. Reference Hannum, Oladapo-Shittu and Salinas15,Reference Hannum, Oladapo-Shittu and Marsteller19–Reference Oladapo-Shittu, Klein and Shpitser21
The Home Infusion CLABSI Prevention Collaborative (HICPC) focuses on CLABSI and home infusion-onset bloodstream infection (HiOB) surveillance and prevention practices. The HICPC validated and implemented home infusion CLABSI and HiOB definitions and is currently the only network of organizations in the country that benchmarks home infusion CLABSI using a validated definition. Reference Oladapo-Shittu, Klein and Shpitser22 As the National Healthcare Safety Network (NHSN) does not have a module for home infusion, 12 the HICPC is the first and so far only group of home infusion organizations in the United States to develop and implement a dashboard for CLABSI and HiOB reporting using validated surveillance definitions. Reference Hannum, Oladapo-Shittu and Marsteller19,Reference Phung, Lee and Oladapo-Shittu23 It is also the first to disseminate tools for CLABSI prevention in the home, including videos, handouts, cognitive aids, and protocols. In this paper, our goals are to use multiple methods to: (1) determine the impact of the dashboard and prevention toolkit on CLABSI and HiOB rates over time, and (2) understand how the CLABSI prevention tools were implemented.
Methods
Setting and participants
The HICPC started in May 2019. HICPC members included five large home infusion agencies: three in the mid-Atlantic and two in the Midwest, covering portions of thirteen states and Washington, DC. Primary champions of the HICPC included two to six members of each infusion agency, who disseminated information to their agencies. The study was approved by the Johns Hopkins Institutional Review Board (protocol IRB00259916).
Intervention
Learning collaborative activities included monthly webinars and a program listserv in which respondents discussed surveillance and prevention activities. In addition, HICPC members met with each other at professional conferences and visited each other’s agencies. HICPC members first underwent training in how to apply the CLABSI and HiOB definitions. Reference Keller, Hannum and Weems6 In December 2022, using participatory design, Reference Hannum, Oladapo-Shittu and Marsteller19 we implemented a dashboard for HICPC members to retroactively upload CLABSI and HiOB data from June 2021. Reference Keller, Hannum and Weems6,Reference Hannum, Oladapo-Shittu and Marsteller19 Collaborative members could compare their agency’s rates with other agencies and investigate subpopulations of interest (eg, pediatric patients, patients receiving chemotherapy, etc).
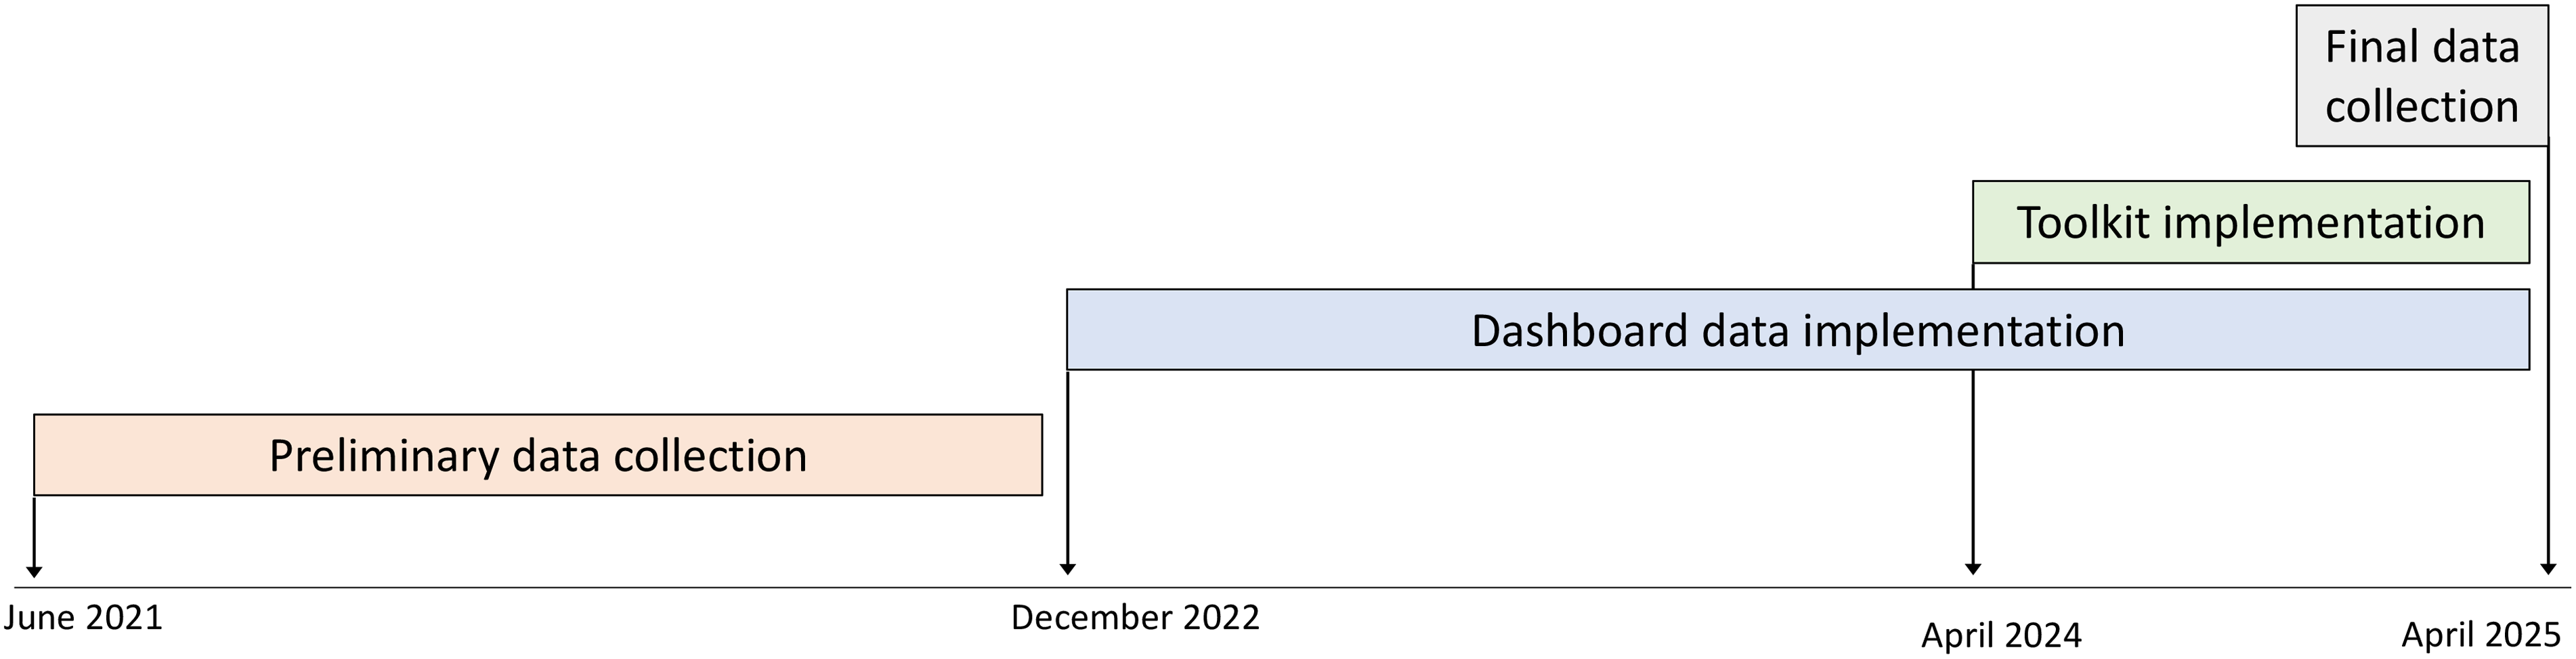
Using participatory design, HICPC members contributed to a toolkit for CLABSI prevention. Tools included those used to aid home infusion agency members in teaching patients and caregivers and intended for distribution to patients and caregivers such as handouts, cognitive aids, and videos (Table 1). The toolkit was implemented via the HICPC website (www.nhicpc.org) in June 2024. Patient education tools were approved and implemented per each agencies’ standard approval processes; thus, each agency chose which tools it wanted to use, modified non-video tools for their own use (eg, adding the agency name, changing images to reflect specific brands of equipment, etc), and implemented tools at different times (Figure 1). Several agencies had used versions of certain tools prior to toolkit implementation.
Timeline of study activities.

Components of toolkit

Semi-structured interviews
We conducted semi-structured interviews with home infusion nurses. We used a combination of purposive, convenience, and snowball sampling to recruit interview participants. Reference Miles, Huberman and Saldana24 We started by purposively recruiting staff members known to be actively engaged in CLABSI prevention activities and asked these individuals who else at their agency might be eligible. We also asked that HICPC champions disseminate a recruitment email to front-line nurses at their agencies. We interviewed at least two individuals from each agency.
Semi-structured interview guides explored how tools and the toolkit were used in CLABSI prevention. To ensure consistency, interviews were conducted by a single team member (SCK). After obtaining written consent, interviews were conducted via audio-recorded videoconference and lasted between 15 and 30 minutes. Interviews occurred between August 2024 and February 2025. We entered deidentified transcripts into MAXQDA for qualitative data management and analyses (VERBI Software, Berlin, GA).
Surveys
We developed an electronic survey focused on tool implementation using the reach, effectiveness, adoption, implementation, and maintenance (RE-AIM) model (Appendix 1, Qualtrics XM, Seattle, WA). Reference Glasgow, Vogt and Boles25 The survey included 29 multiple-choice and free-text items and took approximately 10 to 15 minutes to complete. Each agency was asked to electronically disseminate the survey to employees one month after implementation of the toolkit. Reminders were sent out every other week, three times. Responses were anonymous.
In addition, we developed a structural assessment focused on the makeup of the agency that we disseminated to one champion from each agency.
Use of dashboard and toolkit
We recorded data from nhicpc.org, including access and viewing data (April 2024–April 2025) and tool-download data (June 2024–April 2025). This data reflected views and downloads by home infusion staff, typically by a home infusion agency for modification and local dispensing to other agency members and to patients and caregivers. As videos were available via QR code from toolkit documents, directly from nhicpc.org, and from YouTube.com (Alphabet, Mountain View, CA), we present aggregate numbers of video views reflective of views by patients.
Impact of dashboard and toolkit on CLABSI and HiOB rates
An interrupted time series analysis (ITSA) to account for differences in rates over time was used to assess changes in CLABSI and HiOB rates (Stata Ver. 18, College Station, TX). CLABSI and HiOB were modeled separately. To assess the impact of the dashboard, pre-implementation rates were compared to post-implementation rates. Similarly, toolkit implementation was measured before and after the dissemination of the toolkit. The model for both CLABSI and HiOB included variables representing the pre-dashboard implementation trend, a step and slope change for the dashboard implementation, and a step and slope change for the toolkit implementation. Month 0 was the month from which data was first uploaded after validation and training in use of the definitions (June 2021). Reference Keller, Hannum and Weems6
Analysis of qualitative data
Deductive and inductive coding was used to analyze interviews. Reference Saldana26 We first deductively applied a structured set of codes focused on tool use, approaches to training patients and caregivers as well as HCWs, positive attributes of the tools, changes made to the tools, and barriers, facilitators, and strategies for use of the tools. Two researchers applied these codes to three interview transcripts (SCK and SH) and then inductively coded 45 emergent sub-codes. Disagreements in coding were discussed throughout the codebook development phase and rectified to coder agreement. Reference Saldana26 Thereafter, remaining transcripts and observation forms were single-coded using the established codebook. To verify code application and assess overall trustworthiness and congruence of interpretation, all code reports were reviewed (SCK and SH). Preliminary findings were presented to the research team for the opportunity to provide input on emergent findings and analyses.
Analysis of survey data
For survey data, we reported frequencies and performed chi-squared, t-test, and ANOVA analyses as appropriate using Stata Ver. 18 (Stata, College Station, TX).
Results
Analysis of CLABSI and HiOB rates
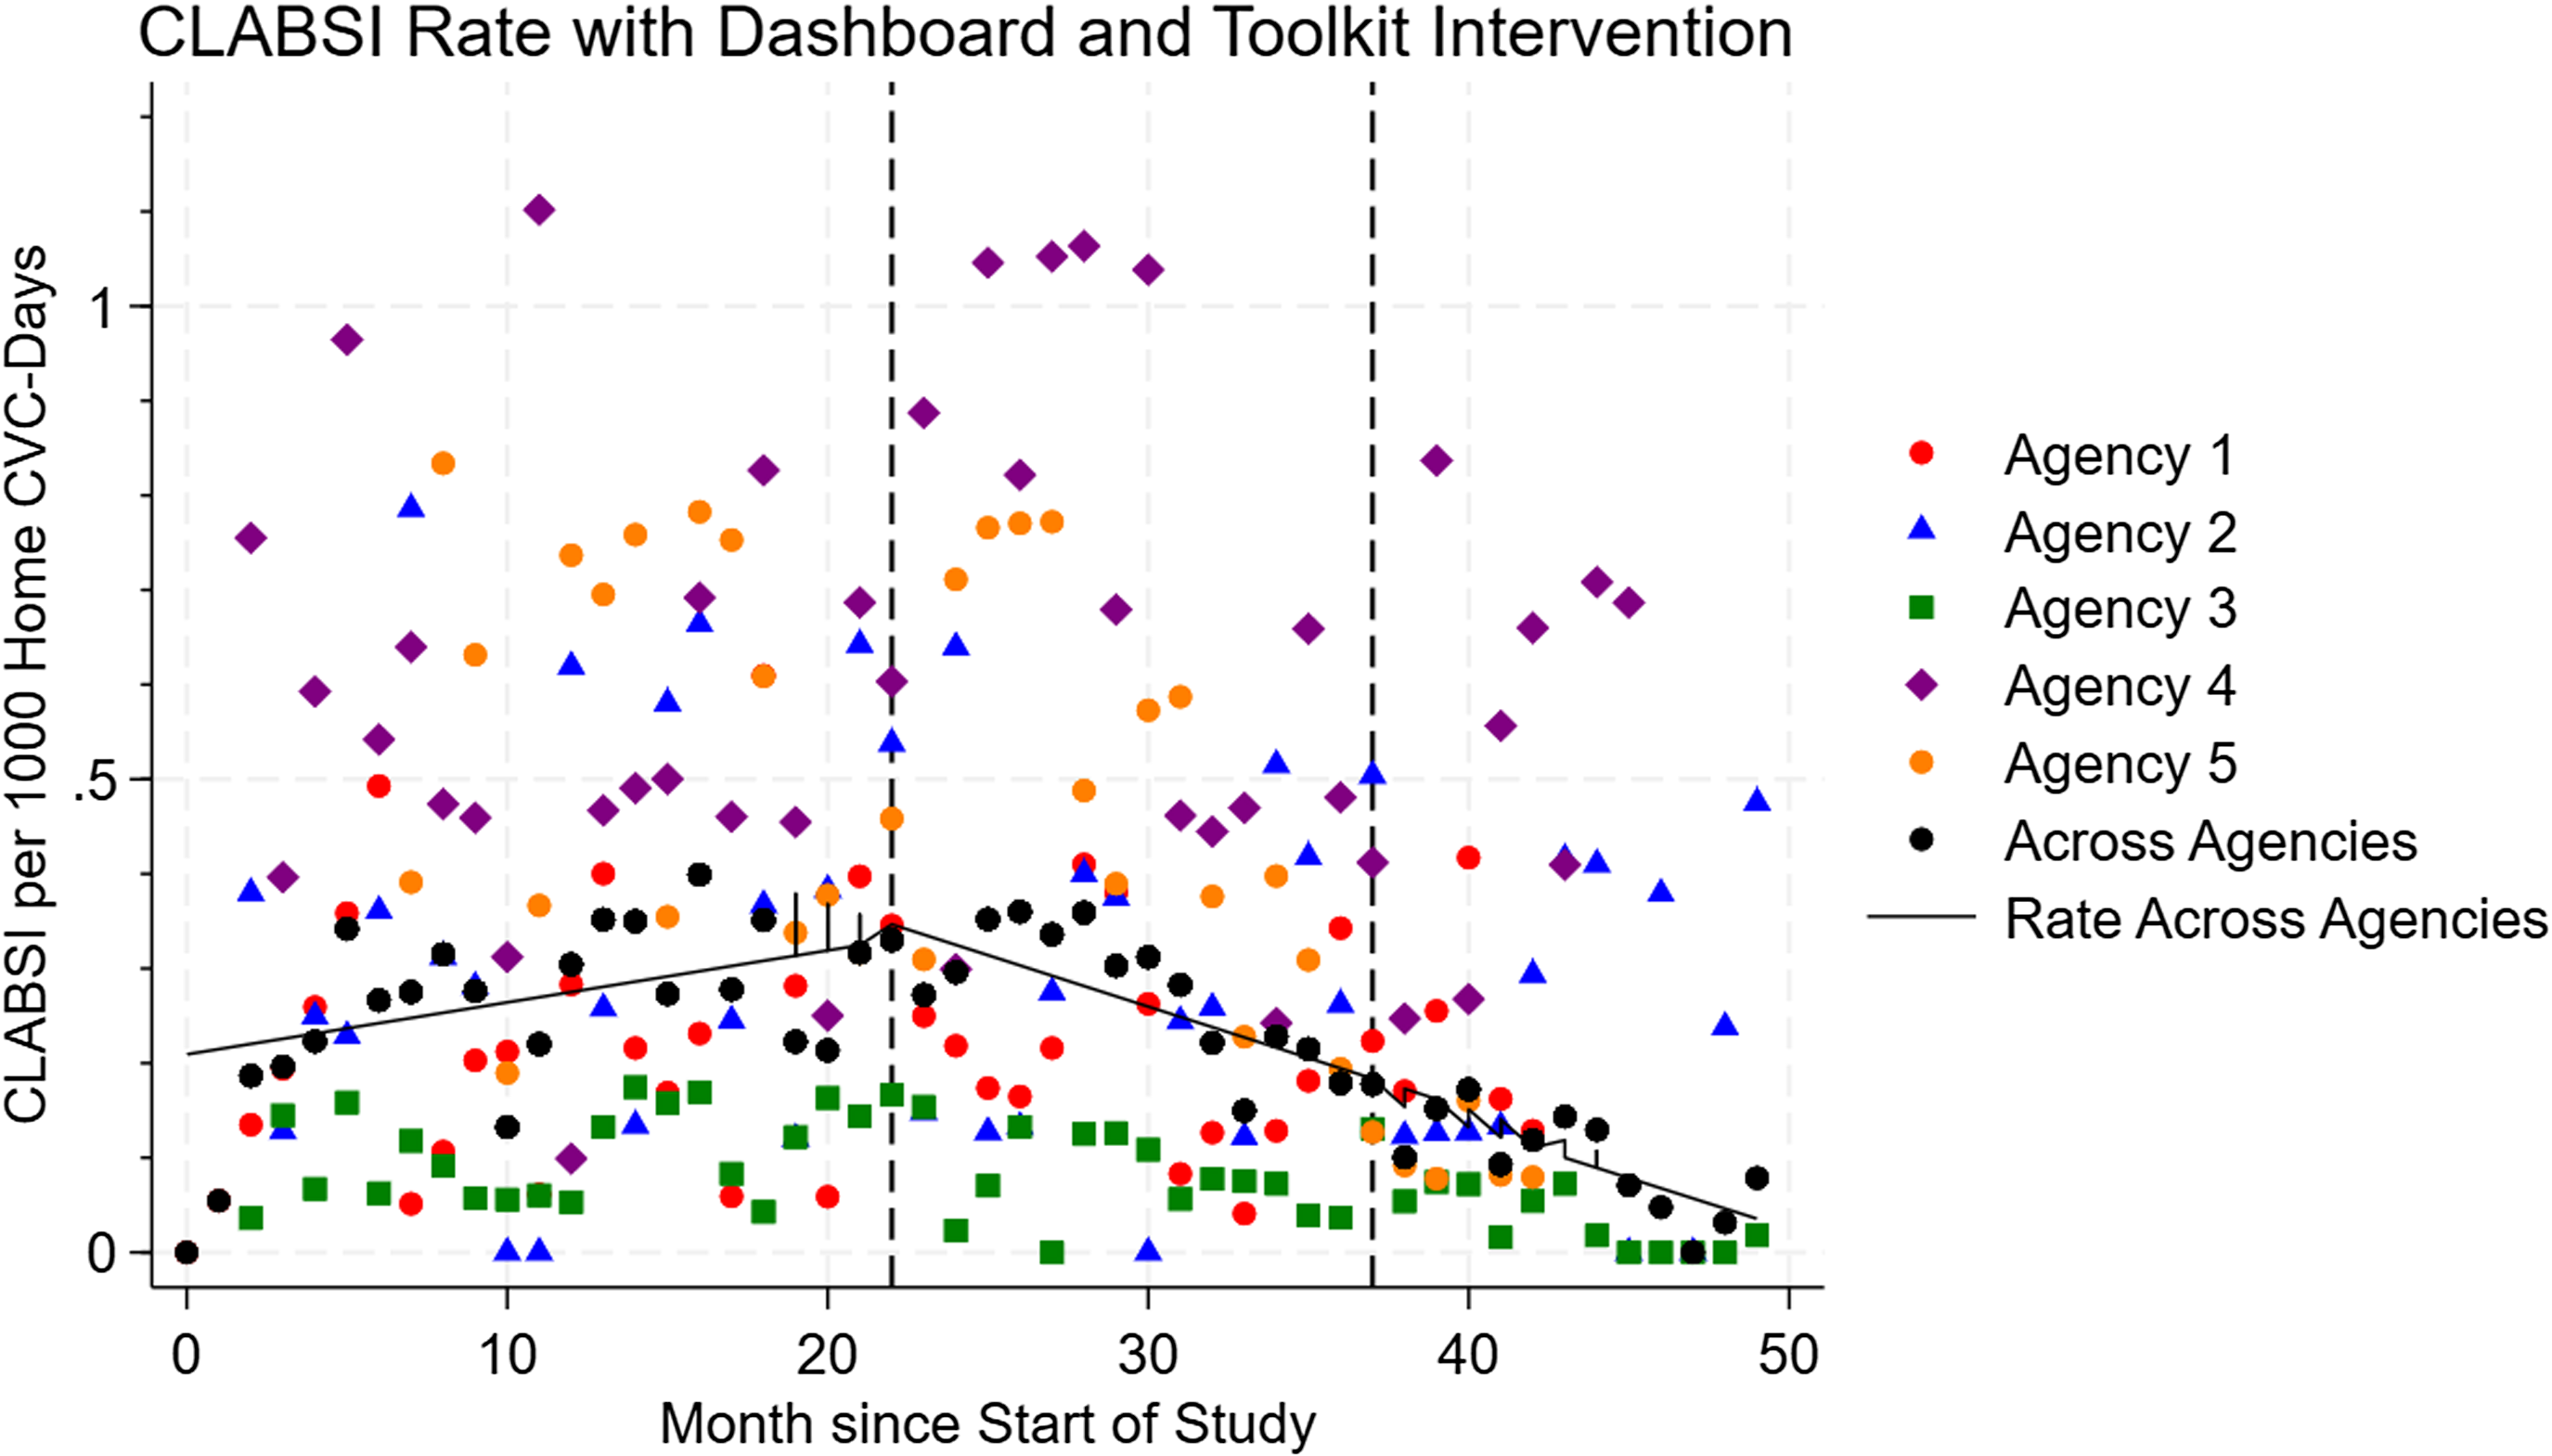
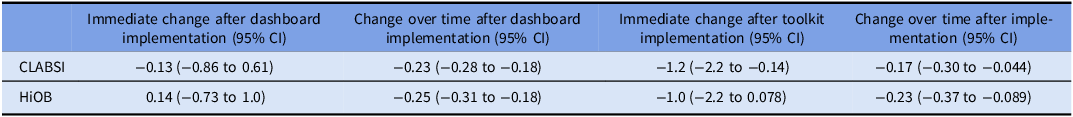
CLABSI occurred at a mean rate of 2.2/10,000 home-CVC days (Figure 2, Table 2). After dashboard implementation, there was no immediate change in CLABSI (−0.13/10,000 home-CVC days, 95% CI: −0.86 to 0.61), but over time, there was a decrease in monthly CLABSI (−0.23/10,000 home-CVC days, 95% CI: −0.28 to −0.18). After toolkit implementation, there was an immediate decrease in CLABSI (−1.2/10,000 home-CVC days, 95% CI: −2.2 to −0.14) and a decrease in monthly CLABSI over time (−0.17/10,000 home-CVC days, 95% CI: −0.30 to −0.044).
CLABSI over time, per month, per 1,000 home-CVC days. Vertical lines indicate implementation of the CLABSI monitoring dashboard and implementation of the CLABSI prevention toolkit.

Changes in monthly CLABSI and HiOB rates after dashboard implementation and toolkit implementation, per 10,000 home-CVC days

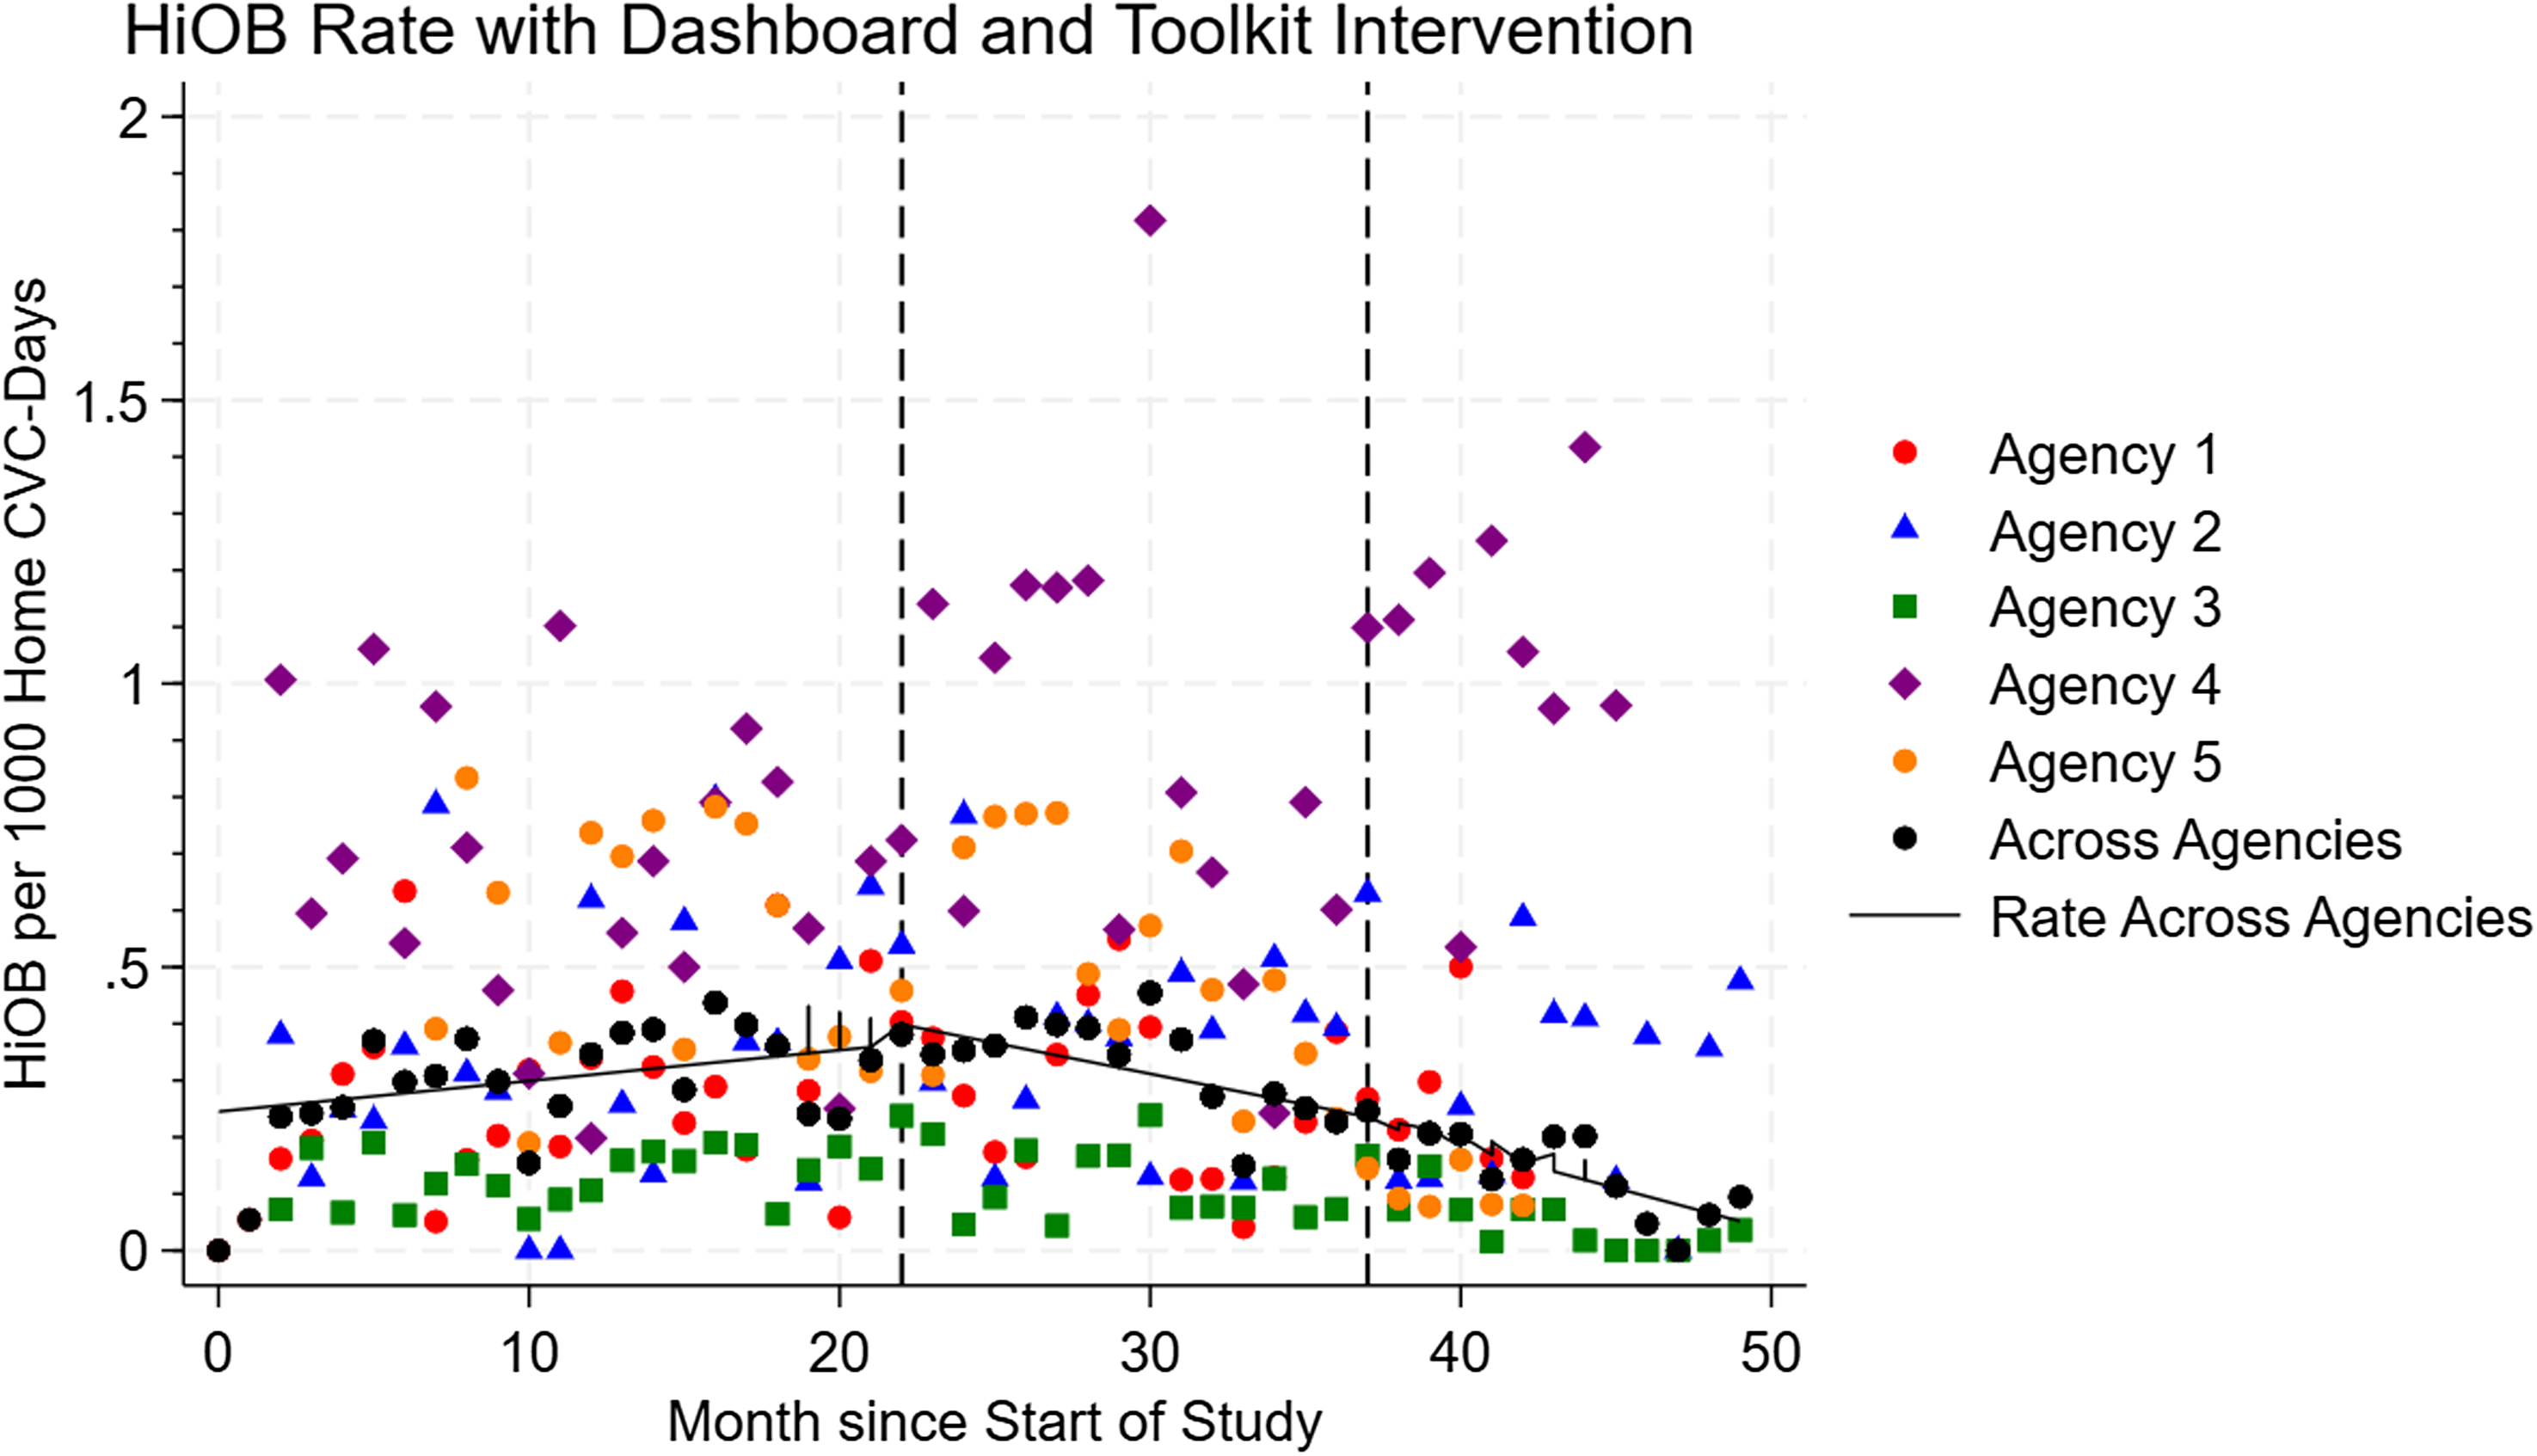
HiOB occurred at a mean rate of 2.6/10,000 home-CVC days (Figure 3). After dashboard implementation, there was no immediate change in HiOB (0.14/10,000 home-CVC days, 95% CI: −0.73 to 1.0), but there was a decrease in monthly HiOB over time (−0.25/10,000 home-CVC days, 95% CI: −0.31 to −0.18). After toolkit implementation, there was no immediate change in HiOB (−1.0/10,000 home-CVC days, 95% CI: −2.2 to 0.078), but there was a decrease in monthly HiOB over time (−0.23/10,000 home-CVC days, 95% CI: −0.37 to −0.089).
HiOB over time, per month, per 1,000 home-CVC days. Vertical lines indicate implementation of the CLABSI monitoring dashboard and implementation of the CLABSI prevention toolkit.

Over 13 months, the website was viewed 4218 times, the dashboard was viewed 1217 times, and tools were downloaded 345 times (Appendix 2). Videos were viewed 82,601 times (data not shown).
Description of survey data
Agencies ranged in size from 75 to 1500 employees (Appendix 3). All agencies employed their own home health or home infusion nurses and worked with affiliated home health or home infusion nurses. Of 26 respondents to a survey about the toolkit (Appendix 4), 88% strongly or somewhat agreed with the statement, “I like these tools” (Appendix 5).
Interviews
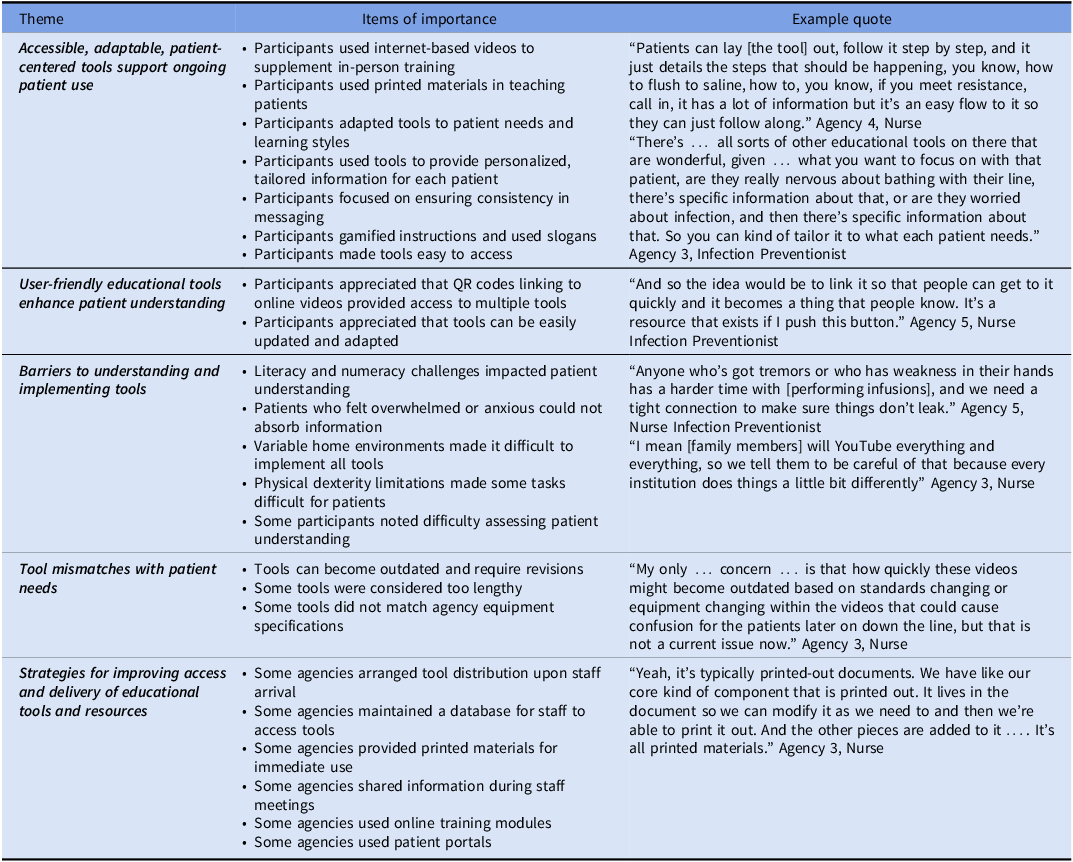
We interviewed 17 participants about their use of the tools (Table 3) and the toolkit (Table 4). We describe five primary emergent themes regarding the uptake of individual tools and five themes regarding the uptake of the overall toolkit.
Themes and items of importance related to how individual tools are used

Qualitative analysis of toolkit implementation

Themes involving use of tools
Respondents noted that accessible, adaptable, patient-centered tools supported ongoing patient use of the tools. User-friendly educational tools could enhance patient understanding. However, there were barriers to understanding and implementing the tools, such as literacy and numeracy challenges, feeling overwhelmed or anxious, variable home environments, physical dexterity, and difficulty assessing patient understanding. At times, the tools did not match what patients needed. Respondents used agency resources for improving access to and delivery of educational tools and resources.
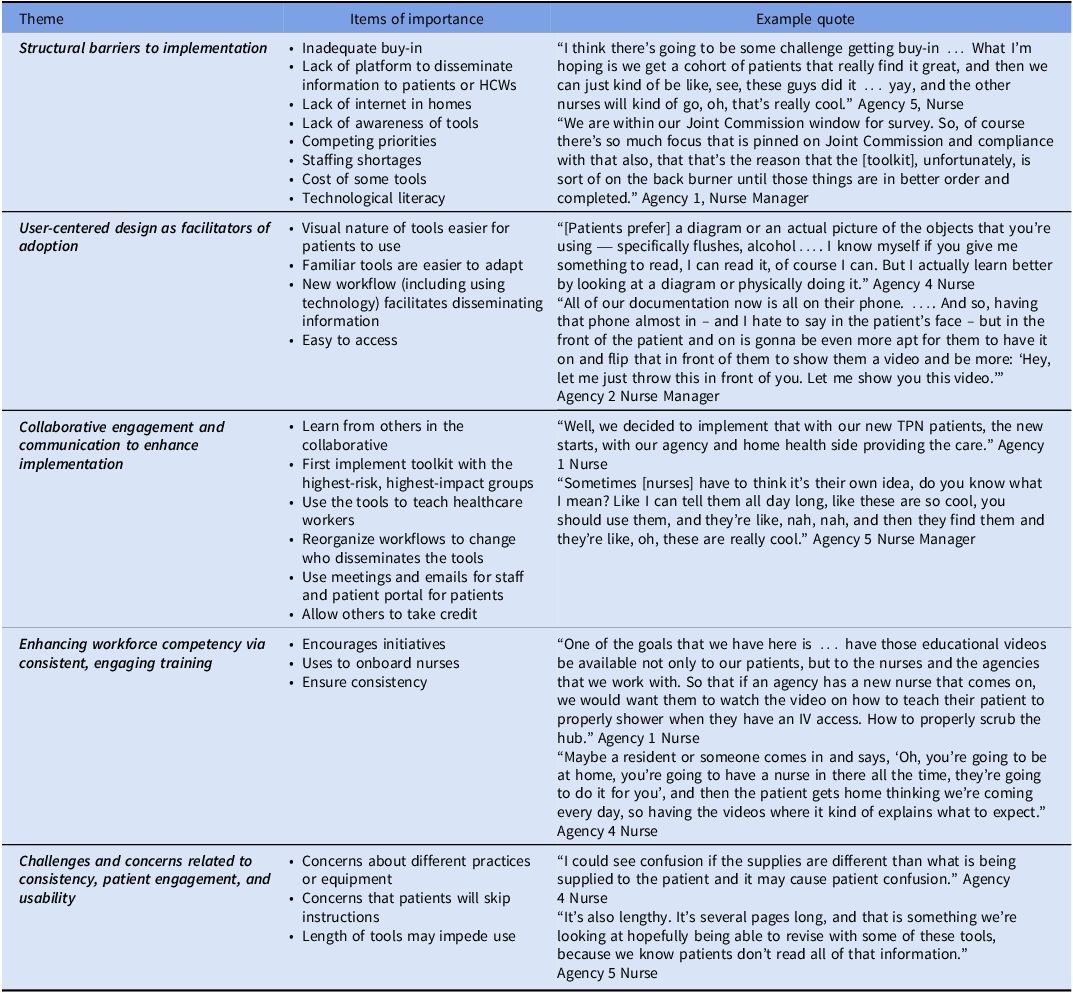
Themes involving toolkit implementation
We noted five themes focused on toolkit implementation. There were structural and resource barriers to implementation. Insufficient buy-in from leadership and frontline staff posed a significant challenge. Additionally, agencies that lacked effective dissemination platforms struggled to provide information to patients and HCWs. Access issues—including lack of internet connectivity in patients’ homes and low levels of technological literacy—restricted engagement with digital tools. Competing demands and staffing shortages diminished capacity to support new interventions. As a second theme, user-centered design facilitated toolkit adoption. As a third theme, collaborative engagement and communication, along with strategic implementation and allowing others to take credit, also enhanced implementation. As a fourth theme, some respondents noted that the toolkit itself improved workforce competency. Some agencies even used the toolkit to onboard nurses. Meanwhile, using the toolkit ensured consistency in care. Finally, the overall dissemination of the toolkit required overcoming concerns. Concerns about variability in practices or equipment between what is shown on a video and what an agency may use may hinder implementation. Additionally, there was apprehension that patients might not follow complicated instructions.
Discussion
For the first time, we investigated the impact of a CLABSI dashboard and toolkit on CLABSI and HiOB in a collaborative of home infusion therapy agencies. The dashboard was associated with a decrease in both CLABSI and HiOB over time. In the presence of the dashboard, the toolkit was associated with an immediate decrease in CLABSI as well as a decrease in both CLABSI and HiOB over time. Ultimately, the efforts of the HICPC resulted in CLABSI and HiOB ending at half the rate of the initial measurement.
Access to longitudinal data on healthcare-associated infection (HAI) in comparison with similar organizations is an important driver of HAI prevention. Reference Gerber, Prasad and Fiks27–Reference Pageler, Longhurst and Wood30 Inclusion of acute care CLABSI data in NHSN benchmarking has been associated with a reduction in acute care CLABSI. 31 We showed that dashboard implementation also can reduce home infusion CLABSI and HiOB. Other home infusion agencies implementing a CLABSI surveillance dashboard may consider similar methods, with an analysis plan that could include an approach such as statistical process control.
Meanwhile, CLABSI prevention bundles have successfully reduced CLABSI in acute care hospitals and are recommended by national guidelines. Reference Buetti, Marschall and Drees10 In this case, a toolkit for home infusion CLABSI prevention based on acute care guidelines Reference Buetti, Marschall and Drees10 was associated with a decrease in CLABSI and HiOB. While the evidence base for CLABSI prevention approaches in homes, where patients and caregivers perform most of the care and where the environment is vastly different from a hospital, needs to be expanded, we have shown that these tools can lead to a reduction in home infusion CLABSI. However, not all agencies fully implemented all components of the toolkit. Understanding which components of the home infusion CLABSI prevention toolkit were most impactful would be important in triaging resources.
Most were satisfied with the tools and thought they were useful for patients, particularly videos and cognitive aids. However, some were concerned that images of equipment may lead to confusion if these were different than what the agencies used. For example, a video may use a different brand of an infusion pump than the agency uses. Those developing tools for CLABSI prevention in home care settings should balance variation with standardization. Reference Sinsky, Bavafa, Roberts and Beasley32
Overall use of the toolkit was high. Videos were viewed 82,601 times. It is unlikely that HICPC staff or patients alone viewed the videos this frequently. It is possible that members of the public found the videos through internet searches. We advise that experts in infection prevention examine instructional tools available to the public to ensure that patients are receiving accurate information.
In prior work, we developed HiOB as a metric that would be easier to measure than home infusion CLABSI and showed that this metric closely approximates CLABSI. Reference Keller, Hannum and Weems6 We have now showed that a dashboard and a toolkit associated with reduction in home infusion CLABSI were also associated with reduction in HiOB. As acute care hospitals implement healthcare-onset bloodstream infection (HOB) surveillance, Reference Vazquez-Guillamet, Zhang and Bewley33–Reference Leekha, Robinson and Jacob35 understanding whether interventions geared toward reducing acute care CLABSI also reduce HOB will be important.
There was variation in CLABSI and HiOB rates by agency. While determining the specific facilitators or strategies that could have led to lower CLABSI and HiOB rates in particular agencies was out of the scope of this study, a qualitative analysis focused on a positive deviance methodology Reference Sternin36 would be helpful. In addition, high-performing agencies could present their strategies to other agencies.
The work described here occurred during and after the COVID-19 pandemic. In the first month of the data collection (June 2021), no CLABSI or HiOB were reported. While this may have been an outlier, the general trend pre-intervention was an increase in CLABSI and HiOB through December 2022. In acute care hospitals, the pandemic was associated with an increase in CLABSI through 2021 that then declined in 2022, Reference Lastinger, Alvarez and Kofman37,38 when CLABSI and HiOB rates in our study were still increasing. Home infusion CLABSI and HiOB rates did not decline until after the December 2022 dashboard implementation. As there are no other published or publicly available longitudinal home infusion CLABSI rates for comparison, we do not know how COVID-19 impacted home infusion CLABSI. However, some challenges noted such as competing priorities likely were even more of a challenge during COVID-19 due to staffing shortages and turnover. Engagement of leadership up front and through in-person visits increased engagement in the project.
Our study had several limitations. First, home infusion agencies implemented different portions of the toolkit at different times. Second, some agencies did not implement the entire toolkit due to other priorities, staffing shortages, or lack of a platform to disseminate information. Despite this, there was a decrease in CLABSI and HiOB rates after toolkit implementation. Third, the collaborative included five home infusion agencies that were all affiliated with academic medical centers. Results may have differed if the dashboard or toolkit were implemented more widely. Fourth, low numbers of participants responded to the survey or participated in interviews. We did achieve thematic saturation in the interview data.
Overall, in this first large-scale study of CLABSI prevention approaches in home infusion therapy, we showed that a comprehensive process for monitoring, surveillance, and benchmarking used for CLABSI and HiOB reporting was associated with a decrease in CLABSI and HiOB in home infusion agencies over time, and an added toolkit for home infusion CLABSI prevention was associated with an immediate further decrease in CLABSI and a decrease in both CLABSI and HiOB over time. This suggests that approaches and tools adapted from acute care settings for the home care setting, with input from home infusion professionals, can be successful in home infusion CLABSI and HiOB prevention. Many outside the collaborative likely used the tools especially the videos, pointing to the broader need for evidence-based reliable tools for home infusion CLABSI prevention. In future iterations of the toolkit, we may consider focusing on videos and on making written materials more adaptable, while still providing a menu of options for home infusion agencies. A home infusion CLABSI dashboard and toolkit should be disseminated more widely.
Supplementary material
The supplementary material for this article can be found at https://doi.org/10.1017/ice.2025.10385.
Acknowledgements
We acknowledge the support of the following CDC consultants for their advice and support in this work: Denise Leaptrot, MSA, SM/BSMT(ASCP), CIC, and Dominique Godfrey-Johnson, MPH, CPH, CIC. We acknowledge the assistance of the members of the Home Infusion CLABSI Prevention Collaborative in this work.
Financial support
This work was funded by the Agency for Healthcare Research and Quality R01HS027819 to S.C.K. The funding agency had no role in the performance of this work.
Competing interests
All authors report no conflicts of interest relevant to this article.


 Open access