

Depression is associated with significant disability, mortality and healthcare costs. It is the third leading cause of disability in high-income countries, Reference Lopez, Mathers, Ezzati, Jamison and Murray1 and affects approximately 840 million people worldwide. 2 Although biological, psychological and environmental theories have been advanced, Reference Krishnan and Nestler3 the underlying pathophysiology of depression remains unknown and it is probable that several different mechanisms are involved. Vitamin D is a unique neurosteroid hormone that may have an important role in the development of depression. Receptors for vitamin D are present on neurons and glia in many areas of the brain including the cingulate cortex and hippocampus, which have been implicated in the pathophysiology of depression. Reference Eyles, Smith, Kinobe, Hewison and McGrath4 Vitamin D is involved in numerous brain processes including neuroimmunomodulation, regulation of neurotrophic factors, neuroprotection, neuroplasticity and brain development, Reference Fernandes de Abreu, Eyles and Feron5 making it biologically plausible that this vitamin might be associated with depression and that its supplementation might play an important part in the treatment of depression. Over two-thirds of the populations of the USA and Canada have suboptimal levels of vitamin D. Reference Ginde, Liu and Camargo6,Reference Langlois, Greene-Finestone, Little, Hidiroglou and Whiting7
Some studies have demonstrated a strong relationship between vitamin D and depression, Reference Wilkins, Sheline, Roe, Birge and Morris8,Reference May, Bair, Lappe, Anderson, Home and Carlquist9 whereas others have shown no relationship. Reference Chan, Chan, Woo, Ohlsson, Mellstrom and Kwok10,Reference Pan, Lu, Franco, Yu, Li and Lin11 To date there have been eight narrative reviews on this topic, Reference Barnard and Colon-Emeric12–Reference Humble19 with the majority of reviews reporting that there is insufficient evidence for an association between vitamin D and depression. None of these reviews used a comprehensive search strategy, provided inclusion or exclusion criteria, assessed risk of bias or combined study findings. In addition, several recent studies were not included in these reviews. Reference May, Bair, Lappe, Anderson, Home and Carlquist9,Reference Chan, Chan, Woo, Ohlsson, Mellstrom and Kwok10,Reference Johnson, Fischer and Park20,Reference Zhao, Ford and Li21 Therefore, we undertook a systematic review and meta-analysis to investigate whether vitamin D deficiency is associated with depression in adults in case–control and cross-sectional studies; whether vitamin D deficiency increases the risk of developing depression in cohort studies in adults; and whether vitamin D supplementation improves depressive symptoms in adults with depression compared with placebo, or prevents depression compared with placebo, in healthy adults in randomised controlled trials (RCTs).
Method
Search strategy
We searched the databases MEDLINE, EMBASE, PsycINFO, CINAHL, AMED and Cochrane CENTRAL (up to 2 February 2011) using separate comprehensive strategies developed in consultation with an experienced research librarian (see online supplement DS1). A separate search of PubMed identified articles published electronically prior to print publication within 6 months of our search and therefore not available through MEDLINE. The clinical trials registries clinicaltrials.gov and Current Controlled Trials (controlled-trials.com) were searched for unpublished data. The reference lists of identified articles were reviewed for additional studies.
Eligibility criteria
The following study designs were included: RCTs, case–control studies, cross-sectional studies and cohort studies. All studies enrolled adults (age 18 years) and reported depression as the outcome of interest and vitamin D measurements as a risk factor or intervention. Cross-sectional and cohort studies were required to report depression outcomes for participants with vitamin D deficiency (as defined by each study, see Tables 1 and 2) compared with those with normal vitamin D levels. There was no language restriction. Eligibility criteria are detailed in online supplement DS2.
Outcome
Our primary outcome for all studies was depression diagnosed using one of the following:
-
(a) a standardised psychiatric interview for the DSM diagnoses of depressive disorders (e.g. the Structured Clinical Interview for DSM Disorders) or ICD diagnoses of a depressive episode ordepression (e.g. the Composite International Diagnostic Interview); Reference Spitzer, Williams, Gibbon and First22,Reference Robins, Wing, Wittchen, Helzer, Babor and Burke23
-
(b) a clinical diagnosis of a depressive disorder, depressive episode or depression not otherwise specified;
-
(c) a diagnosis of depression using an established cut-off point on a validated rating scale, such as a score of ⩾16 on the Center for Epidemiological Studies – Depression scale or ⩾8 on the Geriatric Depression Scale. Reference Orme, Reis and Herz24,Reference Yesavage, Brink, Rose, Lum, Huang and Adey25
For RCTs that enrolled patients with depression our secondary outcome was change in depressive symptoms using a validated rating scale. This secondary outcome was not used for RCTs that enrolled non-depressed participants or other study designs because it was not meaningful in those contexts.
Study selection and data abstraction
Two authors (R.A. and Z.S.) independently reviewed all titles and abstracts identified by the search. Articles were selected for full-text review if inclusion criteria were met or if either reviewer considered them potentially relevant. Disagreements were resolved by discussion between the two reviewers, and a third author (S.M.) was available to determine eligibility if consensus could not be reached. Initial agreement was assessed using an unweighted κ value. Data were extracted by two authors (R.A. and Z.S.) independently using a form developed for this review, with disagreements resolved as above. We attempted to contact study authors for additional or missing information when needed.
Assessment of risk of bias
Two reviewers (R.A. and Z.S.) independently assessed the risk of bias using a modified Newcastle–Ottawa Scale (see online supplement DS3). Reference Wells, Shea, O'Connell, Peterson, Welch and Losos26 In observational studies one of the main sources of bias is confounding. Known confounders can be statistically adjusted, but unknown confounders may still result in bias. It was decided a priori that studies that adjusted for factors shown elsewhere to affect vitamin D levels (chronic disease, body mass index, geographical location, season and physical activity) Reference Hanley, Cranney, Jones, Whiting, Leslie and Cole27,Reference Rosen28 would be considered to have a low risk of bias, studies that adjusted only for other potential confounders would have an unclear risk of bias, and any studies that did not adjust for any confounders would have a high risk of bias. Publication bias was assessed using funnel plots.
Statistical analysis
Search results were compiled using citation management software (RefWorks version 2.0; ProQuest, http://www.refworks.com). Statistical analysis was performed using Review Manager software (Revman version 5.1; Cochrane Collaboration, Oxford, UK), Epi Info version 6.0 (CDC, Atlanta, Georgia, USA) and PASW Statistics version 18.0 (SPSS, Chicago, Illinois, USA) for Mac.
Case–control studies
The standardised mean difference (SMD) of vitamin D levels between the participants with depression and the healthy controls was calculated. An SMD below 0.4 was considered small, 0.4–0.7 moderate and over 0.7 large. Reference Higgins and Green29 Our protocol proposed pooling SMDs for meta-analysis using a random effects model.
Cross-sectional studies
Our protocol proposed examining adjusted odds ratios (ORs) of depression for those with or without vitamin D deficiency (as defined in each study) and the associated 95% confidence intervals. We planned to pool the adjusted ORs for meta-analysis. Unfortunately the cross-sectional studies used different reference categories of vitamin D concentration (either <50 nmol/l or the lowest and highest category) and presented data using different quartiles, tertiles or categories. After protocol development, but prior to analysing the data, we decided to use the adjusted OR of depression for the lowest v. highest vitamin D categories reported. The inverse variance method and random effects model were used for all meta-analyses. A random effects model was chosen because we anticipated heterogeneity among studies. Where ORs were reported for subgroups of patients within a single study, they were combined into a single OR for our analysis. Reference Nanri, Mizoue, Matsushita, Poudel-Tandukar, Sato and Ohta30
Cohort studies
As with the analysis of cross-sectional studies, the variability in presentation of results of the cohort studies precluded the calculation of a pooled adjusted OR. We therefore contacted the authors of all three cohort studies to obtain the number of depressed participants and the person-years of follow-up in each category of vitamin D, and requested data using the cut-off point of 50 nmol/l. This allowed us to calculate hazard rates for each category, so that we could then account for losses to follow-up and variable follow-up periods; also, by assuming a constant hazard rate over time, we could pool hazard ratios using a cut-off point of 50 nmol/l. All authors provided some data, but one provided only data using the cut-off points of 37.5 nmol/l and 75 nmol/l. Reference May, Bair, Lappe, Anderson, Home and Carlquist9 We therefore performed a sensitivity analysis using these two cut-off points in a meta-analysis.
Additionally, we decided to analyse the cohort data using the highest v. lowest vitamin D categories in order to use the adjusted results and take confounding into account. For this analysis the adjusted hazard ratios were used; the adjusted OR from one study was converted first to a relative risk and then to a hazard ratio (HR). Reference Chan, Chan, Woo, Ohlsson, Mellstrom and Kwok10 Finally, we performed a third analysis in which we calculated the increase in the natural logarithm of the hazard rate (ln(HR)) of depression per 20 nmol/l decrease in vitamin D for each study. Reference Greenland and Longnecker31 The mid-point of each category of vitamin D was calculated and half the width of the adjacent category was used to define the corresponding point for open-ended categories. The ln(HR) for each category was then regressed on the vitamin D mid-points (divided by 20) using a linear model, with the data weighted by the inverse variance of the ln(HR), to generate a coefficient that represented the change in ln(HR) per 20 nmol/l decrease in vitamin D and its associated standard error. The coefficients for each study were then pooled for meta-analysis.
Assessment of heterogeneity
Heterogeneity between the studies was measured using Cochran's Q statistic, with a probability value of P<0.05 (two-tailed) considered statistically significant. The I 2 statistic was used to quantify the degree of heterogeneity and we considered values below 25% to be low, 25–50% moderate and over 50% high. Reference Higgins, Thompson, Deeks and Altman32
Subgroup and sensitivity analyses
We planned the following subgroup analyses a priori: gender, age ⩾65 years, prevalence of vitamin D deficiency, proportion of participants with a disease known to affect vitamin D, and adjustment for different confounders. We planned a priori to perform a sensitivity analysis excluding studies with a high risk of bias. For the cohort studies we performed a sensitivity analysis using the cut-off point of 37.5 nmol/l compared with 75 nmol/l for the one study that did not provide data using our standard cut-off point of 50 nmol/l. We also performed a sensitivity analysis for the cross-sectional studies excluding one study that had recruited participants aged 15–39 years Reference Ganji, Milone, Cody, McCarty and Wang33 (our inclusion criteria specified adults aged 18 years).
Results
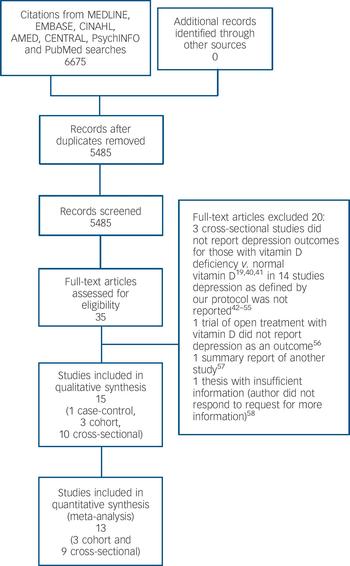
Our primary search identified 6675 citations (Fig. 1). No additional article or abstract was selected from other sources. After duplicates were removed 5484 citations remained for title and abstract screening. Of these, 35 were identified and retrieved for full-text screening; all were in English. After full text review, one case–control study, Reference Eskandari, Martinez, Torvik, Phillips, Sternberg and Mistry34 three cohort studies, Reference May, Bair, Lappe, Anderson, Home and Carlquist9,Reference Chan, Chan, Woo, Ohlsson, Mellstrom and Kwok10,Reference Milaneschi, Shardell, Corsi, Vazzana, Bandinelli and Guralnik35 and ten cross-sectional studies, Reference Wilkins, Sheline, Roe, Birge and Morris8,Reference Pan, Lu, Franco, Yu, Li and Lin11,Reference Johnson, Fischer and Park20,Reference Zhao, Ford and Li21,Reference Nanri, Mizoue, Matsushita, Poudel-Tandukar, Sato and Ohta30,Reference Ganji, Milone, Cody, McCarty and Wang33,Reference Hoogendijk, Lips, Dik, Deeg, Beekman and Penninx36–Reference Wilkins, Birge, Sheline and Morris39 met eligibility criteria and were included (unweighted κ = 0.75). Figure 1 lists the reasons for excluding the other studies. Reference Humble19,Reference Reed, Laya, Melville, Ismail, Mitchell and Ackerman40–Reference Buell58
Study characteristics
Baseline information on the case–control, cross-sectional and cohort studies is presented in Tables 1 and 2. There were 31 424 participants in total. All studies were published between 2006 and 2011; study locations included the USA, Europe and East Asia. Seven of the ten cross-sectional studies included older adults.
Study selection process.

Risk of bias in included studies
Case–control study
The agreement between the reviewers in assessing the risk of bias for the case–control study across the nine points of the Newcastle–Ottawa Scale was 100%, with both reviewers assigning the same four points. There was potential for selection bias as participants were recruited through advertisements and were all premenopausal women; also, the study did not control for known confounders.
Cross-sectional studies
Agreement between the reviewers in assessing the risk of bias in cross-sectional studies was 95%, unweighted κ = 0.84. Four studies were thought to be unrepresentative of the general population: Johnson et al included only low-income older adults; Reference Johnson, Fischer and Park20 Lee et al included only elderly men; Reference Lee, Tajar, O'Neill, O'Connor, Bartfai and Boonen37 and the two studies by Wilkins et al included only elderly participants, half of whom in the 2006 study were purposely selected to have Alzheimer's disease, and in the 2009 study were purposely selected to include African Americans and European Americans in equal numbers. Reference Wilkins, Sheline, Roe, Birge and Morris8,Reference Wilkins, Birge, Sheline and Morris39 Seven studies received a high risk of bias assignment for assessment of outcome because they used cut-off points on self-reported psychiatric rating scales. Two studies received an unclear risk of bias assignment for using administered surveys, which were felt to have an intermediate risk of bias between a self-report scale and clinician-administered standardised psychiatric interview. All studies adjusted for multiple confounders (online supplement DS4). The funnel plot (online supplement DS5) did not suggest significant publication bias.
Cohort studies
Agreement between the reviewers in assessing the risk of bias across cohort studies was 88%, unweighted κ = 0.61. Two studies Reference May, Bair, Lappe, Anderson, Home and Carlquist9,Reference Chan, Chan, Woo, Ohlsson, Mellstrom and Kwok10 were considered unrepresentative of the general population, and the study by May et al was thought to be at high risk of bias for selection of the non-exposed cohort because vitamin D levels were obtained at the discretion of treating physicians, Reference May, Bair, Lappe, Anderson, Home and Carlquist9 which may have biased whose vitamin D levels were observed. All studies included in this review adjusted for multiple confounders, but May et al did not measure or adjust for physical activity, body mass index or the presence of chronic diseases and therefore received an unclear risk of bias rating. Chan et al and Milaneschi et al used cut-off points on self-report scales to diagnose depression, Reference Chan, Chan, Woo, Ohlsson, Mellstrom and Kwok10,Reference Milaneschi, Shardell, Corsi, Vazzana, Bandinelli and Guralnik35 which is less reliable than a clinical diagnosis, and therefore these studies were rated at high risk of bias. Although May et al used a clinical diagnosis of depression using ICD-9 codes, it was not clear whether all participants underwent a clinical assessment or whether record linkage was used; an unclear risk of bias was therefore assigned. May et al presented the average duration of follow-up period but did not otherwise describe loss to follow-up, and therefore this received an unclear rating. Because there were only three cohort studies the funnel plot was uninformative. Reference Sutton, Duval, Tweedie, Abrams and Jones59 Further information on the risk of bias assessments is included in online supplement DS5.
Outcome evaluation and meta-analysis
A summary of the results from the cross-sectional and cohort meta-analyses including subgroup and sensitivity analyses is presented in Table 3. Three cross-sectional studies did not report ORs, and the authors of these studies were contacted. Reference Johnson, Fischer and Park20,Reference Hoogendijk, Lips, Dik, Deeg, Beekman and Penninx36,Reference Wilkins, Birge, Sheline and Morris39 One author replied and the OR provided was included in the meta-analysis; Reference Hoogendijk, Lips, Dik, Deeg, Beekman and Penninx36 an unadjusted OR and 95% CI were calculated for another study using data provided in the paper and Epi Info version 6.0, Reference Wilkins, Birge, Sheline and Morris39 but the third study could not be included. Reference Johnson, Fischer and Park20
Characteristics of included studies: case–control and cross-sectional studies
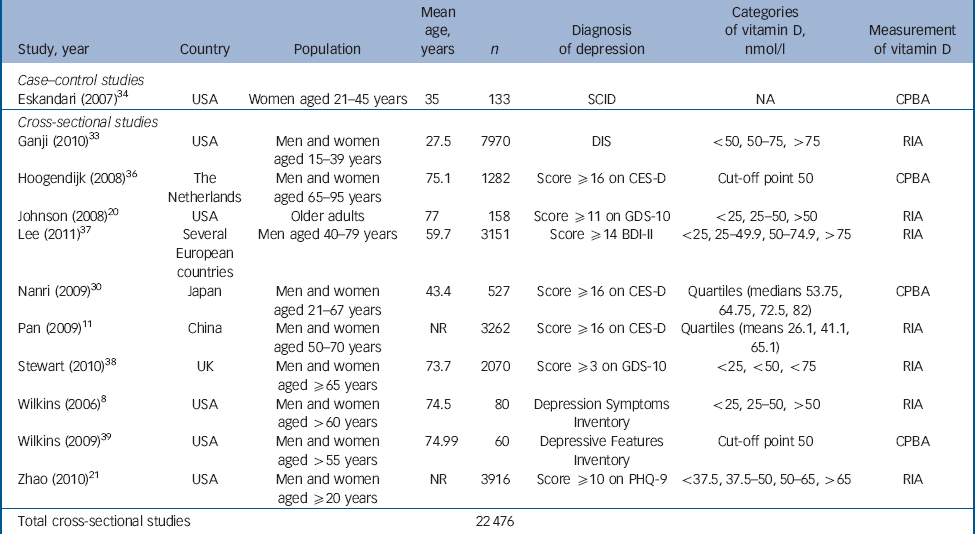
| Study, year | Country | Population | Mean age, years | n | Diagnosis of depression | Categories of vitamin D, nmol/l | Measurement of vitamin D |
|---|---|---|---|---|---|---|---|
| Case–control studies | |||||||
| Eskandari (2007) Reference Eskandari, Martinez, Torvik, Phillips, Sternberg and Mistry34 | USA | Women aged 21–45 years | 35 | 133 | SCID | NA | CPBA |
| Cross–sectional studies | |||||||
| Ganji (2010) Reference Ganji, Milone, Cody, McCarty and Wang33 | USA | Men and women aged 15–39 years | 27.5 | 7970 | DIS | <50, 50–75, >75 | RIA |
| Hoogendijk (2008) Reference Hoogendijk, Lips, Dik, Deeg, Beekman and Penninx36 | The Netherlands | Men and women aged 65–95 years | 75.1 | 1282 | Score ≥16 on CES-D | Cut-off point 50 | CPBA |
| Johnson (2008) Reference Johnson, Fischer and Park20 | USA | Older adults | 77 | 158 | Score ≥11 on GDS-10 | <25, 25–50, >50 | RIA |
| Lee (2011) Reference Lee, Tajar, O'Neill, O'Connor, Bartfai and Boonen37 | Several European countries | Men aged 40–79 years | 59.7 | 3151 | Score ≥14 BDI-II | <25, 25–49.9, 50–74.9, >75 | RIA |
| Nanri (2009) Reference Nanri, Mizoue, Matsushita, Poudel-Tandukar, Sato and Ohta30 | Japan | Men and women aged 21–67 years | 43.4 | 527 | Score ≥16 on CES-D | Quartiles (medians 53.75, 64.75, 72.5, 82) | CPBA |
| Pan (2009) Reference Pan, Lu, Franco, Yu, Li and Lin11 | China | Men and women aged 50–70 years | NR | 3262 | Score ≥16 on CES-D | Quartiles (means 26.1, 41.1, 65.1) | RIA |
| Stewart (2010) Reference Stewart and Hirani38 | UK | Men and women aged ≥65 years | 73.7 | 2070 | Score ≥3 on GDS-10 | <25, <50, <75 | RIA |
| Wilkins (2006) Reference Wilkins, Sheline, Roe, Birge and Morris8 | USA | Men and women aged >60 years | 74.5 | 80 | Depression Symptoms Inventory | <25, 25–50, >50 | RIA |
| Wilkins (2009) Reference Wilkins, Birge, Sheline and Morris39 | USA | Men and women aged >55 years | 74.99 | 60 | Depressive Features Inventory | Cut-off point 50 | CPBA |
| Zhao (2010) Reference Zhao, Ford and Li21 | USA | Men and women aged ≥20 years | NR | 3916 | Score ≥10 on PHQ-9 | <37.5, 37.5–50, 50–65, >65 | RIA |
| Total cross-sectional studies | 22 476 | ||||||
BDI, Beck Depression Inventory; CES-D, Center for Epidemiological Studies – Depression scale; CPBA, competitive protein binding assay; DIS, Diagnostic Interview Schedule; GDS, Geriatric Depression Scale; NA, not applicable; NR, not reported; PHQ, Patient Health Questionnaire; RIA, radioimmunoassay; SCID, Structured Clinical Interview for DSM-IV.
Characteristics of included studies: cohort studies
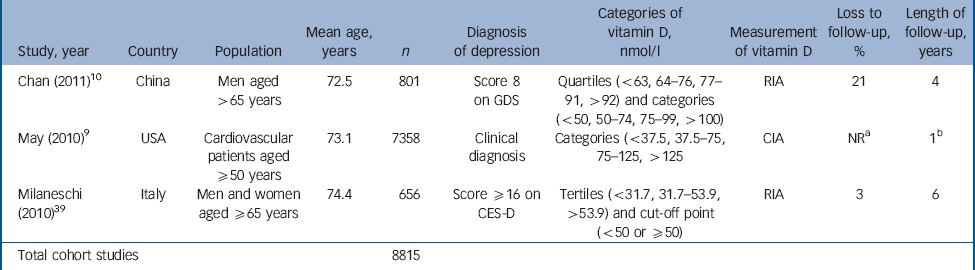
| Study, year | Country | Population | Mean age, years | n | Diagnosis of depression | Categories of vitamin D, nmol/l | Measurement of vitamin D | Loss to follow-up, % | Length of follow-up, years |
|---|---|---|---|---|---|---|---|---|---|
| Chan (2011) Reference Chan, Chan, Woo, Ohlsson, Mellstrom and Kwok10 | China | Men aged >65 years | 72.5 | 801 | Score 8 on GDS | Quartiles (<63, 64–76, 77–91, >92) and categories (<50, 50–74, 75–99, >100) | RIA | 21 | 4 |
| May (2010) Reference May, Bair, Lappe, Anderson, Home and Carlquist9 | USA | Cardiovascular patients aged ≥50 years | 73.1 | 7358 | Clinical diagnosis | Categories (<37.5, 37.5–75, 75–125, >125 | CIA | NR a | 1 b |
| Milaneschi (2010) Reference Wilkins, Birge, Sheline and Morris39 | Italy | Men and women aged ≥65 years | 74.4 | 656 | Score ≥16 on CES-D | Tertiles (<31.7, 31.7–53.9, >53.9) and cut-off point (<50 or ≥50) | RIA | 3 | 6 |
| Total cohort studies | 8815 | ||||||||
CIA, chemiluminescent immunoassay; CES-D, Center for Epidemiological Studies – Depression scale; GDS, Geriatric Depression Scale; NR, not reported; RIA, radioimmunoassay.
a. Most of cohort (71%) ‘not evaluable’ at 500 days.
b. Mean follow-up period.
Case–control study
One study compared vitamin D levels in women with depression and healthy controls. Reference Eskandari, Martinez, Torvik, Phillips, Sternberg and Mistry34 The mean difference between the groups was 17.5 nmol/l (P = 0.002), with an SMD of 0.60 (95% CI 0.23–0.97). This represented a moderate difference, Reference Higgins and Green29 which was also clinically significant. Meta-analysis could not be performed as only one study met our inclusion criteria.
Cross-sectional studies
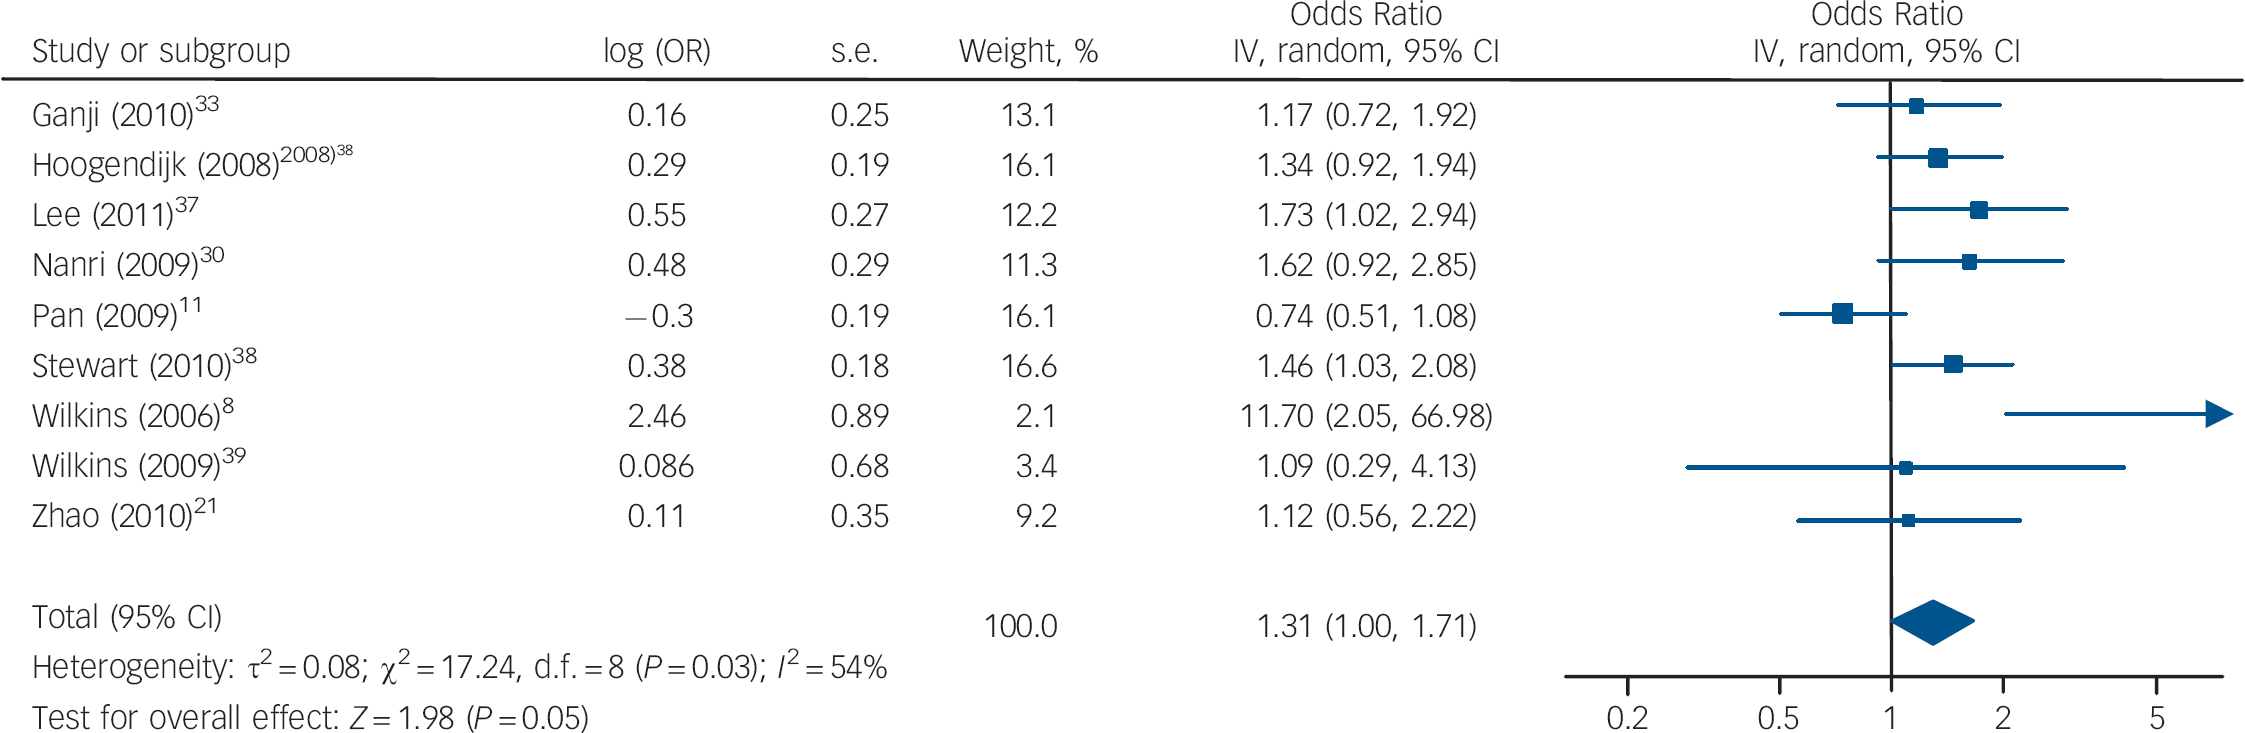
The cross-sectional studies measured rates of depression and vitamin D in a population at a single point in time to determine whether there was an association between depression and vitamin D levels. Nine studies reported on depression for the lowest v. the highest vitamin D categories, with a pooled OR of 1.31, 95% CI 1.00–1.71 (Fig. 2). There was substantial heterogeneity between studies (I 2 = 54%, χ2 = 17.24, P = 0.03). The only subgroup analysis that could be performed was of studies that had an average sample age of 65 years (online supplement DS5). When these studies were combined there was an increased – although non-significant – odds of depression with low vitamin D (OR = 1.54, 95% CI 1.00–2.40). A sensitivity analysis excluding the study by Ganji et al (online supplement DS6) had a minimal effect on our summary estimate (OR = 1.34, 95% CI 0.99–1.83, I 2 = 59%, χ2 = 17.16, P = 0.02). Reference Ganji, Milone, Cody, McCarty and Wang33
Cohort studies
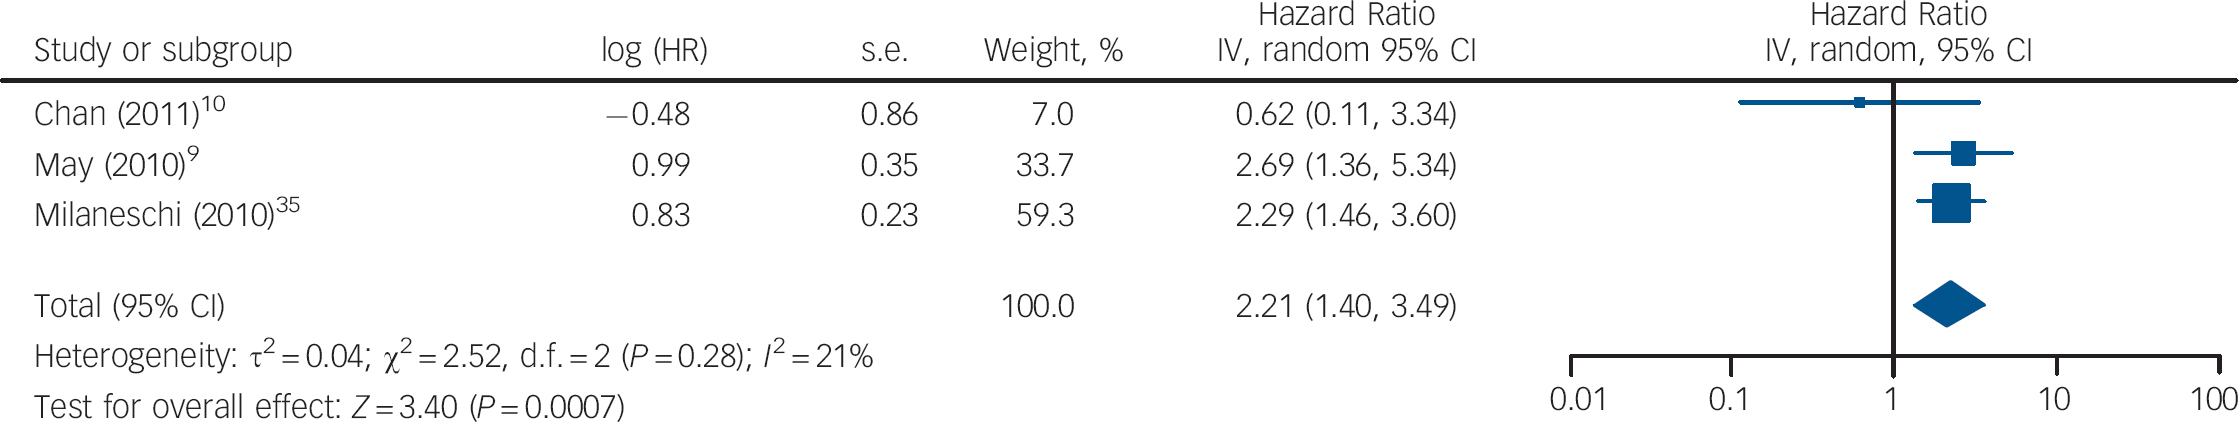
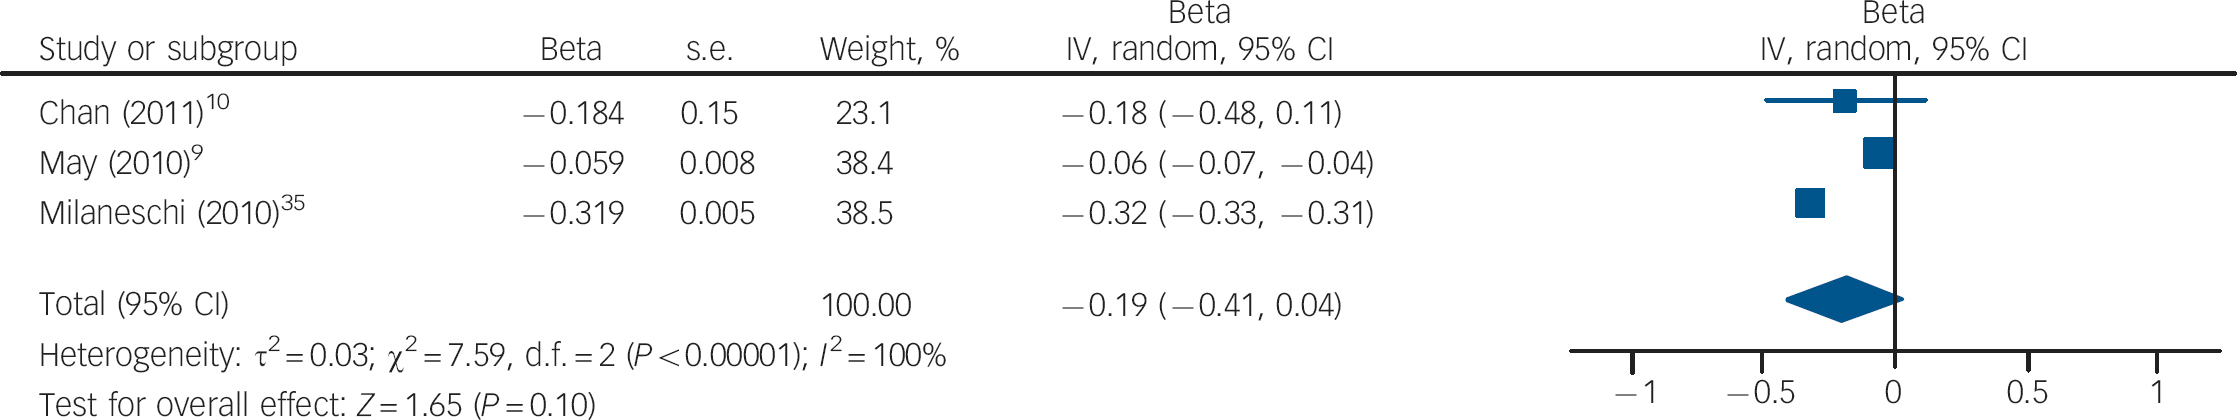
Three studies measured vitamin D levels at baseline in non-depressed individuals and followed them over time to determine whether vitamin D levels were associated with a risk of developing depression. There was a statistically significant increased risk of depression with low vitamin D (HR = 2.21, 95% CI 1.40–3.49) with non-significant heterogeneity (I 2 = 21%, χ2 = 2.52, P = 0.28) when the HRs for depression for the lowest v. highest vitamin D categories in the three cohort studies were pooled (Fig. 3). The change in the ln(HR) of depression per 20 nmol/l change in vitamin D level was calculated for each study and pooled. There was a non-significant decreased ln(HR) of depression for each 20 nmol/l increase in vitamin D (β = −0.19, 95% CI −0.41 to 0.04; Fig. 4).
Summary of results from the meta-analysis of cross-sectional and cohort studies of the relationship between vitamin D and depression
| Number of studies | Participants n | Vitamin D categories | Pooled OR or HR (95% CI) | I 2, % | |
|---|---|---|---|---|---|
| Cross-sectional studies | |||||
| All studies | 9 | 22 318 | Lowest v. highest | OR = 1.31 (1.00 to 1.71) | 5 (P = 0.03) |
| Older adults | 4 | 3492 | Lowest v. highest | OR = 1.54 (1.00 to 2.40) | 49 (P = 0.12) |
| Cohort studies | |||||
| 3 | 8815 | Lowest v. highest | HR = 2.21 (1.40 to 3.49) | 21 (P = 0.28) | |
| 3 | 8815 | Change in HR depression per 20 nmol/l change in vitamin D | β – 0.19 (–0.41 to 004) | 100 (P < 0.00001) | |
| 3 | 8815 | Vitamin D cut-off points of 50 nmol/l and 37.5 nmol/l (May et al) | HR = 1.04 (0.59 to 1.86) | 98 (P < 0.00001) | |
| 3 | 8815 | Vitamin D cut-off points of 50 nmol/l and 75 nmol/l (May et al) | HR = 1.31 (0.97 to 1.77) | 91 (P < 0.0001) | |
HR, hazard rate; OR, odds ratio.
Cross-sectional studies: forest plot of the odds ratio (OR) of depression for the lowest v. highest vitamin D categories. Squares to the right of the vertical line indicate that low vitamin D was associated with increased odds of depression, squares to the left of the vertical line indicate that low vitamin D was associated with decreased odds of depression. Horizontal lines represent the associated 95% confidence intervals and the diamond represents the overall OR of depression with low vitamin D from the meta-analysis and the corresponding 95% confidence interval (*OR provided by Dr B. Penninx, personal communication, 25 July 2011).
Cohort studies: forest plot of the hazard ratio (HR) of depression for the lowest v. highest vitamin D categories. Squares to the right of the vertical line indicate that vitamin D deficiency was associated with an increased risk of depression, whereas squares to the left of the vertical line indicate that vitamin D deficiency was associated with a decreased risk of depression. Horizontal lines represent the associated 95% confidence intervals and the diamond represents the overall HR of depression with vitamin D deficiency from the meta-analysis and the corresponding 95% confidence interval.
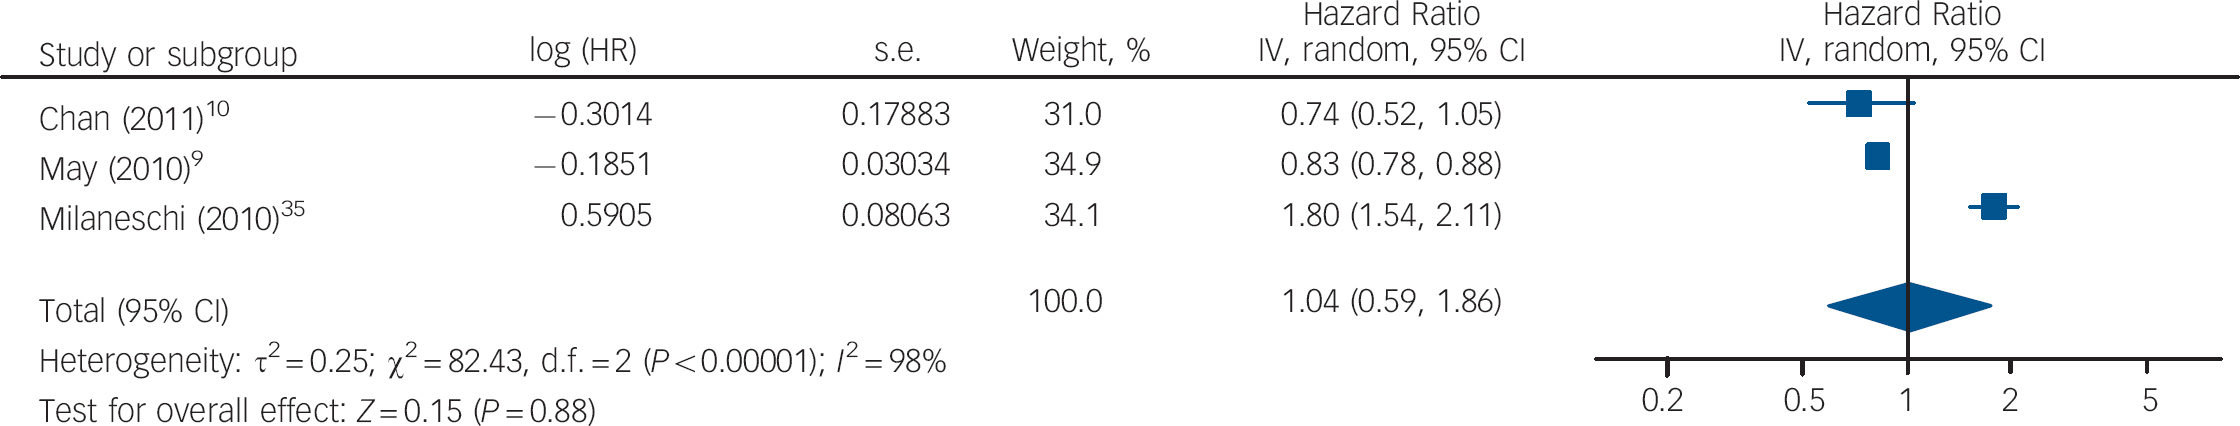
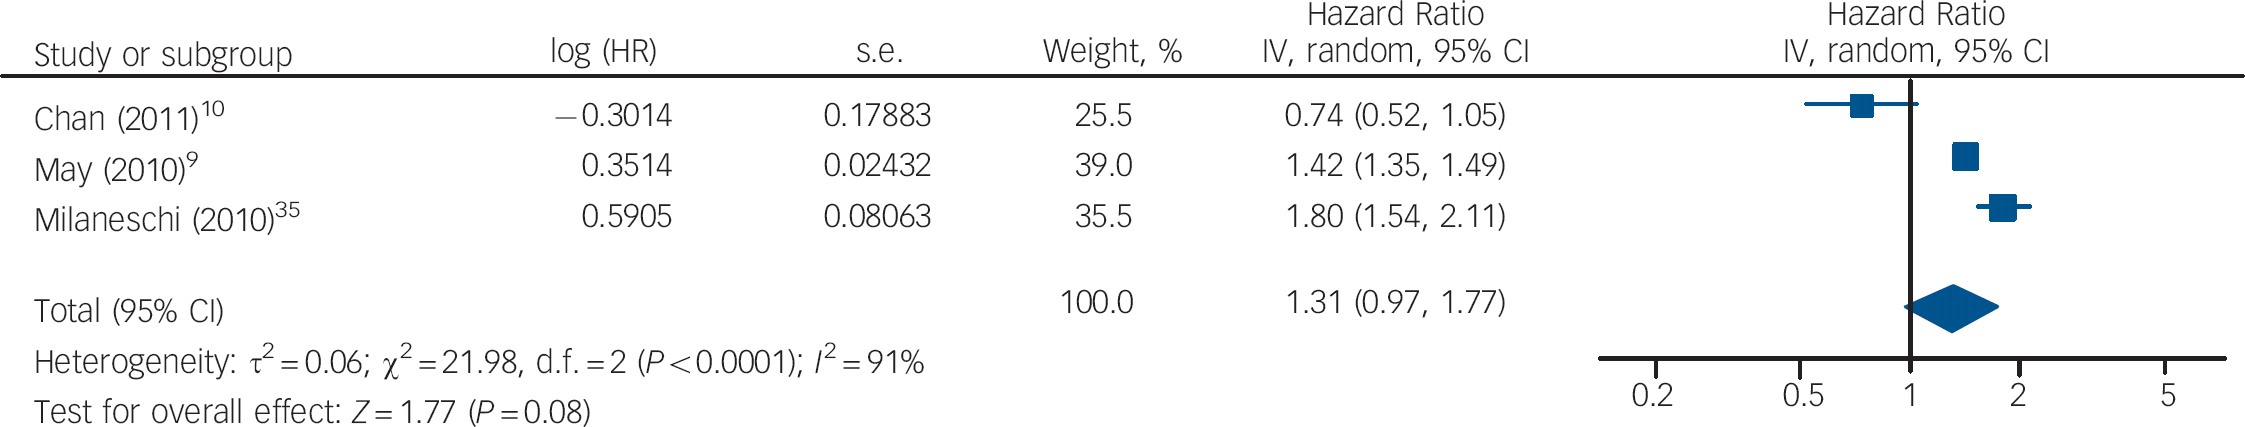
The HRs of depression for those with and without vitamin D levels below 50 nmol/l from the studies by Chan et al and Milaneschi et al were pooled with the HR of depression for vitamin D below v. above 37.5 nmol/l from the study by May et al (Fig. 5). The overall HR in this analysis was not significant (HR = 1.04, 95% CI 0.59–1.86). In the second analysis using cut-off points, the HR of depression for vitamin D below v. above 75 nmol/l from the May et al study was pooled with the other results (Fig. 6). This also gave a non-significant HR of 1.31 (95% CI 0.97–1.77). Interestingly, using the cut-off point of 75 nmol/l compared with 37.5 nmol/l changed the direction of the effect in this study. This appears to result from the highest hazard rate, and largest number of participants, being in the 37.5–75 nmol/l category. Therefore, if this group is included in the vitamin D deficient group (cut-off point 75 nmol/l), the HR suggests an increased risk of depression with vitamin D deficiency. However, if this group is included in the normal vitamin D group (cut-off point 37.5 nmol/l), the HR suggests a decreased risk of depression with vitamin D deficiency. Therefore, the effect of vitamin D deficiency at levels below 50 nmol/l cannot be reliably determined from this study.
Cohort studies: forest plot of the change in the natural logarithm of the hazard rate ln(HR) of depression per 20 nmol/l change in vitamin D using trend estimation. Squares to the right of the vertical line indicate a positive slope or increased risk of depression with increased vitamin D levels, whereas squares to the left indicate a negative slope or decreased risk of depression with increased vitamin D levels. Horizontal lines represent the associated 95% confidence intervals and the diamond represents the overall change in ln(HR) of depression per 20 nmol/l change in vitamin D from the meta-analysis and the corresponding 95% confidence interval.
Cohort studies: forest plot of the hazard ratios (HR) of depression with vitamin D deficiency using cut-off points of 50 nmol/l and 37.5 nmol/l (see caption to Fig. 3 for explanation of symbols).
Cohort studies: forest plot of the hazard ratios (HR) of depression with vitamin D deficiency using cut-off points of 50 nmol/l and 75 nmol/l (see caption to Fig. 3 for explanation of symbols).
No planned subgroup or sensitivity analysis could be performed because of insufficiently reported data and inability to obtain such data from authors.
Discussion
Our systematic review identified one case–control study, ten cross-sectional studies and three cohort studies investigating the association between depression and vitamin D deficiency, but no randomised controlled trial. The single case–control study showed a moderate difference in vitamin D levels between women with depression and healthy controls. Meta-analysis of the cross-sectional studies demonstrated an increased but non-significant odds of depression for the lowest compared with the highest vitamin D categories (OR = 1.31, 95% CI 1.00–1.71, P = 0.05). Limiting the analysis to studies with an average participant age of 65 years or over did not substantially change the overall estimate or statistical significance. There was considerable variability in the vitamin D categories used in the cohort studies, and therefore three different meta-analyses were performed. Our pooled HR of the lowest compared with the highest vitamin D categories in the three cohort studies showed a significantly increased HR of depression with low vitamin D levels (HR = 2.21, 95% CI 1.40–3.49, P<0.001). The pooled change in ln(HR) of depression per 20 nmol/l change in vitamin D level across the three cohort studies also showed an increased hazard of depression with decreasing vitamin D concentration, although this was not significant (β–0.19, 95% CI −0.41 to 0.04, P = 0.1). Finally, we analysed the data using different cut-off points as provided in the studies, which yielded different but non-significant pooled HR: 1.04 (95% CI 0.59–1.86) v. 1.31 (95% CI 0.97–1.77). Overall, the summary estimates of all analyses suggest a relationship between vitamin D and depression, and all but one were close to being statistically significant.
Strengths and limitations
To the best of our knowledge this is the first systematic review or meta-analysis that has analysed the relationship between vitamin D deficiency and depression. We performed a transparent and methodologically rigorous systematic review of the literature. We developed a comprehensive search to identify articles and assessed their eligibility, extracted data and assessed risk of bias in each study in duplicate with a good level of agreement. Our protocol was developed a priori and any post hoc analyses were clearly identified. A particular strength was the method used and extensive analyses performed in an attempt to present the data in a uniform and consistent manner to allow for comparison and combination. We were also successful in obtaining supplemental information from several authors, which allowed us to include the majority of studies.
There are several limitations to our systematic review. As, at the time of our review, there was no RCT of vitamin D for depression our review was restricted to observational studies, which usually yield lower-quality evidence than RCTs. Reverse causality, in which patients with depression have less exposure to the sun and therefore lower vitamin D levels, cannot be ruled out in the cross-sectional studies. In addition there were potential biases across all study designs. Several cross-sectional studies had unrepresentative samples, used self-reports of depression and had small sample sizes. The study results were generally consistent, with the exception of those from Pan et al who reported a decreasedoddsofdepression withlow vitaminD. Reference Pan, Lu, Franco, Yu, Li and Lin11 This was the only cross-sectional study conducted in China, and geographical differences in the nature and prevalence of vitamin D deficiency and depression might explain their discrepant findings. One small study could not be included in the quantitative analysis as insufficient information was available; it found an increased prevalence of depression with vitamin D deficiency Reference Johnson, Fischer and Park20 and therefore it is unlikely that it would have significantly affected our findings. Most studies adjusted for multiple confounders; however, unadjusted data were used to generate an odds ratio for one study where an adjusted OR was not provided. Reference Wilkins, Birge, Sheline and Morris39 All the cohort studies had problems with bias and the largest one had a high risk of bias. Publication bias could not be ruled out, and it is possible that additional cohort studies have measured vitamin D and depression but not reported negative results. The majority of the meta-analyses of the cross-sectional studies and cohort studies had significant heterogeneity and lacked precision. Studies used variable definitions of vitamin D deficiency, and therefore we performed analyses using the lowest v. highest vitamin D categories and different cut-off points rather than adhering to a strict definition of deficiency. As a result of these limitations the overall quality of the evidence from each study is low and therefore some uncertainty remains about the true association between vitamin D deficiency and depression.
Implications of the study
The importance of vitamin D to many brain processes including neuroimmunomodulation and neuroplasticity suggests that it might have a role in psychiatric illness such as depression. The biological plausibility of the association between vitamin D and depressive illness has been strengthened by the identification of vitamin D receptors in areas of the brain implicated in depression, Reference Eyles, Smith, Kinobe, Hewison and McGrath4 the detection of vitamin D response elements in the promoter regions of serotonin genes, Reference Wang, Tavera-Mendoza, Laperriere, Libby, MacLeod and Nagai60 and demonstration of interactions between vitamin D receptors and glucocorticoid receptors in the hippocampus. Reference Obradovic, Gronemeyer, Lutz and Rein61 Given the high prevalence of both vitamin D deficiency and depression, an association between these two conditions would have significant public health implications, particularly as supplementation with vitamin D is cost-effective and without significant adverse effects. The observational studies to date provide some evidence for a relationship between vitamin D deficiency and depression, but RCTs are urgently needed to determine whether vitamin D can prevent and treat depression.
Acknowledgements
We thank Neera Bhatnager, librarian, McMaster University Health Sciences Library, for her assistance in developing the search strategy and Peter Szatmari for his critical review of the manuscript.


eLetters
No eLetters have been published for this article.