


Introduction
Ecological degradation leads to the loss of valuable ecosystem services and creates many potentially negative socioeconomic consequences at various scales (Scott et al., Reference Scott, Pierce, Pasqualetti, Jones, Montz and Hoover2011). Economists often use housing prices to capture (at least partially) the social costs of decreased ecological quality, including those associated with water quality and its preservation (Wilson and Carpenter, Reference Wilson and Carpenter1999; Spanou et al., Reference Spanou, Kenter and Graziano2020). Among the many sources of ecological pressure on U.S. water systems, waterborne pathogenic Escherichia coli (E. coli) can cause immediate and potentially lethal effects on human health (Ishii and Sadowsky, Reference Ishii and Sadowsky2008). E. coli also constitutes a pressing issue due to an increased rate of outbreaks driven by climate change, especially in the Laurentian Great Lakes basin (GLB) (Patz et al., Reference Patz, Vavrus, Uejio and McLellan2008). Although bacteria levels in water decrease over time, E. coli can remain in sediments along the shores or on beaches, thus continuing to affect water quality and making outbreaks more likely over time (Davies et al., Reference Davies, Long, Donald and Ashbolt1995). In Michigan, these outbreaks have become a growing issue for both inland and coastal communities, especially in rural counties. According to the state’s website, roughly half of Michigan’s water bodies exceed the EPA’s water quality standard for E. coli as of early 2024.Footnote 1
Given the harmful effects of E. coli and its prevalence in Michigan, it is important to quantify these effects to help design efficient mitigation policies. In this study, we use hedonic pricing models and nonwater-clarity-based approaches to estimate the effect of E. coli outbreaks in freshwater streams on housing prices across Michigan. To assess the effects of these outbreaks, we use point-level measurements conducted by Michigan’s Environment, Great Lakes, and Energy Department (EGLE), combined with Zillow point-level housing transaction data from 2009 to 2017. We first establish a baseline model using a traditional hedonic framework, where we regress the log of the sales price on the distance from the nearest outbreak along with a set of covariates and fixed effects and find that houses closer to outbreaks see a decline in sales price. Following Currie et al. (Reference Currie, Davis, Greenstone and Walker2015), Haninger et al. (Reference Haninger, Ma and Timmins2017), and Tanaka and Zabel (Reference Tanaka and Zabel2018), we next employ a difference-in-differences (DID) model to capture the effect of recent E. coli outbreaks on the sales price of nearby houses. This DID approach mitigates the omitted variable bias and endogeneity concerns associated with the distance to E. coli outbreaks and is widely used in quantifying the value of environmental attributes.
Our main results suggest that proximity to E. coli outbreaks negatively affects housing prices and that these effects are heterogeneous across multiple distances. After controlling for housing characteristics and spatial fixed effects, our preferred DID regressions reveal that proximity to E. coli outbreaks leads to an 8.9% price drop for houses sold during the outbreaks, which is over $13,000 for the average house. However, these effects do not persist past an interim period.
This study contributes to the literature linking property values and water quality. First, it is the first to exploit a large dataset linked to water bodies across the entire state of Michigan over more than a decade. Second, while there have been many studies that quantify the impacts of various water quality variables on housing prices, few focus on E. coli despite its risk. Our estimates will present a baseline of comparison for future research.
The remainder of this article proceeds as follows. We first review the relevant literature on hedonic analyses related to water quality and provide background information on water quality issues in Michigan. Next, we describe the data used in this study, followed by a summary of the empirical models we employ. We then present the main results along with policy implications before the concluding section.
Background
Food and waterborne illnesses are one of the leading causes of morbidity worldwide, with diarrheal diseases in particular accounting for approximately 1.8 million deaths each year. Although most cases are found in developing countries, there are still about 76 million cases of foodborne illness in the U.S. each year, resulting in around 5,000 deaths annually (Ishii and Sadowsky, Reference Ishii and Sadowsky2008).
One of the leading causes of waterborne illnesses is the bacteria E. coli. Although E. coli is naturally found in the intestines of humans and animals and is typically harmless, some strands can cause severe illness or even death. Some of the most dangerous strains are thought to originate from untreated human sewage as well as animal waste (Ishii and Sadowsky, Reference Ishii and Sadowsky2008). Since these sources can travel through runoff into nearby waterways, officials typically rely on water samples to detect dangerous levels of E. coli. These samples are compared to water quality standards to determine if action should be taken. In Michigan, for example, the state has set a standard of a daily maximum of 300 E. coli per 100 ml of water, or a geometric mean across 30 days of no more than 130 E. coli per 100 ml of water. As of 2024, the state of Michigan estimates that over half of Michigan’s waterbodies exceed these levels, and about 20% of monitored beaches have been closed recently due to bacterial pollution (EGLE, 2024). Regarding the Great Lakes, although Lake Michigan’s E. coli and swimming advisories have decreased in recent years, E. coli still affects more than 10% of Lake Michigan beaches and almost 90% of beaches in western Lake Erie (Weiskerger and Whitman, Reference Weiskerger and Whitman2018).
There are three main mechanisms through which the state makes outbreaks public. First, when a waterbody exceeds a water quality standard, a total document daily load (TMDL) document is required by the Federal Clean Water Act. A TMDL shows the recorded levels of E. coli, its likely sources, and possible regulatory solutions, but does not require any action to be taken. E. coli measurements, potentially dangerous waterbodies, and current TMDL’s are made public through EGLE’s website. The second way that E. coli outbreaks are made public is through outdoor signs installed by the state near afflicted waterbodies. Finally, the Michigan Sellers Disclosure Act of 1993 requires sellers to notify buyers of recent environmental problems.
Although Michigan tracks E. coli levels throughout the state and warns the public of outbreaks, there are currently no Michigan laws that regulate these levels. When state governments consider potential policies, they typically undertake a cost–benefit analysis. A cost–benefit analysis associated with a policy to reduce E. coli levels requires damage estimates. One approach, used by the USDA Economic Research Service (ERS) in 2013 and updated in 2018, is to identify the different ways E. coli has impacted society, estimate the dollar amount of each, and add them up. The USDA-ERS identified medical costs, productivity loss, and deaths as the main human damages due to E. coli. The sum of the damages for the entire U.S. was close to 300 million dollars (Hoffmann and Ahn, Reference Hoffmann and Ahn2021). Another common strategy is the benefit transfer approach, which uses preexisting estimates in one setting to predict measure of economic value in a different setting (Johnston et al., Reference Johnston, Boyle, Loureiro, Navrud and Rolfe2021). The benefit transfer approach is often used to support decision making based on cost–benefit analysis when time or funding for a new study is cost prohibitive. However, the lack of previous estimates of the economic impact E. coli on housing prices makes this option unavailable to current decision makers.
A different approach commonly used in economics is to estimate damages through stated or revealed consumer preferences. The stated preference approach uses a survey to ask, for example, if a respondent would vote for a tax intended to clean up a lake (Meyer, Reference Meyer2020), or if a respondent would prefer one environmental over another with different attributes. The revealed preference method, on the other hand, is based on observed data of the choices people made.
One of the most common techniques in the revealed preferences literature is known as the hedonic method (Rosen, Reference Rosen1974). In the context of house sales, the hedonic method captures a world where buyers and sellers of new or existing houses are assumed to reach an equilibrium point where neither can be made better off without losing utility. This implies a relationship between housing prices and housing characteristics that reveal a consumer’s willingness to pay for certain housing characteristics (Bishop, et al., Reference Bishop, Kuminoff, Banzhaf, Boyle, von Gravenitz, Pope and Timmins2020). While these characteristics include the physical characteristics of the house, such as the number of bathrooms, they also include amenities and disamenities located in the region. This makes the hedonic method one of the main tools that economists have used to estimate the costs of both air and water pollution.
The literature of hedonic studies related to water quality has grown over time as the availability of water quality data improved. One of the key decisions in these studies is the choice of water quality variable. Heberling et al. (Reference Heberling, Guignet and Papenfus2024) conducted a meta-analysis of hedonic models that use water quality and found studies based on water clarity, nutrients, sediment, biochemical factors, and bacteria. Of the studies on the effects of bacteria on housing prices, most focused on fecal coliform. For example, one of the earliest hedonic water quality studies by Leggett and Bockstael (Reference Leggett and Bockstael2000) studied the effects of fecal coliform on housing prices around Chesapeake Bay and found that an increase of 100 fecal coliform counts per 100 ml produced an approximate 1.5% decrease in property prices. However, Heberling et al. (Reference Heberling, Guignet and Papenfus2024) only found one paper that focused on the effects of E. coli. Netusil et al. (Reference Netusil, Kincaid and Chang2014) studied two watersheds in the U.S. Northwest and found that an increase of 100 count per 100 ml increase in E. coli decreased housing prices from −.71% to −2.90% depending on the distance to the stream and the econometric model used. Our research provides an additional estimate of the effects of E. coli on housing prices to help fill the void in this literature.
The welfare effects of water pollution are particularly important to Michigan, which has long relied on its freshwater as a resource to boost economic development, whether using it to harvest natural resources, to support its manufacturing sector, or as a way for transporting goods to and from the Atlantic Ocean (Steinman et al., Reference Steinman, Cardinale, Munns, Ogdahl, Allan, Angaldi, Bartlett, Brauman, Byappanahalli, Doss, Dupont, Johns, Kashian, Lupi, McIntyre, Miller, Moore, Muenich, Poudel, Price, Provencher, Rea, Read, Renzetti, Sohngen and Washburn2017). Michigan’s Freshwater is also a major source of employment – a 2007 study estimates that 2.7 million Michigan jobs are linked to the Great Lakes (Allen-Burton et al., Reference Allen-Burton, Scavia, Luooma, Love and Austin2010). The state currently faces a highly fragmented wastewater policy landscape, which allocates most of the monitoring and implementation powers to counties and county subdivisions. As a result, decades of industrial and agricultural pollution combined with the fragmented water policy have led to several water quality issues across the state (Allen-Burton et al., Reference Allen-Burton, Scavia, Luooma, Love and Austin2010). Brashares (Reference Brashares1985) studied 78 lakes in southeast Michigan and found that fecal coliform had a negative effect on the sales price of lakefront houses. Rabinovici et al. (Reference Rabinovici, Bernknopf, Wein, Coursey and Whitman2004) found that the closure of an average Michigan lake could create an economic loss of up to $37,000 per day based on a benefit transfer analysis. Wolf and Klaiber (Reference Wolf and Klaiber2017) found that algal blooms in Lake Erie resulted in $2.25–$5.58 million in losses to the fishing industry. To our knowledge, however, there are no papers that focus on the effects of E. coli on housing prices in Michigan. By using home sales and water quality information across Michigan, our study fills a gap in the literature on valuing Michigan water quality, which is crucial for policymakers to design cost-effective regulations.
Data
We combine two fine-grain datasets that cover the entire state of Michigan. The first dataset we derive from Zillow residential housing transaction data for single-family homes (ZTRAX)Footnote 2 from 2009 to 2017. ZTRAX lists sales prices, latitude and longitude, and various housing characteristics including total bedrooms, total bathrooms, lot and building square footage, and number of stories for all properties posted on Zillow. The full dataset over 9 years includes almost half a million observations, but for our main results we drop a number of observations that may be considered outliers. As a first step, we drop observations where the sales price was less than $10,000 to avoid “arm’s length” transactions. From this sample, we further restrict the sample to houses that have less than 10 bedrooms and/or 50 total rooms, sold for less than $1,000,000, and have less than 1,000,000 square feet. We also removed houses that were labeled as having zero bedrooms. The remaining subset contains 195,331 observationsFootnote 3 . Finally, we control for housing inflation by converting sales prices to 2017 dollars using the Case-Shiller home price index.
The second dataset we use is EGLE’s publicly available data on E. coli point-level measurements over the same period as the housing data. The sampling process follows recommended scientific guidelines. At each site of interest, a sample is taken along with samples to the left and right of the site. These three samples are taken to a lab, and the E. coli colonies are counted. The three samples are then averaged and compared to the water quality standard. The location of sample sites varies from year to year. The E. coli data set is geo-coded, allowing us to estimate the precise proximity of each house to an E. coli outbreak. Within the EGLE database, we drop all points whose samples were below the risk levels considered by the states. These risk thresholds are:
-
1. 30-day geometric mean across three sample points greater than 100 E. coli/ml: OR
-
2. Daily maximum geometric mean of greater than 300 E. coli/ml
These values are slightly more restrictive than those imposed by Michigan but in line with those used by neighboring states.
E. coli outbreaks that occur through water are typically the result of increases in rainfall or melting snow (Griffith et al., Reference Griffith, Weisberg and McGee2003; Roslev and Bukh, Reference Roslev and Bukh2011). With a relatively low die off rate, once E. coli enters a waterway it can travel large distances away from the source through the available network of rivers and streams (Foppen and Schijven, Reference Foppen and Schijven2006). Between the randomness of precipitation events and the ability to travel long distances from the source, we consider E. coli outbreaks as exogenous to the sales price of a house. Figure 1 displays the correlation between house sales prices and E. coli outbreaks throughout Michigan from 2009 to 2017. The highest correlation is in the lower half of the lower peninsula of Michigan, particularly near the middle. In total, there were 3,763 samples above limits throughout our ten-year study period.
E. coli outbreaks in Michigan, 2009–2017. Note: location of houses is not displayed to protect privacy and data confidentiality.

We merge the Zillow housing transaction data with E. coli outbreak data and use ArcGIS Pro and PyCharm to calculate the nearest distance in miles from a particular house to an E. coli outbreak above the state risk thresholds that occurred after the sales date of the house. We also calculate the number of days since the outbreaks occurred. Table 1 shows the summary statistics of our variables.
Summary statistics

Empirical models
Since Rosen’s seminal work (Rosen, Reference Rosen1974), the hedonic property value model has become the workhorse model to reveal the marginal values for nonmarket characteristics. The main idea of a hedonic model is that a product’s price represents a package of attributes – in the case of houses, this includes not only the square footage, number of bedrooms, etc., but also location-specific attributes such as environmental quality. By regressing the observed sales prices on these attributes, we can recover an estimate for the marginal values for being located at various distances from an E. coli outbreak.
A criticism of hedonic property values is the potential for omitted variable bias. Specifically, we are only able to control for a limited number of characteristics – even highly detailed housing datasets will inevitably leave out features that are valued by potential homeowners. These omitted features will be captured by the error term, and if they are correlated with E. coli outbreaks the coefficient of interest will be biased.
Given the potential for omitted variable bias in a hedonic model, we next employ a DID model. A DID model assigns houses to a control group – in our case, houses that were not affected by an E. coli outbreak- and a treatment group for houses that were affected. Although their average prices may differ before an outbreak, we assume that they are trending in a similar direction. After an E. coli outbreak, average prices for untreated houses should continue along the same trend, while treated houses will follow a different trend if E. coli outbreaks influence the price. While we prefer the DID model, we include the hedonic estimates as a point of comparison between two popular approaches in the literature. Differences between the two estimates may also point to the effect of omitted variable bias in the hedonic approach.
Hedonic property value model
In our baseline model specification, the dependent variable ${y_{it}}$
is the log-transformed housing transaction price, adjusted by the S&P/Case-Shiller U.S. National Home Price Index to 2017 dollars. We can parsimoniously write our model as
${y_{it}}$
is the log-transformed housing transaction price, adjusted by the S&P/Case-Shiller U.S. National Home Price Index to 2017 dollars. We can parsimoniously write our model as
 $$y_{ite} = \alpha+ \beta_1 dist_{ite}+\beta_2 days_{ite}+ \theta X_i+\eta_{t}+\eta_e+\epsilon_{it},$$
where $dis{t_{ite}}$
is the distance between house
$dis{t_{ite}}$
is the distance between house $i$
sold in year
$i$
sold in year $t$
and the nearest E. coli outbreak
$t$
and the nearest E. coli outbreak $e$
occurring before the sales date;
$e$
occurring before the sales date; $day{s_{ite}}$
is the number of days since the outbreak was reported;
$day{s_{ite}}$
is the number of days since the outbreak was reported; ${X_{it}}$
is a vector containing the set of housing characteristics;
${X_{it}}$
is a vector containing the set of housing characteristics; $\alpha $
is the intercept; and, is the idiosyncratic error term. We use
$\alpha $
is the intercept; and, is the idiosyncratic error term. We use ${\eta _t}$
and
${\eta _t}$
and ${\eta _l}$
to represent year and month fixed effects and school district fixed effects, respectively, which account for the time- and location-invariant unobserved characteristics. Finally, we use the outbreak-level fixed effect
${\eta _l}$
to represent year and month fixed effects and school district fixed effects, respectively, which account for the time- and location-invariant unobserved characteristics. Finally, we use the outbreak-level fixed effect ${\eta _e}$
to capture idiosyncratic factors related to a particular outbreak. We cluster standard errors at the outbreak level.
${\eta _e}$
to capture idiosyncratic factors related to a particular outbreak. We cluster standard errors at the outbreak level.
Our main parameter of interest is ${\beta _1}$
, which measures the buyers’ marginal willingness to pay for being away from an E. coli outbreak. Since we measure the distance to an E. coli outbreak as distance from (rather than the proximity to) an outbreak, we hypothesize that
${\beta _1}$
, which measures the buyers’ marginal willingness to pay for being away from an E. coli outbreak. Since we measure the distance to an E. coli outbreak as distance from (rather than the proximity to) an outbreak, we hypothesize that $\beta $
is positive, suggesting that houses further away from an E. coli outbreak would sell for a higher price. We also estimate a model that includes a quadratic functional form for distance to capture possible nonlinear effects. We next employ a DID model to mitigate potential omitted variable concerns.
$\beta $
is positive, suggesting that houses further away from an E. coli outbreak would sell for a higher price. We also estimate a model that includes a quadratic functional form for distance to capture possible nonlinear effects. We next employ a DID model to mitigate potential omitted variable concerns.
Difference-in-differences model
Our strategy follows the approach of Currie et al. (Reference Currie, Davis, Greenstone and Walker2015), Haninger et al. (Reference Haninger, Ma and Timmins2017), and Tanaka and Zabel (Reference Tanaka and Zabel2018) in employing a DID model based on distance from the treatment, in our case an E. coli outbreak.Footnote 4 Within a certain distance, houses are similar enough that we can consider them a local market, but we can still separate the market into a treatment and control group. Most E. coli outbreaks are local, and we use a radius of 3 km from an E. coli outbreak to determine local neighborhoods, which is similar to Haninger et al. (Reference Haninger, Ma and Timmins2017). The treatment group consists of houses that are particularly close to the outbreak, while houses farther away are in the control group.
Let $TREA{T_{it}}$
be a dummy variable that equals 1 if house
$TREA{T_{it}}$
be a dummy variable that equals 1 if house $i$
is within this boundary and belongs to the treatment group, and 0 if the house belongs to the control group. Let
$i$
is within this boundary and belongs to the treatment group, and 0 if the house belongs to the control group. Let $POS{T_{it}}$
equal 1 if a house is sold after an E. coli outbreak, and 0 if it is sold before the outbreak. We can then state the DID model as:
$POS{T_{it}}$
equal 1 if a house is sold after an E. coli outbreak, and 0 if it is sold before the outbreak. We can then state the DID model as:
 $$\;{y_{it}} = \;{\beta _0} + {\beta _1}TREA{T_{it}} + {\beta _2}POS{T_{it}} + {\beta _3}TREA{T_{it}}*POS{T_{it}} + {\varepsilon _{it}},$$
where ${y_{it}}$
is the log of the sale price of home
${y_{it}}$
is the log of the sale price of home $i$
at time
$i$
at time $t$
, and is the error term that contains unobserved factors. The variable of interest,
$t$
, and is the error term that contains unobserved factors. The variable of interest, ${\beta _3}$
, captures the difference in the expected value of
${\beta _3}$
, captures the difference in the expected value of ${y_{it}}$
for houses in the treatment group versus the expected value of
${y_{it}}$
for houses in the treatment group versus the expected value of ${y_{it}}$
in the control group. Specifically:
${y_{it}}$
in the control group. Specifically:
 $$\eqalign{ & {\beta _3} = \left( {E\left[ {y_{it}^1{\rm{|}}TREAT = 1} \right] - E\left[ {y_{it}^0{\rm{|}}TREAT = 0} \right]} \right) \cr & \quad \quad \quad \quad - (E\left[ {y_{it}^0{\rm{|}}TREA{T_{it}} = 0} \right] - E\left[ {P_{it}^0{\rm{|}}TREA{T_{it}} = 0} \right),\; \cr} $$
where the superscripts equal 1 if the house is in the E. coli treatment group in the counterfactual state, and 0 if the house is in the E. coli control group in the counterfactual state.
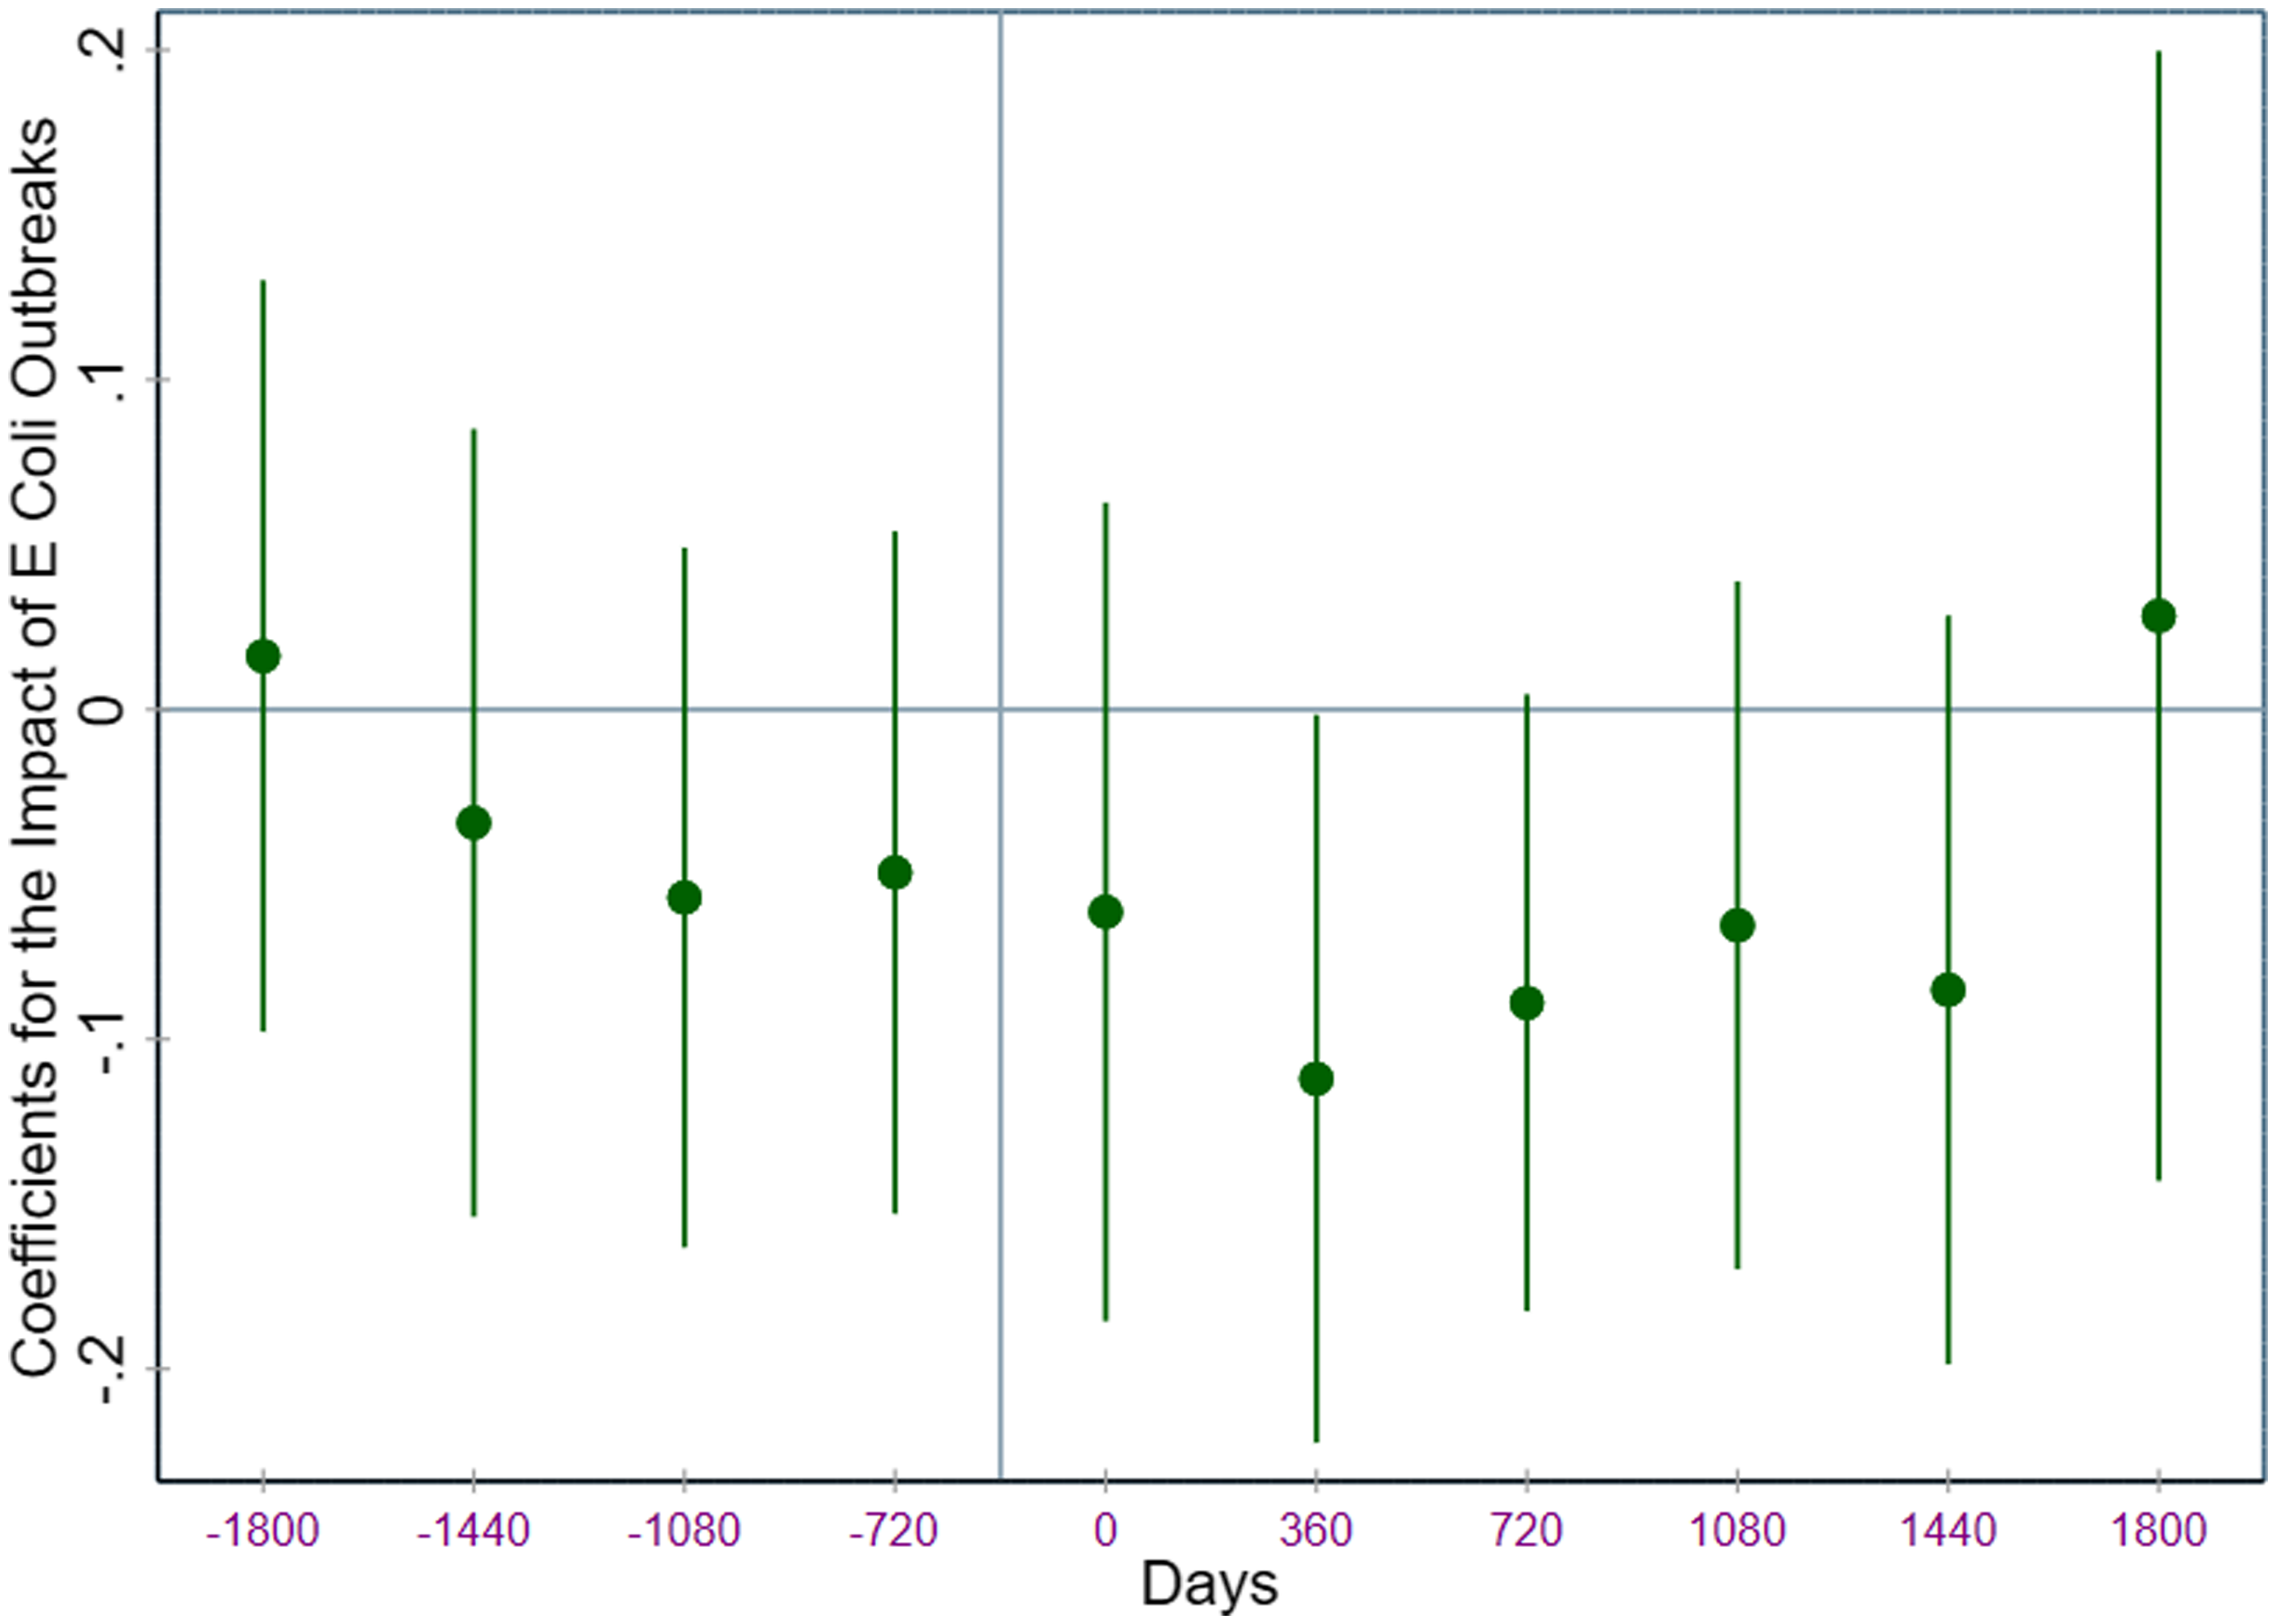
The main identifying assumption of equation (3) is the parallel trend assumption, where the sales prices leading up to an E. coli outbreak follow the same trend in both the treatment and control groups. In Figure 2 we visualize the results of an event study to investigate the validity of this assumption. This event study uses 360 day intervals to track the evolution of the coefficient of interest, before and after an E. coli outbreak.Footnote 5 Ideally, the coefficient would be zero before an E. coli outbreak, which is satisfied as the 95% confidence intervals overlap the x-axis. Following an E. coli outbreak, we would expect negative, statistically significant coefficients. This appears to be the case for the near term, with the effect dissipating over time.
Coefficients of the impact of E. coli outbreaks at 360 day intervals. Day zero indicates the initial outbreak of E. coli. Vertical lines represent 95% confident intervals.
Although Figure 2 offers suggestive evidence that the parallel trends assumption is satisfied, without additional covariates to control for observable characteristics, this assumption may be too strong. As a result, we include additional covariates including housing characteristics, time and location fixed effects, and outbreak fixed effects:
 $${y_{it}} = {\beta _0} + {\beta _1}TREA{T_{it}} + {\beta _2}POS{T_{it}} + {\beta _3}TREA{T_{it}}*POS{T_{it}} + \theta {X_{it}} + {\eta _i} + {\eta _t} + {\eta _k} + {\varepsilon _{it}},$$
To estimate the impact of E. coli outbreaks, we need to identify the treatment buffer zone in which an outbreak influences houses that are sufficiently close (TREAT= 1), while not influencing those that are sufficiently far away (TREAT = 0). Figure 3 shows a histogram of the distance of outbreaks to treatment houses, which we use to guide this analysis. Following Haninger et al. (Reference Haninger, Ma and Timmins2017), we first control parametrically for housing attributes, and then nonparametrically estimate housing price gradients over distance for houses close to E. coli outbreaks before and after the E. coli outbreaks separately. We then determine the distance threshold by identifying the point where these two price gradients converge using a nonparametric approach, meaning that beyond this distance, housing prices before the E. coli outbreak are not statistically different from those sold after the outbreak. If home buyers disliked the E. coli outbreaks, we should observe a lower price for houses within a distance threshold of the outbreak following that event. Moreover, we expect to see no differential patterns in housing prices outside this treatment buffer.
Distance from houses to outbreaks for treatment observations in the DID regressions.

Figure 4 plots the estimated price gradients over distance to the nearest E. coli outbreak for houses sold before and after an outbreak. As expected, the prices of houses sold after the outbreaks are noticeably lower than those before the outbreaks, up to approximately one mile away, where the 95% confidence intervals of the two price gradients start to overlap. Figure 4 further breaks down the sale timing as before, during, and after the outbreak, and it reveals that beyond one mile, the three confidence intervals largely overlap, especially for houses sold during and before the outbreaks. This graphical evidence suggests that E. coli outbreaks dampen nearby housing prices and provides support to our DID approach of classifying houses within and outside one mile of an outbreak as the treatment and control groups, respectively.
Nonparametric estimates of housing price gradient with 95% confidence intervals for houses in Michigan sold before and after E. coli outbreaks.

Our data on E. coli outbreaks are unique in that the outbreak has a recorded start and end date, which we label the interim period. This period might also be thought of as the short-term effect of E. coli on housing prices once an outbreak has been made public. In our dataset, the average interim period is about three months (86 days). Therefore, to further quantify the potential differential impacts on houses sold during versus after E. coli outbreaks we include the dummy variable INTERIM. If a house is sold in between the E. coli outbreak starts and end date for the nearest outbreak, we denote this sale as sold during the outbreak, and thus INTERIM equals 1. Our variable of interest for this scenario is an interaction term between INTERIM and TREAT, which measure the impact of outbreaks on houses within the 1-mile buffer during the interim period. In addition, we use POST = 1 to denote the houses sold after the end date of the nearest E. coli outbreak.
 $$\eqalign{ & {y_{it}} = \;{\beta _0} + {\beta _1}TREA{T_{it}} + {\beta _2}POS{T_{it}} + \;{\beta _3}TREA{T_{it}}{\rm{*}}POS{T_{it}} + {\beta _4}INTERI{M_{it}} \cr & \quad \quad \quad + \;{\beta _5}TREA{T_{it}}{\rm{*}}INTERI{M_{it}} + \theta {X_{it}} + \;{\eta _i} + \;{\eta _t} + {\eta _k} + {\varepsilon _{it}}. \cr} $$
Results
Hedonic model results
We first present the results of the baseline hedonic property value model. Note that, for comparison, we use the same estimating sample in the hedonic regressions and DID regressions. Table (2) shows the regression coefficients for the distance to the nearest E. coli outbreak after controlling for a set of housing characteristics and various fixed effects. All three specifications use the log of housing sales prices as the dependent variable. Column (1) is a simple regression analysis using only the variable of interest, distance, as a control variable. Column (2) adds the distance to the waterbody and its square, days since the outbreak, housing characteristics and year by month fixed effects. Column (3) further adds school district and outbreak fixed effects.
Hedonic model

* p < 0.05, ** p < 0.01, *** p < 0.001. Robust standard errors in parenthesis.
The estimated coefficient on distance from outbreak is positive in all three models, which aligns with our intuition – houses that are farther away from an outbreak sell for a higher price relative to houses that are closer. With the semi-log functional form, the magnitude of the coefficient varies from 1.39% to 3.06%, although the model with the full complement of fixed effects was not significant at the 5% level. The signs on the housing characteristics are intuitive, as increases in lot size, house size, number of bathrooms, and number of stories lead to increases in sales prices.
Although the sign on distance from outbreak is intuitive, the mixed results for statistical significance, as well as the possibility of omitted variable bias, cast some doubt on the reliability of the results. In the next section we show the results for the DID model, which uses a quasi-experimental method to better control for omitted variable bias.
Difference-in-differences results
Table (3) shows the regression results for three specifications of the DID model. In this model, we keep all observations before and after an outbreak, as opposed to the hedonic model in which we only keep post-outbreak observations. However, we subset the data for the DID model to a radius of three miles around each outbreak to keep the neighborhoods and houses relatively homogeneous between treatment and control groups. We define the treatment observations as houses within a one-mile radius from the outbreak, while the control observations are between one and three miles from the outbreak.
Difference-in-difference results

* p < 0.1, ** p < 0.05, *** p < 0.01. Robust standard errors in parentheses.
We again start with a parsimonious baseline model to evaluate the evolution of the coefficient of interest (Treat * Post) (as we control for additional factors). Since the E. coli dataset includes a “start” and “end” date for the E. coli outbreak, we also include an interaction between Treat and a dummy variable interim that equals 1 if the house sale was between the start and end date, and 0 if it was not.
In Table 3, Column (1) shows the results for the simple DID model. The coefficient on treat is negative and statistically significant (p < .01). Column (2) further controls for housing characteristics, days since the outbreak, and year and month fixed effects. Column (3) adds fixed effects for school districts and outbreaks. Based on our preferred specification in column (3), the coefficient on (Treat * Post) is –0.0104 but is not statistically significant. However, the coefficient on (Treat*Interim), at –0.0894 and is statistically significant (p < .01). These two results imply that housing first prices see an immediate decrease of 8.94% following an E. coli outbreak, but the decrease in prices is not permanent (since treat*post is not significant). In our sample the average house sells for $151,923, therefore an estimate of the average decrease in housing prices during the interim period is $13,582.
Robustness checks
Recall that our results from Table (3) used a cutoff radius of 1 mile. That is, every house within a mile of the outbreak was considered “treatment”, while every house between 1 and 3 miles was considered “nontreatment”. Table (4) shows the results for models that vary this cutoff. Column (1) uses a slightly smaller radius of 0.9 miles, while columns (2) and (3) use a radius of 1.1 and 1.2 miles, respectively. With the smaller radius, the model does not pick up the long-term effects of an E. coli outbreak, with the coefficient on TREAT*POST not significant. However, models with a 1.1- and 1.2-mile cutoff showed a statistically significant coefficient on TREAT*POST at the 10% and 5% significance level, respectively. On the other hand, the short-term effect of E. coli on housing prices, captured by the variable TREAT*INTERIM, are significant regardless across all models (p < .01). The value of the coefficients implies a decrease in house sales prices of 7.46% to 8.65%, which are close to our estimate of 8.94% in Table (3).
Robustness checks

* p < 0.1, ** p < 0.05, *** p < 0.01. Robust standard errors in parentheses.
An additional consideration is the source of water for each house. Although our dataset did not include this information, we attempted to proxy for it using several methods. First, we used a subset of houses that were within 1 mile of the Great Lakes. With the DID framework, we found a long-term impact of approximately -11%. We also ran a model with county fixed effects instead of school district fixed effects, which gave similar results to the main model.Footnote 6
Conclusions and discussion
In this article, we use point-level data and a quasi-experimental design along with a standard linear hedonic model to estimate the effects that proximity to an E. coli outbreak exercises on housing prices. Our results show that E. coli outbreaks negatively affect housing prices by at least 8.9% for houses within one mile of the outbreak. However, these effects are very sensitive to time, and they decrease as days pass from the last outbreak affecting the transaction. The combination of these two factors possibly signals a lack of “memory” by market actors, who tend to discount the effects of the outbreaks and/or their recursiveness once levels return to safe parameters. These results have several other implications for future state and local governments, both in Michigan and across the Great Lakes region.
Given the size of the damages by these recurring outbreaks, it may be cost-effective to design and implement policies addressing future outbreaks, especially in a state like Michigan, where water-related activities play a major social and economic role. Currently, there is no statewide TMDL for E. coli.Footnote 7 Instead, it is up to local municipalities to set regulations, which may result in conflicting policies and inefficient societal outcomes. Estimates such as ours can be beneficial for policymakers in assessing the costs and benefits of a statewide approach.
The policies of neighboring Midwest states demonstrate a range of policy options. In 2016, Ohio set revised statewide E. coli standards for wastewater discharge permits. These standards vary by recreational use of the receiving stream – bathing, swimming, and other primary uses cannot exceed a 90-day geometric mean of 126, while other uses that involve minimal contact cannot exceed a 90-day geometric mean of 1,030. Wisconsin seems to be moving in a similar direction as Ohio (Kaeding and The Associated Press, Reference Kaeding2019). Indiana monitors water bodies for E. coli, but only provides information to local entities to develop pollution reduction plans. Unfortunately, there is little research into the effectiveness of each policy, providing opportunities for future research.
Although we controlled as many factors as the data allowed, our results may be influenced by omitted variable bias. As the first estimate of the effect of E. coli outbreaks on housing in Michigan, it is difficult to gauge how realistic the estimates are. Research using alternative statistical methods or updated data will help place our estimates in context. One possibility is for future researchers to separate waterbodies by type. Waterfront properties on the Great Lakes (Lake Michigan, Lake Huron, Lake Superior) may capture further benefits despite being subject to the effects of E. coli (see e.g., Colwell and Dehring, Reference Colwell and Dehring2005; Wyman et al., Reference Wyman, Hutchinson and Tiwari2020). In addition, communication of outbreaks to the public varies substantially across the state; thus, potential buyers may have been privy to information about the outbreaks prior to purchasing the property, while those buyers who are less inclined to purchase houses near outbreaks may simply look elsewhere ex-ante.
Open research
The housing data information was obtained through a private agreement with Zillow and must remain confidential. Data on E. coli outbreaks was obtained through the Egle department of Michigan and is available upon request.
Data availability statement
The data used for this paper was made available through a confidential agreement with Zillow and is not available for distribution.
Funding statement
This paper was completed with no internal or external funding.
Appendix
Full sample results
The main results of the paper come from a subsample of Zillow housing prices. Table (5) shows the results using the full sample.
DID results

Standard errors in parentheses.
* p < 0.05, ** p < 0.01, *** p < 0.001.


 Open access