


Introduction
The Loolekop Pipe of the Phalaborwa Igneous Complex is the only known occurrence of a Cu-sulfide deposit of economic interest hosted within a carbonatite–phoscorite intrusion. This deposit has been mined since 1956 by the Palabora Mining Company Ltd., mainly for Cu, but also for other by-products, such as Fe and U. Copper-sulfide mineralisation within the Loolekop Pipe has been studied extensively since the middle of the 20th Century (Lombaard et al., Reference Lombaard, Ward-Able, Bruce and Haughton1964; Hanekom et al., Reference Hanekom, Van Standen, Smit and Pike1965; Groves and Vielreicher, Reference Groves and Vielreicher2001; Giebel et al., Reference Giebel, Gauert, Marks, Costin and Markl2017). Yet, primary ore-forming and late-stage alteration processes have not been entirely characterised (Heinrich et al., Reference Heinrich1970; Palabora Mining Company Ltd. Staff, 1976; Vielreicher et al., Reference Vielreicher, Groves, Vielreicher and Porter2000). Stable-isotope (Fe and Cu) and trace-element analysis on Cu-sulfides revealed the presence of a magmatic monosulfide solid solution and intermediate solid solution (mss–iss) system in the Loolekop carbonatite–phoscorite intrusion (Le Bras, Reference Le Bras2020; Le Bras et al., Reference Le Bras, Bolhar, Bybee, Nex, Guy, Moyana and Lourens2021). However, the mechanisms responsible for magmatic sulfide textures operating during the late stages of magma ascent remain unclear. Previous detailed research was made on the basis of optical and electron microscope observations, as well as electron microprobe analysis of Cu-sulfides on epoxy mounts and thin sections (Rudashevsky et al., Reference Rudashevsky, Kretser, Rudashevsky, Sukharzhevskaya, Zaitsev and Wall2004; Giebel et al., Reference Giebel, Gauert, Marks, Costin and Markl2017). Though such methods provided important constraints on phase compositions, the textural data may not be entirely representative due to stereological bias. Accurate textural analysis of the Cu-sulfide mineralisation within the Loolekop Pipe is critical, considering the spatial variability of mineral associations and textures. Three-dimensional analytical methods are capable of providing a more comprehensive dataset for adequately classifying the Loolekop-hosted Cu-sulfides.
The micro-focus X-ray computed tomography method is made on the basis of density variations between minerals. During X-ray irradiation, dense phases attenuate the beam more than light ones, producing contrast between the different mineral phases in the sample. The measurements generate 2D attenuation projections (radiographs). The 3D volume employed to interrogate the mineral phases is produced by stacking the 2D projections. It enables the characterisation of mineral size, distribution, association, internal textural orientation, porosity and mineral modal abundances within the sample. This method is advantageous considering its non-destructive nature, as it consists of the collection of two-dimensional (2D) X-ray projections of a sample followed by image reconstitution to produce a three-dimensional (3D) model. Due to its ability to examine these parameters, micro-focus X-ray computed tomography (microCT) has been used successfully to describe various types of mineralisation (Barnes et al., Reference Barnes, Fiorentini, Austin, Gessner, Hough and Squelch2008; Godel et al., Reference Godel, Barnes, Barnes and Maier2010; Cnudde and Boone, Reference Cnudde and Boone2013; Barnes et al., Reference Barnes, Le Vaillant, Godel and Lesher2019). This analytical method is particularly useful in deciphering textural relationships between ore minerals, and consequently identifying ore-forming processes (Godel et al., Reference Godel, Barnes, Barnes and Maier2010, Reference Godel, Barnes and Barnes2013).
Copper-sulfide mineralisation in the Loolekop Pipe is particularly complex. The spatial variability and the number of sulfide phases make the identification of mineral paragenesis challenging. Three-dimensional microCT analysis of drill core pieces from different rock types of the intrusion provide comprehensive and representative information regarding the distribution, shape and mineral associations of the Cu-sulfide mineralisation, including spatial relationships between the different Cu-bearing phases. The use of this method for the characterisation of Cu-sulfides from the Loolekop Pipe of the Phalaborwa Igneous Complex represents a novel approach to understand the metallogenesis of this unusual deposit.
Geological setting
The Phalaborwa Igneous Complex
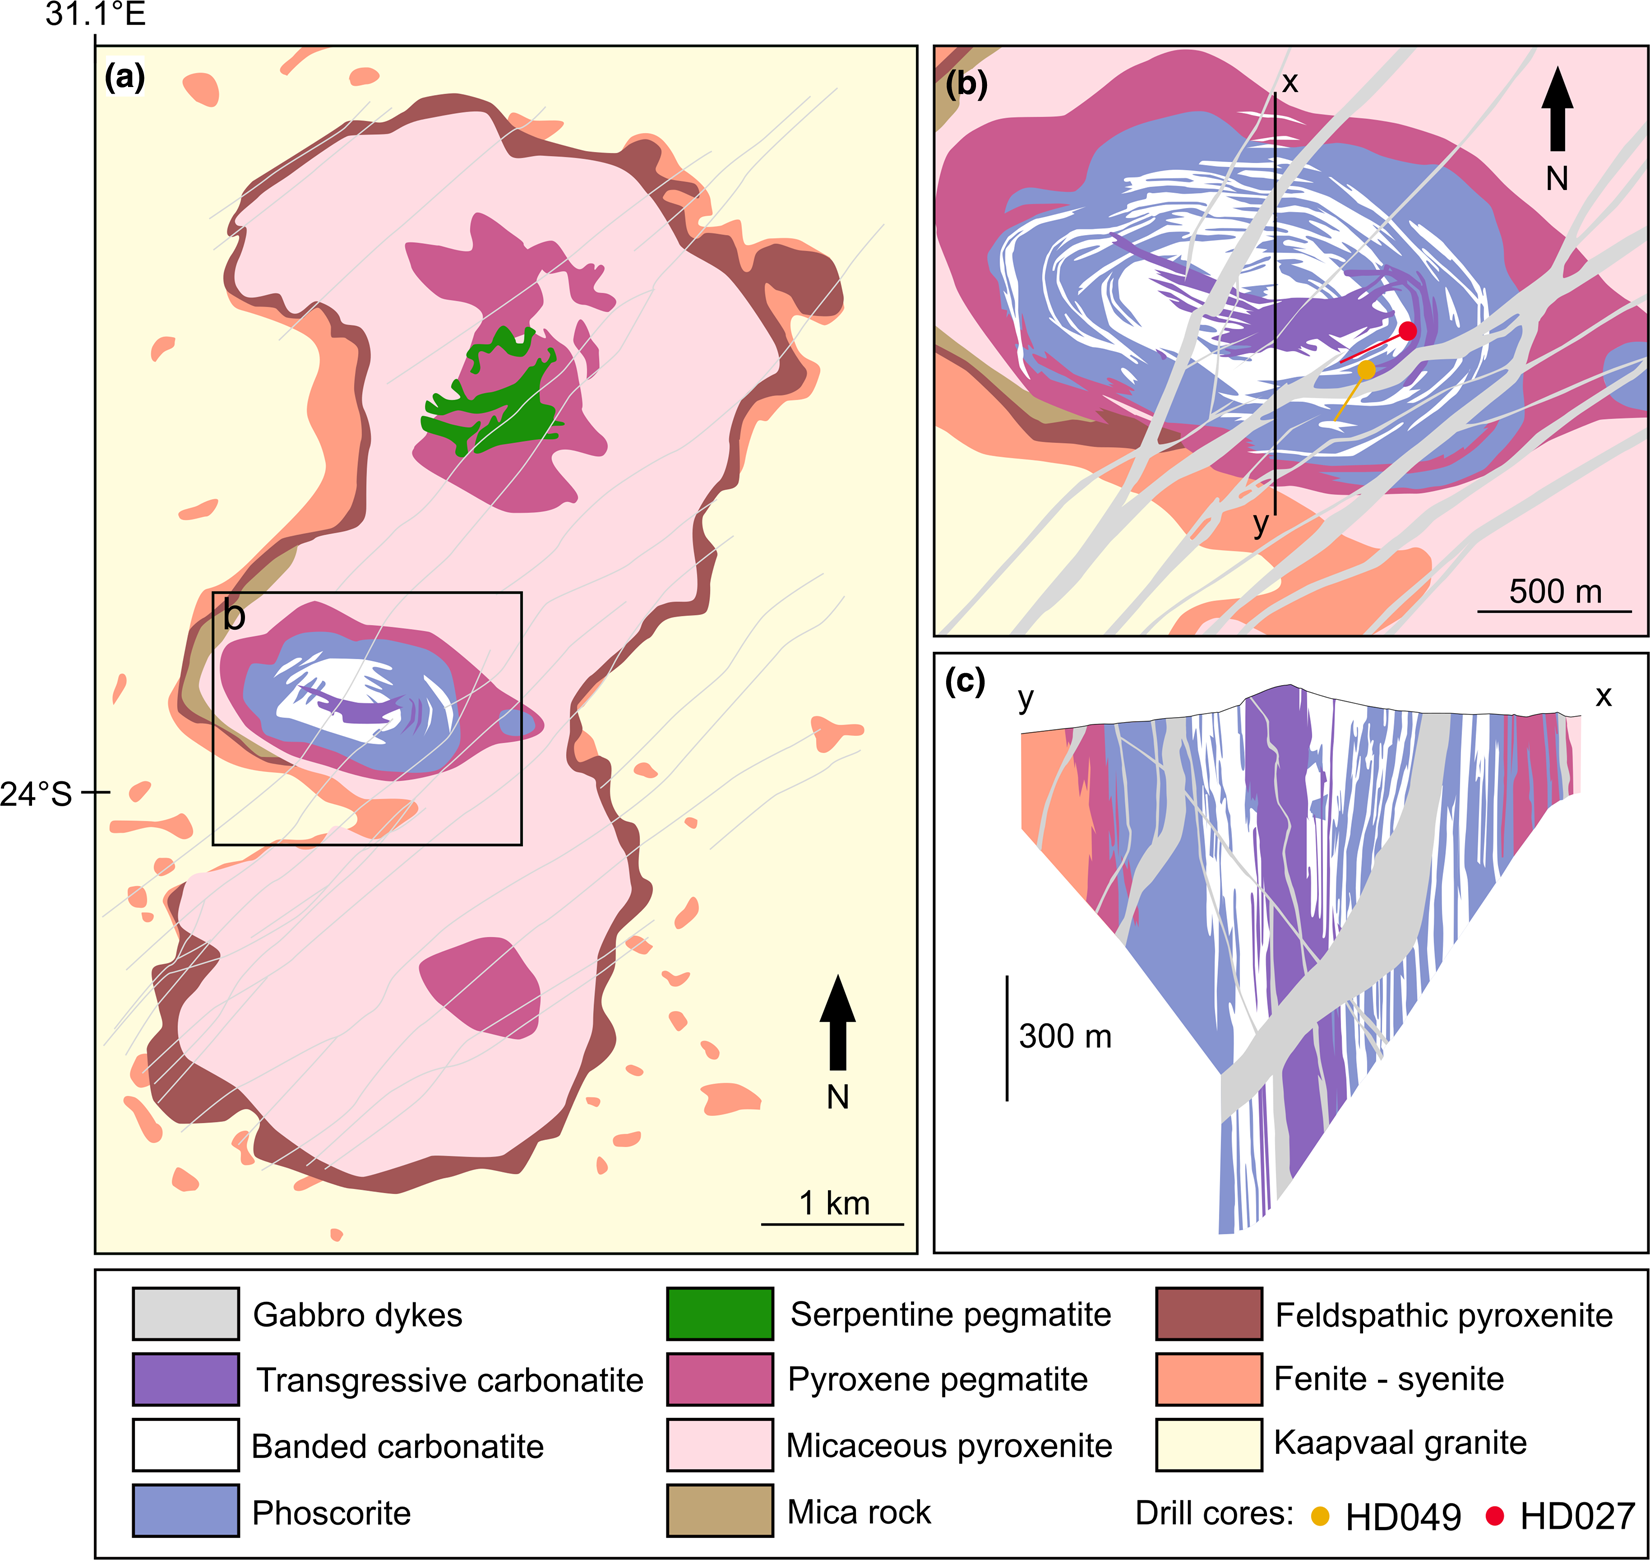
The Phalaborwa Igneous Complex is located in Limpopo Province, South Africa, ~450 km northeast of the city of Johannesburg. The complex is the outcome of successive intrusions of several magma pulses into the granitoid–gneiss basement of the Archaean Kaapvaal Craton. The igneous complex is composed of three distinct intrusive centres producing three adjacent lobes aligned on a North–South axis forming an 18.5 km2 ellipsoid (Fig. 1a). The complex is characterised by mafic rocks along the external boundaries of the complex, and carbonatitic rocks towards its core. The first magma pulse emplaced a feldspathic pyroxenite unit forming an aureole around the intrusive complex along the contact with the basement. It has been shown that the presence of feldspars is not related to any interaction with the gneissic–granitic host rock (Eriksson, Reference Eriksson1982). Fenitisation of the Kaapvaal host rocks can be observed along the contact with the feldspathic pyroxenite. Post-dating the feldspathic pyroxenite, a second magma pulse crystallised a micaceous pyroxenite, which constitutes a major part of the igneous intrusion (Fig. 1a). This rock is composed of phlogopite, diopside and apatite (Heinrich, Reference Heinrich1970; Eriksson, Reference Eriksson1982). The phlogopite content varies within the intrusion. Mineral assemblage alignments indicate the presence of magmatic flow during emplacement of these rocks. Weathering of the micaceous pyroxenite has resulted in the alteration of phlogopite to vermiculite (Palabora Mining Company Ltd. Staff, 1976). Thereafter, pyroxene pegmatites were emplaced as three intrusive centres, each being characterised by distinct modal compositions. The southern pegmatite is composed of diopside and phlogopite with minor fluorapatite and serpentine (Eriksson, Reference Eriksson1982). The northern pegmatite consists of a ring-shaped phlogopite-, diopside- and apatite-bearing unit surrounding a rock composed of diopside, serpentine and phlogopite. The central pegmatite consists of phlogopite, diopside and apatite. Syenite magma intruded into gneisses and granites of the Kaapvaal Craton to form syenite plugs all around the complex. Late gabbro dykes cross-cut all country rocks and the complex along a northeast–southwest axis.
(a) Simplified geological map of the Phalaborwa Igneous Complex. (b) Enlarged view of the Loolekop Pipe with surface projections of the drill core collars and orientations. The drill cores have a sub-horizontal orientation. (c) Vertical cross-section defined by the x – y line on (b). Modified after Palabora Mining Company Ltd. Staff (1976) and Le Bras et al. (Reference Le Bras, Bolhar, Bybee, Nex, Guy, Moyana and Lourens2021).
Geological characteristics of the Loolekop Pipe
The central intrusion, henceforth named Loolekop Pipe, represents a sub-vertical body, which was emplaced at the intersection of five major faults and shear zones (Basson et al., Reference Basson, Lourens, Paetzold, Thomas, Brazier and Molabe2017). The first rocks to crystallise were phoscorite at the outer parts of the Loolekop Pipe and banded carbonatite to the centre of the intrusion (Fig. 1b). Both banded carbonatite and phoscorite are marked by the presence of planar mineral alignments. Alternate vertical layers of banded carbonatite and phoscorite form a progressive transition from massive phoscorite at the external boundaries of the Loolekop Pipe to banded carbonatite towards the core (Fig. 1c). A later structural event imparted a dense stockwork in the core of the pipe and reactivated igneous activity, allowing the emplacement of a second carbonatite magma pulse, forming the transgressive carbonatite, into the fracture network in the centre of the intrusion (Lombaard et al., Reference Lombaard, Ward-Able, Bruce and Haughton1964; Heinrich, Reference Heinrich1970).
The phoscorite in the Loolekop Pipe is a coarse-grained rock (5 mm to 6 cm) composed mainly of magnetite and apatite with lesser extents of diopside and phlogopite in a calcite matrix (Eriksson, Reference Eriksson1982). The banded carbonatite unit consists mainly of medium- to coarse-grained (1 mm to 2 cm) calcite and dolomite with minor amounts of magnetite, apatite and diopside. Both banded carbonatite and phoscorite show magnetite-, apatite- and silicate-bearing planar alignments, forming sub-vertical cumulates in the intrusive pipe (Lombaard et al., Reference Lombaard, Ward-Able, Bruce and Haughton1964; Hanekom et al., Reference Hanekom, Van Standen, Smit and Pike1965; Palabora Mining Company Ltd. Staff, 1976). The transgressive carbonatite is composed of coarse-grained (5 mm to 5 cm) calcite and dolomite with traces of apatite, magnetite and diopside, which are all apparently related to the replacement of banded carbonatite/phoscorite during magma ascent.
The timing of emplacement of the Loolekop Pipe has been investigated using various analytical techniques. Uranium-Pb thermal ionisation mass spectrometry (TIMS) analysis of baddeleyite produced ages of 2059.8 ± 0.8 Ma and 2060.6 ± 0.5 Ma (Heaman and LeCheminant, Reference Heaman and LeCheminant1993; Reischmann, Reference Reischmann1995). Secondary ion mass spectrometry (SIMS) U–Pb analysis on zircons from the pyroxene-bearing pegmatite, phoscorite, banded carbonatite and transgressive carbonatite produced ages estimated at 2060 ± 4 Ma, 2060 ± 1 Ma, 2060 ± 2 Ma and 2060 ± 1 Ma, respectively (Wu et al., Reference Wu, Yang, Li, Mitchell and Dawson2011). These ages suggest a synchronous emplacement of the main geological units. Compositions of banded carbonatite and phoscorite indicate a cogenetic origin of these two rocks, which support the concept of a rapid emplacement of the Loolekop carbonatite–phoscorite complex (Wu et al., Reference Wu, Yang, Li, Mitchell and Dawson2011; Milani et al., Reference Milani, Bolhar, Cawthorn and Frei2017a, Reference Milani, Bolhar, Frei, Harlov and Samuelb).
Copper sulfides in the Loolekop Pipe
Chalcopyrite represents the dominant sulfide in terms of volume within the Loolekop Pipe (Palabora Mining Company Ltd. Staff, 1976). It occurs as two different types defined by specific mineral associations and textures. The first type constitutes the largest part of the sulfide mineralisation within the Loolekop Pipe and is characterised by networks of sub-vertical veinlets occurring in wide zones (up to several m) along fractures within the transgressive carbonatite (Palabora Mining Company Ltd. Staff, 1976; Vielreicher et al., Reference Vielreicher, Groves, Vielreicher and Porter2000). Chalcopyrite, as part of this mineralisation, is commonly associated with cubanite, the latter being present either as exsolution lamellae or grains (Lombaard et al., Reference Lombaard, Ward-Able, Bruce and Haughton1964; Palabora Mining Company Ltd. Staff, 1976; Le Bras et al., Reference Le Bras, Bolhar, Bybee, Nex, Guy, Moyana and Lourens2021). The second type occurs as disseminated grains (50 to 500 μm) associated with small modal amounts of bornite within banded carbonatite and phoscorite, and is present in minor amounts relative to chalcopyrite (Palabora Mining Company Ltd. Staff, 1976). Disseminated grains of chalcopyrite have also been observed within the micaceous pyroxenite.
Bornite has been reported as the second most important sulfide in terms of abundance in the Loolekop Pipe and represents the dominant phase within the banded carbonatite and phoscorite. This mineral is associated with disseminated chalcopyrite in banded carbonatite and phoscorite, but also occurs as an isolated phase. Both bornite and chalcopyrite can be found disseminated within the carbonate gangue, though they are also associated with magnetite and apatite cumulates. Intergrowths of chalcocite and bornite have also been observed.
Late-stage valleriite occurs together with primary sulfides along cracks and edges of chalcopyrite and bornite (Le Bras et al., Reference Le Bras, Bolhar, Bybee, Nex, Guy, Moyana and Lourens2021). Various trace sulfides have also been reported in the Loolekop rocks, such as pentlandite, millerite, bravoite, tetrahedrite, sphalerite, pyrite and galena, as well as platinum-group minerals (Bulakh et al., Reference Bulakh, Rudashevsky and Karchevsky1998; Rudashevsky et al., Reference Rudashevsky, Kretser, Rudashevsky, Sukharzhevskaya, Zaitsev and Wall2004).
Trace-element analyses of sulfide assemblages reveal an enrichment of Pd (average of 91 ppb) over Pt and other platinum-group elements (PGE) in the Ir-group (IPGE: Os, Ir, Ru; up to 20 ppb), consistent with the operation of a mss–iss system in the Loolekop Pipe (Le Bras et al., Reference Le Bras, Bolhar, Bybee, Nex, Guy, Moyana and Lourens2021). This originates from a magmatic process, characterised by the formation of two phases from the sulfide liquid during magma ascent. The first consisted of an Fe- and IPGE-rich sulfide cumulate (mss) and the second of a Cu- and Pd-group PGE (PPGE: Pd, Pt)-rich sulfide liquid, which later precipitated an iss. The iss further evolved in Cu-sulfide assemblages during cooling. The depletion in Pt of sulfide phases is regarded as the consequence of the formation of sperrylite (PtAs2) during the magmatic stage.
Samples and methods
Samples
Forty five pieces of drill core from two boreholes were selected from the Palabora Mining Company drill-core collection. Samples consist of drill-core quarters with a 1.75 cm radius. Sampled cores were drilled sub-horizontally at the second lift level of the mine, ~1250 m below surface. Twelve samples from different rock types were chosen for microCT analysis on the basis of their Cu-sulfide content to ensure optimal characterisation of the mineralisation (Supplementary material – Appendix 1). A polished epoxy mount was prepared from one of the drill core samples in order to identify the different ore phases in the tomographic images.
Micro-focus X-ray computed tomography
Analyses were performed at the Micro-focus X-ray Radiography and Tomography (MIXRAD) facility at the South African Nuclear Energy Corporation (NESCA) at Pelindaba in South Africa.
The procedure to acquire the data consists of four steps. The first consists of the acquisition of the 2D image projections (2000 projections) of the drill-core samples through a 360° rotation. A Nikon XTH 225 CT system with a multi-target source (Mo, Cu, Ag, W) was used to acquire the 2D projections. The instrument has been described in detail elsewhere (Hoffman and De Beer, Reference Hoffman and De Beer2012). The drill-core samples were mounted in a Plexiglas® cylinder and held in place by polystyrene pieces to avoid any movement of the samples during scanning. The scanning resolution was set between 28 and 45 μm3 (voxel size) depending on the sample size. To optimise the image contrast, the exposure time was set to 4 s and the source voltage to 100 kV. A 0.5 mm Cu filter was used to minimise the impact of beam hardening and to improve X-ray penetration. A 16-bit dynamic range Perkin Elmer flat-panel detector was employed to capture the projections. This detector has an effective size of 400 mm × 400 mm and a pixel size of 200 μm × 200 μm.
The second step involves the reconstruction of the 2D image projections into a 3D volume using the CT Pro 3D software. A beam hardening correction of 2 was used to further minimise the impact of beam hardening and optimise image contrast. In this case, the reconstructed 3D volume comprises the 2D image slices.
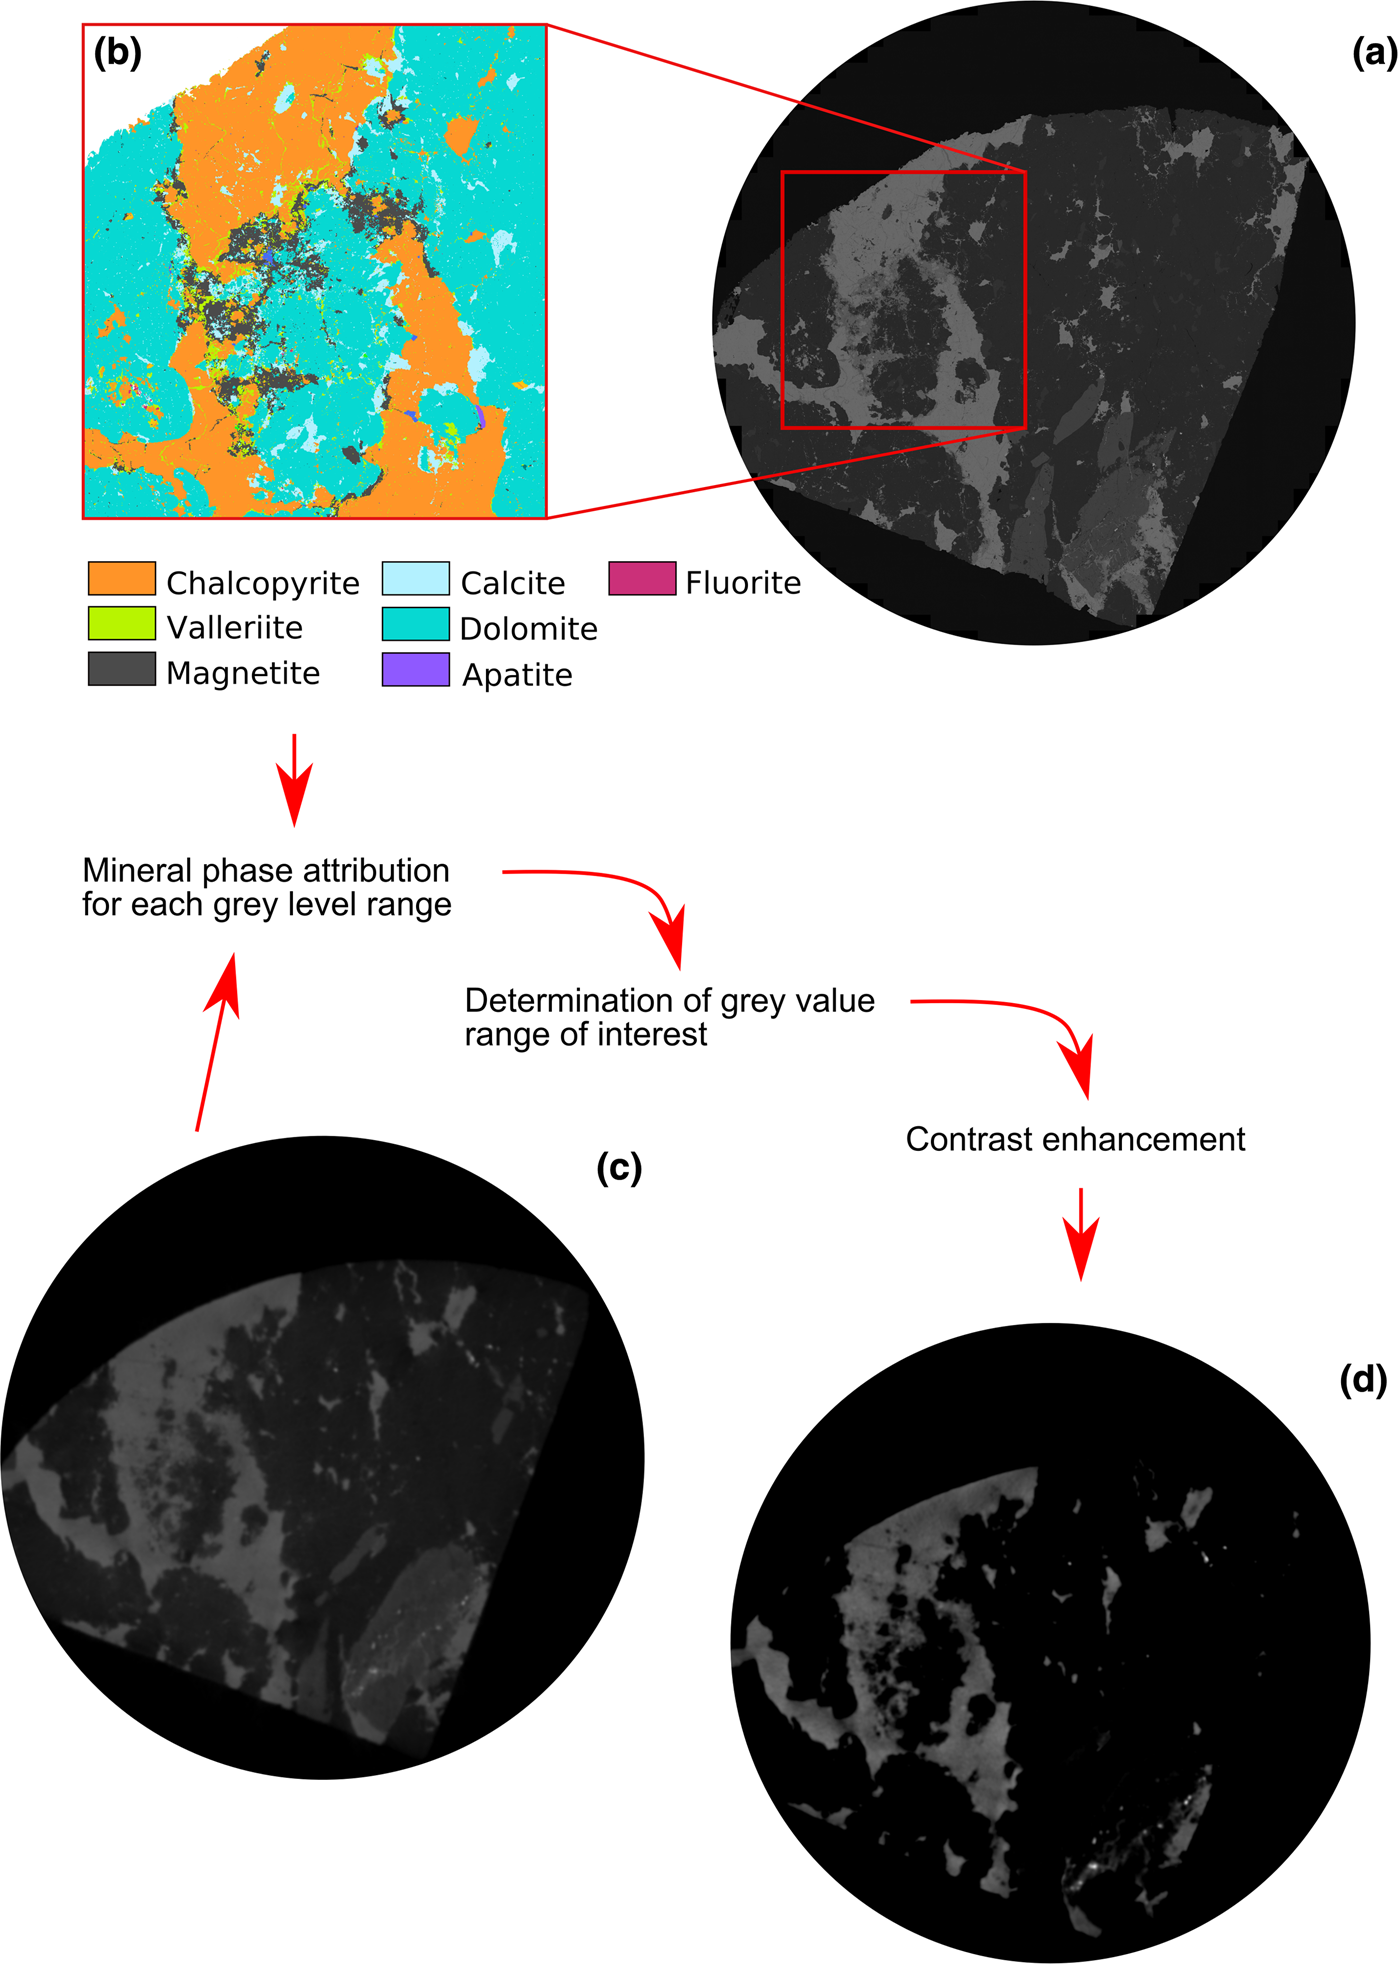
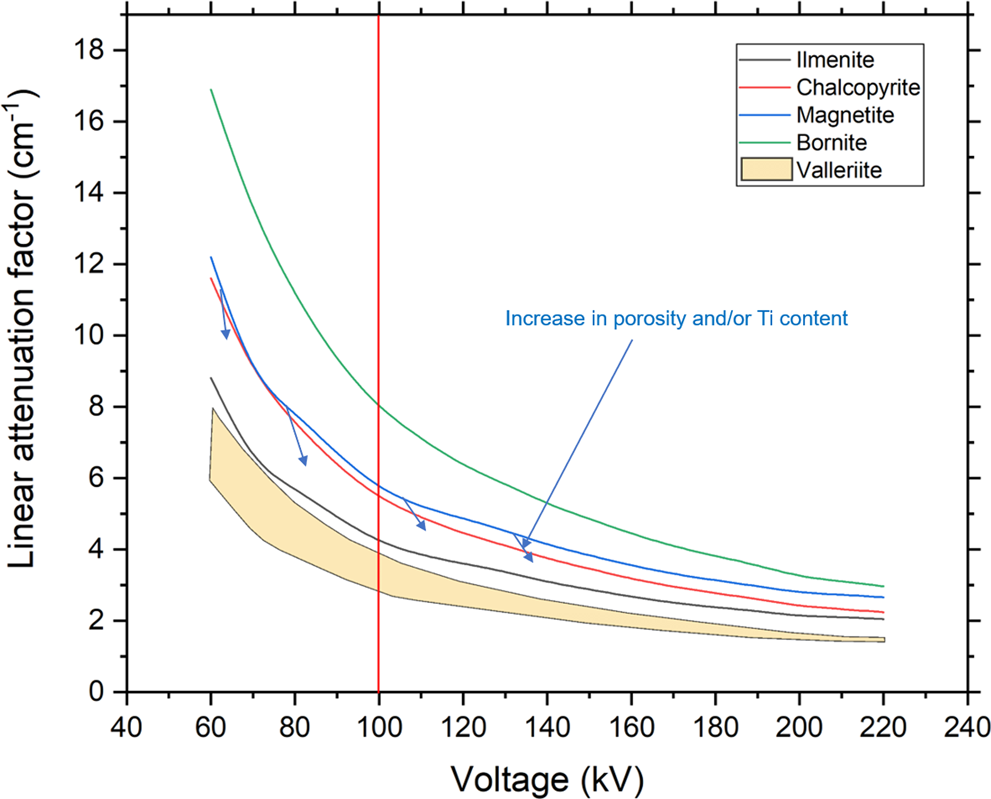
This step was followed by pre-processing of the 2D image slices using ImageJ free software (Schneider, Reference Schneider, Rasband and Eliceiri2012). A certain grey value related to the low-density phases (gangue minerals) is subtracted to improve the overall contrast between the dense phases (Fig. 2). The segmentation was done using the built-in segmentation grey value range function of the VG Studio Max software version 3.2 (Volume Graphics GmbH). This function allows a certain grey value range (attributed to the minerals) to be isolated from the entire sample. The attenuation coefficient information illustrates that the discrimination between minerals of interest (magnetite, chalcopyrite, bornite, valleriite) is possible (Fig. 3). It is particularly the case between chalcopyrite and magnetite in the Loolekop Pipe due to the high Ti content of magnetite (Milani et al., Reference Milani, Bolhar, Cawthorn and Frei2017a), which significantly lowers its attenuation coefficient (Fig. 3). The porosity of magnetite associated with chalcopyrite is also a factor leading to a lower attenuation factor (Fig. 2b).
(a) Electron microscope image of a sulfide-rich slice. (b) High-resolution Mineral Liberation Analysis mineral map corresponding to a part of the picture in (a). (c) Raw microCT 2D projection of sulfide phases (medium grey) in a carbonatite matrix from sample 17 (Appendix 2). (d) Processed 2D projection slice with high contrast between the ore phases and the gangue.
Graph showing calculated theoretical linear attenuation coefficients for ore minerals within the Loolekop Pipe depending on the voltage of the X-ray source. The wide variation for valleriite is due to the complex and variable composition of this mineral. The difference between chalcopyrite and magnetite attenuation factors increases with an increase of source voltage.
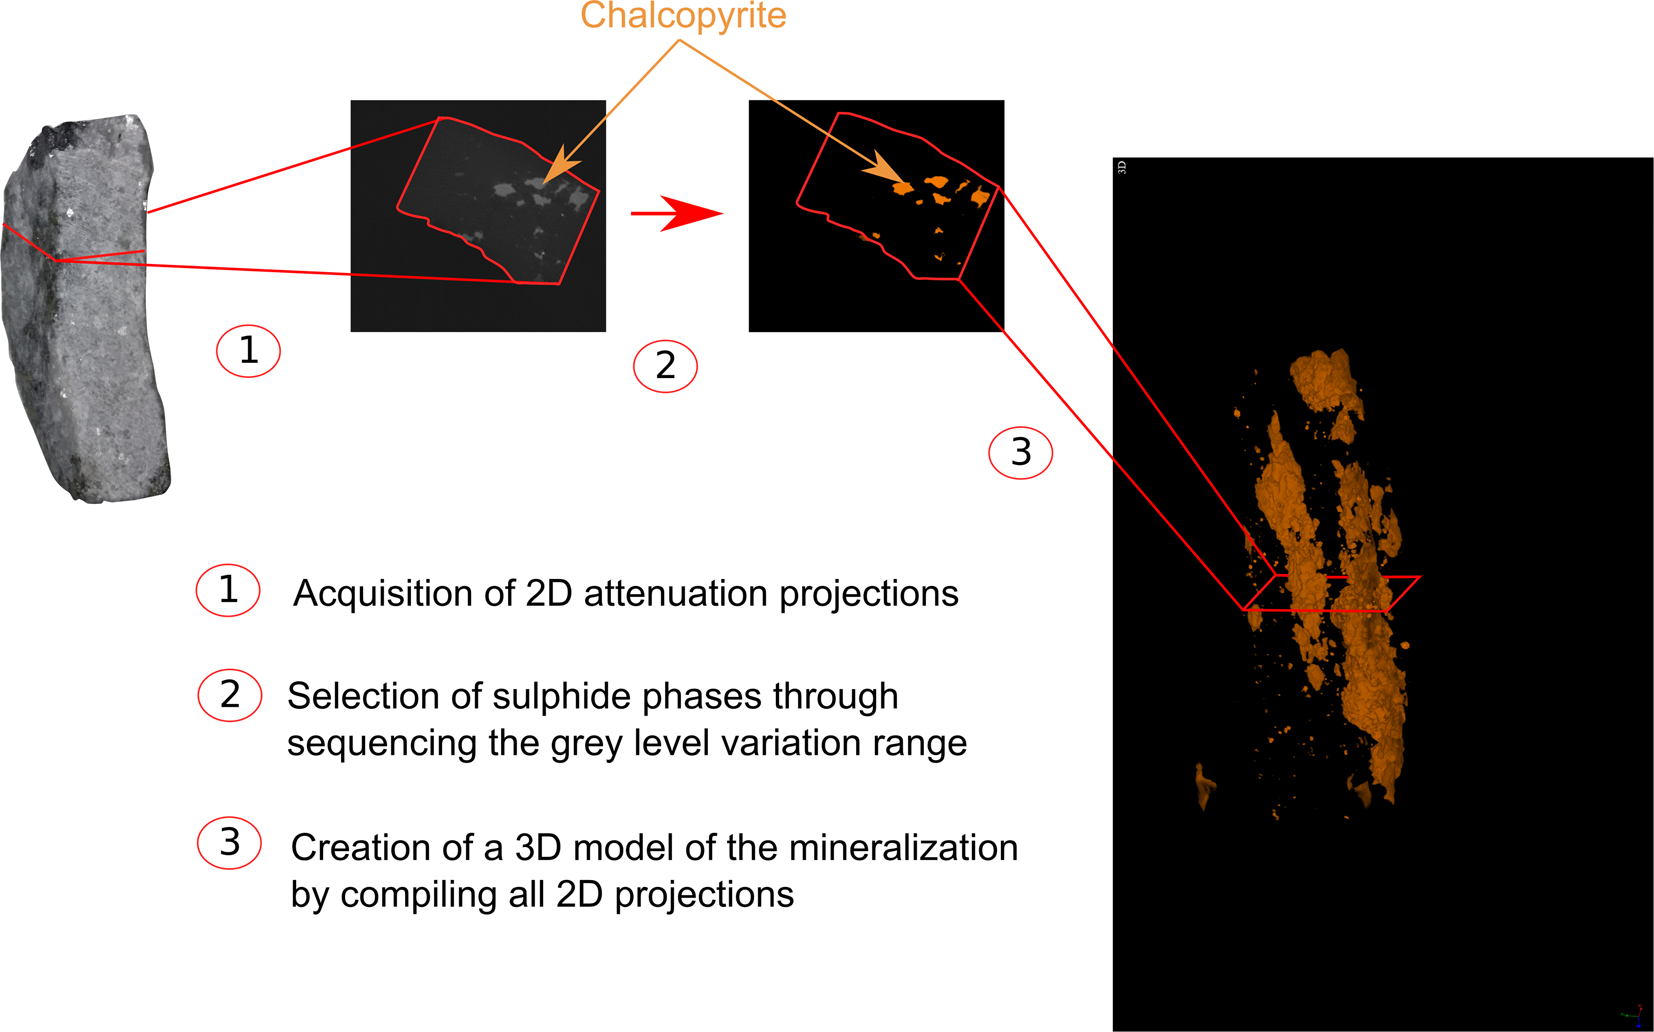
The final step consists of restoring a 3D volume of the phase of interest from the stacking of segmented 2D image slices using the VG Studio Max software version 3.2 (Fig. 4). For better visualisation, a false colour was assigned to each phase of interest to indicate occurrence and distribution within the drill cores.
Graphic illustration of the method applied for data processing, from data acquisition to the 3D model creation.
Mineral liberation analysis
Mineral liberation analysis (MLA) was carried out on a sulfide-rich sample mounted in epoxy resin to obtain a detailed overview of both sulfide phases and textures, and to optimise tomographic data processing. The polished mount was prepared from a drill-core piece previously analysed by micro-focus X-ray computed tomography.
The MLA was performed using a FEI Quanta 600 FEG MLA with two Bruker Xflash X-ray detectors at the University of Johannesburg. Analyses were conducted at a working distance of 13 mm. The acceleration voltage was set at 25 kV and the current at the surface of the specimen at 10 nA. X-ray detectors were calibrated against a Cu standard. Calibration of the back-scattered electron (BSE) grey level was performed against Au, Cu and quartz standards. Sulfide and gangue phases collection times were set at 10 ms and 30 ms, respectively. Mineral maps were created using the GXMAP measurement mode, which performs X-ray analysis according to a grid format with a point spacing set at 13 μm.
Results
MicroCT spatial resolution
The MLA results permit the accurate identification and textures of sulfides of interest, and also enables the assignment of microCT grey level intervals to the different phases (Figs 2 and 4). Mineral Liberation Analysis also revealed the limited spatial resolution of the microCT where the structural features are smaller than the resolution, affecting the contrast. Small-scale mineralisation features (~10 μm) visible on the BSE image and MLA mineral map (Fig. 2a,b) cannot be distinguished on the corresponding 2D linear attenuation projection (Fig. 2c). Therefore, only the major features of the sulfide mineralisation were observed and interpreted with microCT analysis.
Ore mineralogy
Combined microscopic observations and microCT analysis reveals three distinct categories of sulfide mineralisation: (1) gangue-hosted disseminated Cu-sulfides; (2) chalcopyrite veins; and (3) secondary sulfides associated with the two first categories (Figs 5 to 11 and Table 1).
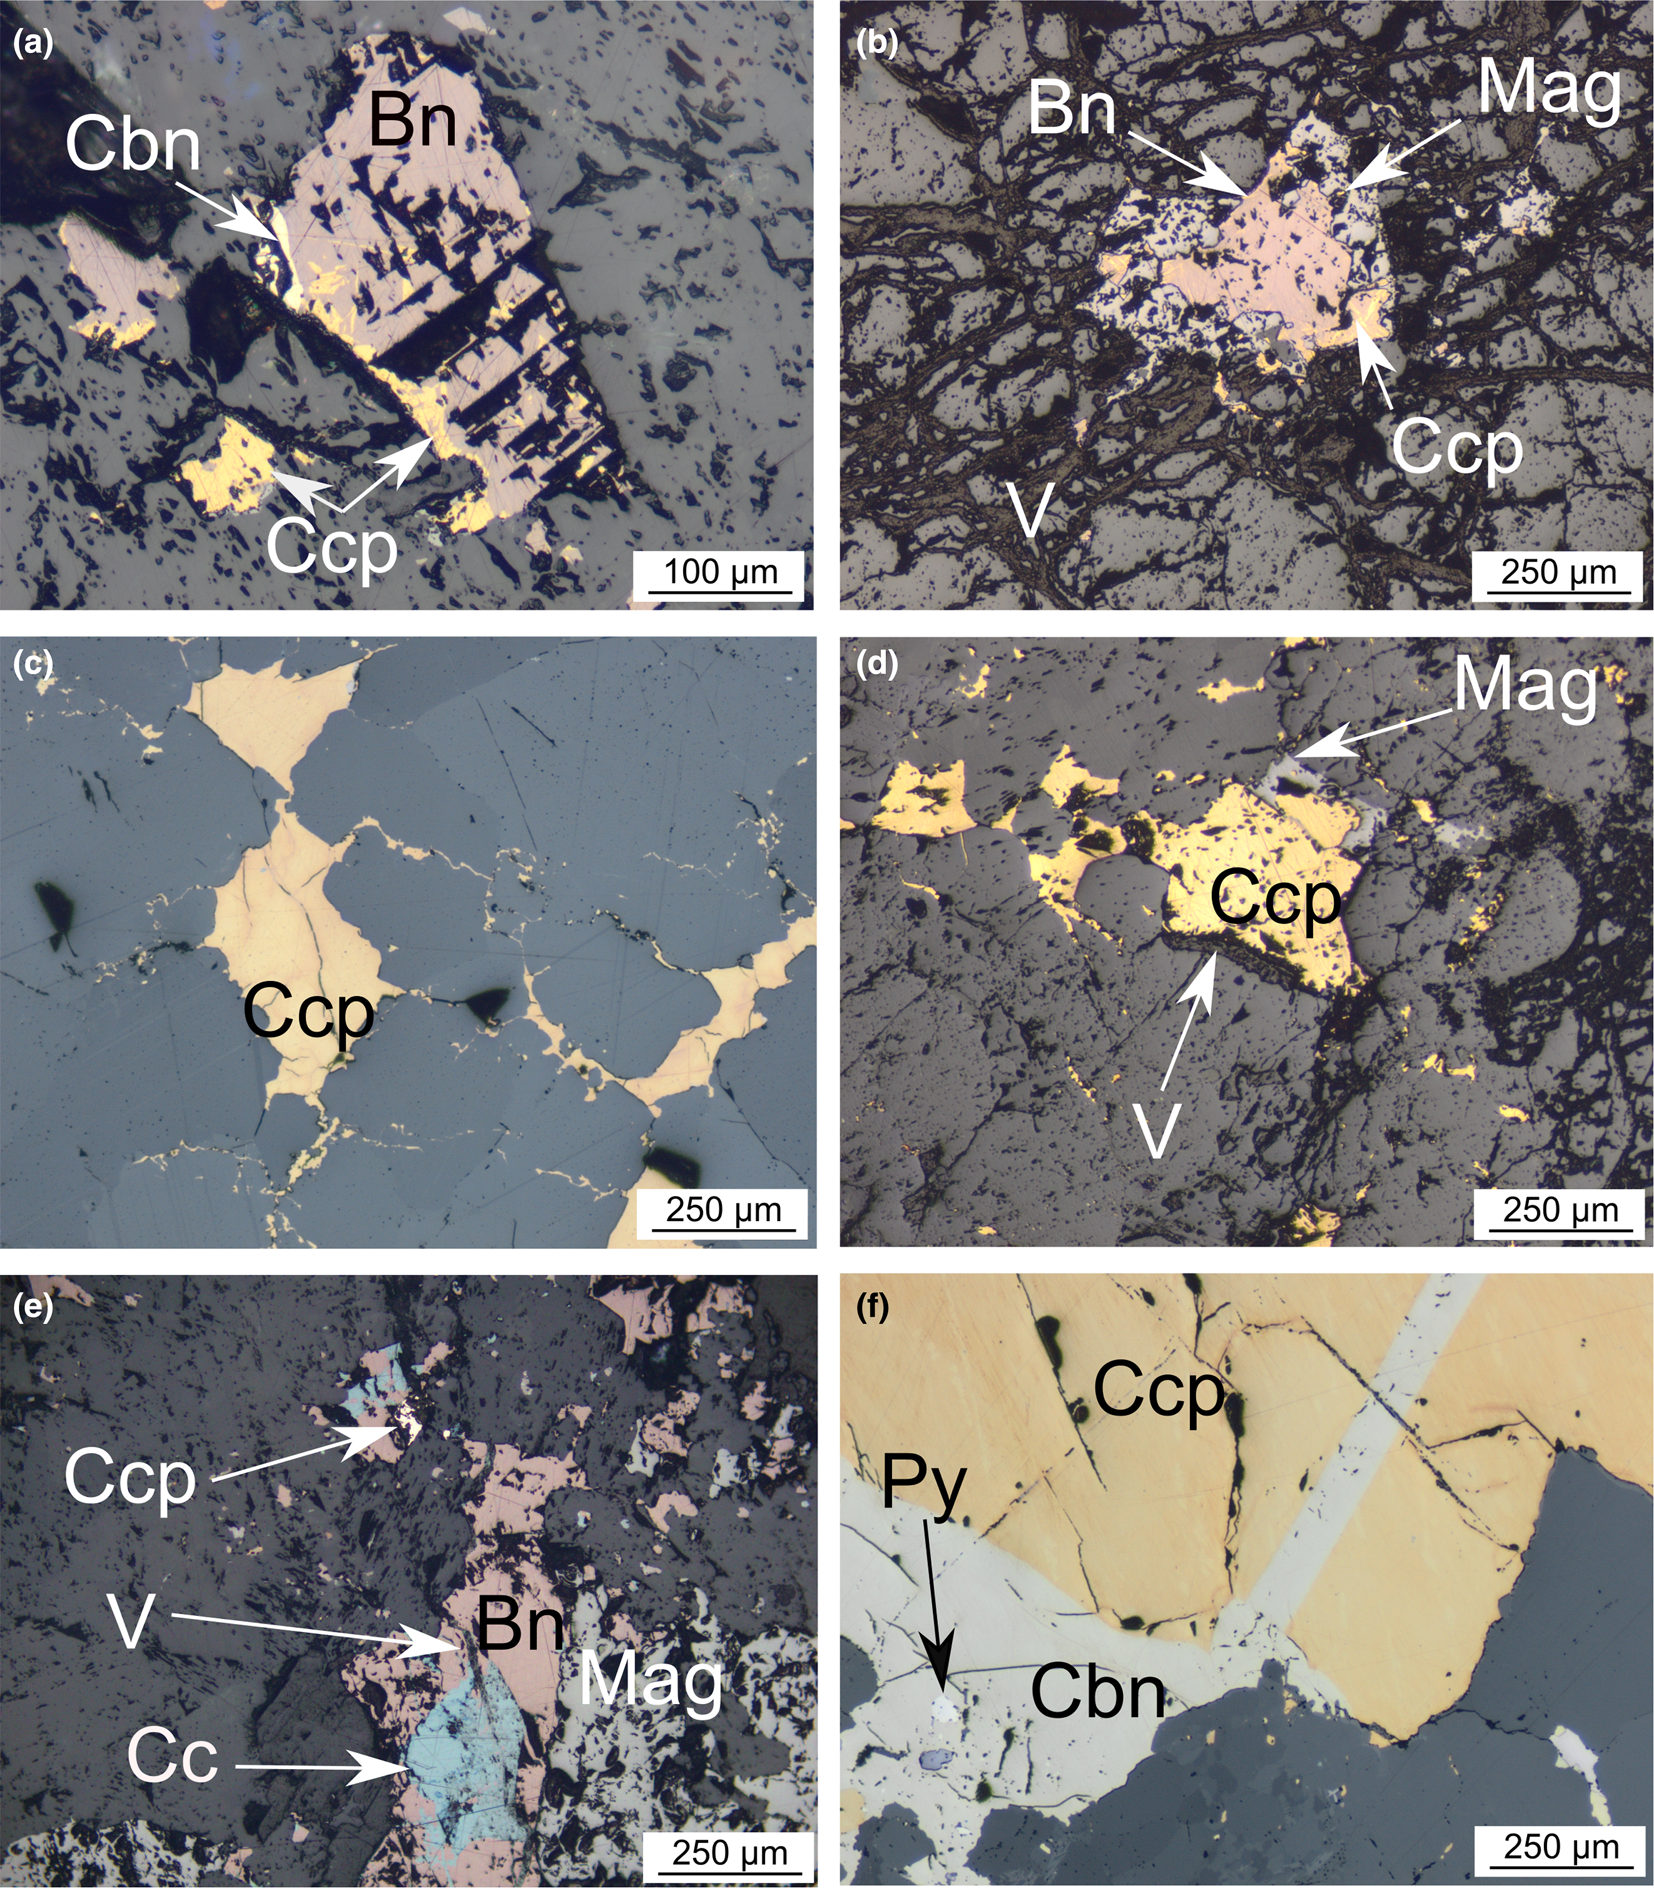
Photomicrographs of the different sulfide assemblages observed in the Loolekop Pipe. Bn = bornite, Cbn = cubanite, Cc = chalcocite, Ccp = chalcopyrite, Mag = magnetite and V = valleriite. (a) Bornite grain associated with chalcopyrite and cubanite disseminated in the gangue. (b) Similar grain as in (a) with fracture network filled by valleriite and magnetite association. (c) and (d) Disseminated chalcopyrite grains within the gangue accompanied by interstitial chalcopyrite between adjacent gangue minerals. (e) Intricate bornite–chalcocite assemblage associated with magnetite. (f) Vein-hosted chalcopyrite–valleriite assemblage associated with fine-grained pyrite.
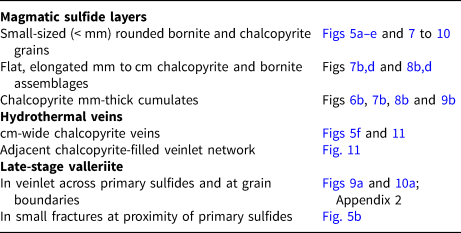
Summary of sulfide categories and their respective textures within the Loolekop Pipe.
Microscopic observations
Copper sulfides disseminated within the gangue typically exhibit fine-grained (up to 500 μm) chalcopyrite and bornite assemblages within banded carbonatite and phoscorite (Figs 5a–e). Chalcopyrite is also present as small interstitial veinlets (~20 μm wide, ~400 μm long) connected to disseminated grains (Fig. 5c). Bornite grains (~200–300 μm) are observed in association with chalcopyrite and, occasionally, with magnetite (Fig. 5a,b,e). Locally, intricate bornite–chalcocite assemblages can be observed (Fig. 5e). Within bornite grains, chalcopyrite is mainly present as exsolution or replacement lamellae and patches (Fig. 5a,b). As shown in Fig. 5f, chalcopyrite can also form greater than 1 mm-wide veins with cubanite exsolution lamellae. Valleriite alteration can be observed in cracks and veins in the gangue, but also along the rims of the sulfide assemblages themselves. Valleriite is commonly very fine-grained and unevenly distributed within the Loolekop Pipe (Fig. 5b,d,e).
MicroCT
Three-dimensional modelling of sulfide mineralisation reveals several types of textures that are not obvious from conventional petrographic examination due to the limited number of polished mounts examined of Cu-sulfides in the Loolekop Pipe. The three main textural types are: (1) disseminated grains (Figs 6 to 9); (2) flat and elongated assemblages (Figs 7 and 8); and (3) sulfide cumulates (Figs 6 to 9). Disseminated sulfides are present in all of the samples. These typically show alignments (Figs 9 and 10), which can be difficult to identify in samples with high grain density. Elongated assemblages are up to several mm long (Figs 7a,b; 8a,b). This textural type is dominated by chalcopyrite. Three-dimensional tomographic analysis can show lengths greater than 10 mm in some cases, but observations are limited by the diameter of the drill core. The thickness of elongated assemblages rarely exceeds ~3 mm. Sulfide cumulates are present as layers in the host rock (Figs 6 to 9). The cumulate thickness is highly variable and ranges from 1 mm (Fig. 9) to >1.5 cm (Fig. 8). These cumulates display a planar orientation, trending sub-perpendicular to the drill-core axis.
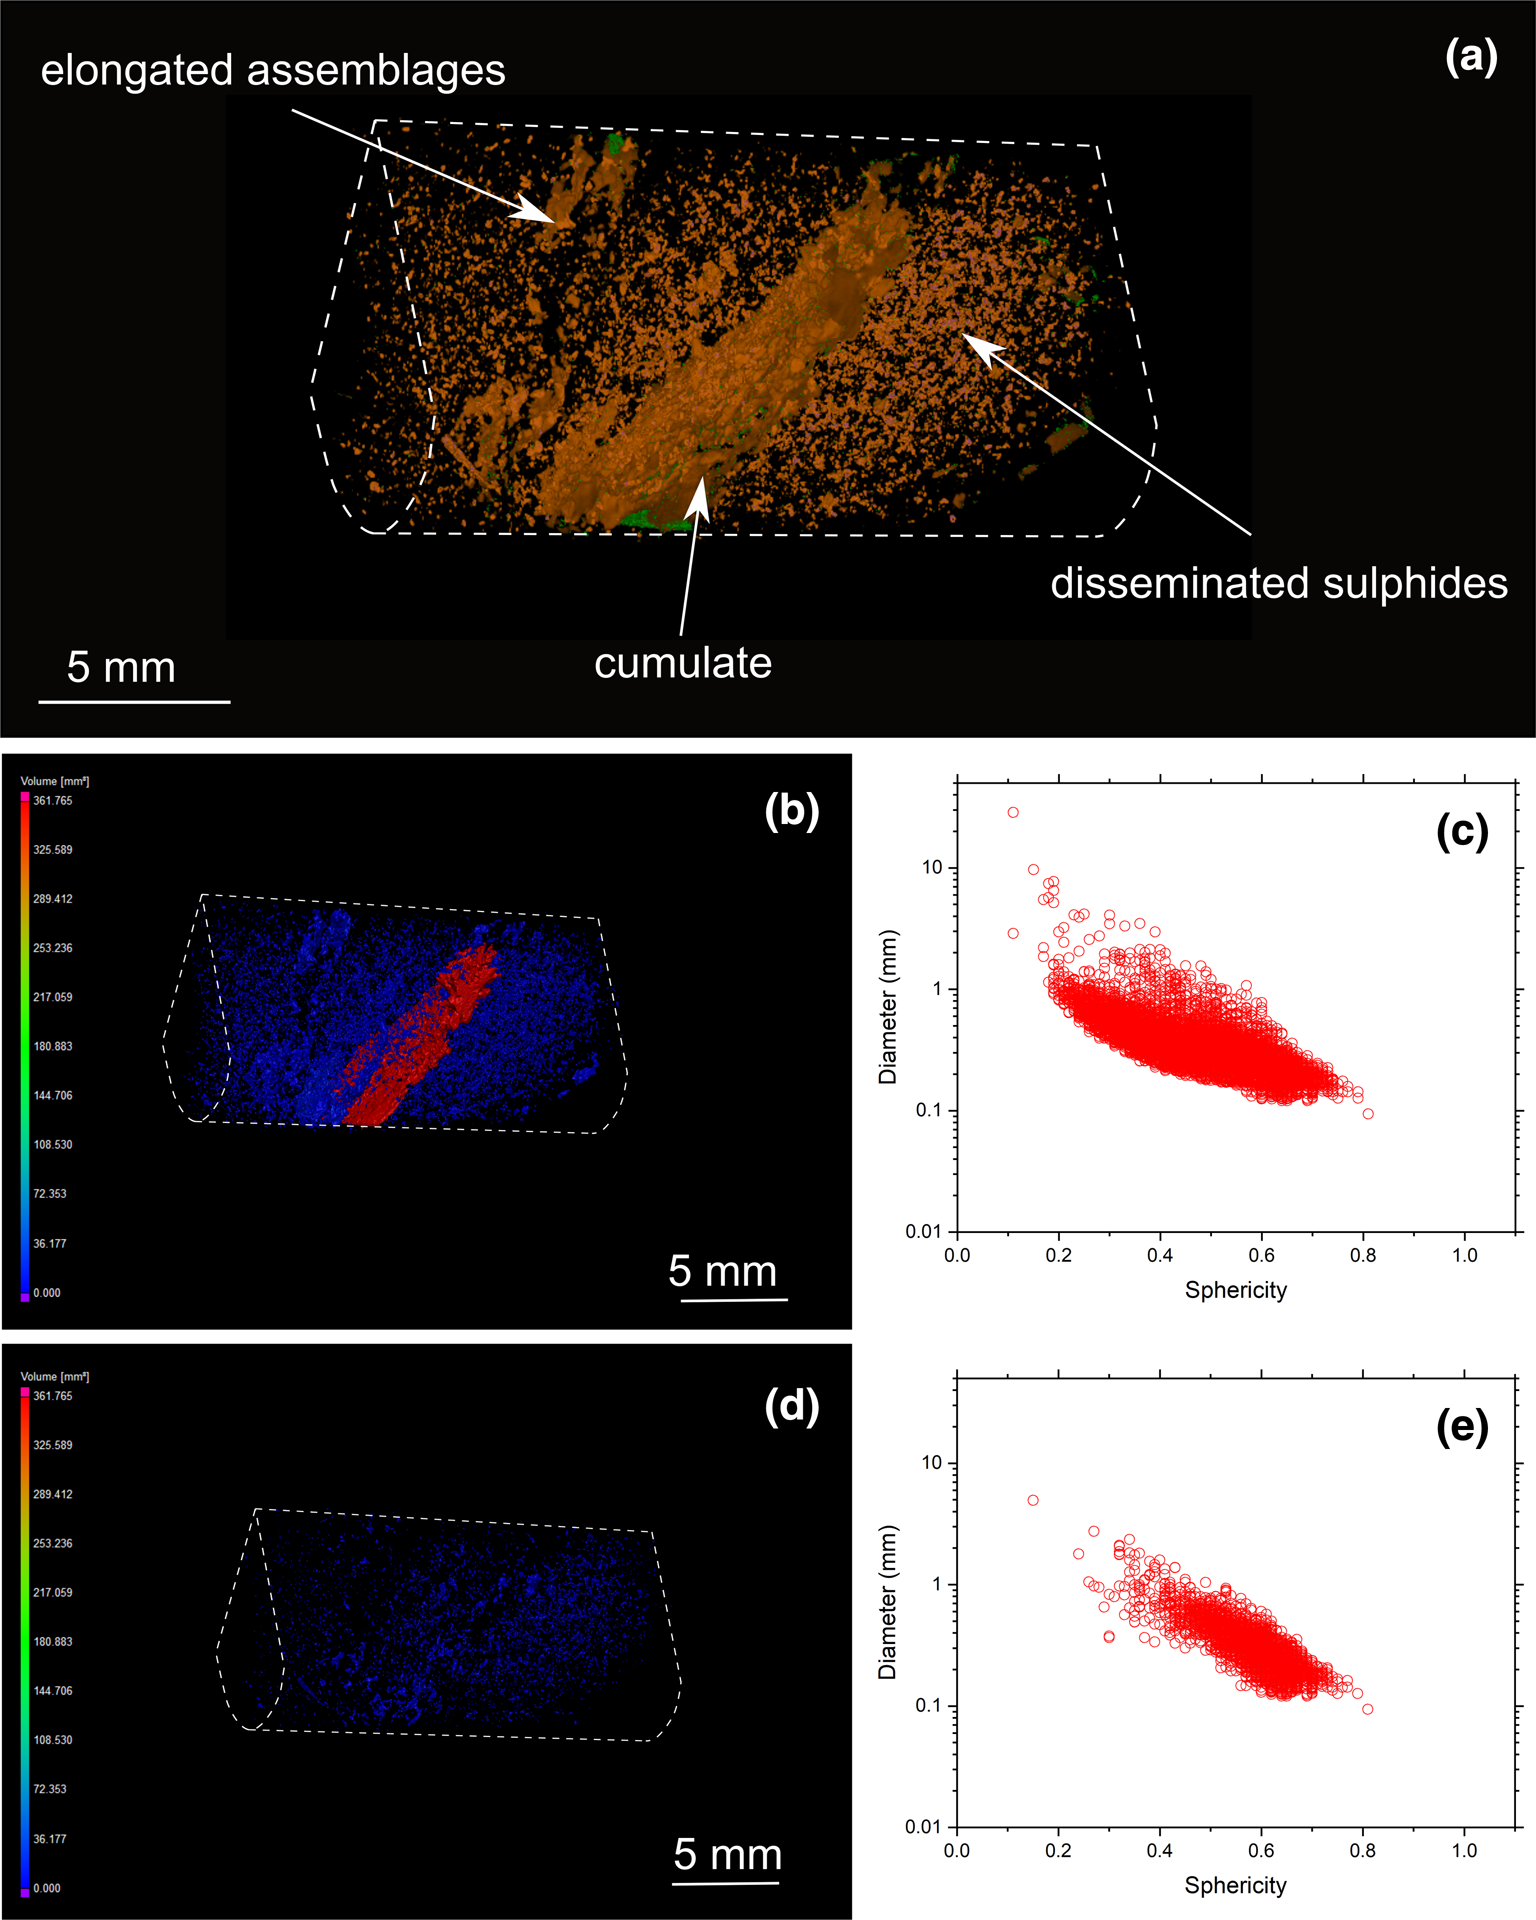
(a) Three-dimensional volume rendering of drill-core sample 56 (banded carbonatite) with chalcopyrite (orange) and valleriite (green). (b) Three-dimensional heatmap for chalcopyrite phases. Red, green and blue correspond to large, medium and small volumes, respectively. (c) Graph plotting the diameter of chalcopyrite versus sphericity.

(a) Three-dimensional volume rendering of drill-core sample 22 (banded carbonatite) with chalcopyrite (orange) and valleriite (green). (b) Three-dimensional heatmap for chalcopyrite phases. Red, green and blue correspond to large, medium and small volumes, respectively. (c) Graph plotting the diameter of chalcopyrite against sphericity. (d) Three-dimensional heatmap for bornite phases (e) Graph plotting the diameter of bornite against their sphericity.
(a) Three-dimensional volume rendering of drill-core sample 58 (banded carbonatite) with chalcopyrite (orange) and valleriite (green). (b) Three-dimensional heatmap for chalcopyrite phases. Red, green and blue correspond to large, medium and small volumes, respectively. (c) Graph plotting the diameter of chalcopyrite against sphericity. (d) Three-dimensional heatmap for bornite phases (e) Graph plotting the diameter of bornite against sphericity.

(a) Three-dimensional volume rendering of drill-core sample 57 (banded carbonatite) with chalcopyrite (orange), bornite (purple) and valleriite (green). (b) Three-dimensional heatmap for chalcopyrite phases. Red, green and blue correspond to large, medium and small volumes, respectively. (c) Graph plotting the diameter of chalcopyrite versus sphericity. (d) Three-dimensional heatmap for bornite phases (e) Graph plotting the diameter of bornite versus sphericity.

(a) Three-dimensional volume rendering of drill-core sample 17 (banded carbonatite) with chalcopyrite (orange) and valleriite (green). (b) Three-dimensional heatmap for chalcopyrite phases. Red, green and blue correspond to large, medium and small volumes, respectively. (c) Graph plotting the diameter of chalcopyrite versus sphericity. (d) Three-dimensional heatmap for bornite phases (e) Graph plotting the diameter of bornite versus sphericity.
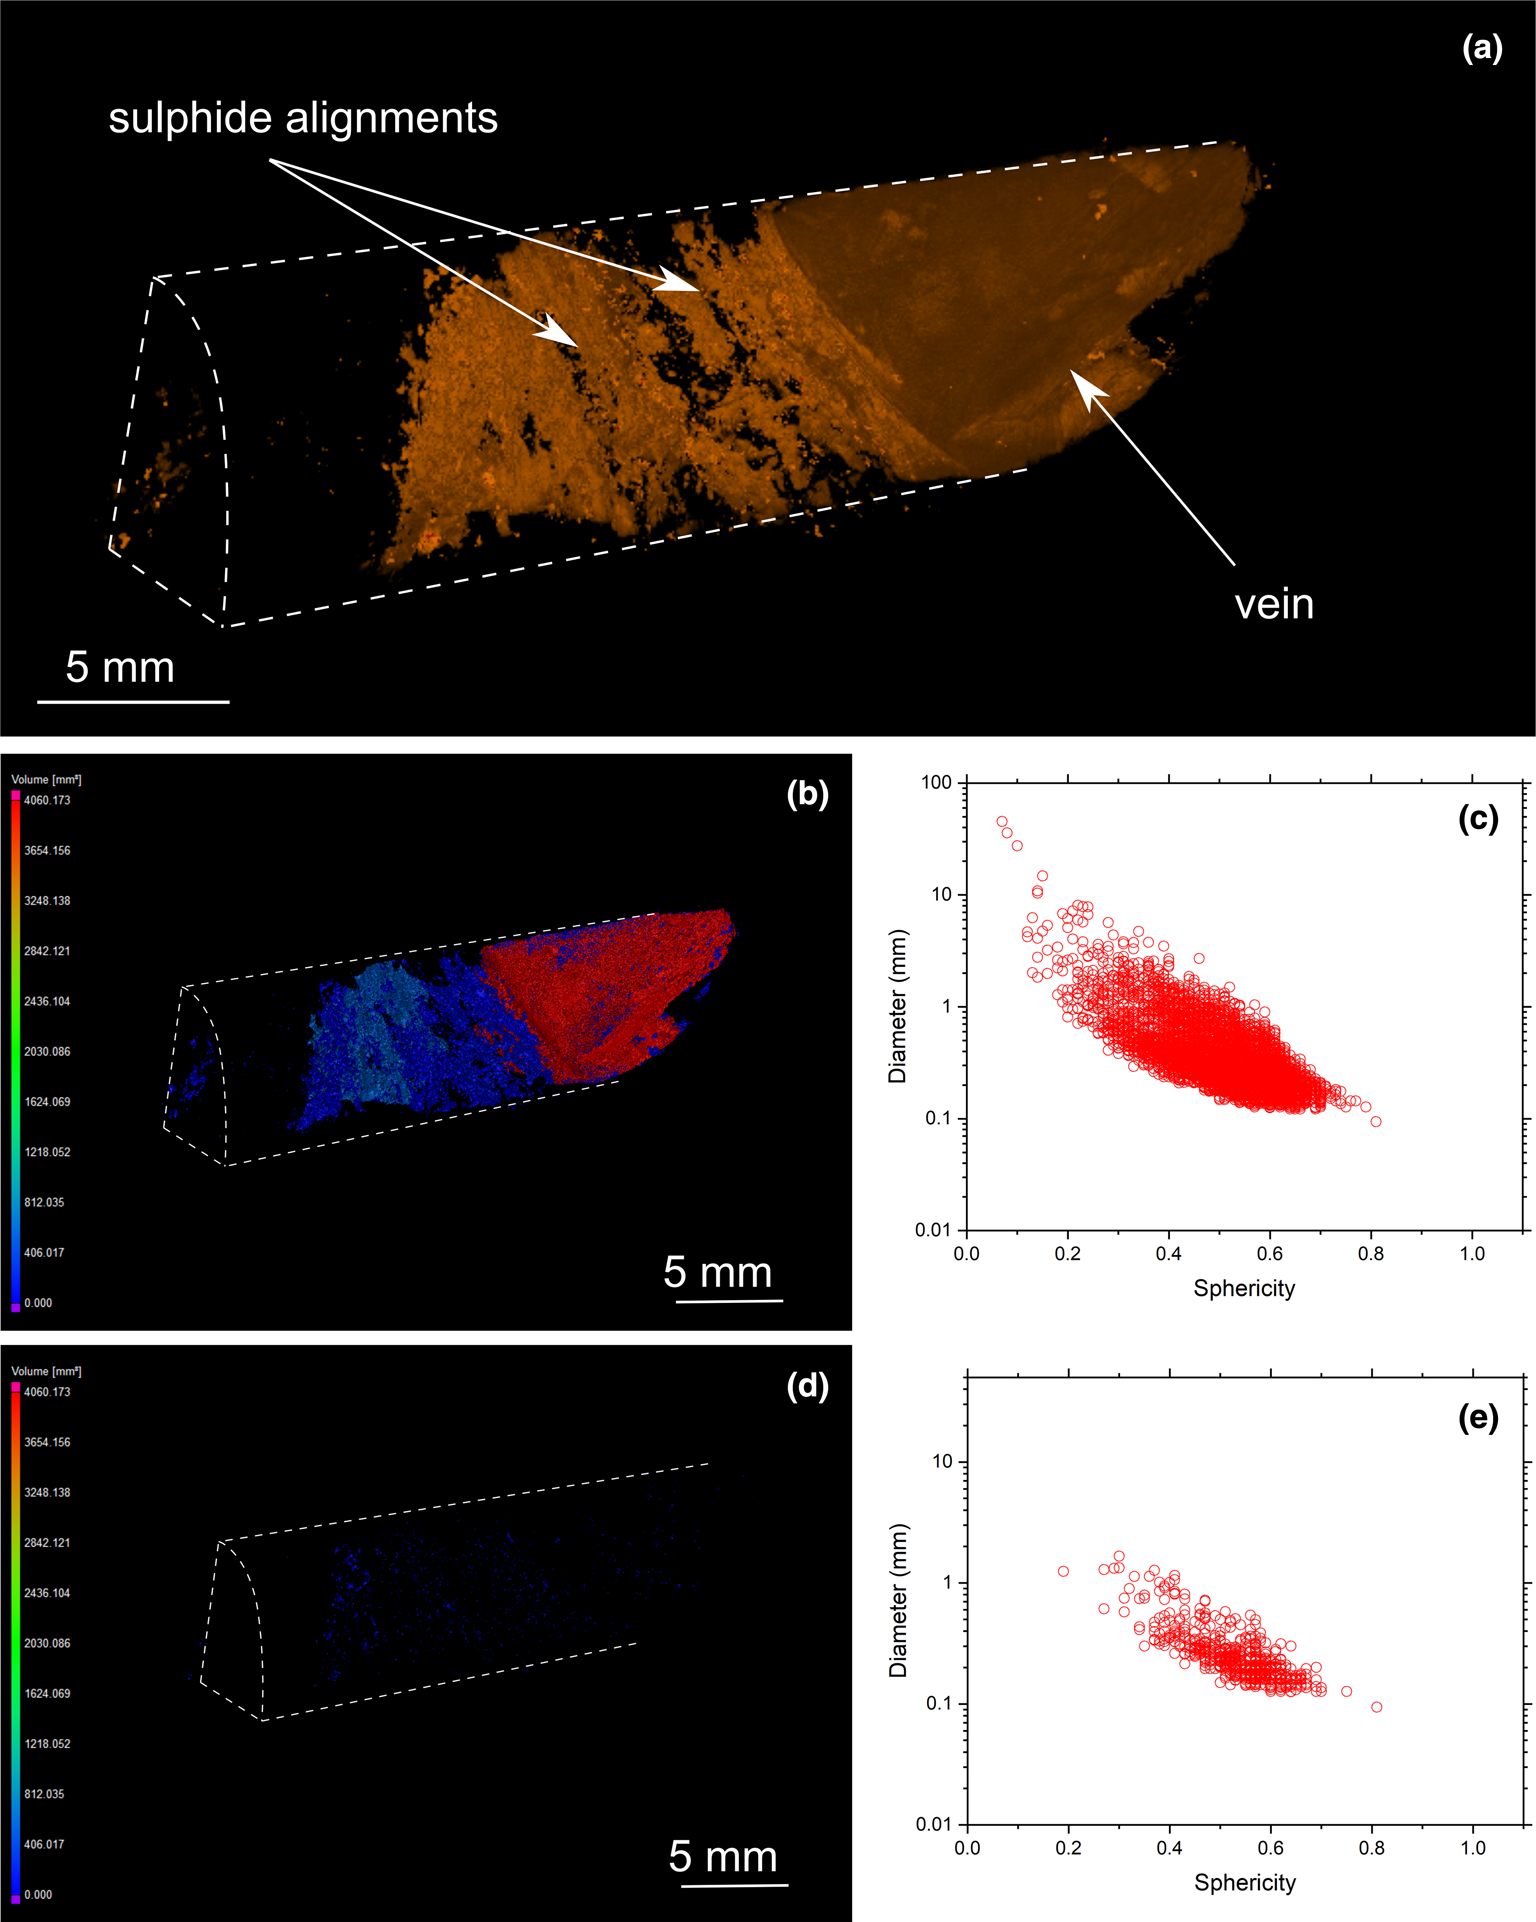
Another textural category is characterised by chalcopyrite veins (Fig. 11) showing a sharp contact with the host rock. The vein width reaches ~1 cm in this investigation (Fig. 11). Oriented sulfide assemblages are present adjacent to the vein. No fractures were observed between these alignments and the vein itself.
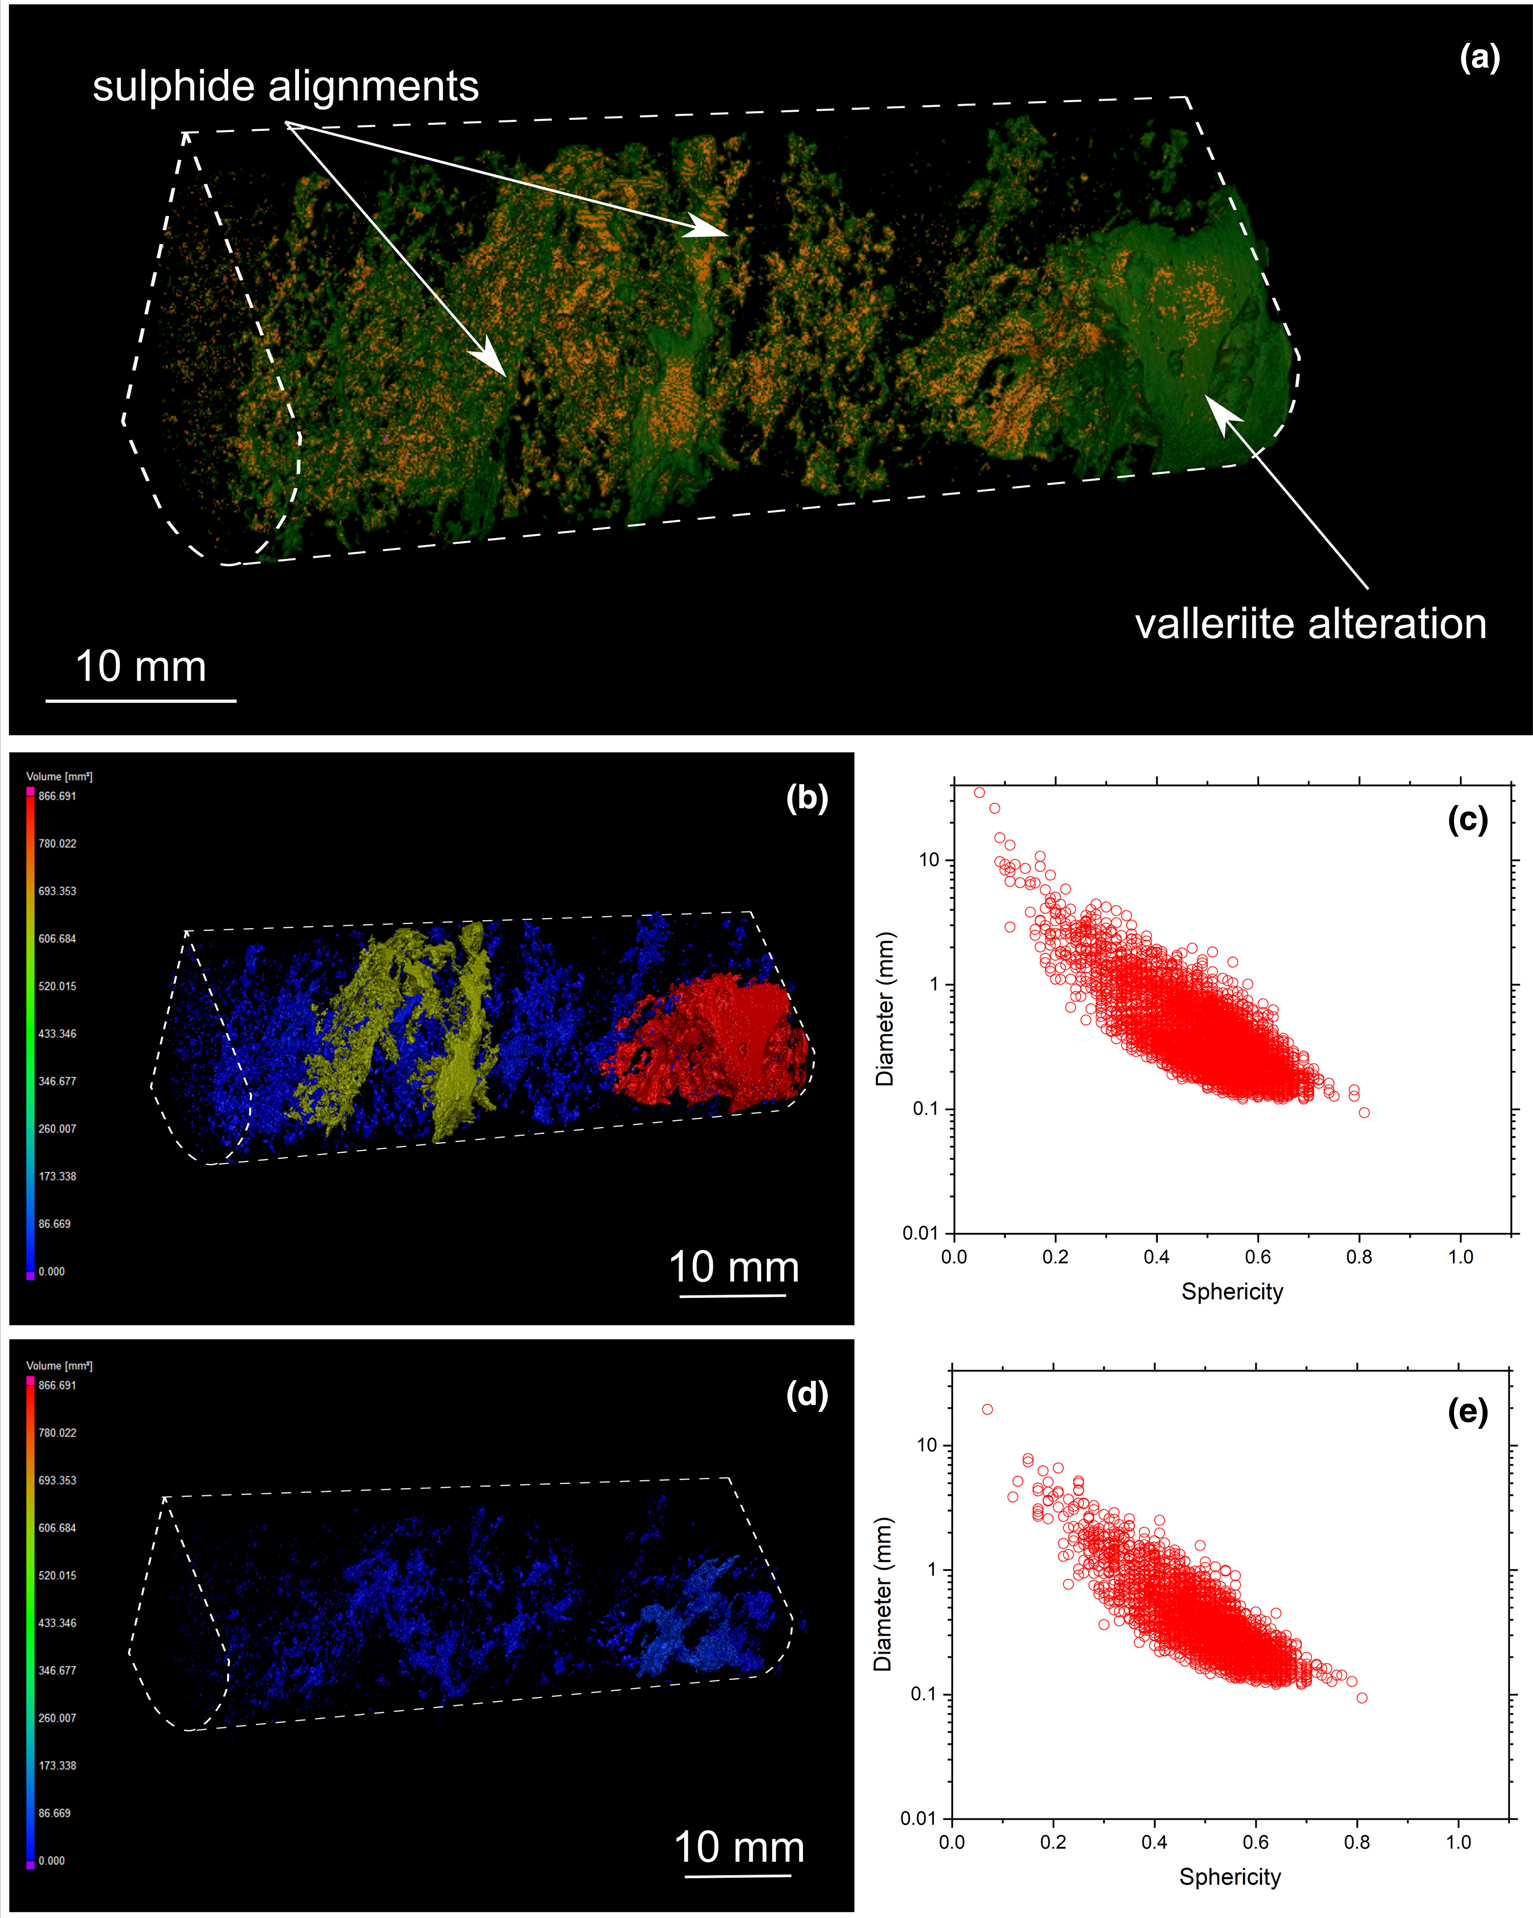
(a) Three-dimensional volume rendering of drill-core sample 33 (transgressive carbonatite) with chalcopyrite (orange) and valleriite (green). (b) Three-dimensional heatmap for chalcopyrite phases. Red, green and blue correspond to large, medium and small volumes, respectively. (c) Graph plotting the diameter of chalcopyrite versus sphericity. (d) Three-dimensional heatmap for magnetite phases (e) Graph plotting the diameter of magnetite versus sphericity.
MicroCT analysis also reveals the presence of late-stage valleriite associated with chalcopyrite and bornite (Figs 9 and 10). However, its distribution among the samples is heterogeneous: some samples are valleriite-free (Figs 6 and 8), whereas others host a significant amount of this mineral (Figs 9 and 10). MicroCT analysis documents the association of valleriite with all types of chalcopyrite and bornite mineralisation categories (disseminated, elongated assemblages and cumulates), except with chalcopyrite veins (Fig. 11).
Overall, sulfide grain sphericity is dependent on sulfide diameter: it increases with decreasing grain size. The sphericity of sulfides in the Loolekop Pipe ranges from 0.7 to 0.2, but can reach 0.05 in some samples (Figs 8c, 9c and 10c). A sphericity of less than 0.15 is typical of sulfide cumulates and corresponds to a sulfide diameter greater than 8 mm. Typically, a sphericity of 0.5 is for grain diameters of 0.1 to 1 mm. Sphericity increases to 0.7 for sulfides with a diameter of 0.1 to 0.3 mm.
Sulfide assemblage sizes are not entirely dependent on the sulfide type. However, the results show that disseminated sulfides occupy small volumes (typically up to 50 mm3; with some samples up to 100 mm3) whereas elongated assemblages typically range from 75 to 600 mm3. It can be difficult to distinguish elongated sulfides from cumulates as the volumes of these two types overlap.
Planar sulfide layers
Disseminated sulfides (Figs 9 and 10), as well as elongated sulfides (Fig. 8) and cumulates (Figs 7 to 9) display planar layers within the banded carbonatite and phoscorite. Layers of sulfides with particular textures might be in contact with layers of another type (Figs 7b, 8b, 9b and 10b). A common feature of the sulfides is the alternating array of several layered textures. Macroscopic banding is formed from the alternation between disseminated sulfide layers and flat elongated chalcopyrite–bornite assemblages, as well as sulfide cumulates.
The orientation of the sulfide layers is sub-perpendicular to the drill-core axis in the samples studied (Figs 7 to 9). Hence, the sub-horizontal dip of drill-core samples suggests that layers are sub-vertical and parallel to the phoscorite-banded carbonatite layers and to the external edges of the Loolekop Pipe (Appendix 1).
Discussion
Textures and origin of magmatic sulfide mineralisation
Characterisation of sulfide textures permits the recognition of different categories of mineralisation (Figs 5 to 11, Table 1). The first sulfide category, consisting of Cu-sulfide layers, is present in both banded carbonatite and phoscorite. As indicated by microCT results, fine-grained sulfides (<500μm) are disseminated in their host rock with no association with structural features, suggesting a synchronous emplacement with carbonates, Fe-oxides and silicates (Fig. 5a–e). These sulfides are probably of magmatic origin due to their inclusion in the host rock. This is in agreement with the model developed by Le Bras et al. (Reference Le Bras, Bolhar, Bybee, Nex, Guy, Moyana and Lourens2021), which suggests the occurrence of a mss–iss system within the Loolekop Pipe, with the fractionation of an ascending Cu-rich sulfide liquid from a mss remaining at depth, followed by the formation of an iss and the further crystallisation of bornite and chalcopyrite assemblages during the emplacement of the phoscorite and banded carbonatite. This assumption is supported by the PGE contents and the radiogenic Pb isotope composition of sulfide phases, reflecting a mantle origin of the ore material (Bolhar et al., Reference Bolhar, Whitehouse, Milani, Magalhães, Golding, Bybee, LeBras and Bekker2020; Le Bras et al., Reference Le Bras, Bolhar, Bybee, Nex, Guy, Moyana and Lourens2021). Moreover, an enrichment of PPGE over IPGE in disseminated sulfides is an indication of mss fractionation, therefore supporting the hypothesis of a magmatic origin of these ore phases. In mm- to cm-long elongated assemblages, bornite is mainly present inside the aggregates (e.g. Appendix 2, sample 22), making its recognition within the 3D model challenging. The relationship between bornite and chalcopyrite can only be assessed effectively by sequential observation of 2D attenuation projections or by optical microscopy (Figs 5a–b; Appendix 2). The lower resolution of microCT compared to electron microscope imagery does not permit the recognition of chalcopyrite exsolution or replacement in bornite, as well as other micrometre-scale textural features (Fig. 2; Hoffman and De Beer, Reference Hoffman and De Beer2012), suggesting that MLA mineral mapping should be used systematically for detailed textural investigations on sulfides having similar X-ray attenuation coefficients.
Sulfides are present as sub-vertical layers parallel to phoscorite and banded carbonatite layers (Figs 1, and 6 to 10; Appendices 1 and 2), suggesting that the controlling process for sulfide layering might be the same as for the banded carbonatite and phoscorite. A clear example of alternating gangue and sulfide banding can be observed in Fig. 9. Sulfide layer textures show no homogeneous characteristics, consistent with operation of several independent but similar ore-forming events (Mao et al. Reference Mao, Pirajno, Zhang, Chai, Wu, Chen, Cheng, Yang and Zhang2008).
MicroCT results show a clear dominance of chalcopyrite over bornite in disseminated sulfides (Figs 7b,d and 9b,d), which contrasts with previous studies. Microscopic observations rather indicate a bornite-dominated mineralisation suggesting a heterogeneous distribution of mineral assemblage types throughout the intrusive body (Le Bras et al., Reference Le Bras, Bolhar, Bybee, Nex, Guy, Moyana and Lourens2021). The presence of elongated sulfide assemblages with diameters of ~1 mm implies coalescence between sulfide droplets (Lesher and Groves, Reference Lesher and Groves1986; Robertson et al., Reference Robertson, Barnes and Le Vaillant2015). High-energy magma flow does not produce coalescence but rather the breakup of droplets with diameters greater than 1 mm (Lesher and Groves, Reference Lesher and Groves1986; de Bremond d’Ars, Reference de Bremond d'Ars, Arndt and Hallot2001). The planar orientation of elongated sulfides suggests a laminar flow, parallel to the banded carbonatite–phoscorite alternation layers (Robertson et al., Reference Robertson, Barnes and Le Vaillant2015). Massive sulfide cumulate layers are present within the Loolekop Pipe (Figs 7 to 10) pointing to accumulation of sulfide liquid resulting from the mechanical sorting and segregation of sulfide liquid from the silicate melt (Zeig and Marsh, Reference Zieg and Marsh2005; Vukmanovic et al., Reference Vukmanovic, Fiorentini, Reddy and Godel2018). These cumulates form exclusively during fast segregation. In such cases, sulfide liquid and silicate melt separate and the sulfide liquid forms a sulfide layer (Zeig and Marsh, Reference Zieg and Marsh2005). The presence of several layers of sulfides of different textures points towards an emplacement of several magma pulses with variable flow rates.
The relative proportions of bornite and chalcopyrite show substantial variation between the different sulfide layers (Appendix 2), suggesting a strong control of the mineral density in the formation of the different alignments. Considering spatially variable bornite–chalcopyrite modal proportions, it is possible that these sulfides were affected by mechanical sorting produced by rotating magma flow at variable rates during the ascent which contributed to the formation of the different types of sulfide assemblages during emplacement of the banded carbonatite and phoscorite and cooling of the system (Cabri, Reference Cabri1973). Trace-element compositions of magmatic sulfides are similar between banded carbonatite and phoscorite samples, regardless of some slight discrepancies for Co, Pb and Bi (Fig. 12 and Table 2). This is best explained by the homogenisation of the sulfide liquid during the ascent.
Trace-element compositions by LA-ICP-MS of Cu sulfides. Data summarised from Le Bras et al. (Reference Le Bras, Bolhar, Bybee, Nex, Guy, Moyana and Lourens2021).
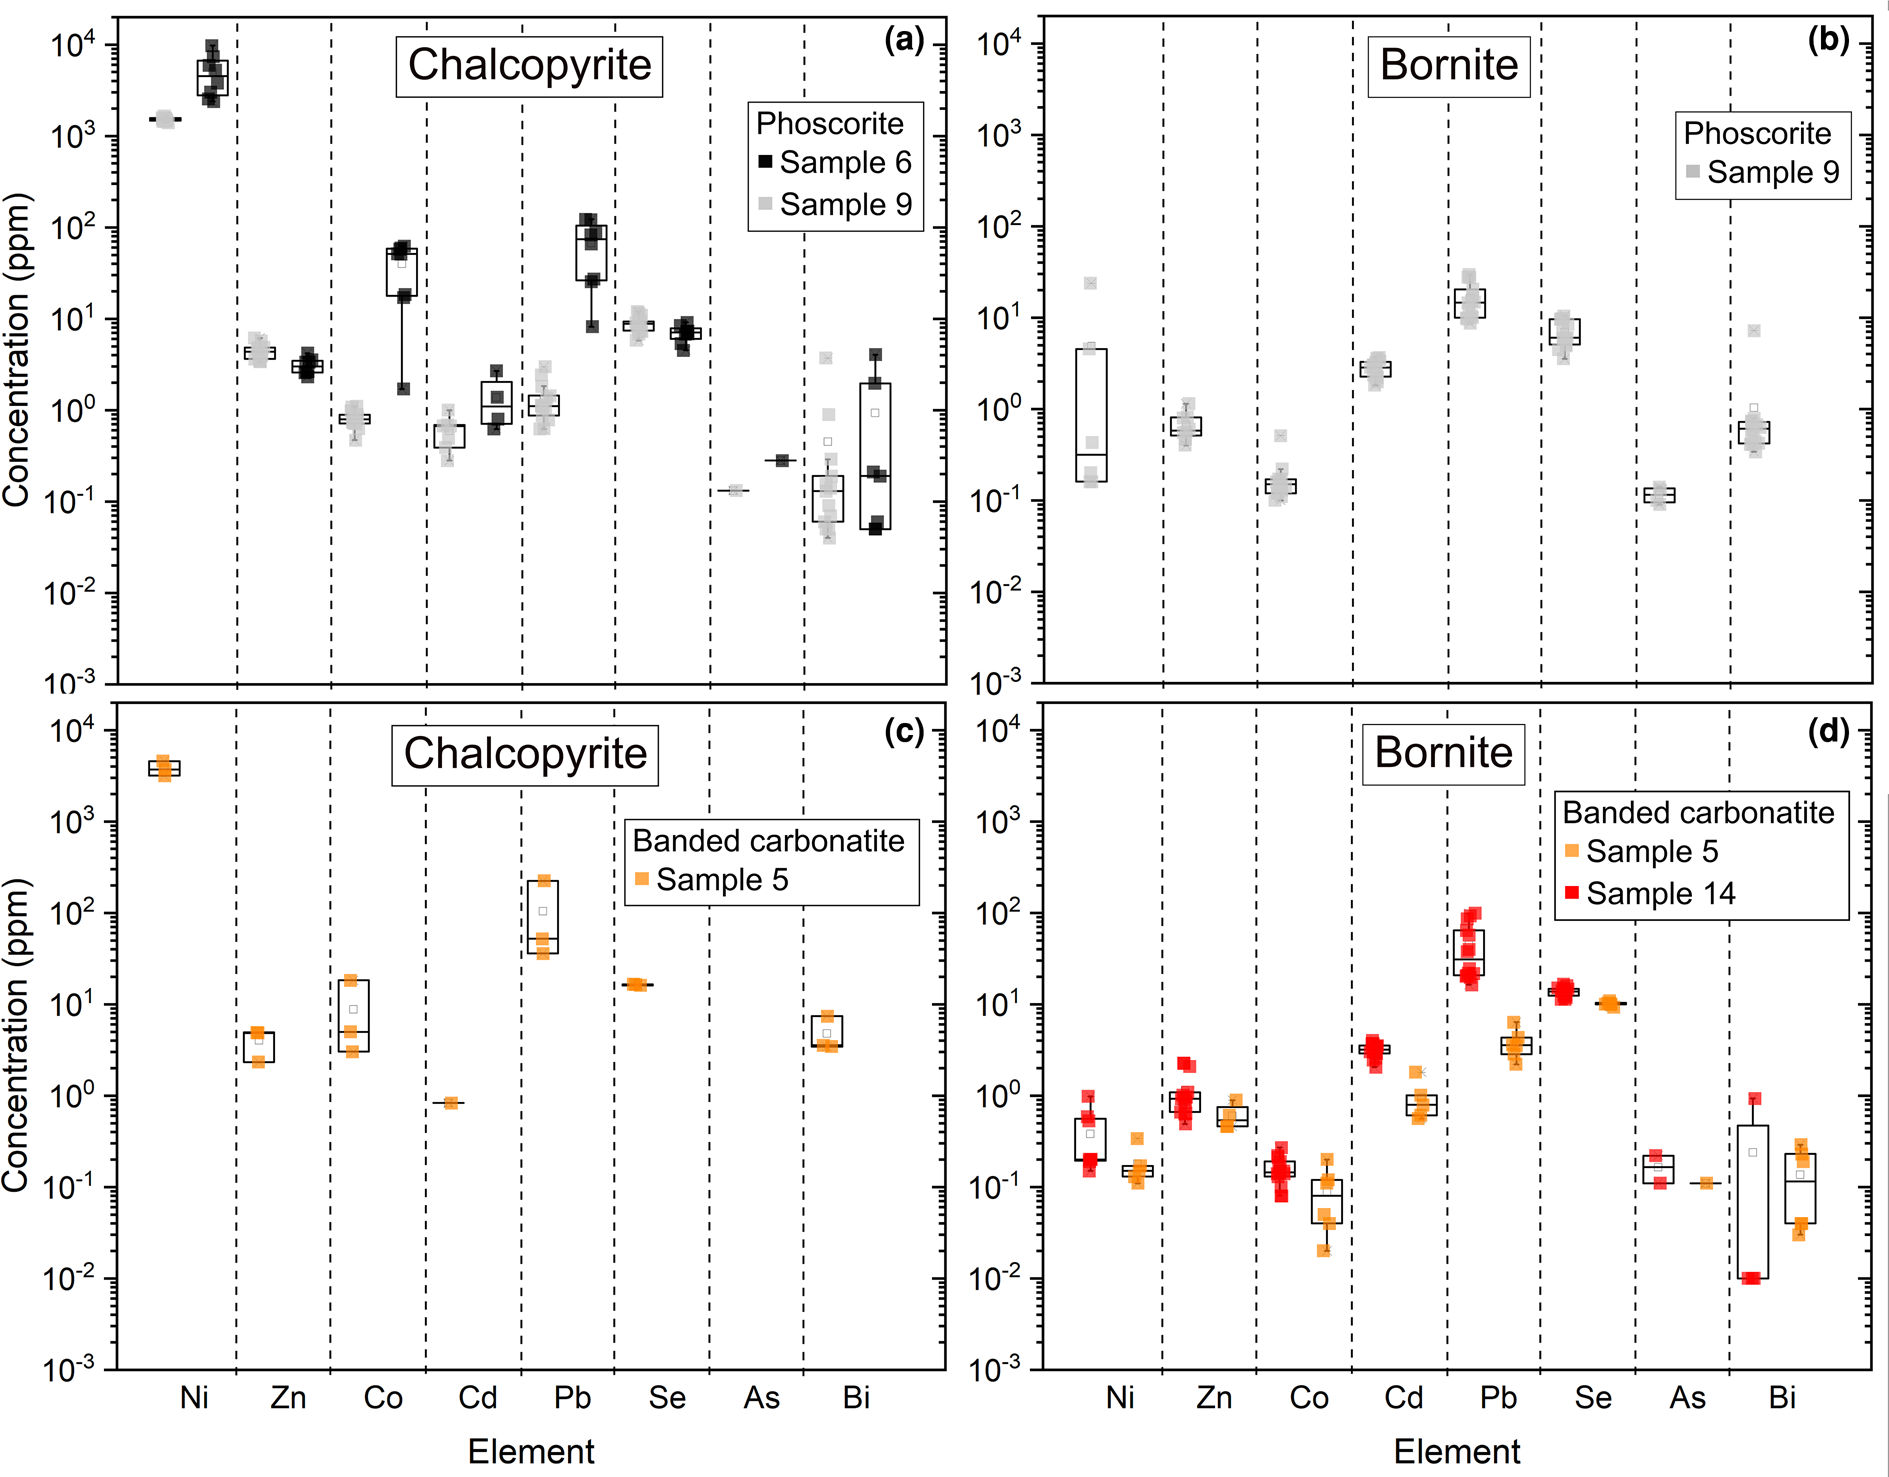
Trace-element composition averages for sulfide types in the samples analysed.
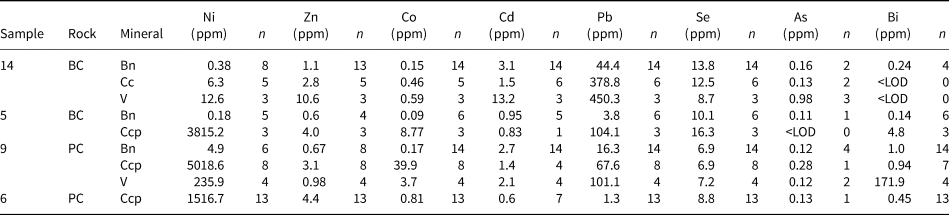
Bn = bornite; Cc = chalcocite; Ccp = chalcopyrite; V = valleriite; <LOD = below the level of detection. Data summarised from Le Bras et al. (Reference Le Bras, Bolhar, Bybee, Nex, Guy, Moyana and Lourens2021).
Banded carbonatite and phoscorite emplacement process
The presence of sub-vertical carbonatite–phoscorite banding and sulfide layers indicates the successive emplacement of different magma pulses in the Loolekop Pipe (Figs 13 and 14). These pulses show a progressive decrease in Fe-oxide, apatite and silicate contents from early- to late-stages of the intrusion process as suggested by the preferential emplacement of banded carbonatite towards the centre and phoscorite at the edge of the pipe. This feature furthermore suggests a cogenetic origin for the two rock types and control of immiscibility between their parent melts, similar to other occurrences of carbonatite–phoscorite intrusions (Brod et al., Reference Brod, Junqueira-Brod, Gaspar, Petrinovic, de Castro Valente and Corval2013). Textural and compositional uniformity of fluorapatite and calcite supports a cogenetic emplacement of both carbonatite and phoscorite in the Loolekop Pipe (Milani et al., Reference Milani, Bolhar, Frei, Harlov and Samuel2017b). On the basis of the composition of apatite and mica, Giebel et al. (Reference Giebel, Marks, Gauert and Markl2019) also advocated a common origin for these two rocks. In the Loolekop Pipe, immiscibility combined with density difference and magmatic flow leads to the preferential emplacement of phoscorite along the edges of the intrusion (Basson et al., Reference Basson, Lourens, Paetzold, Thomas, Brazier and Molabe2017; Giebel et al., Reference Giebel, Marks, Gauert and Markl2019). Another possibility for the genesis of the carbonatite and phoscorite involves fractional crystallisation (Skulski et al., Reference Skulski, Minarik and Watson1994; Veksler et al., Reference Veksler, Nielsen and Sokolov1998; Chakhmouradian, Reference Chakhmouradian2006; Milani et al., Reference Milani, Bolhar, Cawthorn and Frei2017a, Reference Milani, Bolhar, Frei, Harlov and Samuelb). Mineralogical zoning was also observed in both the Kovdor and Salmagorskii intrusions and ascribed to fractional crystallisation (Korobeinikov et al., Reference Korobeinikov, Mitrofanof, Gehör, Laajoki, Pavlov and Mamontov1998; Ivanyuk et al., Reference Ivanyuk, Kalashnikov, Pakhomovsky, Mikhailova, Yakovenchuk, Konopleva, Sokharev, Bazai and Goryainov2016). This zoning indicates that the alternation of phoscorite and carbonatite layers might have indeed resulted from the intrusion of several magma pulses undergoing fractional crystallisation. The rare earth element (REE) concentrations within rock samples do not reveal correlations among major oxide compositions, coupled with the wide REE variation range for each rock type (Fig. 13). These features are consistent with the successive intrusion of compositionally distinct melt pulses, in agreement with Milani et al. (Reference Milani, Bolhar, Frei, Harlov and Samuel2017b). Magma immiscibility during emplacement is probably responsible for the presence of alternating banded carbonatite–phoscorite layers (Krasnova et al., Reference Krasnova, Balaganskaya, Garcia, Zaitsev and Wall2004a,Reference Krasnova, Petrov, Balaganskaya, Garcia, Moutte, Zaitsev, Wall, Zaitsev and Wallb; Giebel et al., Reference Giebel, Marks, Gauert and Markl2019). The emplacement of carbonatite and phoscorite during several intrusion stages was also deduced for the Kovdor intrusion (Krasnova et al., Reference Krasnova, Balaganskaya, Garcia, Zaitsev and Wall2004a). The preferential emplacement of phoscorite along the external boundaries of the Loolekop Pipe can be best attributed to density separation during an eventual rotational movement of the magma (Basson et al., Reference Basson, Lourens, Paetzold, Thomas, Brazier and Molabe2017), facilitated by the intersection of fractures and shear zones, and the rotation of their segments relative to each other.
Covariation of La and major oxides in banded carbonatite, phoscorite, transgressive carbonatite and micaceous pyroxenite from the Loolekop Pipe. (a) La vs. SiO2; (b) La vs. CaO; (c) La vs. P2O5; and (d) La vs. Fe2O3. Data from Le Bras et al. (Reference Le Bras, Bolhar, Bybee, Nex, Guy, Moyana and Lourens2021).

Model of sulfide mineralisation in the Loolekop Pipe. (1) Melt pulses are sequentially emplaced, each forming phoscorite along their external boundaries and carbonatite towards the core of the intrusion as well as vertical alignments of sulfides. (2) Structural events occur during the precipitation of chalcopyrite from high-temperature hydrothermal fluids along the fractures. (3) Appearance of valleriite associated with late-stage fractures associated with chalcopyrite and bornite alignments.

Sub-vertical sulfide layers may have formed synchronously with the emplacement of the banded carbonatite and phoscorite by the intrusion of a significant number of magma pulses with variable magma flow rates.
Formation of hydrothermal sulfides
The sharp contact between chalcopyrite veins and host rock suggests the precipitation of Cu-sulfide along fractures from a hydrothermal fluid (Fontboté et al., Reference Fontboté, Kouzmanov, Chiaradia and Pokrovski2017; Yang et al., Reference Yang, Zhang, Santosh, Li and Liang2018) (Fig. 11, Appendix 2). The edges of hydrothermal veins can be easily distinguished from the magmatic cumulate texture, as the latter shows an intricate association with the gangue (Fig. 11). On the basis of sulfide textures alone, a magmatic origin of the mineralisation cannot be ruled out, and might be linked to an intrusion of sulfide melt into a veinlet network produced by fracturing during the emplacement of several magma pulses. However, a hydrothermal origin of these veins was demonstrated by combined trace-element and Cu and Fe isotope systematics (Le Bras, Reference Le Bras2020). Only one vein occurrence was observed in this investigation. This sulfide texture contrasts with disseminated and elongated Cu-sulfide assemblages, which commonly occur along irregular contacts with the gangue (Figs 7 to 9). Planar sulfide layers can occur adjacent to the veins (Fig. 11). It is unclear if the alignment of sulfides parallel to the vein are of hydrothermal origin. The corresponding 3D model shows no link between such alignments and the hydrothermal vein itself. The absence of disseminated grains and cumulates suggests that such preferred orientations might have resulted from the filling of fractures with sulfides within the gangue, possibly by hydrothermal fluid precipitation associated with mineral dissolution (Le Bras et al., Reference Le Bras, Bolhar, Bybee, Nex, Guy, Moyana and Lourens2021). The resolution of microCT is insufficient to allow identification of small fractures that might have acted as pathways for hydrothermal fluids within the host rock (Hoffman and De Beer, Reference Hoffman and De Beer2012). A cogenetic link between hydrothermal vein and adjacent sulfide phases, however, is a viable assumption. As suggested in a previous study (Le Bras, Reference Le Bras2020), similar Fe isotope compositions between hydrothermal chalcopyrite and adjacent sulfide assemblage networks indicate gangue mineral dissolution by hydrothermal fluids and precipitation of sulfides into the resulting voids within the host rock along the contacts to hydrothermal mineralisation.
Late-stage alteration characteristics
Several hypotheses exist regarding the origin of valleriite within the Loolekop Pipe: (1) alteration and replacement of magmatic and hydrothermal sulfides by valleriite (Lombaard et al., Reference Lombaard, Ward-Able, Bruce and Haughton1964; Palabora Mining Company Ltd. Staff, 1976; Giebel et al., Reference Giebel, Gauert, Marks, Costin and Markl2017; Milani et al., Reference Milani, Bolhar, Cawthorn and Frei2017a); (2) dissolution of magmatic and hydrothermal sulfide phases and re-precipitation of dissolved material as valleriite (Giebel et al., Reference Giebel, Gauert, Marks, Costin and Markl2017; Milani et al., Reference Milani, Bolhar, Frei, Harlov and Samuel2017b); and (3) deposition of a thin valleriite film on the primary sulfides (Palabora Mining Company Ltd. Staff, 1976). The desulfurisation of primary sulfides by fluid alteration resulting in the formation of both valleriite and magnetite is our preferred explanation (Le Bras et al., Reference Le Bras, Bolhar, Bybee, Nex, Guy, Moyana and Lourens2021).
Microscopic observations and microCT analysis show alteration of magmatic sulfides by late-stage fluids, as well as their dissolution and re-precipitation in the form of valleriite along adjacent fractures (Figs 9 and 10; Appendix 2, sample 57). A dissolution–(re)precipitation cycle related to late-stage fluid circulation is possible, but valleriite might be predominantly the result of in situ magmatic sulfide alteration as shown by the dominant presence of valleriite at the external boundaries and along fractures within magmatic sulfide phases (Figs 2b, 5b, 9 and 10). Gangue-filled fractures in proximity to valleriite–magmatic sulfide assemblages support fluid circulation and in situ replacement of primary sulfides by valleriite. Three-dimensional images show no major fractures filled with valleriite across the host rock (Appendix 2, sample 53), suggesting both a limited dissolution–precipitation episode and rapid precipitation of the dissolved material indicating desulfurisation and replacement of magmatic sulfides by valleriite and magnetite along fractures and mineral surfaces (Mücke, Reference Mücke2017; Le Bras et al., Reference Le Bras, Bolhar, Bybee, Nex, Guy, Moyana and Lourens2021). The texture of valleriite supports this hypothesis (Hakris and Vaughan, Reference Hakris and Vaughan1972).
Valleriite is distributed heterogeneously among the samples. For instance, some samples are unaffected by the alteration of chalcopyrite–bornite assemblages and valleriite formation (e.g. Fig. 8). Circulation of late-stage fluids might have been facilitated by a structural event post-dating the emplacement of magmatic and hydrothermal mineralisation forming a dense fracture network (Fig. 14). The absence of fractures and veins, conversely, may not have been conducive to fluid circulation and, consequently, formation of valleriite, leaving primary sulfide assemblages essentially intact.
Conclusions
MicroCT analysis of several drill-core samples, representing three major rock types (phoscorite, banded and transgressive carbonatites) within the Loolekop Pipe of the Phalaborwa Igneous Complex reveal the presence of sub-vertical sulfide layers parallel to alternating phoscorite and banded carbonatite layers. These layers display three distinct textures: (1) small (< 500 μm) disseminated sulfides; (2) elongated flat sulfide aggregates (>1 mm); and (3) chalcopyrite cumulates (>mm wide). The irregular and rounded surface of elongated aggregates parallel to the layer axis suggests that they formed by coalescence of sulfide grains. Modal proportions of bornite and chalcopyrite differ from one layer to another, suggesting a strong control of the mechanical sorting in the formation of the different textures of magmatic sulfide phases. The alternating distribution of banded carbonatite and phoscorite reinforce the notion that the banded carbonatite and phoscorite, as well as the sulfide layers, resulted from emplacement of several successive magma pulses. These pulses became increasingly depleted in Fe-oxides, silicates and phosphate in the course of intrusive activity. Melt immiscibility, rotation and the involvement of several magma pulses could have resulted in the formation of alternating carbonatite and phoscorite banding, as well as sub-vertical sulfide layers hosted within these two rock types. Sulfide textures formed in response to variations in magma flow rate, in sulfide liquid volume as well as changing conditions during magmatic activity. Disseminated sulfide layers might have formed from sulfide droplets under high magma flow rates, whereas elongated sulfides could have resulted from coalescence of sulfide droplets under low magma flow rates and sulfide cumulates from segregation and accumulation of sulfide liquid at the external boundaries.
High-temperature hydrothermal fluids precipitating large amounts of chalcopyrite along fractures across the Loolekop Pipe also circulated within small fracture networks adjacent to the hydrothermal vein itself, forming small-sized chalcopyrite and bornite assemblages within the host rocks (Le Bras et al., Reference Le Bras, Bolhar, Bybee, Nex, Guy, Moyana and Lourens2021). These sulfide networks are classified as disseminated grains in this study due to the size of the fractures allowing hydrothermal fluids to circulate which is below the microCT resolution.
Valleriite is derived from the alteration of pre-existing magmatic sulfides. Valleriite was not observed along fractures across the gangue in this study, indicating a limited role of dissolution / re-precipitation. The alteration is heterogeneous across the Loolekop Pipe and was probably controlled by the presence of fractures. Only sulfides in proximity to fractures were affected by late-stage alteration and valleriite formation, leaving parts of the magmatic and hydrothermal sulfide layers unaltered.
Supplementary material
To view supplementary material for this article, please visit https://doi.org/10.1180/mgm.2021.32
Acknowledgements
We thank Thabitha Moyana and Paulien Lourens from the Palabora Mining Company (PMC) for providing access to sample drill-core material. Jakobus Hoffman is acknowledged for his help during measurements and data processing. Caiphas Majola prepared and polished blocks at the University of the Witwatersrand. Professor David Good and the two anonymous reviewers are thanked for their constructive comments that have helped to improve this paper. The support of the DSI-NRF Centre of Excellence for Integrated Mineral and Energy Resource Analysis (DSI-NRF CIMERA) towards this research is hereby acknowledged. Opinions expressed, and conclusions arrived at, are those of the authors and are not to be attributed to the DSI-NRF CIMERA.


 Open access