

INTRODUCTION
The incidental catch of non-target species, or bycatch, is a long recognized and globally widespread concern for fisheries, and presents a formidable challenge to sustainable management of marine resources. Bycatch has been linked to declines in many marine organisms, including sea turtles, marine mammals, fishes, and mobile and sessile invertebrates (Alverson et al. Reference Alverson, Freeberg, Pope and Murawski1994; Dayton et al. Reference Dayton, Thrush, Agardy and Hofman1995; Kelleher Reference Kelleher2005; Dulvy et al. Reference Dulvy, Fowler, Musick, Cavanagh, Kyne, Harrison, Carlson, Davidson, Fordham and Francis2014), and can have lasting indirect effects on marine systems (Dayton et al. Reference Dayton, Thrush, Agardy and Hofman1995; Hall et al. Reference Hall, Alverson and Metuzals2000; Myers et al. Reference Myers, Baum, Shepherd, Powers and Peterson2007; Crowder et al. Reference Crowder, Hazen, Avissar, Bjorkland, Latanich and Ogburn2008). Elasmobranchs (namely sharks, rays and skates) are one group that can be particularly vulnerable to population-level effects of targeted or incidental catches because of their low biological productivity, which is a product of slow growth, late age at maturity, relatively low reproductive rates, and extended longevity (see for example Holden et al. Reference Holden1973; Stevens et al. Reference Stevens, Bonfil, Dulvy and Walker2000; Cortes Reference Cortes2002). However, catch estimates for non-target species, which often include elasmobranchs, have historically been and remain poorly documented (Shotton Reference Shotton1999; Dulvy et al. Reference Dulvy, Metcalfe, Glanville, Pawson and Reynolds2000; Stevenson & Lewis Reference Stevenson and Lewis2010), making it difficult to quantify total mortality, a crucial component to population status assessments and sustainable management.
Although non-target catch is a concern for many long-lived marine vertebrate species (Lewison et al. Reference Lewison, Crowder, Read and Freeman2004; Read et al. Reference Read, Drinker and Northridge2006; Lewison et al. Reference Lewison, Crowder, Wallace, Moore, Cox, Zydelis, McDonald, DiMatteo, Dunn, Kot, Bjorkland, Kelez, Soykan, Steward, Sims, Boustany, Read, Halpin, Nichols and Safina2014), elasmobranch non-target catch is a particularly complex problem to study and manage. Whereas the non-target catch of seabirds, marine mammals or sea turtles is not typically sold commercially (although there are exceptions to this; see Robards & Reeves Reference Robards and Reeves2011), incidentally caught elasmobranchs are commonly retained and may be an important component of commercial yield from landed catch, driven by demand from both national and international markets (Walker Reference Walker1998; Fong & Anderson Reference Fong and Anderson2002). Thus, the line between elasmobranch target catch and non-target catch is often unclear. Additionally, as catches of many traditionally targeted species decline (Dulvy et al. Reference Dulvy, Baum, Clarke, Compagno, Cortes, Domingo, Fordham, Fowler, Francis, Gibson, Martinez, Musick, Soldo, Stevens and Valenti2008; Ward-Paige et al. Reference Ward-Paige, Keith, Worm and Lotze2012), fishers are landing more and different species than before. As a consequence, current regulations may be inadequate, resulting in unmanaged and unmonitored fishing (Davies et al. Reference Davies, Cripps, Nickson and Perter2009). These evolving fishing practices highlight the importance of measuring both discarded and retained catch for non-target species to better assess fisheries impacts on populations and ecosystems.
Global landings of elasmobranchs are readily available from the Food and Agriculture Organization of the United Nations (FAO 2014), and the level and specificity of reporting is increasing (Fischer et al. Reference Fischer, Erikstein, D’Offay, Barone and Guggisberg2012). However these data are incomplete as metrics of fishery removals (landed catch and dead discards) as they only report retained (landed) catch, and do not include discarded catch. Data on discard and retention rates are therefore essential to improving estimates of total catch for particular regions, gear types, and species. Discard rates are highly variable by species, gear, fishing location, and other factors (Murawski Reference Murawski1996; Harrington et al. Reference Harrington, Myers and Rosenberg2005; Rochet & Trenkel Reference Rochet and Trenkel2005; Feekings et al. Reference Feekings, Bartolino, Madsen and Catchpole2012). The decision to retain or discard non-target catch is complex and dynamic, driven by multiple factors including fishing regulations, environmental conditions, fisher's preferences, and market forces (Catchpole et al. Reference Catchpole, Enever, Maxwell, Armstrong, Reese and Revill2011). While globally ubiquitous, discarding has been identified as a wasteful practice that should be minimized (FAO 1995; Harrington et al. Reference Harrington, Myers and Rosenberg2005; Bellido et al. Reference Bellido, Santos, Pennino, Valeiras and Pierce2011). To determine total elasmobranch removals and understand the effect of fisheries on elasmobranch populations (Barker & Schluessel Reference Barker and Schluessel2005; Molina & Cooke Reference Molina and Cooke2012), estimates of discards, including rates of post-discard survival are needed (Morgan & Carlson Reference Morgan and Carlson2010; Braccini et al. Reference Braccini, Rijn and Frick2012). Viana et al. (Reference Viana, McNally, Graham, Reid and Jackson2013) demonstrated that excluding discards leads to underestimates of fishing pressure in Irish demersal fisheries.
Worm et al. (Reference Worm, Davis, Kettemer, Ward-Paige, Chapman, Heithaus, Kessel and Gruber2013) provided the most recent estimate of annual total shark mortality (landings + discards + illegal, unreported and unregulated catch) at 1445000 t in 2000. This estimate is far larger (by 226%) than the total shark landings reported by FAO for the same year (503000 t). The clear discrepancy between these two values illustrates the importance of accounting for all catch. Even so, the Worm et al. (Reference Worm, Davis, Kettemer, Ward-Paige, Chapman, Heithaus, Kessel and Gruber2013) estimate may still underestimate global elasmobranch discards, as their discard rate was derived from observer data from pelagic longline shark fleets and does not address discard rates of other gear types. Additionally, this estimate only included sharks, not batoids, which comprise a significant amount of target and non-target catch (Machado et al. Reference Machado, Gordo and Figueiredo2004; White & Dharmadi Reference White and Dharmadi2007; Estalles et al. Reference Estalles, Coller, Perier and Di Giacomo2011). If discard rates differ taxonomically or by gear, then using data from only the pelagic longline fishery will bias total catch estimates.
To address how different estimates of discard rates affects the current understanding of estimates of total elasmobranch removals, we analysed data from published literature on non-target elasmobranch catch in fisheries within twelve exclusive economic zones (EEZs; approximately coastline to 370 km) around the world. These data were used to identify drivers of elasmobranch retention and discard rates, particularly taxon, country, and type of fishing gear. This analysis is the first effort to directly characterize global drivers of discard versus retention rates for elasmobranch non-target catch. We also show how these drivers may help contextualize FAO landings data. Exploring these drivers is necessary to improve the accuracy of total elasmobranch removal estimates and highlights the importance of quantification of retention and discard rates to better inform assessments of the potential impacts of fisheries on elasmobranchs.
METHODS
Database of non-target elasmobranch catch
We developed a non-target catch database from published literature that reported non-target catch for 306 elasmobranch species from fisheries, within twenty-eight EEZs that deployed net, trawl, and line gear between 1954 and 2010. Multiple literature searches were conducted using combinations of the following keywords: chondrichthyan, elasmobranch, shark, ray, skate, bycatch, catch, non-target, incidental, and discard. Elasmobranch non-target catch rates were collected from 117 articles (peer-reviewed and grey literature; for a full list of references used to compile the database, see Supplementary material). Grey literature consisted of national government publications from Australia, Canada and the USA, state publications from Alaska and California, FAO publications, and international meeting publications from the International Commission for the Conservation of Atlantic Tunas and Standing Committee on Tuna and Billfish. While there was broad representation from EEZs worldwide, data were missing from some regions (for example, no published data were available from the North-west Pacific Ocean). Information extracted into the database included the following: non-target catch rate (catch per unit effort), non-target catch species, non-target catch amount (number of individuals or weights), amount retained and/or discarded, gear type, fishing effort, fishing location and year, target species, and total catch (number of individuals or weights). Each reported non-target catch rate for a given combination of species, gear type, and year was treated as a unique record. Most literature sources yielded several records detailing non-target catch incidents of many species over multiple years.
Retention rate dataset
To investigate drivers of retention and discards of elasmobranch non-target catch, the whole database was filtered to only include records that reported species-, genus-, or family-specific amount retained or discarded and total amount caught. From these the response variable, retention rate, was calculated as individuals retained divided by total individuals caught (retained plus discarded). Non-target catch records reported by mass were converted to number of individuals using average length caught and species-specific length-weight relationships (Table S1, see Supplementary material). We then filtered the database subset for our analysis first, to records that reported non-target catch of at least fifty individuals of a species, and second, to at least five records for each category (for example catsharks) of the explanatory variables (taxon, country, and gear type). These filters were applied to avoid bias from sources with small sample sizes. The final dataset of retention rates used for analysis included 299 records (Fig. 1) from thirty-nine separate sources with an average of 7.67 bycatch records per source (range: 1–33 records per source) and a median of six records per source. There was an average of 3.69 species per source (range: 1–15 species per source) and 4.97 years of data per source (range: 1–21 years per source) with data from 1981 to 2009. This dataset (and entire database) is available for public use at http://doi.org/10.1594/PANGAEA.844726.
Distribution of records used in analysis (n = 299). Circle size represents the number of records at each location.

We examined relationships between the retention rates and three variables: taxon, country, and gear type. We defined eleven taxonomic groups that represent genera and groupings of genera (Table S2, see Supplementary material) based on taxonomy, morphology, similarities in habitat use, and at least five records in each group. Taxonomic groups rather than individual species were used in many cases because many species were represented in the database with too few records (< 5) for useful analysis. Countries that fished in multiple ocean basins were divided accordingly (for example United States Atlantic Ocean and United States Pacific Ocean). This resulted in fourteen fishing countries and sixteen country-ocean combinations with at least five records for each (Table 1). Each country was represented by data from within its own EEZ in this dataset, except Japan and the Faroe Islands, which are represented only by their fisheries in Atlantic Canada's EEZ. We also included gear as a predictor variable because different gear types interact with different species. Gear types represented four gear categories (bottom gillnet, bottom trawl, bottom longline, and pelagic longline), based on gear structure, general water column position, and at least five records each. The retention rates were not adjusted by sampling effort or fishery size. These unadjusted retention rates should therefore be treated cautiously, as records included in this dataset were based on available data rather than random sampling. Some combinations of taxon, country, and gear type will therefore have more influence on the unadjusted retention rates than the corresponding fishery size warrants, and variance will likely be underestimated compared to a true random sample. We used violin plots (in R package vioplot; Adler Reference Adler2005) to visualize patterns and explore variation in these retention rates across the three variables. A violin plot replaces the box in a box-plot with a kernel density plot, so the distribution of a variable dictates the shape of its violin plot.
Description of country abbreviations.

Regression tree and random forest analysis
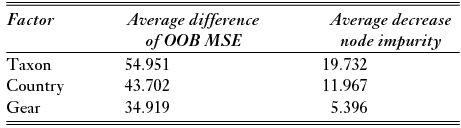
To determine which combinations of variables best described the drivers of non-target catch retention rates, we used a regression tree to consider effects of taxon, gear, and country and an extension of the regression tree, called a random forest, to identify which variable explained the most variation. Analyses were conducted in R using the packages rpart (Therneau et al. Reference Therneau, Atkinson and Ripley2013) and randomForest (Liaw & Wiener Reference Liaw and Wiener2002). A regression tree splits data into homogenous groups based on specified predictor variables using the best split of the data (Breiman et al. Reference Breiman, Friedman, Olshen and Stone1984). Pruning of a regression tree removes distal leaves and nodes to reduce over-fitting of the tree to the data and to minimize cross-validation error (Breiman et al. Reference Breiman, Friedman, Olshen and Stone1984). A random forest takes a specified number of bootstrap samples and creates a regression tree for each using a random subset of variables at each split resulting in many trees or a ‘forest’ (Liaw & Wiener Reference Liaw and Wiener2002). Five hundred trees were constructed in this random forest analysis. Performance of the random forest is based on the percentage variation explained by the included variables. Variable importance was measured by the average difference in out-of-bag mean square error (OOB MSE) and the average decrease in node impurity among various tree constructions; the larger the value of these, the more important the variable (Liaw & Wiener Reference Liaw and Wiener2002). The OOB MSE measures the prediction error of the data not included in each bootstrap sample, and node impurity measures the variation of data within a node (Breiman et al. Reference Breiman, Friedman, Olshen and Stone1984; Liaw & Wiener Reference Liaw and Wiener2002).
Analysis of FAO data
Global elasmobranch landings data are available from the ‘Fishstat’ FAO online landings database (FAO 2014). For countries that reported landings of species matching the taxon-country entries in our dataset, we applied average retention rates for the respective taxon-country combination (for example skates caught in Argentina's EEZ) to available FAO landings data to make an inference about potential removal levels above reported landings. Gear type was not available from FAO. Landings data were reported as annual values; these were summed across years that corresponded with taxon- and location-specific records in our dataset. The estimated total removals were calculated as the reported landings divided by the average retention rate. The estimated additional removals are the estimated total removals minus the reported landings. In this calculation, average retention rate is based on small sample sizes (few records) in some cases and may produce an overestimate of removals when the retention rate is close to zero. The estimated removals metric assumes 100% mortality of discarded catch, which also is an overestimate in many cases, but the goal of this analysis was to demonstrate the magnitude of elasmobranchs caught above and beyond the reported landings.
RESULTS
Average retention rates were highly variable across taxa, gears and countries. The average retention rate of the entire dataset was 39.2% (SD = 43.5%). Twenty per cent (n = 59) of the records in the dataset had 100% retention, 34% (n = 102) had 0% retention, and 46% (n = 138) were in-between (0.1 to 99.3%). The average retention rates of taxonomic groups ranged from 0.3 to 92.1% and displayed some clear patterns (Fig. 2a). Average retention rates varied by gear, but generally were low; average retention rates did not exceed 60% for any gear type (Fig. 2b). The average retention rates within fishing countries ranged from 0 to 87.6% (Fig. 2c). A majority of fishing countries (10 of 16) had a low average retention rate (< 30%).
Violin plot of per cent retained by (a) taxonomic group, (b) gear type, and (c) fishing country. The white square is the median, the black vertical bars are interquartile ranges with 95% confidence intervals extended as black lines, and the grey fill represents the kernel density estimation. Sample size is in parentheses. Country codes are as in Table 1.

Our final regression tree included taxon, gear, and country as important variables with nine splits and 10 terminal nodes (Fig. 3). Pruning to minimize cross-validation error resulted in multiple trees of three, four, five, six, and nine node splits at frequencies of 2, 8, 18, 50, and 422 out of 500 trials, respectively. The most frequent tree in the pruning analysis was the unpruned tree with nine node splits, therefore the final regression tree was not pruned.
Regression tree of per cent retained by taxon, country, and gear, depicting variable distribution of each node and leaf. Higher retention rates split to the right and lower ones to the left. Percentages represent average retention rate of each branch with sample sizes (n) at the terminal nodes. Country codes are as in Table 1.

The regression tree analysis demonstrates that taxon was an important determinant of retention, as the first split was defined by high retention rates (average 85.4%) of Alopias, Isurus, and smoothhounds relative to the rest of the taxonomic groups (average 23.7%; Fig. 3). Fishing country also influenced tree architecture, yielding the second level splits in the tree. Countries that were represented on both the right (Alopias, Isurus, and smoothhounds) and the left (eight other taxonomic groups) sides of the tree were split similarly regardless of taxon (for example Argentina), except for Japan, Faroe Islands and Canada fishing in the Atlantic. These last three fishing countries had relatively high retention rates of Isurus and relatively low retention rates of other taxa (Fig. 3). Gear type had the least influence on retention rate, as it only caused splits on the fourth and fifth levels of the tree. The random forest with taxon, gear and country as variables explained 59% of the variance in retention rates, and the mean squared residual was 0.076. Based on variable importance, taxon was most important, followed by country, and then gear type (Table 2).
Variable importance according to random forest analysis measured with two metrics: the average difference of out-of-bag mean square error (OOB MSE) and the average decrease in node impurity. Larger values indicate more important variables.
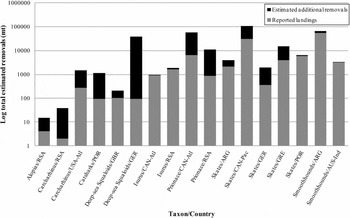
The range of reported landings that corresponded with our taxon- and country-specific average retention rates was 0–55287 mt (Fig. 4). Squalus did not have any country-specific landings in the FAO database that matched our dataset. Based on estimates of retention rates for the taxon-country combinations represented in our database, estimated total removals ranged from 15 mt for Alopias from South Africa to 106321 mt of skates caught in the Canadian Pacific (Fig. 4). Reported FAO landings augmented by retention rate estimates, resulted in the range of estimated total elasmobranch removals being 1.01–400 times the reported FAO landings. Deep-sea squaloids from Spain and rays from the United States Pacific had no reported landings and retention rates of zero in our database. For ten taxon-country combinations, we could not estimate total or additional removals; in two cases this was because reported landings were zero even though retention rate estimates in our database were positive, while in the other eight cases, reported landings were positive even though retention-rate estimates in our database were zero.
Estimated total elasmobranch removals. Grey fill is FAO reported landings. Black fill is additional removals of elasmobranchs calculated as FAO reported landings divided by retention rate minus FAO reported landings. Country codes are as in Table 1.
DISCUSSION
Our study is the first attempt at a global synthesis of retention and discard drivers for non-target catch of elasmobranchs. We found that the average retention rate for the entire dataset was highly variable (SD = 43.5%). This is not surprising as retention has been documented to vary in many fisheries (Alverson et al. Reference Alverson, Freeberg, Pope and Murawski1994; Kelleher Reference Kelleher2005 Feekings et al. Reference Feekings, Bartolino, Madsen and Catchpole2012), but this has never been shown specifically for elasmobranchs. Our three variables, taxon, country, and gear type, together described 59% of the variation in the dataset. Other sources of variation in retention rates are likely driven by specific, localized factors, which have been examined for specific case studies but have not been evaluated globally. The results of this study identify similar retention and discard drivers for elasmobranchs as those identified for bony fishes (Murawski Reference Murawski1996; Rochet and Trenkel Reference Rochet and Trenkel2005; Catchpole et al. Reference Catchpole, Enever, Maxwell, Armstrong, Reese and Revill2011; Feekings et al. Reference Feekings, Bartolino, Madsen and Catchpole2012).
Taxon was identified as a key driver of elasmobranch retention. The first split in our regression tree was by taxa with a combined average retention rate of 85.4% for Alopias, Isurus, and smoothhounds (Fig. 3). Taxon likely serves as a proxy of economic value. We did not include an economic value variable in our analyses because such data are not available for many taxa and are highly variable among countries and over time (Catarci Reference Catarci2004). However, Alopias and Isurus are generally very marketable with highly valued meat, sometimes on par with swordfish, and high quality fins (Vannuccini Reference Vannuccini1999; Catarci Reference Catarci2004; Sebastian et al. Reference Sebastian, Haye and Shivji2008; Liu et al. Reference Liu, Chan, Lin, Hu and Chen2013). Smoothhounds also often have directed fisheries for whole bodies and fins (Chiaramonte Reference Chiaramonte1998; Smith and Benson Reference Smith and Benson2001; Domi et al. Reference Domi, Bouquegneau and Das2005; Dell’Apa et al. Reference Dell’Apa, Kimmel and Clo2012).
All other taxa in this dataset had an average of 23.7% retention. These less valuable species have limited markets and variable retention rates depending more on fishing country and gear type (Rose Reference Rose1996; Vannuccini Reference Vannuccini1999; Catarci Reference Catarci2004; Liu et al. Reference Liu, Chan, Lin, Hu and Chen2013). Prionace often comprise a large portion of elasmobranch bycatch and have medium to high quality fins but have lower quality meat. This genus, at least historically, was often subject to finning, whereby fins were removed at sea and retained, while the carcass was discarded overboard in most countries (Vannuccini Reference Vannuccini1999; Clarke et al. Reference Clarke, Harley, Hoyle and Rice2012). In our dataset, Prionace were generally reported as being discarded, which may be a result of more widespread implementation of finning regulations (EU [European Union] 2003; NMFS [US National Marine Fisheries Service] 2005; Australian Government 2011), a switch to higher-value species (Hareide et al. Reference Hariede, Carlson, Clarke, Clarke, Ellis, Fordham, Fowler, Pinho, Raymakers, Serena, Seret and Polti2007), or their dominance in high seas fisheries, which were not included in this dataset. Carcharhinus and Sphyrna also have variable-quality meat and fins (Vannuccini Reference Vannuccini1999; Sebastian et al. Reference Sebastian, Haye and Shivji2008; Liu et al. Reference Liu, Chan, Lin, Hu and Chen2013), which explains their variable retention rates. Skates are targeted in many countries (Machado et al. Reference Machado, Gordo and Figueiredo2004; Estalles et al. Reference Estalles, Coller, Perier and Di Giacomo2011; Silva et al. Reference Silva, Ellis and Catchpole2012), which supports retention of non-target catch, but consumer acceptance of their meat in other areas is low (Link Reference Link2007). For example, skate bycatch from Portugal was retained at high rates because there is a viable market for them (Coelho et al. Reference Coelho, Erzini, Bentes, Correia, Lino, Monteiro, Ribeiro and Goncalves2005; Baeta et al. Reference Baeta, Batista, Maia, Costa and Cabral2010), while the main reason for discarding skates and many other elasmobranchs in Greece was lack of commercial value (Damalas & Vassilopoulou Reference Damalas and Vassilopoulou2011). The presence of targeted fisheries for many of these taxa supports the observed retention from non-target catch; there is an economic benefit to land non-target catch.
Commonly discarded species were those taxa that largely do not currently have marketable fins or high quality meat. These taxa typically have the lowest market value and generally consist of catsharks, deep-sea squaloids, and rays (Kelleher Reference Kelleher2005). Markets exist for certain species within these taxonomic groups (White et al. Reference White and Dharmadi2007; Akhilesh et al. Reference Akhilesh, Ganga, Pillai, Vivekanandan, Bineesh, Shanis and Hashim2011), but as a whole, a majority of these species are discarded. Squalus had a low average retention rate in our analysis, but target fisheries exist for this group, particularly Squalus acanthias (Rago et al. Reference Rago, Sosebee, Brodziak, Murawski and Anderson1998), therefore it is likely that other reasons for discarding are in play besides economic value such as fishing regulations or fishers’ preferences (Catchpole et al. Reference Catchpole, Enever, Maxwell, Armstrong, Reese and Revill2011). Overall, average retention rate by taxon aligned with economic value in a qualitative way to describe the patterns we observed and therefore may be a useful proxy for economic value.
Country was another important variable in characterizing retention rates, further supporting the influence of differences in the economic or regulatory environments among EEZs. For example, in Australia, Isurus species have very low retention rates, in contrast to high rates in most other EEZs. In Australia, Isurus are listed under the Environmental Protection and Biodiversity Conservation Act (EPBC) and can only be retained if they are caught dead. Live-caught specimens must be released unharmed (Hobsbawn & Wilson Reference Hobsbawn and Wilson2009). Therefore, retention rates of Isurus in Australia were c. 15% versus 80–100% for other countries. Additionally, the Marshall Islands had the highest retention rates of all countries in the dataset (87.6%), but as of 2011 commercial fishing or any retention of sharks is illegal within its EEZ (MIRC [Marshall Island Revised Code] 2011). There is evidence that the shark fishing ban is being enforced as well: a Japanese fishing boat was fined US$ 125000 in 2012 for violating the ban and a Chinese fishing boat was fined US$120000 and its licence to fish in the Marshall Islands was revoked in 2013 (AFP [Agence France Presse] 2012; Radio New Zealand 2013). This change by the Marshall Islands is strong evidence that discards are driven in part by country-specific fishing regulations.
Gear type was less important than taxon or country but was still an important predictor of retention rates. Gear is inherently related to taxon as different gears operate in different parts of the water column and therefore interact with different elasmobranch species. Elasmobranchs captured on bottom longlines were rarely retained, as a majority of the species collected by this gear type consisted of catsharks and deep-sea squaloids, which are generally discarded. Retention rates for pelagic longlines, however, were very high when incidentally catching Isurus, Prionace in the Marshall Islands (which finned a majority of the shark catch; Bromhead et al. Reference Bromhead, Clarke, Hoyle, Muller, Sharples and Harley2012), Carcharhinus in the United States Atlantic and Marshall Islands, and Sphyrna in the United States Atlantic, but were generally low in other countries collecting other taxa (for example deep-sea squaloids, Squalus and rays). These complex interactions among variables emphasize the fact that decisions to retain or discard elasmobranch bycatch are not uniform across fisheries; gear, country and taxon play interrelated and important roles in the decision to retain or discard.
One element of elasmobranch discarding that is still poorly understood is variation in discard (namely post-release) survival rates. Although some discarded sharks, rays and skates are known to survive after being released from fishing capture (Hueter & Manire Reference Hueter and Manire1994; Laptikhovsky Reference Laptikhovsky2004; Rulifson Reference Rulifson2007; Campana et al. Reference Campana, Joyce and Manning2009; Enever et al. Reference Enever, Catchpole, Ellis and Grant2009; Braccini et al. Reference Braccini, Rijn and Frick2012), post-release survival rates vary with taxon, gear type used, and time exposed to stress (time on hook or in net and duration of onboard processing; Morgan & Carlson Reference Morgan and Carlson2010; Braccini et al. Reference Braccini, Rijn and Frick2012). Blue sharks had a 13.3% hooking mortality upon capture and a subsequent 100% post-release survival for healthy individuals and 67% post-release survival for injured individuals (Campana et al. Reference Campana, Joyce and Manning2009). Skates exhibit a range of post-release survival from 0 to 91% depending on species (Laptikhovsky Reference Laptikhovsky2004; Enever et al. Reference Enever, Catchpole, Ellis and Grant2009). Braccini et al. (Reference Braccini, Rijn and Frick2012) determined the post-capture survival of twenty-five species to range from 2.5% for the whiskery shark, Furgaleus macki, to 100% for the spotted wobbegong, Orectolobus maculatus, in a commercial Australian shark gillnet fishery. Better estimates of discard survival rates are needed to refine total catch mortality figures, and determine how improved post-release survival may mitigate bycatch impacts.
Although global elasmobranch landings data are readily available from FAO databases, our results support the conclusion by Worm et al. (Reference Worm, Davis, Kettemer, Ward-Paige, Chapman, Heithaus, Kessel and Gruber2013) and Clark et al. (Reference Clarke, McAllister, Milner-Gulland, Kirkwood, Michielsens, Agnew, Pikitch, Nakano and Shivji2006) that these data grossly underestimate total elasmobranch removals or total population-level impacts. Using the retention rates we identified, we can consider potential discrepancies between landings and total removals (Fig. 4). Based on this comparison, we conclude that estimated removals due to discarded elasmobranch catch are not trivial; possibly tens of thousands of metric tonnes of elasmobranchs die in addition to those included in the reported landings. Furthermore, the taxonomic groups that have the lowest retention rates and thus the highest increase from reported landings to estimated total removals are also the least researched, particularly deep-sea squaloids and skates. Existing research has demonstrated the importance of incorporating discards into catch estimates (Viana et al. Reference Viana, McNally, Graham, Reid and Jackson2013). We were unable to estimate total removals for several taxon- and country-specific groups because either zero metric tonnes were reported to the FAO database or the average retention rate was zero per cent. These gaps were likely caused by the mismatch of taxa where the species in each taxonomic group used to calculate the average retention rate did not always match species that were available in the FAO database. Improved species-specific data could alleviate this problem. Nevertheless, based on the variability observed in both global landings and retention rates, the quantification of retention and discards of elasmobranch catch on a species-, gear- and country-specific basis is long overdue.
The dataset we compiled describes bycatch drivers from recorded elasmobranch retentions and discards data within twelve EEZs and as such cannot represent all elasmobranch bycatch in all taxa, countries or gears. Twenty countries landed almost 80% of the total reported shark catch from 2000 to 2008 (Lack & Sant Reference Lack and Sant2011). Of these ‘Top 20’, fourteen are not represented in this dataset; this amounts to 55.9% of the total reported shark catch (Lack & Sant Reference Lack and Sant2011). The two largest elasmobranch fishing nations are Indonesia (13%) and India (9%) (Lack & Sant Reference Lack and Sant2011; Fischer et al. Reference Fischer, Erikstein, D’Offay, Barone and Guggisberg2012), which also are not represented in this dataset. A recent review of shark bycatch research identified several key needs in the field including covering a broader range of regions, gear types, and species, exploring how fishers handle bycatch, documenting post-release survival, and convincing humans to change their practices to support sustainability (Molina & Cooke Reference Molina and Cooke2012). The findings of our study echo these research needs. Considering the variability of retention rates in this study and the number of EEZs for which data are not available, it would be imprudent to use these results to predict broad elasmobranch retention patterns. Elasmobranch bycatch retention rates are a needed ingredient to understand and evaluate the potential impact of fisheries bycatch on these vulnerable populations.
ACKNOWLEDGEMENTS
We thank Dr David Ebert for expertise on taxonomic groupings and Dovi Kacev and Sara McDonald for constructive edits. Funding was provided by Lenfest Ocean Programme, grant reference number: 2008-00648-009.
Supplementary material
To view supplementary material for this article, please visit http://dx.doi.org/10.1017/S0376892915000168


