

Since the 1970s, archaeologists have known that thermal infrared images have the potential to reveal archaeological features ranging from buried architecture to concentrations of surface artifacts and cultural landscape elements such as roads, fields, or earthworks. Despite a long history of experimental research in archaeological aerial thermal imaging (e.g., Bellerby et al. Reference Bellerby, Noel and Branigan1990; Buck et al. Reference Buck, Sabol and Gillespie2003; Giardino and Haley Reference Giardino, Haley and Johnson2006; Haley et al. Reference Haley, Johnson and Stallings2002; Lundén Reference Lundén1985; Périsset and Tabbagh Reference Périsset and Tabbagh1981; Scollar et al. Reference Scollar, Tabbagh, Hessse and Herzog1990:593–611; Tabbagh Reference Tabbagh1977, Reference Tabbagh1979), applications of the technology are scarce due to the difficulty and expense of deploying advanced thermal sensors on aircraft (e.g., Challis et al. Reference Challis, Kincey and Howard2009; Hailey Reference Hailey2005; Kvamme Reference Kvamme2006a, Reference Kvamme2008; Scollar et al. Reference Scollar, Tabbagh, Hessse and Herzog1990:614–18; Sever and Wagner Reference Sever, Wagner and Trombold1991; Sheets and Sever Reference Sheets, Sever and Trombold1991).
Recent advances in the sophistication of thermal cameras, the reliability of commercial drones, and the growing power of photogrammetric software packages collectively have revolutionized archaeologists’ ability to collect, process, and analyze aerial thermal imagery (Casana et al. Reference Casana, Kantner, Wiewel and Cothren2014; Poirier et al. Reference Poirier, Hautefeuille and Calastrenc2013; Vasterling and Meyer Reference Vasterling and Meyer2013). Aerial thermography now enables us to prospect for ancient cultural features across large areas at low cost, offering potentially transformative perspectives on the archaeological landscape. With these opportunities, there are also new challenges, ranging from the most suitable equipment to use, when, where, and how to collect imagery, and best practices for processing and interpretation of results. This paper offers archaeologists interested in aerial thermography a straightforward guide to the basic principles, suitable technology options, and key survey strategies, highlighting results from several different archaeological sites.
BACKGROUND
The principles behind aerial thermographic imaging in archaeology are relatively simple: due to differences in composition, density, and moisture content, materials on and below the ground surface absorb, emit, transmit, and reflect thermal infrared radiation at different rates (Figure 1). A wide range of archaeological features should all theoretically be visible in a thermal image if (1) there is a sufficient contrast in the thermal properties of archaeological features and the soil matrix or ground cover; (2) the archaeological materials are close enough to the surface to be affected by heat flux; and (3) the image is acquired at a time when such differences are pronounced. Put simply, a buried stone wall may heat and cool at a different rate than surrounding soil, and at the right time of day or night, this difference is potentially visible in a thermal image of the surface.
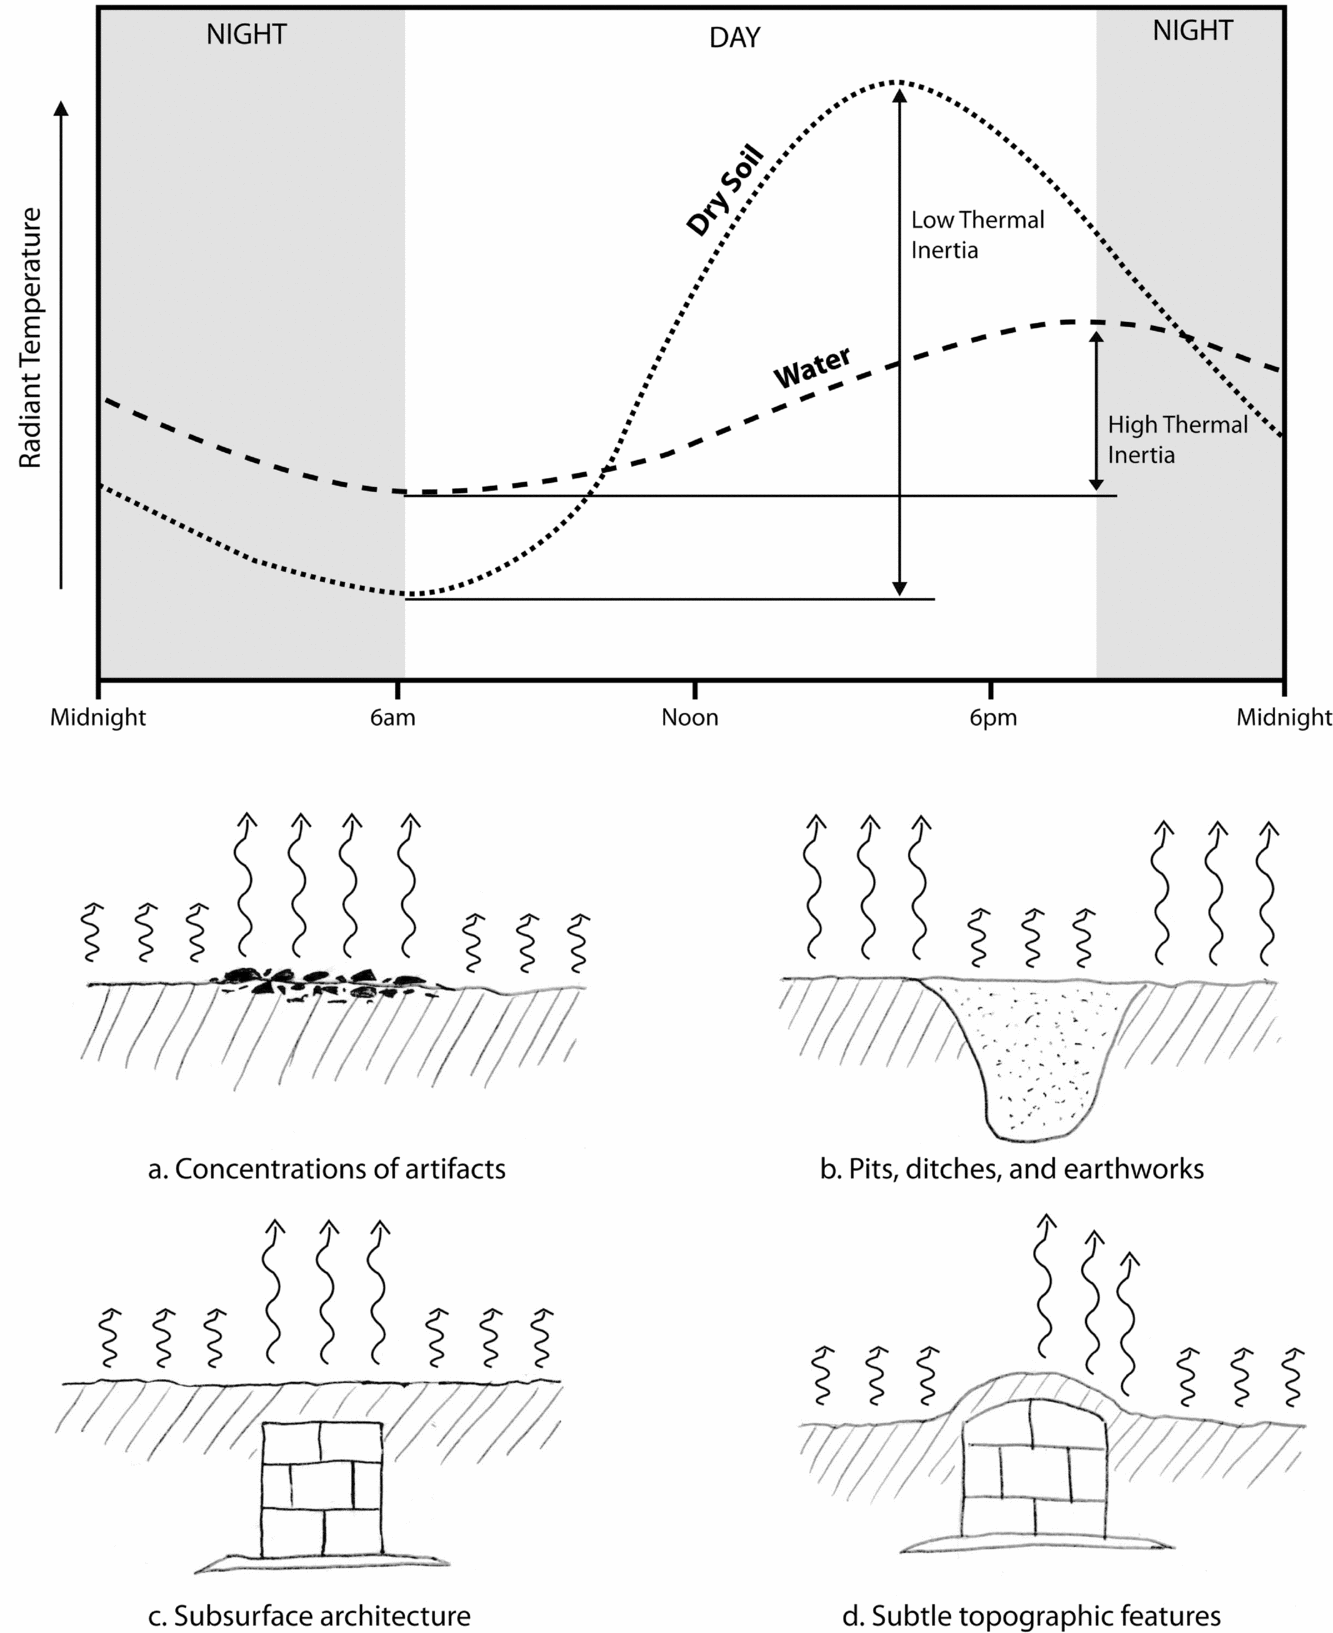
Hypothetical illustration of the relative thermal radiance of dry rocks and soil versus water or saturated soil over a diurnal cycle (after Kuenzer and Dech Reference Kuenzer, Dech, Kuenzer and Dech2013). Due to these differences, a wide range of archaeological features are potentially resolvable in thermal imagery, including (a) surface artifact concentrations; (b) pits, ditches, or earthworks; (c) subsurface architecture; and (d) features with topographic expression.
As with any geophysical prospection method, researchers should carefully consider the thermal properties of the features or objects they are trying to image versus the properties of the surrounding or overlying matrix, materials, or what Kvamme (Reference Kvamme and Johnson2006b) describes as the signal versus the noise. Instances in which there is a large difference in thermal properties between target features and the background will be much more likely to produce good results. Detailed discussions of thermal infrared remote sensing (Kuenzer and Dech Reference Kuenzer, Dech, Kuenzer and Dech2013) and its theoretical application to archaeology (Scollar et al. Reference Scollar, Tabbagh, Hessse and Herzog1990) are available, but below we review a few basic thermal properties that are most relevant to consider for archaeological applications:
Thermal conductivity describes the ability of a material to transfer heat (or thermal infrared energy) and is measured in watts per meter-kelvin (W/mK). Soils or sediments with relatively high thermal conductivity, such as wet sand (2.0–4.0 W/mK), will result in deeper transfer of thermal energy below the surface, while those with low conductivity such as dry clay-rich soil (0.15–0.18 W/mK) will inhibit the transfer of heat.
Volumetric heat capacity describes the amount of thermal energy that a given volume of material must absorb to increase its temperature by one degree, a property that is related to its density and composition. Differences in volumetric heat capacity explain, in part, why a stone will likely be hotter than a loose soil, even under identical temperature and light conditions.
Thermal inertia is a property that describes the rate of heat transfer of different materials; quantitatively, it is the square root of a material's thermal conductivity and its volumetric heat capacity. For the purposes of thermal surveys, thermal inertia is a key variable, as the differing rates of temperature change of materials, features, or soils across a period of heat flux will largely determine the optimal time to collect imagery, as well as whether particular features will be visible. For example, water has a relatively high thermal inertia, such that the temperature of wet soils will remain more constant as compared to dry soils (Figure 1).
Thermal emissivity describes how effectively a material emits or reflects thermal radiation. It is measured as a ratio between thermal radiation from the surface of an object and radiation from an ideal matte black surface (0 to 1 scale). If some surface objects, such as lithics or ceramics, for example, have emissivity values substantially different than the ground, they may be visible in thermal imagery. In addition, because metals with unoxidized or unpainted surfaces tend to have very low emissivity, they can make good ground control points, as they will typically appear nearly black in thermal images regardless of the ambient or ground temperature.
With a basic understanding of these key variables, we can make a few generalizations about the kinds of archaeological features that are potentially resolvable in thermal imagery. Surface artifact scatters may be detectable in a thermal image if they are sufficiently distinct in thermal properties from surrounding soils or ground cover (Figure 1a). Experimental data (Buck et al. Reference Buck, Sabol and Gillespie2003) show that even in imagery of relatively coarse spatial resolution, some common materials, such as obsidian, are detectable in thermal imagery at rather low densities. With the ability to collect thermal imagery in which the ground-sampling distance of the image approaches the dimensions of artifacts, it may be possible to distinguish differences in surface artifact density.
Topographic features of all varieties are likely to be apparent in thermal imagery, as they have different thermal properties than otherwise flat ground; a raised berm, for example, will heat and cool at a faster rate than the surrounding ground (Figure 1d). In addition, topographic features will heat differentially at dawn when the first light of the sun strikes them obliquely, and these differences are readily apparent in thermal imagery (Casana et al. Reference Casana, Kantner, Wiewel and Cothren2014; Scollar et al. Reference Scollar, Tabbagh, Hessse and Herzog1990).
Pits, ditches, field boundaries, roadways, and other similar features at or near the modern surface are likely to be apparent in thermal imagery even if they have no topographic expression, as they typically possess differences in soil composition and moisture retention, both of which affect their thermal properties (Figure 1b). For example, the earth lodges at the site of Double Ditch, North Dakota, likely create moisture traps that increase their visibility in Kvamme's (Reference Kvamme2008) survey of the site, and a similar process may account for the appearance of a possible Great Kiva, a round, semisubterranean ceremonial structure detected in our own work at Blue J (Casana et al. Reference Casana, Kantner, Wiewel and Cothren2014).
Finally, thermal imagery can detect subsurface architectural remains if they are constructed of materials with sufficiently different thermal properties compared to the soil matrix in which they are buried (Figure 1c). The depth at which subsurface archaeological features can be resolved varies considerably, depending on the thermal properties of the soil, the thickness and composition of ground cover, and the magnitude and rate of heat flux. Experimental data suggest that diurnal heat flux will impact at least the upper 50 cm of the soil profile (Périsset Reference Périsset1980), but differences in thermal conductivity of soils can vary by a factor of 20. At the same time, longer-term transient heat flux across a period of several days may reveal features at considerably greater depth, potentially down to several meters below the surface (Scollar et al. Reference Scollar, Tabbagh, Hessse and Herzog1990: 597–600).
TECHNOLOGY
Thermal Cameras
When the first archaeological aerial thermal surveys were conducted in the 1970s and 1980s, researchers required a large, liquid nitrogen-cooled scanning radiometer that recorded imagery on long rolls of film. Thermal camera technology has advanced considerably in recent years, with modern, uncooled camera systems measuring a few centimeters in size, with increased thermal sensitivity (< 0.05°K) and image resolution (640 × 512 pixels). Some manufacturers have begun producing thermal cameras specifically built for integration with drones, such as the FLIR Vue series and the DRS Tamarisk, enabling users to view aerial thermal images in real time, as well as facilitating GNSS geotagging of imagery as it is collected. Most thermal cameras employ some form of automatic gain control in which the camera's software will assess the minimum and maximum values in a given scene and then output a processed 8-bit video feed that stretches the values in the scene to fit a constant range of color values. Automatic gain control is helpful to quickly assess relative thermal values in a given image, but it reduces the dynamic range of values the camera is capable of discriminating to 256, likely obscuring subtle differences among features. A new generation of more sophisticated radiometric cameras like the FLIR Vue Pro R, as well as after-market components such as TeAx's ThermalCapture system, now enable users to capture raw, full-spectrum thermal imagery, enabling more advanced analyses. Finally, for aerial thermography, a shorter focal length lens (9mm or 13mm) is generally preferable, as it will increase the field of view, and therefore the footprint that can be covered at a given elevation, with the caveat that it will also increase image distortion, producing greater parallax at image edges.
Aerial Platforms
Recent years have seen remarkable advances in drone technology, quickly moving from a novelty to a standard part of the archaeological tool kit (e.g., Chiabrando et al. Reference Chiabrando, Nex, Piatti and Rinaudo2011; Hill Reference Hill2013; Hill et al. Reference Hill, Rowan and Kersel2014; Seitz and Altenbach Reference Seitz and Altenbach2011; Smith et al. Reference Smith, Passone, Al-Said, Al-Farhan and Levy2014; Sonnemann et al. Reference Sonnemann, Ulloa Hung and Hofman2016; Thomas Reference Thomas2016; Verhoeven and Docter Reference Verhoeven and Docter2013; Wernke et al. Reference Wernke, Adams and Hooten2014). Small, inexpensive copter-type drones, such as the Phantom 3 and 4 or its many competitors, are increasingly easy to fly, with auto takeoff and landing functions and seamless integration with tablet or smartphone navigation. However, with sleeker engineering and out-of-the-box flight capability, some platforms make it difficult to use camera systems other than those supplied by manufacturers. In planning thermal surveys, key factors to consider are whether a given aerial platform will enable full integration with a thermal camera, so that imagery can be viewed in real time and geotagged. Our most recent flights have been undertaken using the now discontinued 3DR Solo quadcopter that utilizes a custom gimble to enable the FLIR Vue camera line (including the Vue Pro R) to operate with the same ease as a standard color camera. It is a near certainty that drone technology will continue to see improvements in coming years, with longer flight times, more intuitive controls, and more seamless integration with GIS-based mapping applications. However, it is also worth noting that, despite the power and efficiency of copter-type drones for archaeological thermography, there are parts of the world where drones are illegal to deploy or difficult to acquire. In these instances, it is also possible to collect thermal imagery on more conventional balloon or kite rigs (Verhoeven Reference Verhoeven2009; Wells Reference Wells2011) or full-scale aircraft.
Software
Along with small, uncooled thermal cameras and reliable, commercial drones, aerial thermography would not be feasible on a large scale without modern photogrammetric software packages such as Agisoft's PhotoScan Pro and Pix4D mapper, which are increasingly transforming archaeological documentation more broadly (e.g., De Reu et al. Reference De Reu, Plets, Verhoeven, De Smedt, Bats, Cherretté, De Maeyer, Deconynck, Herremans, Laloo, Van Meirvenne and De Clercq2013; Koenig et al. Reference Koenig, Willis and Black2017; Porter et al. Reference Porter, Roussel and Soressi2016; Stek Reference Stek2016; Verhoeven, Doneus, et al. Reference Verhoeven, Doneus, Briese and Vermeulen2012; Verhoeven, Taelman, et al. Reference Verhoeven, Taelman and Vermeulen2012). These software packages enable much of the mapping process to be accomplished with relative ease thanks to automatic image orientation (or what is now commonly termed “image alignment”) and powerful terrain and orthoimage generation capabilities. If you are using a conventional thermal camera that outputs a video feed, it is possible to simply extract images at regular intervals through the video file using freeware such as ImageGrab and then import these images into Agisoft PhotoScan or other photogrammetric software (with the added step of manually inputting camera pixel size and focal length). However, thermal images tend to be very small (640 × 512 pixels at the most), so images over fairly homogeneous terrain, especially with 8-bit color resolution, may lack sufficient variability to enable automated alignment. Collecting imagery from a higher altitude, and thus with a larger footprint (albeit at a lower ground resolution) can help to create images with more features, but can also produce wildly differing contrast in adjacent images due to the automatic gain control function. We have sometimes been successful in applying image-processing techniques such as contrast-limited adaptive histogram equalization (CLAHE) to extracted thermal frames prior to processing, which makes individual frames more uniform and facilitates automatic alignment in some instances. Alternatively, radiometric thermal cameras that collect full-spectrum imagery have much more information in each image and don't compress values based on the overall scene, thus offering software more opportunities to find features to anchor alignment.
METHODS
Timing of Surveys
The timing of an aerial thermal survey is among the most important issues in determining its success, as imagery collected just an hour apart is often strikingly different in how well it reveals archaeological features (Casana et al. Reference Casana, Kantner, Wiewel and Cothren2014). Unfortunately, predicting the optimal time for data collection, either seasonally or in the course of a particular diurnal cycle, remains challenging owing to the myriad factors that can influence the thermal properties of specific features (Scollar et al. Reference Scollar, Tabbagh, Hessse and Herzog1990:593–609). In general, if our goal is to document buried architecture or surface features such as pits, ditches, or earthworks, based on diurnal heat flux, it is probably best to collect thermal imagery between sunset and sunrise. During daylight hours, a large fraction of thermal infrared radiation imaged by a camera is derived from reflected sunlight (Kuenzer and Dech Reference Kuenzer, Dech, Kuenzer and Dech2013), which may mask the more subtle differences in emitted radiation. Typically, soon after sunset when features on and below the ground are warmest, vegetation will create the most noise and differences among features will be less pronounced, but as the ground cools over the course of the night, differences in thermal inertia among features or soils will result in greater difference in their appearance in a thermal image (Figure 1). The optimal moment for the collection of imagery will vary depending on the properties of the features in question, the absolute difference in diurnal heat flux, the rate of temperature change on a given day, and other environmental variables such as clouds, rain, and wind speed (Haley et al. Reference Haley, Johnson and Stallings2002; Sever and Wagner Reference Sever, Wagner and Trombold1991). For this reason, we typically collect thermal imagery at several points during the course of a night. It is also possible to detect features on the basis of longer-term transient heat flux, when there is significant change in the daily mean temperature over a period of several days or weeks, and Scollar and coauthors (Reference Scollar, Tabbagh, Hessse and Herzog1990: 597–600) argue that this approach should theoretically produce better results. However, our dataset regarding transient versus diurnal heat flux in archaeological prospecting is so limited that it remains difficult to assess their relative importance.
Alternatively, if our goal is to document archaeological features with topographic expression, such as raised fields, walls, or earthen mounds, it is best to collect imagery around sunrise. Topographic features will heat differentially under raking sunlight, and thermal imagery collected at this time can therefore reveal such features with great clarity (Casana et al. Reference Casana, Kantner, Wiewel and Cothren2014). In addition, surface artifacts or other cultural features on the ground surface may have significant differences in thermal emissivity and should similarly be identifiable in daylight thermal imagery, but, again, there are few published examples (see Buck et al. Reference Buck, Sabol and Gillespie2003).
Thermal Survey Strategies
As with any aerial survey, when planning a thermal survey, researchers should carefully consider the desired results in terms of the spatial resolution of the final dataset and the overall size of the survey area (Figure 2). We use a spreadsheet with linked fields in order to calculate ground resolution, image footprint size, image resolution, flight time, speed, and other variables, which is helpful as most automatic flight planning software does not enable users to change camera parameters to account for the field of view and pixel size of thermal cameras. For example, flying at 30 m elevation with our 9mm fixed lens on the FLIR Vue Pro (640 × 512 pixels), we collect images that cover 29 × 36 m on the ground and that have 5.7 cm resolution at nadir, thus approximating high-resolution archaeo-geophysical data. To achieve different image resolution or footprint size, operators can simply fly at higher or lower elevation.
Diagram illustrating key variables in planning drone surveys.
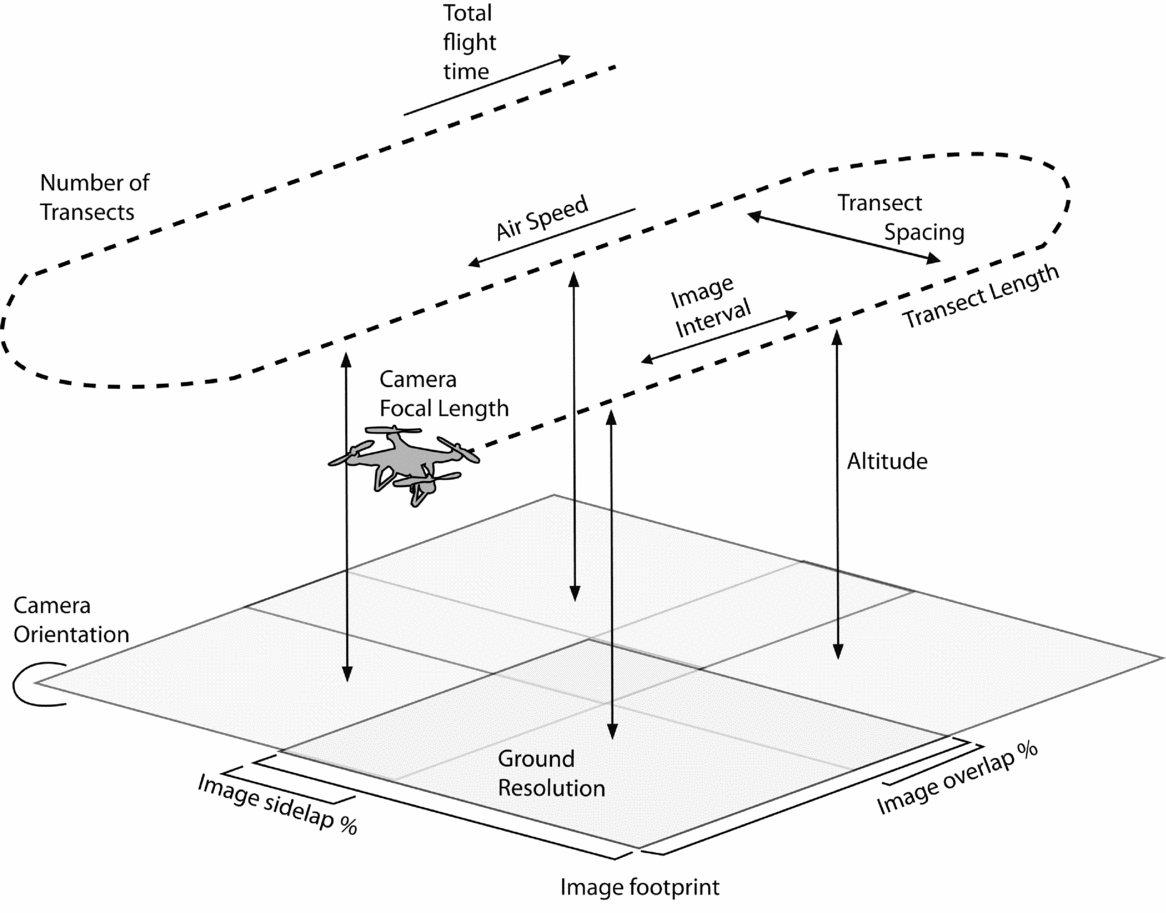
One of the main limiting factors in covering larger areas using thermal imaging is the relatively short flight time possible with most copter-type drones, often 15–20 minutes at the most. Moreover, because thermal camera sensors heat and cool progressively in response to received radiation, images can easily become blurred if the camera is moving too quickly during flight, so drone speed must be limited during thermal data collection, more than with collection of color imagery. Survey speed can be increased in relation to the camera's elevation above the ground. As a rule of thumb, we opt for speeds not exceeding 3–4 m/s at 30-m elevation, and 5–6 m/s at 60 m. Because thermal imagery collection is so time sensitive, it is essential to plan surveys efficiently if a large area is being surveyed to maximize coverage.
In order to facilitate automated alignment of thermal images in photogrammetric software, it is critical to have at least 70–80% overlap between adjacent images, generally meaning images should be collected or sampled at 1–2 seconds, depending on speed. The distance between individual survey transects is another key consideration. While it is possible to achieve good results in image processing with as little as 60% sidelap between adjacent transects, it is better to target sidelap coverage of 70–80% to ensure automatic alignment does not fail, particularly when surveying relatively homogeneous terrain.
While it is possible to collect usable thermal imagery by flying drones manually above archaeological sites, the need to collect imagery quickly, at night, and with greater precision than is necessary for typical visible light photography means that it is much better to use mission-planning software to program autonomous flights. This approach will also ensure that the same area can be imaged at repeated intervals with the same coverage and resolution. There are numerous manufacturer and third-party mission planning apps, but our most recent surveys have been conducted using Pix4D Capture, a fairly flexible and reliable software app that can integrate with a variety of commercial drones.
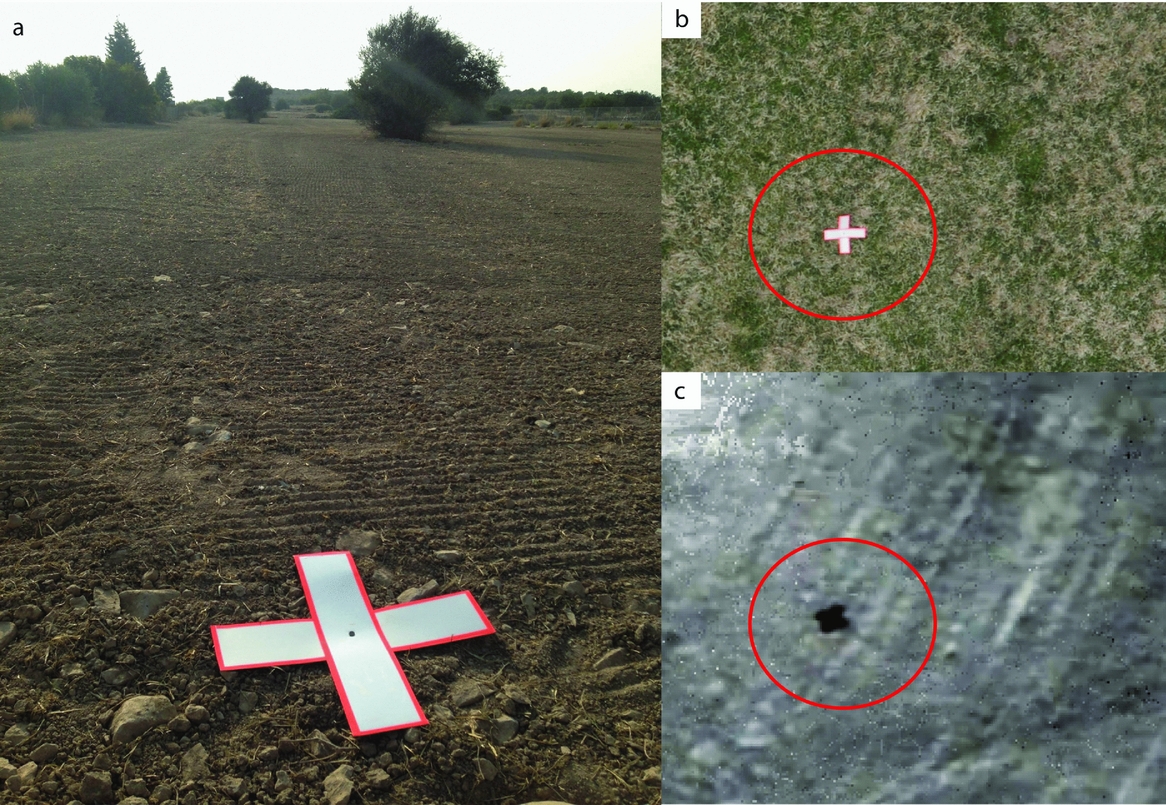
To aid in accurate georeferencing of imagery, it is generally necessary to place a series of ground control points throughout a survey area and to collect accurate XYZ coordinates for these points. We use ground control points made of sheet aluminum flashing, as it is inexpensive and durable in field conditions (Figure 3a). Because of its very low thermal emissivity (0.02 W/mK), nonanodized, unpainted aluminum sheeting appears as nearly black in thermal imagery, and thus can be readily recognized in images (Figure 3b–c). For processing in Agisoft PhotoScan, we place 8–12 such markers throughout the survey area, and collect XYZ coordinates using a total station or DGPS.
(a) A ground control point (GCP) made of aluminum flashing; GCP as it appears in (b) color imagery versus (c) thermal imagery.
CASE STUDIES
Optimal Conditions: Blue J, New Mexico
Our previously published research at Blue J, New Mexico (Casana et al. Reference Casana, Kantner, Wiewel and Cothren2014), offers an example of a case in which thermal survey produced very good results. Blue J is an extensive, Ancestral Puebloan settlement in northwestern New Mexico, comprised of around 60 residential compounds across a 2 km2 area (Kantner Reference Kantner and Mathien2010, Reference Kantner2013). Architecture at the site is primarily characterized by rough, sandstone masonry built as groups of room blocks, typically surrounding a central plaza or courtyard. Today, the remains of these building compounds are shallowly buried by loose, sandy soil, surrounded by artifacts and building stones strewn among relatively sparse scrubland vegetation characteristic of the region. While an arid climate prevails (220 mm precipitation/year), most rainfall occurs during the summer months, and at the time of our survey in late June, the site had received some early summer precipitation. In addition, the area sees very high diurnal heat flux as is common in deserts, with a high temperature on the afternoon before our survey of 32°C (90°F) and a low of 8°C (46°F) in the early morning hours of our flights.
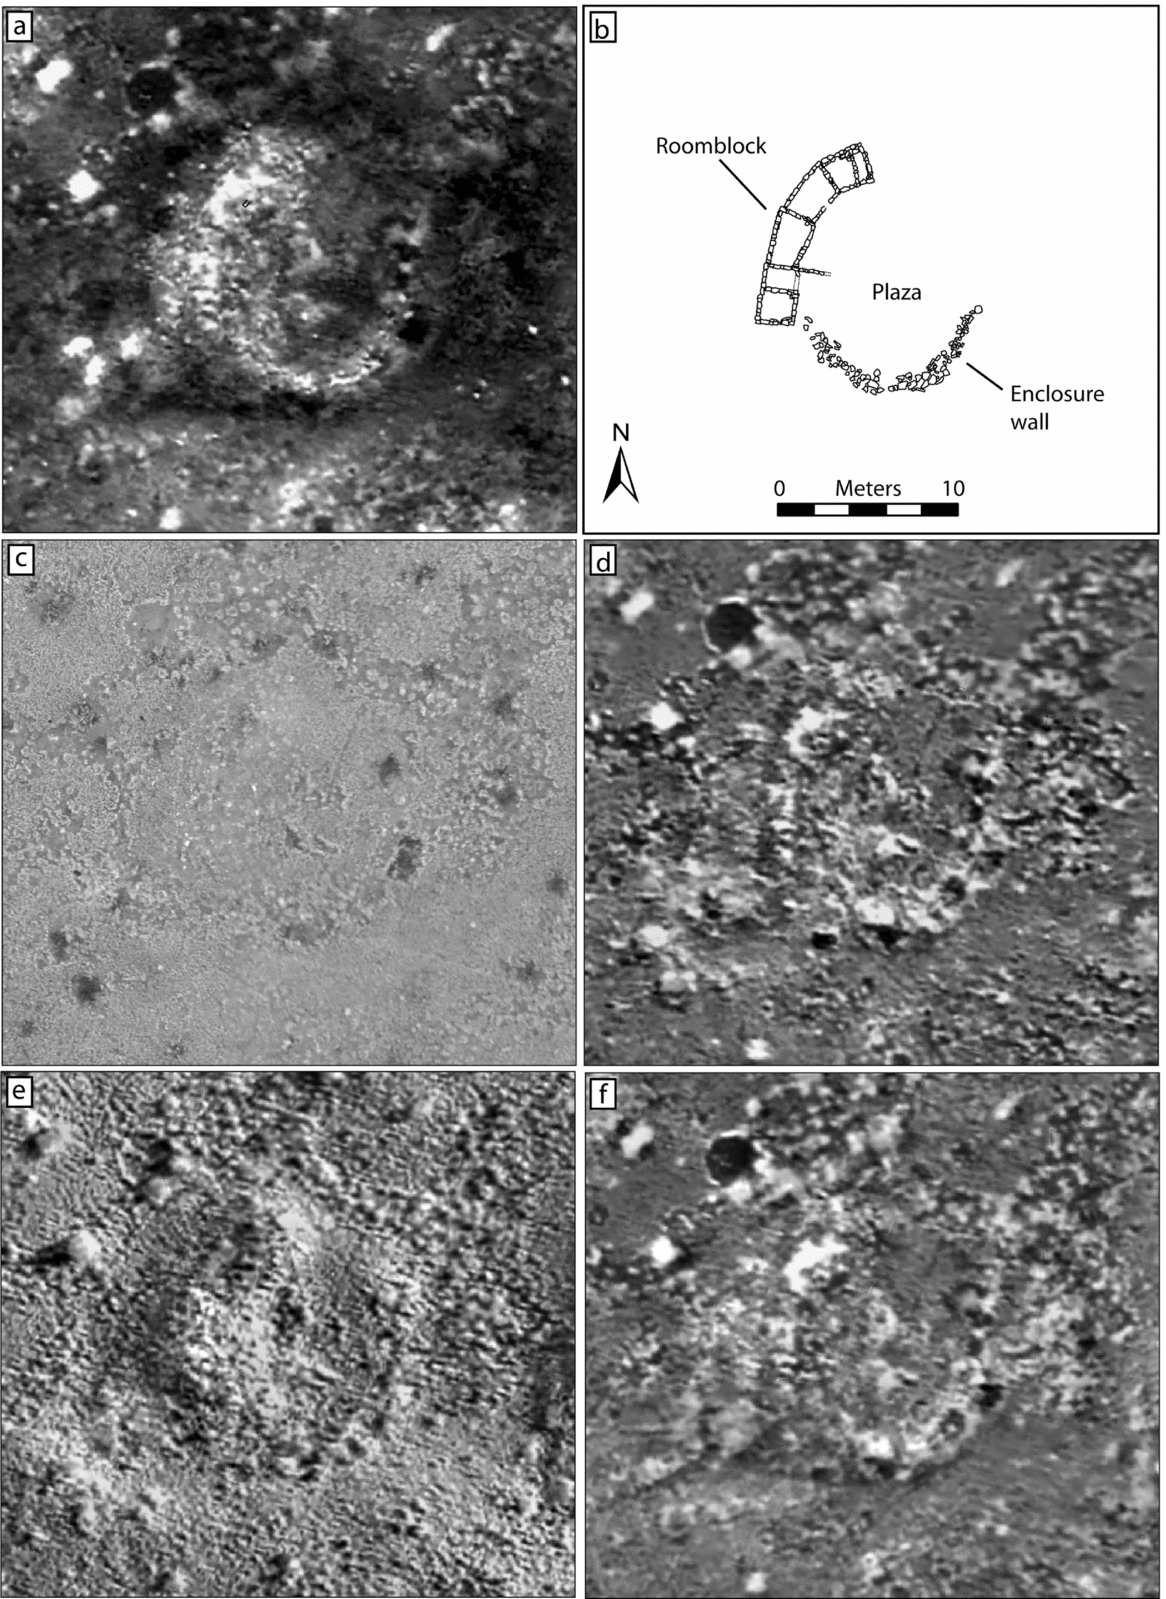
Collectively, the nature of the archaeological features and soil matrix, the low-density ground cover, and the environmental conditions at the time of our investigation made for ideal circumstances in which to undertake an aerial thermal survey (Figure 4). Results showed a dozen of the house compounds within the area of the survey that had been previously mapped through meticulous surface investigations, and, in the best instances, we could even produce fairly detailed architectural plans of individual house compounds (Figure 4a). Several previously unknown features were also recognized, including a possible Great Kiva, a feature expected at the site but not previously identified. Our results also highlighted the highly variable way in which archaeological features appeared through the night and into the early morning (Figure 4d, f), as well as the potential of thermal images collected in raking sunlight to reveal topographic features (Figure 4e). Other sites we have investigated did not produce equally impressive results, and below we discuss some of the reasons why, highlighting key challenges in undertaking thermal surveys, including dense surface vegetation and extremely dry soils, as well as approaches we have used to overcome these obstacles.
A Chaco-era room block (LA 170609) at Blue J, NM as it appears in (a) 5:18 a.m. thermal image; (b) architectural plan produced by test excavations; (c) a color image, and thermal images from (d) 6:18 a.m.; (e) 7:18 a.m.; and (f) 9:58 p.m. (after Casana et al. Reference Casana, Kantner, Wiewel and Cothren2014).
Dense Vegetation: Cahokia, Illinois
As one of our first thermal experiments, we undertook a survey at Cahokia in southern Illinois, in an area known as Ramey Field just east of Monk's Mound, the largest earthen structure at the site (Figure 5a; Dalan et al. Reference Dalan, Holley, Woods, Watters and Koepke2003). Ramey Field was once a ceremonial plaza and is home to a moderately sized platform mound (Mound 36) and a smaller nearby conical mound (Mound 37), as well as the remains of a stockade that once enclosed the central part of the site. The field was targeted for archaeological investigations dating back to the 1950s, and in the early 2000s was subjected to a geophysical survey (Hargrave Reference Hargrave2011). Results from electrical resistivity in particular revealed the rectilinear construction of Mound 36, as well as a large, previously unidentified rectangular structure at the northern end of the field, a feature subsequently subjected to excavation (Figure 5b).
(a) Map of Ramey Field, Cahokia, Ilinois; (b) Electrical resistivity survey (after Hargrave Reference Hargrave2011); (c) thermal imagery. While rectilinear structures evident in resistivity below Mound 36 do not appear in thermal data, historic field boundaries and old excavations are evident.
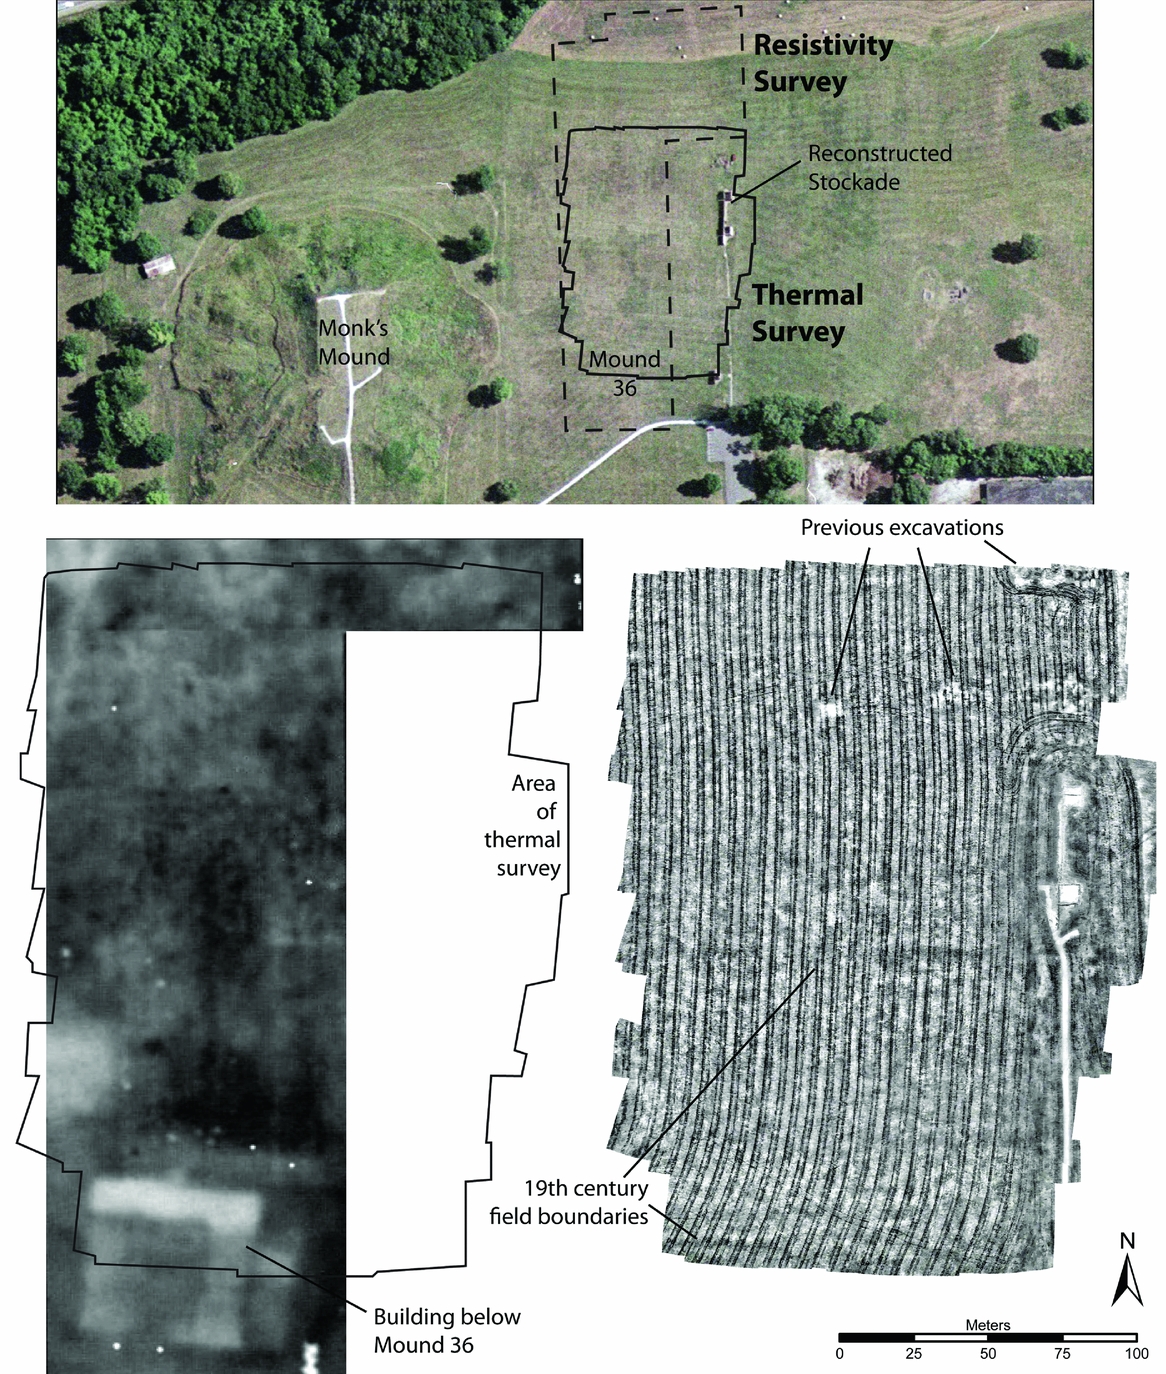
In a survey conducted in April 2013, the best results of several nighttime surveys come from 12 a.m., but even in this case the entire eastern and northern portions of the survey area failed to align in Agisoft PhotoScan due to the dense grass creating a virtually homogeneous set of images. The western portion that was mowed did align, but did not reveal the architectural features visible in resistivity, though several linear features are visible running through the field in an east-west orientation (Figure 5c). Comparison with historic maps and aerial photographs (Fowler Reference Fowler1997:99) suggests that these features are remains of nineteenth- and early twentieth-century field boundaries. Field systems often result in accumulations of stones and refuse that affect the growth of plants, resulting in surface visibility, as is seemingly the case here. The field systems visible in the thermal imagery do not appear in either magnetometry or resistivity data, pointing to the complementary role that thermography can play in geophysical surveys. At the same time, the failure of imagery from the area covered by tall grasses to even align in Agisoft PhotoScan, much less reveal archaeological features, is a reminder of the limitations of the technology in densely vegetated areas.
Aridity: Kalavasos, Cyprus
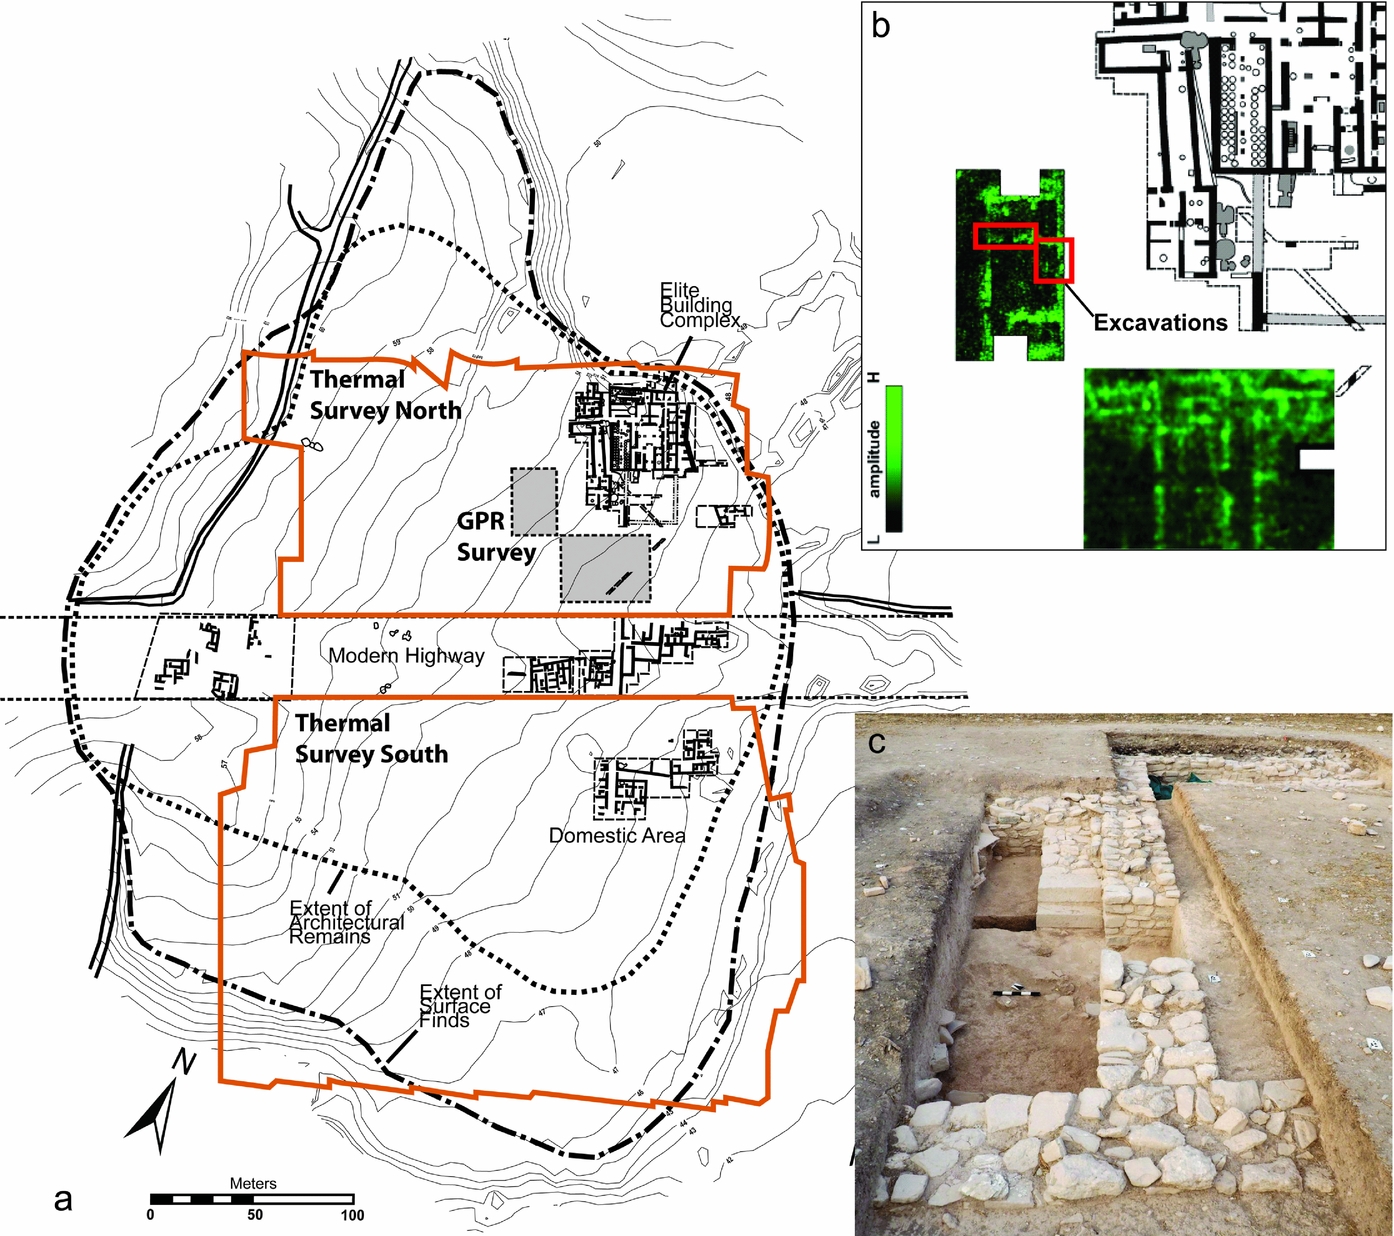
A survey at Kalavasos Ayios Dhimitrios, a significant Late Bronze Age/Late Cypriot II (c.1450–1200 BC) urban center in south-central Cyprus, usefully illustrates another key limitation of thermal imaging related to aridity. The site measures approximately 11 ha and excavations from 1979–1998 uncovered areas of stone-built domestic structures and a monumental complex that likely served as the city's administrative center (Figure 6a; Fisher Reference Fisher, Creekmore III and Fisher2014; South Reference South1997). A large-scale geophysical survey at the site undertaken from 2010–2013 revealed extensive remains of additional architecture built on the same alignment, including monumental buildings, with ground-penetrating radar producing the best results (Rogers et al. Reference Rogers, Leon, Fisher, Manning and Sewell2012; Urban et al. Reference Urban, Leon, Manning and Fisher2014). Subsequent excavations show that features visible in GPR are stone buildings with meter-wide rubble and ashlar masonry walls buried just below the modern plough zone (Figure 6b–c; Fisher Reference Fisher, Creekmore III and Fisher2014).
(a) Map of Kalavasos Ayios Dhimitrios, Cyprus, showing excavation and survey areas; (b) ground-penetrating radar survey (after Urban et al. Reference Urban, Leon, Manning and Fisher2014) showing new excavation area in red; and (c) recent excavation of shallowly buried monumental architecture visible in GPR plot.
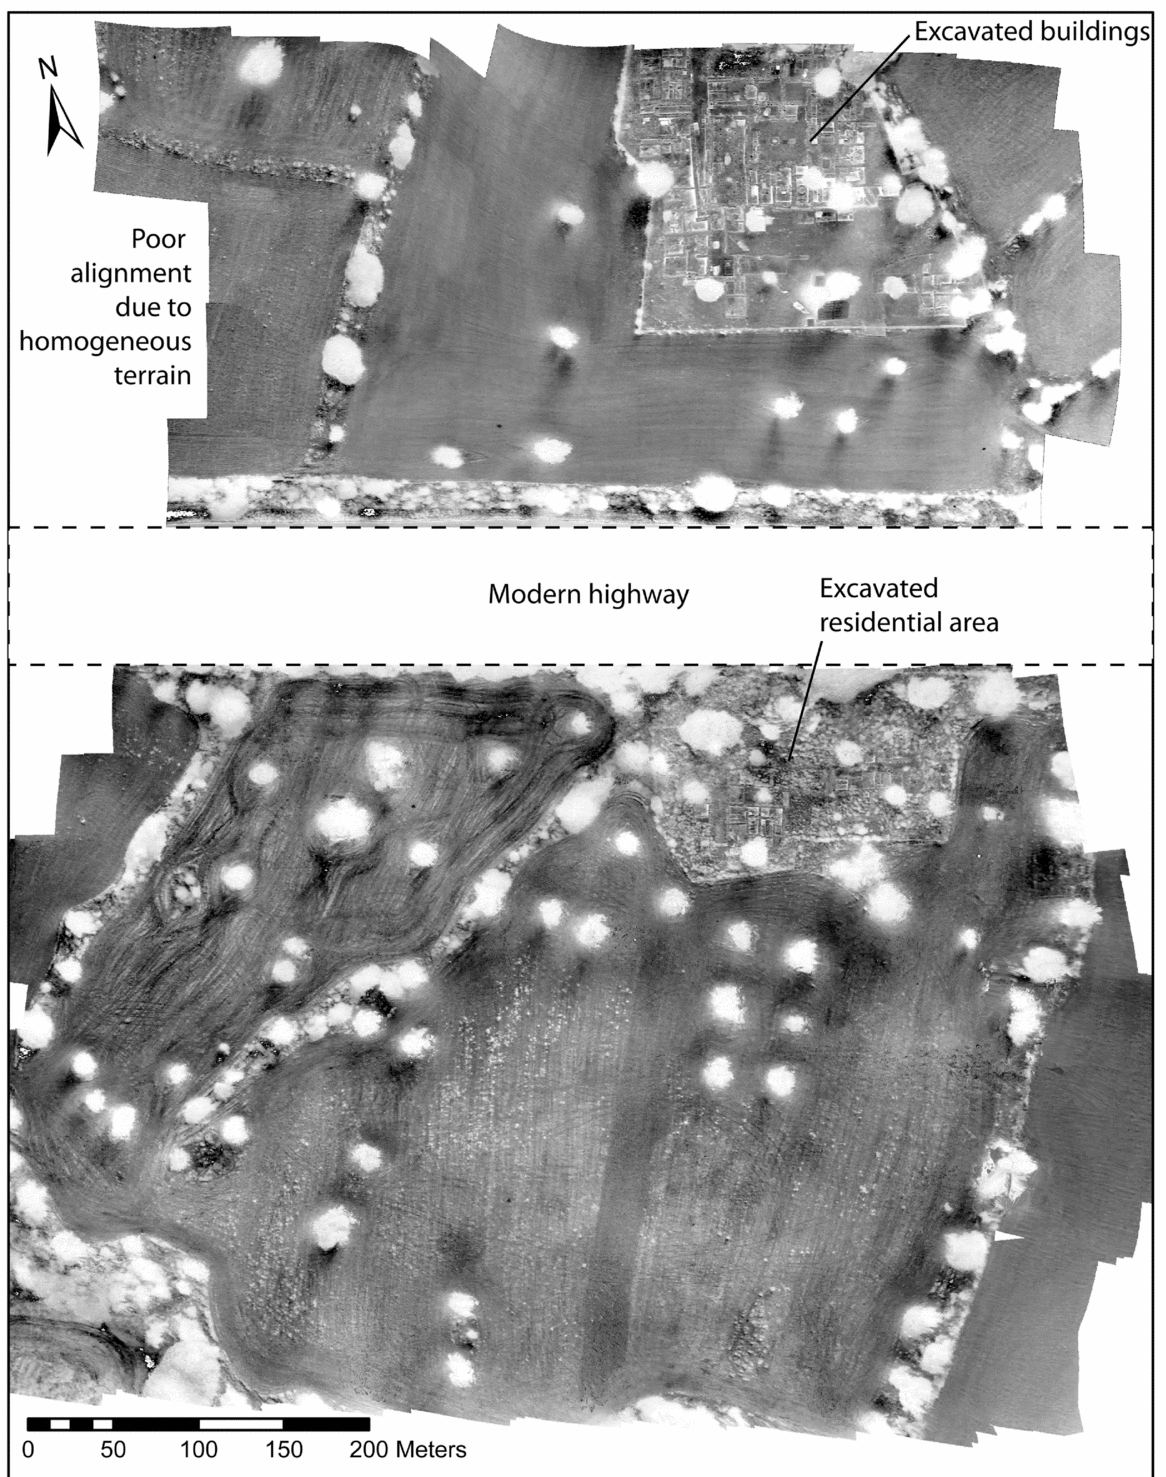
To test the possibility of aerial thermography at Kalavasos, we undertook a survey in late November, targeting a time when agricultural fields that cover the site were ploughed flat and prepared for sowing. In the Mediterranean climate of Cyprus, with cool, wet winters and hot, dry summers, the ground is typically at its driest point of the year in the late fall, and at the time of our survey had had no precipitation since the previous spring. These arid conditions proved to be unfavorable for archaeological thermography, as the dry soil had effectively the same thermal properties as the dry stone architecture. We undertook four thermal surveys at night across two days, but the data reveal little of archaeological interest (Figure 7). The excavated architecture, as raised topographic features built of stone or open pits that mark tomb entrances, appears quite distinctly in the imagery, and modern trees, plough marks, and pathways are also visible. However, none of the shallow subsurface architecture appears; nor do the excavation trenches dug and backfilled the previous summer. These results, while certainly disappointing to us at the time, serve to illustrate the critical importance of soil moisture as a variable in successful archaeological aerial thermography. It is likely that under wetter conditions, the results from Kalavasos would be much better, and, likewise, at sites with similarly arid conditions but different soils or architecture, we could potentially also see more. In general, however, aridity appears to be one of the more challenging obstacles to successful archaeological thermography.
Thermal imagery at Kalavasos Ayios Dhimitrios, Cyprus, collected at 11:15 p.m. (northern section) and 5:05 a.m. (southern section) reveal few unexcavated archaeological features, likely due to arid seasonal conditions and clay-rich soils.
Aridity: Khani Masi, Kurdistan Region of Iraq
In a counterexample to the difficulty of thermal survey at Kalavasos, a survey under similarly arid conditions at the site of Khani Masi in the Kurdistan Region of northern Iraq yielded better results. Located in the upper Diyala/Sirwan River Valley, Khani Masi is an extensive low-mounded site covering at least 50 ha, with its largest phase of occupation during the Kassite period (c.1450–1150 BC), when it was one of the most significant urban centers in the region. Khani Masi was first discovered by regional survey in 2013 (Casana and Glatz Reference Casana and Glatz2017), and the central portion of the site was subsequently targeted for magnetic gradiometry and test excavations (Glatz and Casana Reference Glatz and Casana2016). Results revealed the presence of major monumental buildings covering an area of around 8 ha (Figure 8a), built of both baked and sundried mudbrick, found just below the modern plough zone at 30–40 cm below the modern surface.
(a) Magnetic gradiometry from Khani Masi, Kurdistan Region of Iraq (after Glatz and Casana Reference Glatz and Casana2016); (b) thermal survey of the same area revealing numerous archaeological features.
At the time of our survey in September 2015, the region had seen effectively no rain since the previous spring, and experienced daily high temperatures of in excess of 45°C (115°F), leading us to doubt the likelihood that thermal survey would be effective. Moreover, logistical and security issues prevented us from surveying at night, or in the early morning. However, we undertook one experimental flight just after sunset over the southern portion of the site, where some of the largest buildings were evident in magnetic data (Figure 8b). Even under these less than optimal conditions, results nonetheless reveal some of the same buildings evident in magnetometry, appearing as high value (i.e., warm) features. A large courtyard area measuring approximately 25×20 m, inside one building, also appears as a low value (i.e., cool) feature, presumably because its looser fill traps water. At least one high-value rectangular feature is evident in the upper right of the thermal data but does not have a corresponding signature in magnetics, perhaps because it is not constructed of baked brick or was not burned as some of the buildings appear to have been (Glatz and Casana Reference Glatz and Casana2016). A low-value oval feature is likely a looting hole or military trench, and thus thermal data also provide important information for planning ongoing excavations at the site, as this area would likely want to be avoided. In sum, the thermal data from Khani Masi reveal a range of features that are complementary to magnetics, even though data were collected at suboptimal times, both seasonally and in the diurnal cycle.
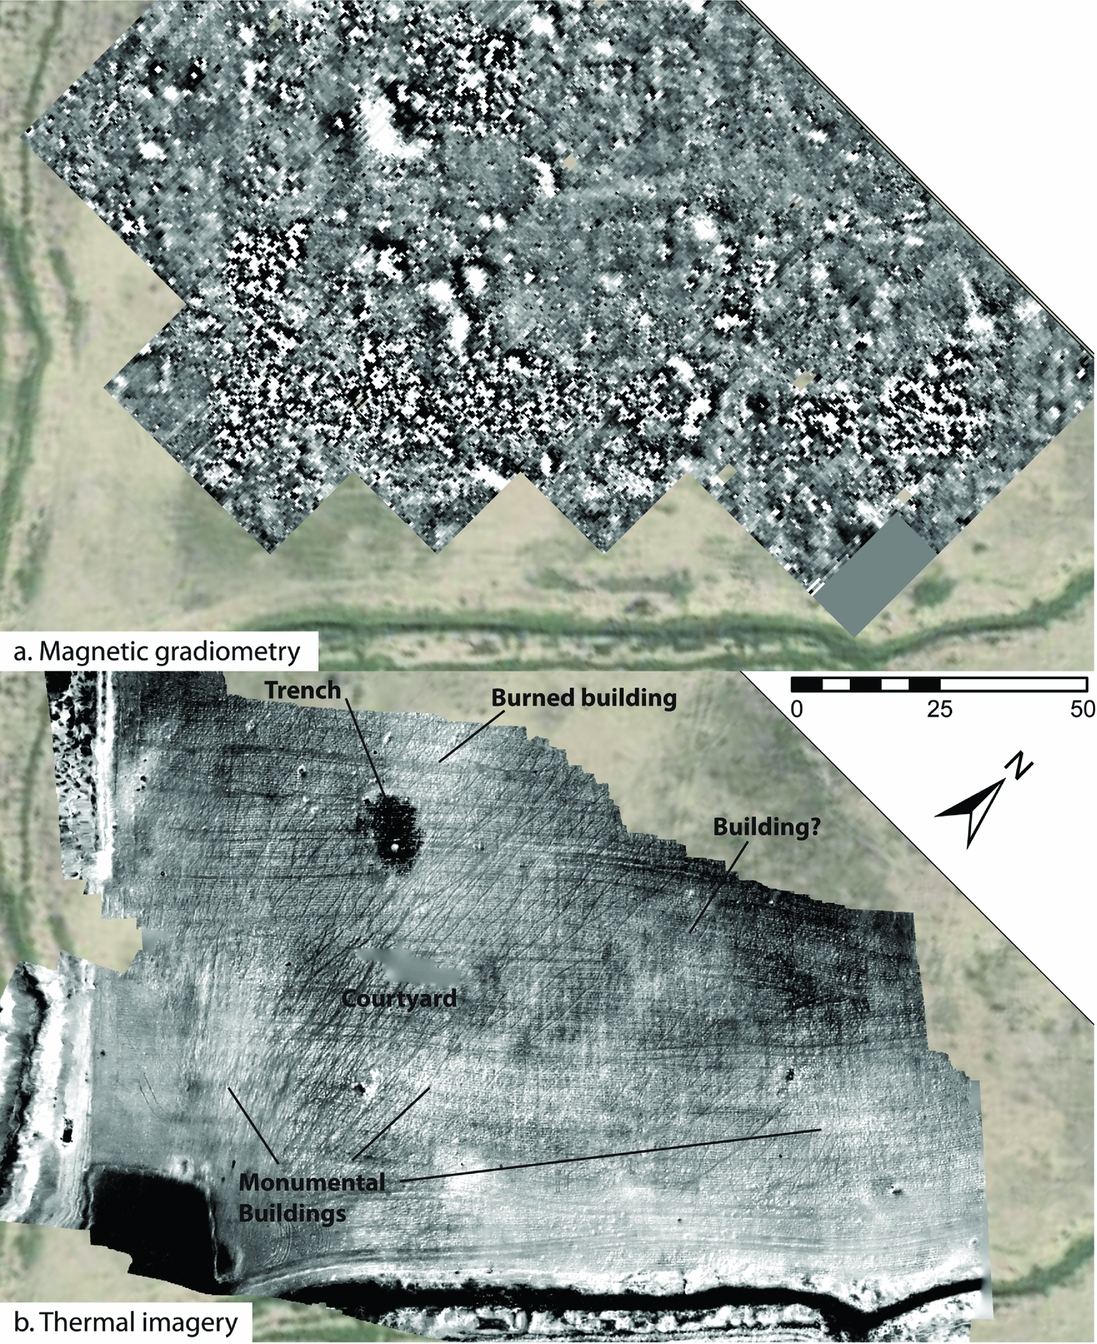
Filtering out Vegetation: Collins Mound Site, Arkansas
In order to explore new methods to reduce noise caused by vegetation seen at all sites discussed above, we conducted an experiment at the Mississippian-period mound center known as the Collins Mound site in northwest Arkansas (Figure 9). Salvage excavations during the late 1970s show that the site—composed of six burial mounds situated around the edges of a central plaza— was constructed during the late first millennium AD and contained abundant burned materials, likely related to their use as charnel houses (Vogel Reference Vogel2005). A magnetic gradiometry survey of 3 ha on the northern portion of the site reveals remarkable detail regarding its architectural layout, showing two major ceremonial structures on the mounds, along with numerous smaller buildings, possibly houses, around the mounds (Figure 9a; Sullivan and McKinnon Reference Sullivan and McKinnon2013). The repeated burning and burial of the charnel houses likely contributes to the strong magnetic signature of the architecture on this part of site.
Collins Mound site, Arkansas: (a) magnetic gradiometry (after Sullivan and McKinnon Reference Sullivan and McKinnon2013); (b) predawn thermal imagery; (c) normalized differential vegetation index (NDVI) image (green=high/red=low values); and (d) imagery in which NDVI values are used as a filter, subtracted from thermal values in order to reduce vegetation noise.
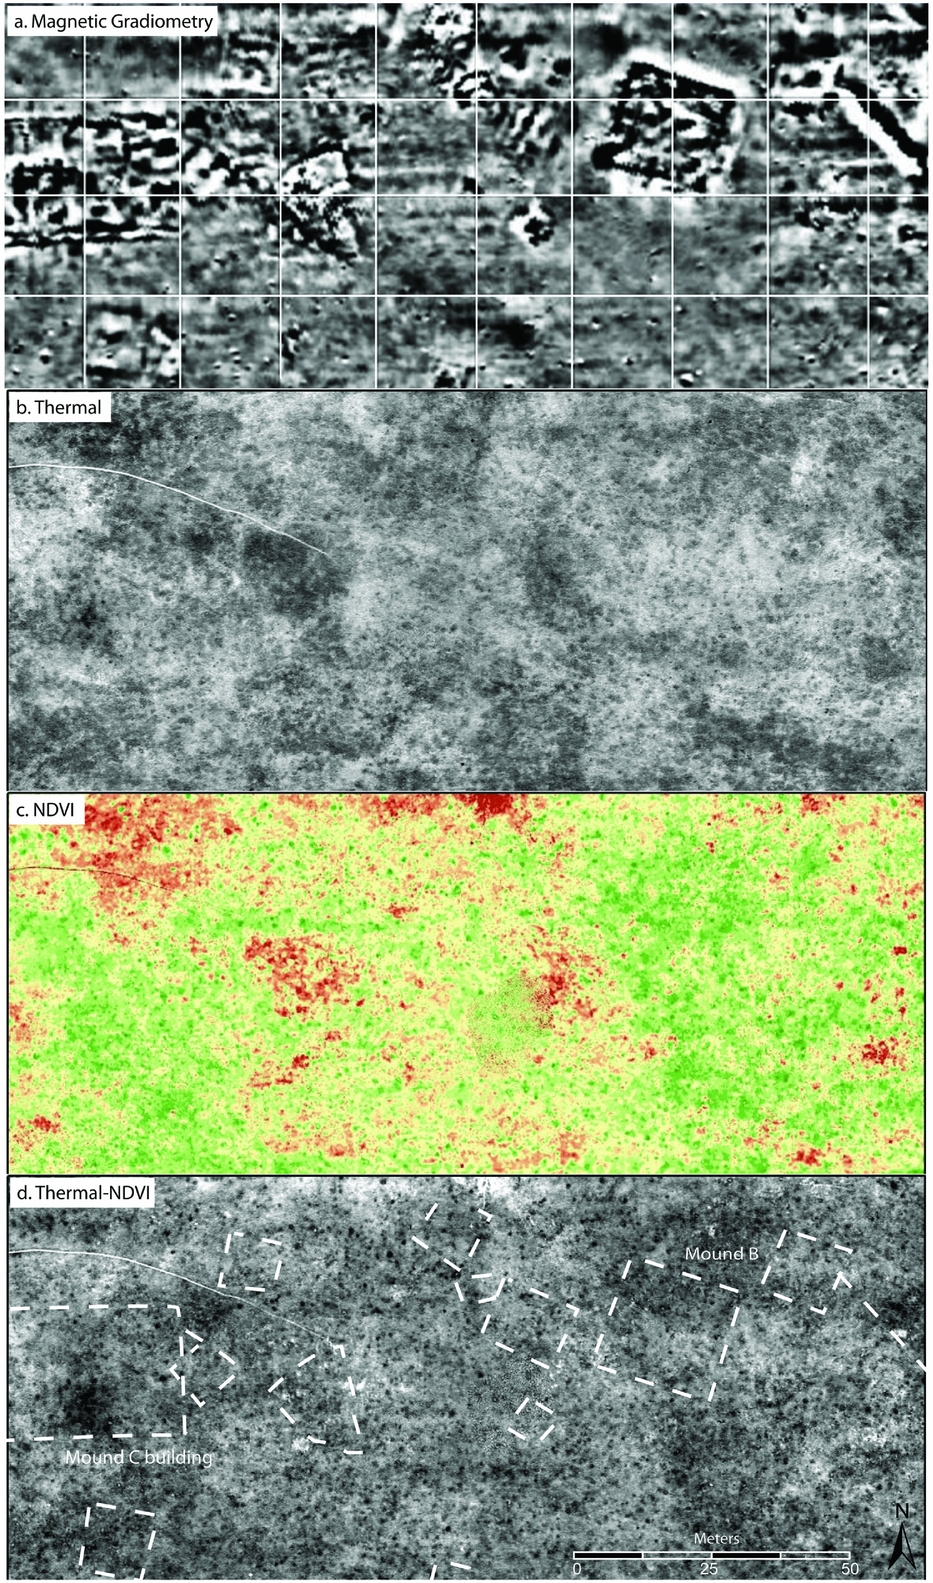
Aerial thermal imagery of the site was collected at several times at night in March 2014, but even the best results from 6:45 a.m., just before dawn, do not immediately reveal many features of archaeological interest (Figure 9b; Cool Reference Cool2015). The relatively dense vegetation over much of the site, with thick grasses growing in this well-watered pasture land, may render subtle archaeological features difficult to see. In an effort to filter out vegetation, we first collected visible light and near-infrared (NIR) imagery of the site using a Canon DSLR camera that had the internal IR hot mirror (IR filter) removed, and a red filter added in order to reassign the red channel to record NIR. Then, using color values derived from the green and NIR channels, we produced a normalized differential vegetation index (NDVI) image, a standard remote-sensing method for representing vegetation health and one that can be used to reveal archaeological features (Figure 9c; Bennett et al. Reference Bennett, Welham, Hill and Ford2012). In essence, the NDVI quantifies the health of the vegetation on the ground, and thus may indicate areas prone to thermal noise created by green grass. Through an affine transformation, we convert the NDVI values (−1 to 1) to 256 values, and using simple raster math, the NDVI values are then subtracted from the thermal image of the same area (Figure 9d). In theory, such an approach may remove the portion of each pixel's thermal value that is being created by vegetation, leaving only the portion of its thermal signature that is created by underlying materials.
Results of the filtering process highlight a roughly square, low-value anomaly inside the Mound B building, one of the large structures interpreted as a charnel house (Figure 9d). Such buildings in the Caddo cultural area of the Ozark Plateau typically contain a central open chamber in which bodies and grave goods were deposited (Kay and Sabo Reference Kay and Sabo2006), and it is likely that this chamber would collect water. The wetter soils may, therefore, produce a distinct thermal signature due to water's high thermal inertia. In addition, in the processed data, the rectilinear outline of the structure below Mound B is faintly traceable on the processed imagery.
An NDVI-based filter remains imperfect, however, because while NDVI is a proxy for chlorophyll content, the thermal properties of vegetation are primarily determined by transpiration, and correlation between transpiration and chlorophyll varies among species as well as within species at different points in the phenological cycle. A more sophisticated noise-reduction formula could tailor the NDVI transformation to the local ground cover type and season before combining it with the thermal data. Nonetheless, results from the Collins Mound site show that aerial thermal imaging can provide a complementary perspective, revealing archaeological features that may not be visible in more conventional geophysical datasets.
Radiometric Thermal Imagery: Enfield Shaker Village, New Hampshire
In all of the above studies, one of the key issues we dealt with related to the limitations of the camera systems themselves. Relatively low-cost thermal cameras like the FLIR Vue that output 8-bit images likely mask many of the subtle thermal signatures of archaeological features, and, similarly, the automatic gain control feature most of these cameras employ greatly limits the possibilities for any quantitative processing like that which we attempted at the Collins Mound site. In our most recent work, we have begun to experiment with a more sophisticated radiometric camera (the FLIR Vue Pro R) that records the full spectrum of raw thermal data, producing a 14-bit image (16,384 values). In principle, the raw values collected by a radiometric camera should more accurately reflect the actual thermal radiance of features on the ground, and thus enable additional processing and analysis. While a full exploration of these possibilities is beyond the scope of this paper, we undertook an experiment using a radiometric thermal camera at the historic Shaker Village in Enfield, New Hampshire. Founded in 1793, Enfield was once one of the largest Shaker settlements in New England, and today is home to a museum and visitor center based in several of the surviving buildings (Whitney Reference Whitney2008). However, a large number of buildings have been razed and are now empty fields, with historic maps and photographs illustrating their approximate location. We undertook a series of thermal surveys in conjunction with a magnetic gradiometry survey of the site in November 2016, when there was relatively high diurnal heat flux and relatively low vegetation cover.
Just west of the signature “Great Stone Dwelling,” a historic 1917 map shows three large buildings, including the former administrative headquarters of the community, a portion of which was excavated in 2015, a house, and a barn (Figure 10a). A thermal orthophoto, from images collected at 10:30 p.m. from 30 m elevation using the FLIR Vue Pro R, processed to be an 8-bit grayscale image representing the entire range of temperature values recorded in the area, reveals the foundations of the headquarters and barn with clarity, as well as a historic water pipe and other features (Figure 10c). Remnants of the house once located between the two buildings are less apparent, although the possible removal of building materials may reduce its signature. The archaeological features as well as the locations of previous excavations generally appear more clearly in thermal imagery than in magnetic data (Figure 10b), as the strong dipolar anomalies related to metal debris overwhelm the more subtle magnetic signature of the foundation stones and also create substantial noise throughout the area. In the case of the barn, magnetic data reveal a larger structure similar to that appearing on the 1917 map, while thermal data show a smaller foundation, perhaps the remains of an older building. Certainly, the combined datasets offer a complementary perspective, revealing both the location of building stones and foundation trenches, as well as concentrations of metal debris and burned materials likely inside the former structures. While both magnetic and thermal data reveal archaeological features of interest, it is also important to note that the magnetic data required a team of three people and a full day of effort to collect, whereas thermal survey was completed in under 10 minutes.
(a) Color orthoimage of a survey area at the Enfield Shaker Village, New Hampshire, showing location of historic buildings indicated on a 1917 map; (b) magnetic gradiometry survey data; (c) raw thermal imagery collected with a radiometric thermal camera; and (d) thermal imagery processed to show only values present in the lawn.
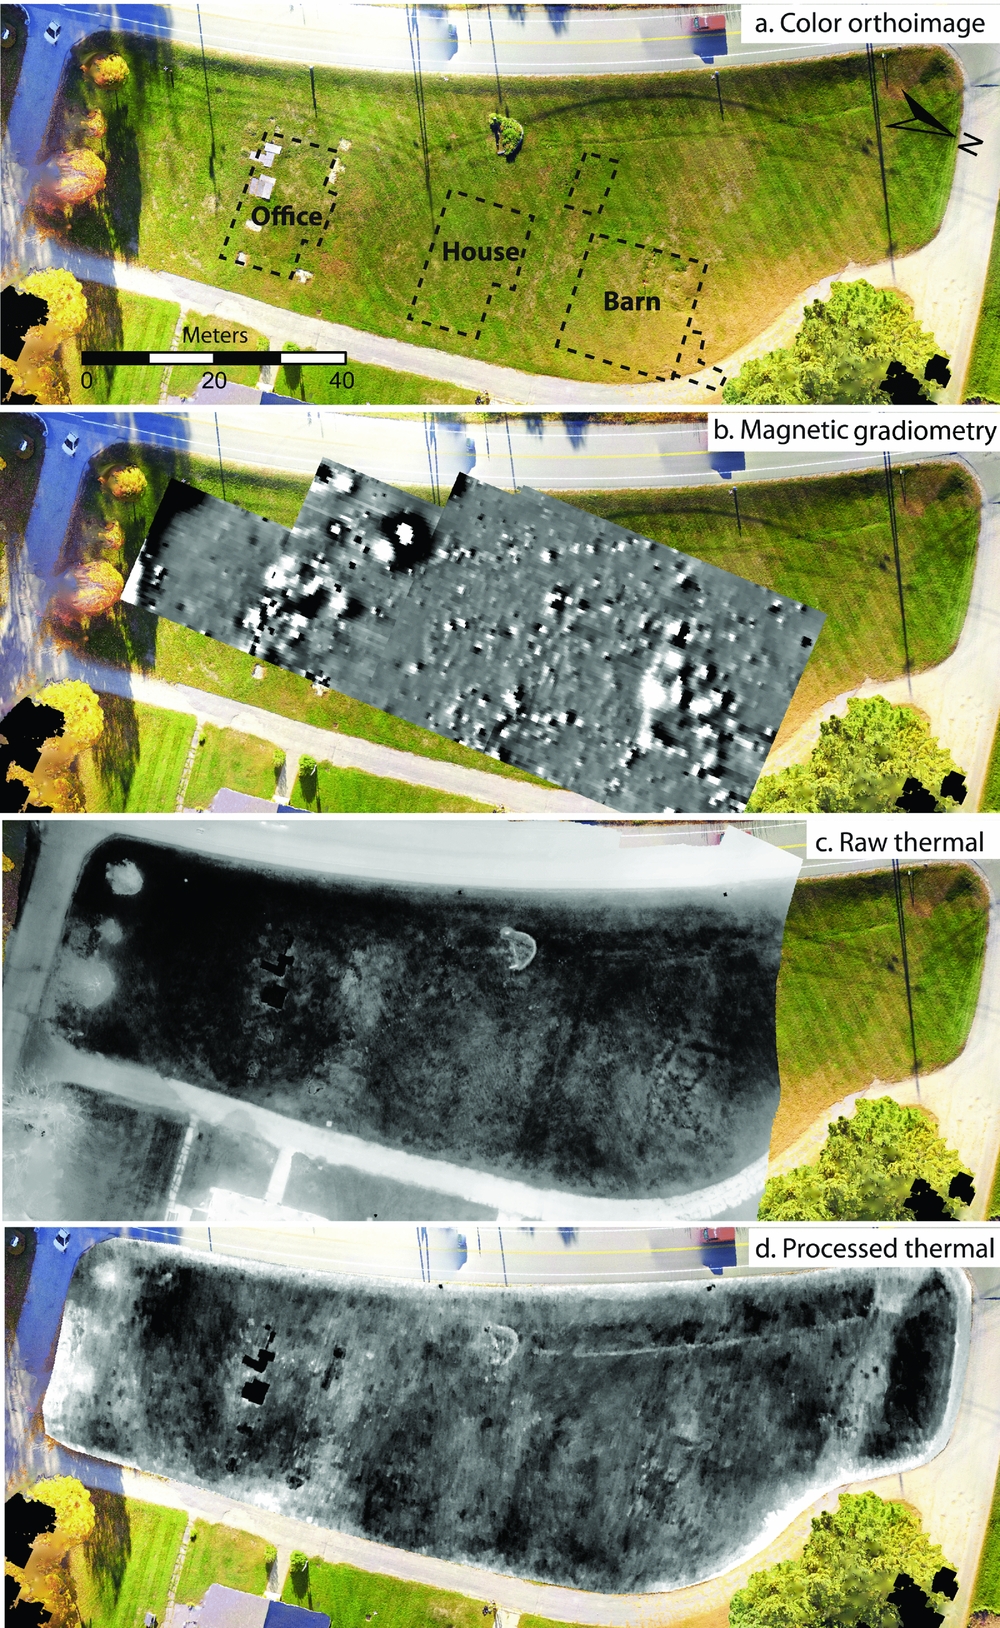
Because these thermal data are collected with a radiometric camera, it is also possible to further process the 14-bit images and utilize custom LUTs (lookup tables) to highlight subtle temperature variation that can help to reveal additional archaeological features. In this example, based on thermal images recorded at 10:45 p.m. from 60 m, an 8-bit grayscale visualization of the radiometric data was calculated to highlight only the relatively small range of temperatures that exist in the lawn in front of the “Great Stone Dwelling” (Figure 10d). This eliminates the effect of noise caused by modern surface features and vegetation, such as the asphalt roads surrounding the lawn, which are significantly warmer, and would not be possible with thermal cameras recording 8-bit images directly, with automatic gain control. In particular, the foundation of the former administrative building appears much more clearly than in the raw thermal image, as does the high-contrast area in the approximate location of the former barn.
Conclusions and Future Directions
Results of the case studies presented herein illustrate some of the many ways that aerial thermal imaging can be a powerful archaeological prospecting tool. At sites such as Blue J, New Mexico, and Enfield, New Hampshire, where there is significant contrast between cultural features and surrounding soils or ground cover, results of thermal imaging done at optimal times and under good environmental conditions can produce data that rival other geophysical datasets in terms of their ability to reveal archaeological remains. Even in other cases, such as Cahokia or the Collins Mound site, where the characteristics of archaeological features make them more difficult to distinguish, aerial thermal data nonetheless can reveal features that are not evident in other geophysical or aerial data. Moreover, the fact that thermal imagery can now be collected very rapidly over large areas at relatively low cost means that it can quite easily be included in multisensor approaches to archaeological prospection (e.g., Gaffney et al. Reference Gaffney, Gaffney, Neubauer, Baldwin, Chapman, Garwood, Moulden, Sparrow, Bates, Löcker, Hinterleitner, Trinks, Nau, Zitz, Floery, Verhoeven and Doneus2012; Herrmann et al. Reference Herrmann, King and Buikstra2014; Kalaycı and Sarris Reference Kalayci and Sarris2016; Kvamme Reference Kvamme2006a).
With these possibilities, there are inevitably also contexts in which aerial thermal imaging is unlikely to yield useful results, due either to the characteristics of the site in question, to ground cover, or to environmental conditions at the time a survey is undertaken, as, for example, due to the clay-rich soils and arid conditions we experienced at Kalavasos, Cyprus. On the other hand, our survey at Khani Masi, Iraq, a site with similar challenges, produced better results, highlighting how difficult it remains to predict where aerial thermography will be successful. Our data make clear the degree to which thermography is subject to rather extreme serendipity effects (Fowler Reference Fowler2004), as the quality of results is impacted by a wide range of environmental and other factors, including soil moisture and composition, vegetation and ground cover, and time of day or year, as well as temperature flux, sun, and wind conditions. We can begin to make educated guesses about some of these variables in planning thermal surveys, but major outstanding questions remain, such as whether diurnal or longer-term transient heat flux will be of greater value in revealing certain types of archaeological features, as well as the degree to which daytime versus night-acquired thermal imagery is of greater value. Continued research with this emerging technology will facilitate an improved understanding of how to get the most out of it.
Finally, the rapid pace of technological developments in the sensors, drones, and software used in this study will undoubtedly continue to offer new avenues for archaeological remote sensing. Most of the case studies discussed herein were conducted using a thermal camera that outputs an 8-bit, contrast-adjusted analog video-stream that must be further processed to get still images, and, with relatively low-cost sensors specifically designed for integration with drones now available, replicating this approach is quite simple. However, more advanced radiometric cameras that capture calibrated temperature data, illustrated in our experimental work at Enfield, New Hampshire, offer the possibility of a wide range of more sophisticated processing and analysis, as we now not only can potentially see subtle archaeological features that might be washed out of contrast-adjusted imagery, but can also undertake quantitative analyses of changing thermal signatures over time or under different environmental conditions. These opportunities may prove to be as transformative to archaeological aerial thermography as drone-based imaging in general, and will undoubtedly be an area of active future research.
Acknowledgments
Research conducted as part of this project was funded through grants from the National Endowment for the Humanities Office of the Digital Humanities (HD-51590-12) and the Neukom Institute at Dartmouth College CompX program. Technical support for early stages of the project was provided by the University of Arkansas Center for Advanced Spatial Technologies, and particular thanks goes to Prof. Jackson Cothren, Adam Barnes, William Johnston, and Katie Simon. Equipment used in more recent surveys has been provided by the Spatial Archaeometry Lab (SPARCL) at Dartmouth. We are indebted to numerous collaborators on the various projects reported herein, including John Kantner (Blue J), Sturt Manning (Kalavasos), Claudia Glatz (Khani Masi), Stephanie Sullivan (Collins Mound), John Kelley (Cahokia), and Michael O'Conner (Enfield). Surveys at Khani Masi were undertaken as part of the Sirwan Regional Project, permitted and overseen by the Kurdistan Regional Government's Department of Antiquities. Surveys in Cyprus were undertaken as part of the Kalavasos and Maroni Built Enviroments (KAMBE) project, with permits provided by Cyprus's Department of Antiquities. No permits were required for other surveys reported herein.
Data Availability Statement
Original, full-resolution thermal orthoimages of the various sites presented in this paper, including Cahokia, Collins Mound, Khani Masi, Kalavasos, and Enfield Shaker Village, are archived at the Spatial Archaeometry Lab (SPARCL), Department of Anthropology, Dartmouth College in Hanover, New Hampshire, United States. Thermal images presented herein along with a metadata document outlining collection and processing methods are provided upon request to researchers.


