


Introduction
Seed germination involves an array of coupled morphological and respiratory changes that make up three distinct phases each of which are characterized by the dynamics of water uptake. Germination commences with ‘imbibition’ (phase I), a profuse uptake of water by the dry seed and a gradual increase of the seed size, although this phase is associated with no or little metabolic activity (Bewley et al., Reference Bewley, Bradford, Hilhorst and Nonogaki2013). This is then followed by the onset of seed respiration as a result of the resumption of pre-germinative activity, primarily attributed to the activation of mitochondrial energy production, which has been associated with the resumption of phosphorylation to produce adenosine triphosphate (Botha et al., Reference Botha, Potgieter and Botha1992; Ma et al., Reference Ma, Bykova and Igamberdiev2017). Subsequently, the ‘lag’ phase (or phase II) initiates involving an intense metabolic activity (including the transcription and translation of new genes) and a stabilization of water uptake and respiration rate (Bove et al., Reference Bove, Jullien and Grappin2001). Lastly, active mobilization of reserves to the growing embryo causes another profuse increase of seed respiration and demand for water uptake, leading to the emergence of the radicle through the seed coat, which marks the end of germination sensu stricto and the beginning of seedling growth (‘post-germination’ or phase III) (Bove et al., Reference Bove, Jullien and Grappin2001; Bewley et al., Reference Bewley, Bradford, Hilhorst and Nonogaki2013).
‘On-farm’ seed priming is a farmer-managed type of seed treatment that differs from industrial priming strategies, as it simply consists of anaerobically soaking seeds in water for a number of hours prior to sowing (Harris, Reference Harris2006). Seeds are subsequently surface-dried for 1–2 h (to avoid clumping) and sown soon after. Once sown, seeds spend significant amounts of time absorbing water from the soil. However, by controlling the transition through the germination phases, that is, allowing seeds to undergo the pre-germinative phases I and II but preventing the start of phase III, ‘on-farm’ primed seed retains the benefits of pre-germinative advancements and, concurrently, preserves desiccation tolerance (Harris, Reference Harris2006; Bewley et al., Reference Bewley, Bradford, Hilhorst and Nonogaki2013). Subsequently, this can lead to quicker emergence and enhanced seedling vigour (and ultimately yield) when the primed seed is sown in the field as demonstrated for a range of crops (Carrillo-Reche et al., Reference Carrillo-Reche, Vallejo-Marín and Quilliam2018). Importantly, to fully exploit this method of seed priming, the safe limit (the maximum length of time that seeds can be soaked without germination taking place before sowing) for each crop and cultivar first needs to be determined. However, the optimal duration for soaking seeds (in terms of yield benefits) is not necessarily the same as the safe limit, for example, priming seeds to the safe limit could lead to seeds biochemically arrested at a very advanced stage in the transition from phase II to phase III (Salimi and Boelt, Reference Salimi and Boelt2019). Therefore, as seed soaking times are specific to each crop species/genotype or even seed quality, the major obstacle for the determination of optimal ‘on-farm’ seed priming protocols is the large number of trials needed (Paparella et al., Reference Paparella, Araújo, Rossi, Wijayasinghe, Carbonera and Balestrazzi2015; Salimi and Boelt, Reference Salimi and Boelt2019; Forti et al., Reference Forti, Ottobrino, Bassolino, Toppino, Rotino, Pagano, Macovei and Balestrazzi2020).
Currently, optimal ‘on-farm’ seed priming times have been determined for a range of crops by testing different seed soaking times (usually on moist filter paper) followed by sowing in mini-plot trials at research stations (e.g. Harris et al., Reference Harris, Joshi, Khan, Gothkar and Sodhi1999; Rashid et al., Reference Rashid, Harris, Hollington and Rafiq2004, Reference Rashid, Hollington, Harris and Khan2006; Virk et al., Reference Virk, Chakraborty, Ghosh and Harris2006). However, this process is resource-intensive and only provides retrospective information about its effectiveness. Moreover, information on the soaking times from these trials are limited to the specific crop variety and trial conditions; published or recommended soaking times, therefore, tend to be conservative and are likely to compromise any yield benefits that would have been gained from utilizing ‘on-farm’ seed priming. Thus, farmers performing ‘on-farm’ seed priming have used conservative soaking times, for simplicity commonly ‘overnight’, despite this most likely being far from the optimum (Harris, Reference Harris2006). Consequently, there is a need for the development of cost-effective methods that facilitate rapid determination of optimal soaking times for ‘on-farm’ seed priming.
Increases in respiration at the end of phase II are associated with the initiation of starch metabolism and have been used to predict seedling vigour of different species and cultivars (Patanè et al., Reference Patanè, Cavallaro, Avola and D'Agosta2006; Patanè and Avola, Reference Patanè and Avola2013; Wang et al., Reference Wang, Chen, Hussain, Mei, Dong, Peng, Huang, Cui and Nie2016). Therefore, detecting indicators of seed metabolic changes (as the flux of either O2 uptake or CO2 release) during seed soaking could provide a useful marker for the optimization of ‘on-farm’ seed priming. Using barley as a model crop, this study aimed to determine: (1) whether seed morphology and/or seed respiration changes can be used to detect metabolic changes that occur during ‘on-farm’ seed priming; (2) whether changes in morphology and/or respiration are associated with optimal soaking times and, thus, can be used as a marker for optimizing the duration of ‘on-farm’ seed priming.
Materials and methods
Plant material and priming treatments
Barley (Hordeum vulgare L.) cultivars Concerto (Limagrain, Rothwell, UK) and RGT Planet (RAGT Seeds, Ickleton, UK) were chosen, as they represent a benchmark variety for spring barley in the UK and a modern elite cultivar, respectively. However, these cultivars are more correctly representative of genotype × environment × management differences, as genotype represents only one factor in seed batch comparisons. The priming treatments applied in all experiments consisted of seeds soaked in distilled water [1:6 (w/v)] in 100 ml plastic pots, at 20°C in the dark. After treatment, seeds were allowed to air-dry on a paper towel for an hour (unless specified otherwise). In all cases, non-primed dry seeds were used as controls.
‘On-farm’ seed priming soaking times and germination
Soaking times and moisture content determination
Samples of 150 seeds were soaked for either 4, 8, 12, 16, 20, 24 or 28 h (28 h was established as the upper limit, as it was when the coleorhiza tip became visible for some seeds) in triplicate for each soaking time. Three samples of unsoaked seeds (5 g each approx.) were oven-dried at 103°C for 17 h to determine initial moisture content (M ci) (ISTA, 2015). The soaked samples were weighed before and after each soaking time to determine final moisture content (M c), which was calculated as follows:
 $$M_{\rm c} = \displaystyle{{Wi \cdot M_{\rm c}i + \Delta W} \over {Wf}}$$
where Wi and Wf are seed weight before and after drying, respectively, and ΔW is the difference between Wf and Wi.
Respiration measurements
Immediately after soaking, the concentration of CO2 released by the seeds was measured with an EGM-4 CO2 infrared gas analyser (PP Systems, Amesbury, Massachusetts, USA). Briefly, 100 mL plastic pots were hermetically closed with a lid connected to the infrared analyser through inlet and outlet tubing, in order to create a closed system to monitor the flux of [CO2]. The net CO2 flux was calculated as the increment within 1 min (average of three sequential readings representing one replicate) prior to allowing CO2 to accumulate within the tubing system for 15 s (modified from Patanè et al. (Reference Patanè, Cavallaro, Avola and D'Agosta2006)). Seed respiration rates (SRR), expressed as μmol CO2 s−1 g−1 seed DW (dry weight), for each soaking time were calculated as follows:
 $${\rm SSR} = \left({{\Delta {\rm CO}_2}\over{\Delta t}} \right) \times \left({{V}\over{RT}} \right) $$
where ΔCO 2/Δt (μmol CO2 s−1) is the change in CO2 concentration over the measurement time; V (m3) is the total volume of the system (volume of priming pot, tubing and gas analyser); R (kPa m3 mol−1 K−1) is the ideal gas constant, and T (K) is the temperature in the incubator.
Histological observations
To examine the morphology changes over time, seeds were transversally sectioned with a razor blade after each soaking time. Seed embryo structures were observed under a stereomicroscope (magnification 9×, Leica GZ6) and photographed using a digital camera (Nikon Coolpix 950).
Germination test
One hundred seeds per soaking time were placed over four sheets of paper towel covered with another two sheets previously moistened with 30 ml of sterile distilled water and incubated for 72 h in plastic containers (304 × 216 × 55 mm) with lids at 20°C in darkness. Seeds were considered to have germinated when the radicle length was greater than 2 mm. In order to accurately determine germination dynamics, counts were made every 2 h from the start of germination until cumulative germination was above 75%. Each soaking time and germination assay were carried out three times.
Desiccation tolerance test
To simulate a delay before ‘sowing’, the same soaking times were repeated (as in soaking times and moisture content determination) and seeds allowed to air-dry to original moisture on a paper towel for 30 d at nearly ambient temperature (20°C) in the dark, and then a germination test is carried out as described above.
‘On-farm’ seed priming soaking times and seedling vigour
Based on the principles of a cold test (Hampton and TeKrony, Reference Hampton, TeKrony, Hampton and TeKrony1995), a modified cold test was carried out to assess seedling vigour. Soaking times of 16, 20 and 24 h were selected (based on the germination test results) for this test, together with a unsoaked treatment as a positive control. Seeds were sown in vermiculite in three seed tray inserts (60 cells per tray) for each cultivar. All soaking treatments were equally present in each tray, and their position was randomized within each tray, which provided three replicates for each cultivar × soaking time combination. Trays were watered to reach 80% saturation, covered with aluminium foil to avoid evaporation, and kept at 10°C in the dark. This setup provided high water availability, good aeration of the substrate and low temperature to minimize any potential head start related to seed water content. After 7 d, the trays were uncovered and moved to a growth chamber at 20°C, 12 h photoperiod and 70% relative humidity for 5 d. Each tray was watered with 75 ml of distilled water every other day and emergence recorded daily. After 5 d, seedlings were removed from the inserts and categorized as either healthy (viable enough to turn into a healthy plant) or abnormal, for example, damaged, or deformed or decayed as a result of infection (supplementary Fig. S1 for an illustration of abnormality criteria). All healthy seedlings per replicate were dried at 110°C for 17 h to obtain dry weights. The experiment was repeated three times.
Data analysis
Indices for time to 50% germination (G50), time to 50% emergence (E50), uniformity (U), calculated as the time interval between 25 and 75% of seeds to germinate/emerge, the percentage of total germinated seeds (%TG) and the percentage of healthy emerged seedlings (%TE) were calculated using the ‘Germinator’ tool (Joosen et al., Reference Joosen, Kodde, Willems, Ligterink, Van Der Plas and Hilhorst2010). The effect of cultivar (Cv), soaking time (Tr) and their interaction on germination variables were assessed by analysis of variance (ANOVA) and emergence variables by the linear mixed-effects model (LMM), with experiment repetitions as a random term, in R version 3.3.0 (R Development Core Team, 2016). The assumption of normality and homoscedasticity of variances were checked by QQ-plots and residuals against fitted value plots, respectively. When these assumptions were not met, data were transformed. G50 data from the germination test were square-root transformed, and continuous proportional data, that is, percentage of germination (%TG) and percentage of healthy emerged seedlings (%TE), were arcsine transformed to approximate normality. Post hoc Fisher's LSD tests were performed to separate significant differences at P < 0.05 with the predictmeans package (Luo et al., Reference Luo, Ganesh and Koolaard2014). P-values were adjusted to avoid Type I errors (false positives) using the Benjamini–Hochberg correction (Waite and Campbell, Reference Waite and Campbell2006). Means for significant main effects are presented based on the highest order of factorial combination that was significant in the ANOVA or LMM.
In order to investigate the relative contribution of initial moisture content and the advancement of germination to speed of germination at each germination phase, moisture content (M c) and cumulative CO2 (ΣCO2) at the moment of sowing were used as predictors of G50. Data from both cultivars were pooled for this test. The relative importance of predictor variables and their bootstrapped 95% confidence intervals were calculated with the relaimpo package (Grömping, Reference Grömping2006) in R. The absence of collinearity between the two variables was verified by a variance inflation factor.
Results
Changes in seed morphology and respiration during ‘on-farm’ seed priming
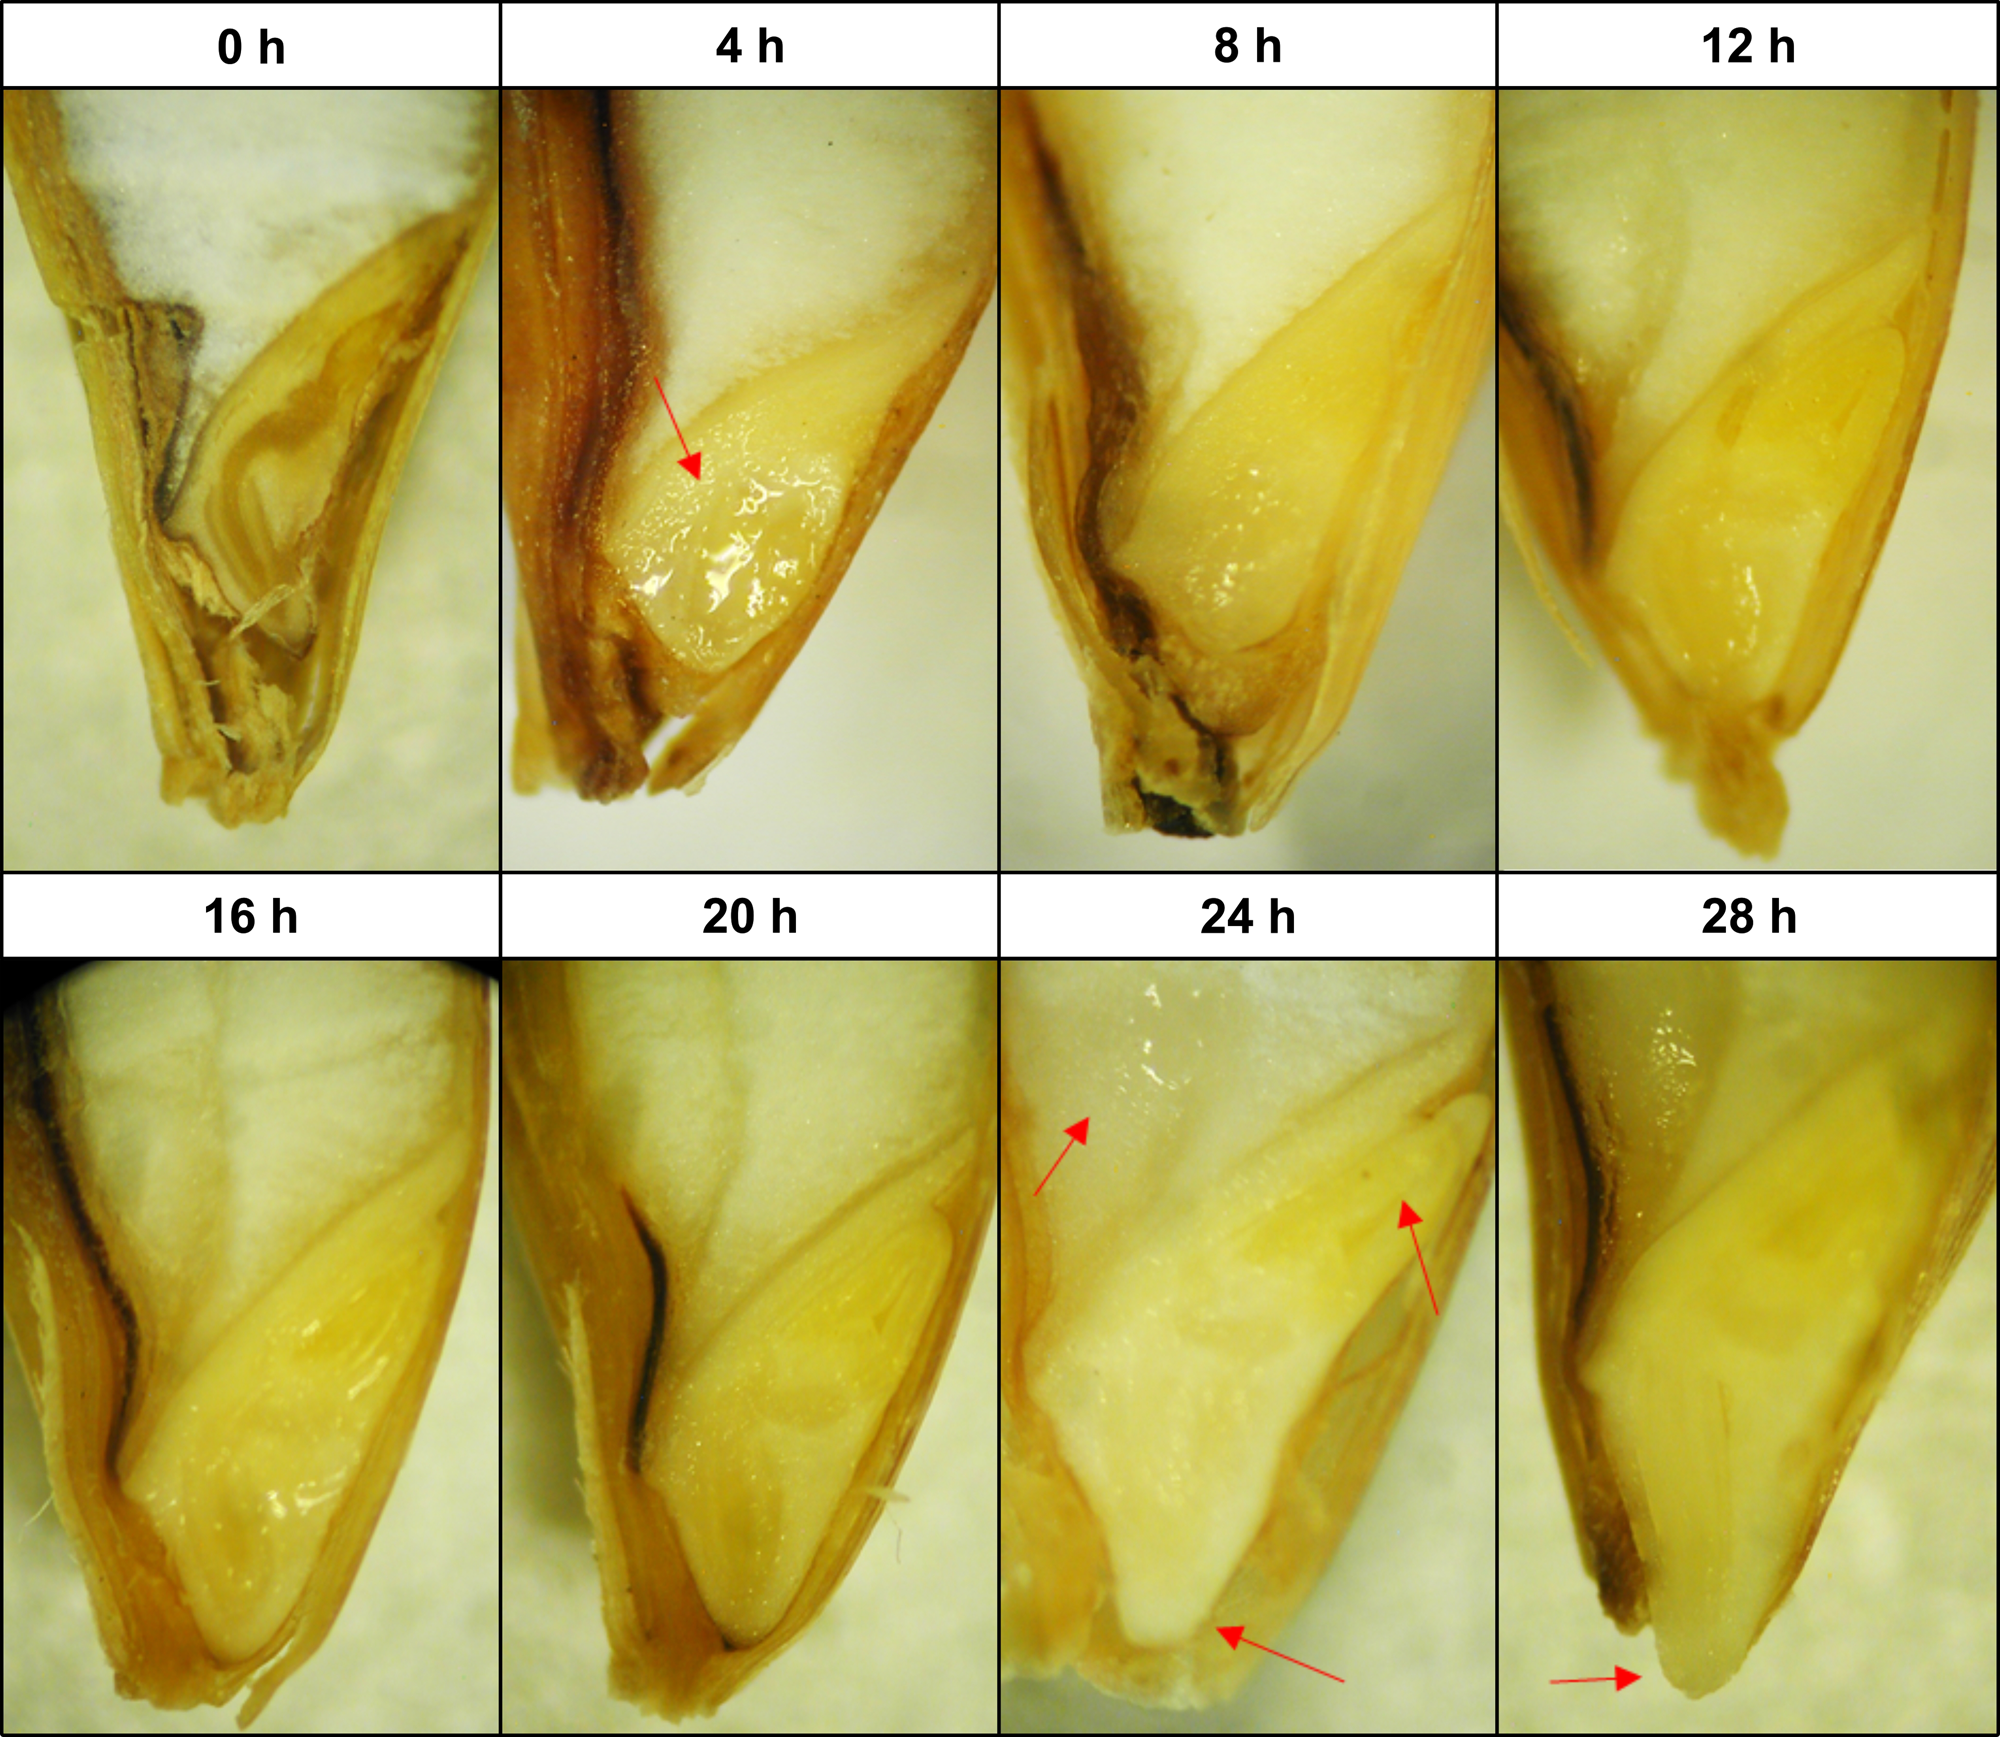
Barley seeds showed clear morphological differences, indicative of the transition from one germination phase to another (Fig. 1). After the first 4 h of imbibition, the wetting of the embryonic tissues was visually evident. This was reflected in moisture content as almost half of the total water absorbed occurred within the first 4 h of soaking, which is the characteristic of the phase I ‘imbibition’ stage (Fig. 2a). From 4 to 20 h, no major morphological changes were observed, although the overall seed size increased gradually concurrent with a progressive increase in moisture content. Typically, both differentiation and expansion of the embryonic axis began at 24 h, accompanied by seed coat loosening and wetting of the endosperm. At 28 h, the emergence of the coleorhiza tip through the micropylar was visually distinguishable for most of the seeds. Soaking times beyond 28 h did not result in the further visual morphological development of the seed and only marginal increments in moisture content.
Structural morphology of barley seeds at the end of each soaking time. Transversal embryo observation by stereomicroscopy. From left to right, red arrows show wetting of the germ, wetting of the endosperm, expansion of the coleorhiza, expansion of the coleoptile and emergence of the radicle tip.
The effects of ‘on-farm’ seed priming on (a) seed moisture content, (b) seed respiration rate (SRR) and (c) cumulative SRR at specific intervals for Concerto (open circles) and RGT Planet (closed triangles) barley seeds. Vertical bars show ±SE (only if the SE is greater than the symbol size).

The initiation of respiration about 4 h after imbibition marked the primary activation of germinative metabolism (Fig. 2b). The onset of respiration was followed by a steep rise in respiration until about 16 h, where the rate of respiration became constant. This plateau, characteristic of the phase II ‘lag’ stage, was punctuated by a second release of CO2 after 20 h of soaking, which corresponds with the major morphological changes at 24 h (Fig. 1). This burst of respiration had declined by 28 h, and soaking times beyond this did not result in further increases of water content or seed respiration which typically marks the onset of phase III.
Respiration curves for both cultivars showed a similar triphasic-like shape with some disparity in the initiation of respiration (Fig. 2b), that is, the onset of cultivar-specific respiration. For RGT Planet, this occurred within the first 4 h of soaking, whereas for Concerto, this happened after 4 h. Cumulatively, although RGT Planet had earlier metabolism, both cultivars had released similar amounts of CO2 by the end of the experiment (Fig. 2c). This cumulative respiration was later used as a proxy of seed germination advancement (ΣCO2).
Effect of different soaking times on germination parameters
Germination tests were carried out to determine the most promising soaking times for each cultivar. There was a significant interaction between cultivar and soaking time (P < 0.001) in time to 50% emergence. Longer soaking times reduced the time to 50% germination, although the residual increment after each soaking interval decreased progressively to a minimum between 24 and 28 h (Table 1). For both cultivars, the most effective durations were ≥16 h. In terms of the uniformity of germination, soaking time but not cultivar had a significant effect (P < 0.001). Soaking times greater than 4 h significantly improved uniformity, with 16 h being the most effective duration for both cultivars (Table 2). However, regarding the total percentage of germination, there was no soaking time effect (P = 0.13) but cultivar effect (P < 0.001) with Concerto having a higher percentage than RGT Planet. Overall, soaking times exerted very similar effects on germination parameters of both cultivars, thus, based on these results, soaking times of 16, 20 and 24 h were selected for the subsequent seedling vigour tests. Although 28 h soaking time achieved similar values to those of the selected soaking times, it was considered excessively long as the coleorhiza tip was visible in some seeds, indicative of ‘over-priming’ (liable to loss of vigour, desiccation and damage during sowing).
Effect of seed priming on time to 50% germination (G50)

Values followed by different letters within a column (for each cultivar) differ significantly from each other (the LSD test; P < 0.05).
LSD, least significant differences for the interaction; d.f., degrees of freedom for the residual term.
1 Back-transformed means and means on the transformed scale (within parentheses).
Effect of seed priming on soaking times on the uniformity of germination (U) and total germination (%TG)

Values followed by different letters within a column (for each main effect) differ significantly from each other (the LSD test; P < 0.05).
LSD, least significant differences for the interaction; d.f., degrees of freedom for the residual term.
1 Back-transformed means and means on the transformed scale (within parentheses).
The proportional contribution of moisture content (expressed as the moisture content at sowing) and germination advancement (expressed as accumulated CO2 at the moment of sowing) to time to 50% germination was resolved through linear regression for each phase (Table 3). At imbibition, 97% of the total variability was explained by the model and showed that reductions in time to 50% germination can be largely ascribed to the moisture content rather than cumulative CO2 (90 vs 7%) (Fig. 3). However, this situation was reversed during the lag phase, as cumulative CO2 contributed 1.5-fold more than moisture content to the total explained variance (87%).
The percentage of variance explained by moisture content (M c) and cumulative CO2 (ΣCO2) to time to 50% germination during phase I ‘imbibition’ and phase II ‘lag’. Vertical bars show 95% bootstrap confidence intervals.

Linear regression coefficients of time to 50% emergence (G50) as the response variable, and moisture content (M c) and cumulative CO2 (ΣCO2) as the explanatory variables

R 2 is the coefficient of determination, and RSE is the residual standard error.
Vigour: optimization of soaking times and desiccation tolerance
In order to assess the effect of the soaking times, a cold test was designed to offset initial water content at sowing so that potential changes in seedling biomass would be attributable to greater vigour rather than initial water content. No differences in the emergence of healthy seedlings were found at the cultivar (P = 0.12) or treatment level (P = 0.80), or their interaction (P = 0.73), indicating that seed viability remained unaffected under prolonged exposure to soaking and high moisture (supplementary Table S1). Similarly, no significant differences for time to 50% emergence were found among soaking times and control (P = 0.49); therefore, the experimental design was effective for counteracting the effect of initial moisture content (supplementary Table S1).
In contrast, both cultivar and treatment effects significantly affected seedling biomass (P < 0.001 and P < 0.01, respectively) but not the interaction (P = 0.09), indicating that the effect of soaking time was similar in both cultivars (Fig. 4). Soaking for 20 h produced the highest amount of seedling biomass of all soaking times and was significantly higher than seeds soaked for 16 h (P < 0.01) and 24 h (P < 0.05). Based on these results, 20 h was considered the optimum soaking time for both cultivars.
Average dry weight of seedlings at the end of the cold test. LMM P-values are for factor cultivar (Cv) and soaking time (Tr). Bars with different letters differ significantly according to the LSD test (P < 0.05). LSDCv = 0.02; LSDTr = 0.02. Vertical bars show the M + SE.

ANOVA for the effect of desiccation on time to 50% emergence showed significant differences for cultivar and soaking time (P < 0.001) but not for the interaction (P = 0.94). The seeds of RGT Planet were more affected than Concerto by the 30-d desiccation period (Table 4). For both cultivars, seeds soaked for 24 and 28 h needed significantly longer to attain 50% of germination compared with the rest of the soaking times. Soaking for 8 h yielded the shortest time to 50% emergence and 28 h soaking the longest time. Differences in total germination were due to the cultivar effect (P < 0.001), where again RGT Planet was more sensitive to desiccation. No significant differences among soaking times (P = 0.27) or the interaction (P = 0.40) were found (Table 4). A comparison of time to 50% germination and total germination of (unsoaked) control treatments relative to the corresponding control showed a negative effect in germination performance that was attributable to storage conditions (i.e. 30 d at 20°C). These effects were most apparent for RGT Planet with +26.4 and −4.5% change in time to 50% germination and total germination, respectively, whilst the effects for Concerto were negligible, +1.8 and −0.7%, respectively.
Effect of desiccation after different soaking times on time to 50% germination (G50) and total germination (%TG)

Values followed by different letters within a column (for each main effect) differ significantly from each other (the LSD test; P < 0.05).
LSD, least significant differences for the interaction; d.f., degrees of freedom for the residual term.
1 Back-transformed means and means on the transformed scale (within parentheses).
Discussion
Seed respiration as a tool for detecting the activation of metabolic processes during ‘on-farm’ seed priming
The present work has shown that monitoring of CO2 flux patterns is a reliable tool for detecting key germination events during barley ‘on-farm’ seed priming. As under regular germination conditions, barley respiration during priming describes a triphasic curve where the transition from one germination phase to another is marked by a burst of seed respiration, providing useful information on the timing of metabolic changes that occur during the course of priming. The highest seedling vigour for both cultivars was attained in seeds primed for 20 h, which, morphologically, corresponds with stopping the priming process just before the differentiation of embryo tissues into coleoptile and coleorhiza, and before the second burst of CO2 flux. Therefore, both seed morphology and CO2 flux patterns can be used as a marker for ‘on-farm’ priming optimization.
Unlike regular germination, the continuation of phase III beyond its initiation is impeded during ‘on-farm’ seed priming, and longer soaking times do not result in the further development of the coleorhiza tip nor a sharp increment of water uptake. Due to the hypoxic conditions within the seed, the energy demands for early barley seed development are mostly provided through oxygen-independent metabolic pathways, for example, glycolysis and alcohol fermentation (Østergaard et al., Reference Østergaard, Finnie, Laugesen, Roepstorff and Svensson2004; Zhang et al., Reference Zhang, Sreenivasulu, Weschke, Stein, Rudd, Radchuk, Potokina, Scholz, Schweizer, Zierold, Langridge, Varshney, Wobus and Graner2004). However, in late phase II, the further development of the embryo requires oxygen-dependent cycles such as tricarboxylic acid that is more efficient for active mobilization of storage reserves and cannot be fulfilled by anaerobic respiration alone (He et al., Reference He, Zhu, Dong, Zhang, Cheng, Li and Yan2015; Ma et al., Reference Ma, Bykova and Igamberdiev2017). When exogenous O2 is available, a profuse second burst of CO2 flux is followed by the appearance of the coleorhiza tip and more water uptake (Bewley et al., Reference Bewley, Bradford, Hilhorst and Nonogaki2013; Ma et al., Reference Ma, Bykova and Igamberdiev2017). However, this second burst declines soon after and is not followed by an increase of water uptake under the hypoxic conditions imposed by ‘on-farm’ seed priming. Although respiration remains active possibly through fermentation, further root development is impeded as a mechanism to avoid anoxia (Borisjuk et al., Reference Borisjuk, Macherel, Benamar, Wobus and Rolletschek2007; Ma et al., Reference Ma, Marsolais, Bykova and Igamberdiev2016).
Sectioning and observation of seed morphology seem useful for detecting the beginning of phase III, which corresponds with the elongation of the coleoptile and coleorhiza tissues in the embryo, but not for other metabolic processes. As observed for other cereal seeds, although an enlargement of the seed size throughout soaking could be seen by eye, actual changes in seed structures are minimal even under the microscope until phase III (An and Lin, Reference An and Lin2011; He et al., Reference He, Zhu, Dong, Zhang, Cheng, Li and Yan2015).
Cultivars showed distinct seed vigour from one another, although this was not only due to genotype differences but also due to differential seed quality (as manifested by the notable deterioration of RGT Planet germination performance after a storage period under unfavourable conditions). However, both cultivars performed similarly with an optimal soaking time of 20 h, suggesting that seed vigour and/or seed quality have minor influence in soaking times. Although it is tempting to generalize that 20 h is the optimal soaking time for barley, it is still to be elucidated the extent to what extent seed vigour and/or seed quality components can influence priming soaking times. Seed phenotypical characteristics (e.g. seed coat, grain composition and size), ageing and the make-up of the maternal tissues are known to alter the germination process and, by extension, likely to affect seed priming soaking times (Finch-Savage and Bassel, Reference Finch-Savage and Bassel2016; Salimi and Boelt, Reference Salimi and Boelt2019).
Mechanistic of the priming benefits: timing and contribution of its drivers
In order to better leverage ‘on-farm’ seed priming, it is critical to understand the timing and contribution of the two main drivers for rapid germination: (1) a hydrated seed and (2) being developmentally more advanced than dry seeds at the moment of sowing. The rapid germination of ‘on-farm’ primed seeds can be mainly ascribed to the rapid hydration of internal tissues rather than to the germination advancement gained during the soaking time. In this study, few hours of soaking (~4 h) were sufficient to dramatically reduce the time for germination relative to dry barley seeds (35% out of the 53% average total gain), after which residual gains from longer soaking times were gradually ascribable to developmental advancement. Longer soaking times (≥8 h) are needed to significantly enhance the uniformity of barley germination, after which no further improvements in uniformity are attained. This suggests the occurrence of metabolic changes at the early lag phase which completion ensures that all barley seeds have reached, by way of checkpoint, a common stage in the germination programme.
It follows from the above discussion that simply soaking for several hours, for example, 8 h as equivalent to the ‘overnight’ practice proposed for most tropical crops (Harris, Reference Harris2006), is enough to obtain significant germinative benefits from planting hydrated seeds. However, if primed seeds are sown in soil at the field capacity, this rapid hydration effect compared with dry seeds may be limited, although the benefits of being developmentally advanced still remain. In an agricultural context, yield benefits associated with sowing hydrated seeds will vary depending on local soil moisture, with the most beneficial benefits associated with sowing ‘on-farm’ primed seeds in water-stressed soils (Carrillo-Reche et al., Reference Carrillo-Reche, Vallejo-Marín and Quilliam2018). Imbibition is primarily a passive process and is a driver for the resumption of metabolic activity (reflected by the increase in respiration), so the priming duration must be long enough to ensure that germination processes are sufficiently advanced to enable pre-germinative benefits once the seed is sown. Since the actual timing for these events will vary depending on cultivar, seed quality and priming conditions (e.g. temperature), focusing on the germination advancement stages rather than a particular soaking time seems to be the best strategy for the optimization and standardization of ‘on-farm’ seed priming in order to maximize seed vigour.
Seedling vigour is the most important seed quality trait, as the post-germination pre-emergence seedling growth phase is considered the most vulnerable stage and, thereby, the usefulness of seed priming (Finch-Savage and Bassel, Reference Finch-Savage and Bassel2016). When the advantage of partial hydration is kept out of the equation, enhanced seedling vigour is evident when the priming process is stopped just before the beginning of the differentiation of embryo tissues into coleoptile and coleorhiza, but not before or after, highlighting the specificity of optimal priming protocols. At this stage, most of the pre-germinative metabolism has already taken place, that is, mitochondrial multiplication, gene transcription, synthesis of amino acids and new proteins, but is still prior to the induction of post-germinative metabolism, that is, cell division and expansion, which ensures that root emergence only occurs after sowing (He et al., Reference He, Zhu, Dong, Zhang, Cheng, Li and Yan2015; Wojtyla et al., Reference Wojtyla, Lechowska, Kubala and Garnczarska2016; Ma et al., Reference Ma, Bykova and Igamberdiev2017). Furthermore, there is increasing evidence that the activation of cellular repair is the key process enhancing seed vigour following seed priming, so that it is likely that this optimal soaking time corresponds with the maximum DNA repair and antioxidant response to recover from prior oxidative damage (Sharma and Maheshwari, Reference Sharma and Maheshwari2015; Wojtyla et al., Reference Wojtyla, Lechowska, Kubala and Garnczarska2016; Forti et al., Reference Forti, Ottobrino, Bassolino, Toppino, Rotino, Pagano, Macovei and Balestrazzi2020). However, these invigorating effects are not arrested when seeds are dehydrated to their original moisture content and then allowed to ‘re-germinate’. Dehydration, unfavourable storage conditions and re-hydration lead to extensive oxidative damage that may revoke the seed repair attained during the priming process (El-Maarouf-Bouteau et al., Reference El-Maarouf-Bouteau, Meimoun, Job, Job and Bailly2013; Waterworth et al., Reference Waterworth, Bray and West2019).
The onset of embryonic axis differentiation can be understood as the milestone marking the transition from seed to seedling and, although technically falls within the ‘safe limits’ (as no germination is externally visible even when let air-dry), must be prevented. The declines in seed/seedling performance in both desiccation and vigour tests at and after this milestone are clear signs of excessively long priming duration (‘over-priming’). The probable reason for this phenomenon is the loss of desiccation capacity. Type I proteins such as late embryogenesis abundant proteins (which are involved in preventing membrane disintegration and protecting mitochondrial enzymes under dehydration) progressively depletes after imbibition and, thus, compromises desiccation tolerance (Grelet et al., Reference Grelet, Benamar, Teyssier, Avelange-Macherel, Grunwald and Macherel2005; Yang et al., Reference Yang, Li, Wang, Chen, Chen and Shen2007; An and Lin, Reference An and Lin2011). In addition, it is possible that toxic fermentation products accumulate in excess in response to the prolonged hypoxic conditions during ‘on-farm’ seed priming conditions contributing to a gradual loss of vigour (Benvenuti and Macchia, Reference Benvenuti and Macchia1995).
Implications and practical considerations of ‘on-farm’ seed priming
In practice, farmers using ‘on-farm’ seed priming need to be able to distinguish between ‘optimal’ and ‘safe’ soaking times. When conditions allow seeds to be sown within a few hours after priming, optimizing soaking times to produce maximal moisture content and advancement benefits would be the best strategy. Air humidity and a long drying period after priming may impair the optimal soaking times by, for example, promoting the proliferation of fungal damage. Thus, when there is a risk of delayed sowing (e.g. due to heavy rain, or having to passively dry seeds overnight after priming), shorter soaking times can ensure that germination does not occur before planting. Current safe recommendations for ‘on-farm’ seed priming of barley are for ‘overnight’ priming (~8 h) (Harris, Reference Harris2006).
It is important that farmers can obtain information on optimal soaking times for their own seeds and specific ‘on-farm’ priming conditions. From the methods proposed in this study for determining optimal soaking times, sectioning for microscopic observation of seed morphological changes is the simplest option. Having identified embryo axis differentiation as the marker for ‘over-priming’, this method could be performed by farmers with a razor blade and a magnifying glass. However, the reproducibility of this within the farm context would be a challenge, and specific training for the identification of these subtle embryo differences would be required. The second method of monitoring seed respiration as a marker is a non-invasive technique and allows the accurate identification of both the initiation of phase II (which can be used for the recommendation of safe limits) and the initiation of phase III (for the recommendation of optimal soaking time). Although this method is not designed to be carried out by farmers, it could be performed by agricultural institutions for providing recommendations of general practices for common varieties within their region produced under comparable growing conditions. Both methods represent a much more rapid and cost-effective alternative to the current optimization approach through a series of germination assays and mini-plot trials and, therefore, could facilitate the widescale adoption of ‘on-farm’ seed priming.
Conclusions
This study emphasizes the importance of the two drivers of ‘on-farm’ seed ‘priming’ benefits: moisture content and advanced germination at the moment of sowing. In an agricultural context, the former largely determines the time to germination, but its magnitude will vary depending on soil moisture. However, the extent of the benefits from germination advancement will depend on the moment of stopping the priming process and, thereby, the importance of optimizing the soaking times in order to exploit the full benefits from this technology. Therefore, it is proposed that to achieve maximum seedling performance, priming is stopped prior to the differentiation of the embryonic axis and/or the second burst of respiration. This optimal timing can be deduced from the morphological observation of the embryonic axis or CO2 flux patterns for each cultivar and priming conditions. These methods could easily be implemented for determining the optimal soaking times of other cultivars of barley. Extrapolation of these methods to other crops seems feasible, although further testing would be required as seed respiration and germination rates can vary greatly depending on crop-specific characteristics of the seed, for example, starch seeds versus oil seeds.
Supplementary material
To view supplementary material for this article, please visit: https://doi.org/10.1017/S0960258521000039.
Acknowledgements
The authors thank Dr Jens-Arne Subke, for his assistance with respiration apparatus, and the Scottish Government Strategic Research Programme Theme 2: Productive and Sustainable Land Management and Rural Economies.
Financial support
This study was funded by the Ekhaga Foundation (2015-60). The funders had no involvement with the study design; the collection, analysis and interpretation of data; in the writing of the report or in the decision to submit the article for publication.
Conflict of interest
The authors declare that they have no conflict of interest.
Data availability
The datasets generated during the current study are available in the Stirling Online Repository for Research Data repository.


 Open access