


Introduction
The unprecedented scale of the evidence for the current global biodiversity crisis is such that it has been classified as the sixth mass extinction (IPBES 2019). This global pattern is confirmed by the global trends in bird species, which are generally considered as sentinels of the environment. Currently, an alarming 48% of approximately 11,000 bird species worldwide are experiencing known or suspected declines (Lees et al. Reference Lees, Haskell, Allinson, Bezeng, Burfield and Renjifo2022). These declines, however, are not uniformly distributed across avian species. For instance, grassland birds in North America have encountered the steepest reductions (Rosenberg et al. Reference Rosenberg, Dokter, Blancher, Sauer, Smith and Smith2019), while in Europe, farmland birds have sharply decreased, primarily due to intensified agricultural practices (Emmerson et al. Reference Emmerson, Morales, Oñate, Batary, Berendse and Liira2016; Gregory et al. Reference Gregory, Skorpilova, Vorisek and Butler2019; Rigal et al. Reference Rigal, Dakos, Alonso, Auniņš, Benkő and Brotons2023).
The revolution towards modern agriculture entailed a rapid transformation from traditional agricultural landscapes to intensively managed farmlands. As a result, the associated rapid habitat loss and degradation have led to a marked decline in biodiversity across the whole tree of life. At the landscape scale, increase in field parcel size and reduced crop rotation have led to landscape simplification and homogenisation by eliminating non-cultivated elements like margins, hedges, and fallow lands, driving loss of habitat for farmland biodiversity (Rigal et al. Reference Rigal, Dakos, Alonso, Auniņš, Benkő and Brotons2023). This pattern was largely fuelled by the EU’s Common Agricultural Policy (CAP) that promoted agricultural intensification in Europe, while attempts to mitigate biodiversity loss through agri-environmental schemes have shown mixed results (Boetzl et al. Reference Boetzl, Krauss, Heinze, Hoffmann, Juffa and König2021; Concepcion et al. Reference Concepcion, Díaz, Kleijn, Baldi, Batary and Clough2012). Current discussions about further reducing minimum set-aside or fallow land, one of the most beneficial measures for farmland birds (Staggenborg and Anthes Reference Staggenborg and Anthes2022), will exacerbate bird declines in agro-ecosystems (Traba and Morales Reference Traba and Morales2019). At the local, field parcel scale, the use of pesticides and fertilizers drive habitat degradation mainly through reductions in food availability for birds (Emmerson et al. Reference Emmerson, Morales, Oñate, Batary, Berendse and Liira2016).
A particularly affected species is the Little Bustard Tetrax tetrax, which thrives in traditional, extensive farming landscapes, including pseudo-steppe, but has suffered one of the most dramatic population reductions in Europe. It is currently classified as “Near Threatened” globally and “Vulnerable” in Europe, with a status of “Endangered” in Italy (IUCN 2022). The species has vanished from 15 countries since the mid-twentieth century, with its remaining western Palearctic population largely confined to the Iberian Peninsula, France, and Sardinia (Morales and Bretagnolle Reference Morales and Bretagnolle2022). The Iberian Peninsula, serving as a primary refuge for this species, has documented a yearly decline of 6% over the last two decades. Italy harbours the only island population of this species, which is extant in Sardinia, while the Little Bustard in peninsular Italy became extinct at the start of this century (Brichetti and Fracasso Reference Brichetti and Fracasso2018). Historically, the Little Bustard was widespread across the extensive pastoral and arable landscapes of central-western Sardinia (Santangeli and Dolman Reference Santangeli and Dolman2011), with estimates in the mid-1980s suggesting a population of 1,500–2,000 individuals (Schenk and Aresu Reference Schenk and Aresu1985). Subsequently, an extensive survey in 2010–2011 detected only 352 males, suggesting a population decline (Nissardi and Zucca Reference Nissardi, Zucca, Tinarelli, Andreotti, Baccetti, Melega, Roscelli and Serra2014). However, methodological differences and limitations make inferring trends from past data highly uncertain. The only study comparing systematic survey data revealed a 30% decline of Little Bustard numbers during 2008–2022 from two historical populations in Sardinia, Abbasanta and Campeda plains (Santangeli et al. Reference Santangeli, Cardillo, Pes and Aresu2023a).
The current rapid pace of land-use change, further accelerated by the expansion of renewable energy infrastructures like wind and solar photovoltaic (PV) in Sardinia and elsewhere (Santangeli et al. Reference Santangeli, Cardillo, Pes and Aresu2023a), underscores the urgency for evidence-based zoning and strategic planning in development projects (Hermoso et al. Reference Hermoso, Bota, Brotons and Morán-Ordóñez2023). Unfortunately, such projects, aimed at ensuring the persistence of Little Bustard in Sardinia, are severely impeded by a lack of comprehensive regional data on its distribution – a phenomenon known as the Wallacean shortfall – together with gaps in knowledge about its population numbers, trends, and the factors driving these changes. This scarcity of data hinders the development and implementation of effective conservation measures for this rapidly declining species.
With this study, we aimed to fill the above knowledge gaps on Little Bustard ecology and biogeography in Sardinia, and to provide updated evidence-based information that would feed into conservation planning for the whole of Sardinia. The overall aim of this work was to quantify current population densities and distribution of the Little Bustard in relation to land use and protected areas, across its range in Sardinia, the only island population of the species. Specifically, we aimed to first quantify the current densities of the species in Sardinia, overall and separately for each subpopulation on the island. Second, we aimed to quantify the habitat correlates of the species occurrence, and the potential impact of past habitat change on the species current occurrence. Third, we aimed to quantify the role of protected areas in supporting the current Little Bustard population in Sardinia.
Methods
Study area
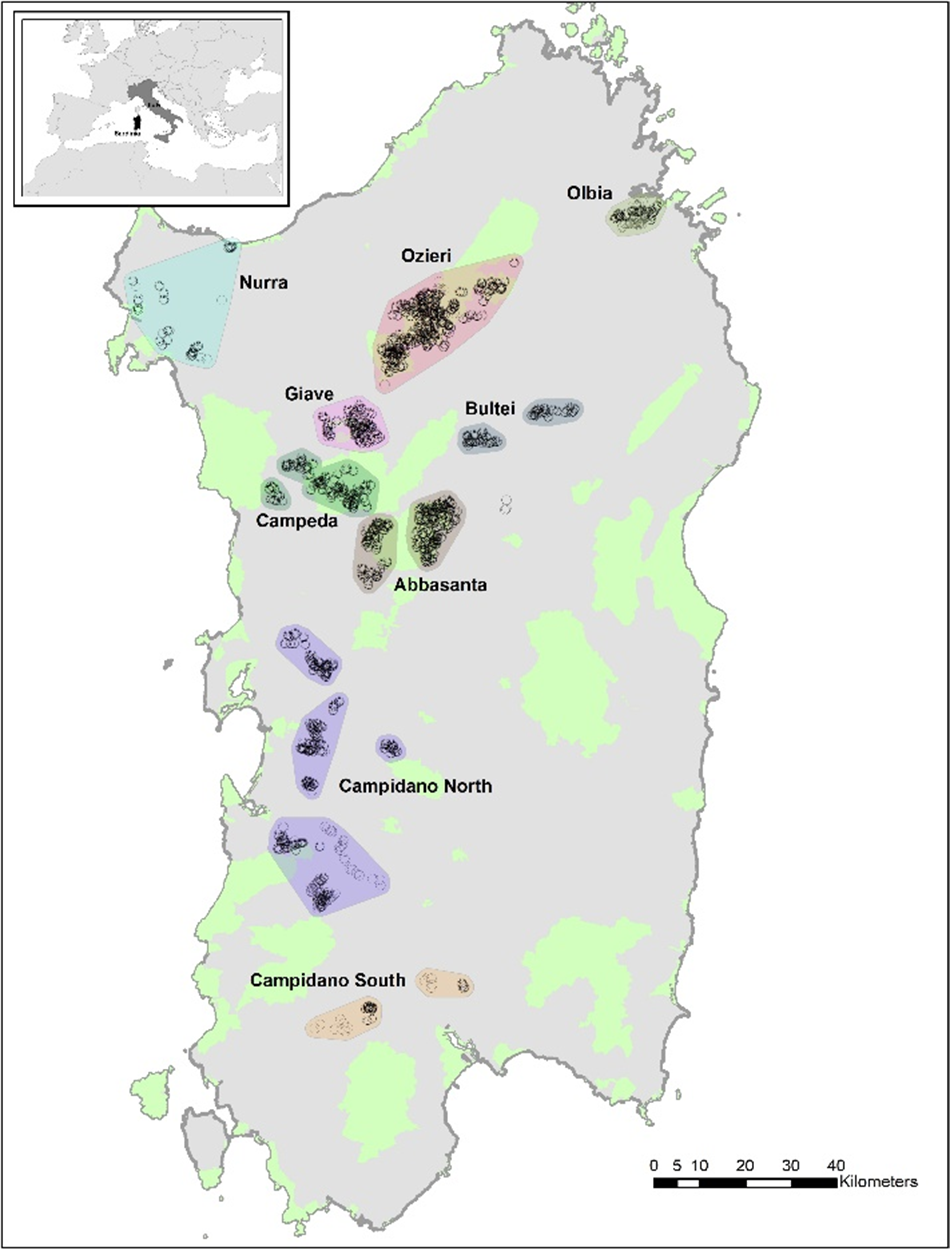
The study covered the whole island of Sardinia where extant or historical populations of Little Bustard are known (Nissardi and Zucca Reference Nissardi, Zucca, Tinarelli, Andreotti, Baccetti, Melega, Roscelli and Serra2014). Across Sardinia, the species is thought to be present largely in the western areas, with a number of subpopulations. Here the term subpopulations means breeding nuclei that are close to each other in a homogeneous agro-pastoral landscape and not separated by mountain ranges or large extents of forest cover that might impede movement. We acknowledge that there can be movements between these subpopulations, but from anecdotical (unpublished) GPS data these movements are scarce and occur outside the breeding season. Two of these subpopulations harbour more than half of the total number of Little Bustards in Sardinia. These are two large highland plateau areas, the plain of Abbasanta and the plain of Ozieri, mostly falling within the Natura 2000 network as Special Protection Areas (SPAs) designated for the conservation of the Little Bustard (Directive 79/409/CEE). These two areas, as well as the other inland areas of Bultei, Campeda, and Giave, are dominated by semi-natural pastoral steppe, with extensive pastures, long-term fallows, hay meadows, and marginal dry cereals. Conversely, the three coastal areas of Campidano, Nurra, and Olbia are largely dominated by intensive agriculture, mainly dry cereals (Figure 1).
Distribution of the point-counts (black circles) performed in 2023 to survey Little Bustards across Sardinia. Protected areas are shown in light green, while coloured polygons depict the various subpopulations (each with a name on the map). Boundaries of the subpopulations are drawn by extending by 2 km the minimum convex polygon around the survey points of each subpopulation. The location of Sardinia within Italy and Europe is depicted in the inset map.

Little Bustard survey
We randomly selected 50% of points from the point-count locations of a past survey (including just over 2,000 point-counts across all known historical areas for the species in 2010–2011; Nissardi and Zucca Reference Nissardi, Zucca, Tinarelli, Andreotti, Baccetti, Melega, Roscelli and Serra2014) to be surveyed in 2023. The random selection was stratified by subpopulation (n = 9, shown in Figure 1) to ensure adequate point-count coverage for each. The final data set included 969 point-counts surveyed in 2023, which is lower than 50% of the points of 2010–2011 due to exclusion of some disjunct areas where the species was totally absent, and considered extinct. The survey method involved a five-minute count per point by an observer with binoculars. As in previous studies, surveys were conducted after dawn (06h00–10h00) and before dusk (18h00–21h00) under the favourable conditions of no rain or wind (Santangeli and Dolman Reference Santangeli and Dolman2011; Santangeli et al. Reference Santangeli, Cardillo, Pes and Aresu2023a; Wolff et al. Reference Wolff, Paul, Martin and Bretagnolle2001). The above choice followed from known activity patterns of the species (De Juana and Martínez Reference De Juana and Martínez1996). The survey season was restricted to between 7 April and 15 May, which represents the period of maximum display activity of male Little Bustards in the region. At each point-count, all detected males were recorded, carefully avoiding double counting of the same individual in the field. When a detection was made, the coordinates of the male location were also recorded on each occasion. The linear distance between the detected male and the point-count was estimated in the field and validated a posteriori in ArcMap 10.8 (©ESRI), thereby allowing for a distance sampling point-count method (Buckland et al. Reference Buckland, Rexstad, Marques and Oedekoven2015). Unfortunately, such accurate geospatial information was not available for the 2010–2011 survey, thereby preventing any meaningful comparisons of densities between the periods.
Land-use data
We created a circular buffer of 500 m around each of the point-counts and extracted four land-use classes. The choice of this buffer size/radius was dictated by the need to capture the immediate and proximate environment in which breeding males are exposed, and actively use, providing an optimal balance between covering a large enough and representative area while not diluting the results by extending the radius too much to capture habitats that are not used. Also, 500 m captures most of the area covered by each single point-count (see Supplementary material). Land use was extracted for each point-count buffer of 2023 and based on land-use maps from 2010 (past land use) and 2023 (present land use) separately. This allowed modelling of current occurrence in relation to present land use, and recent changes in land use (see details below). A detailed land-use map, specifically produced by the Region of Sardinia, was available for the year 2010. From this map it was possible to directly extract the four land-use classes of interest, i.e. arable (mainly dry cereal crops), fallow (also including pastures uncultivated for one or more years), hay meadows (harvested two or even three times per year, and can also be grazed after harvest), and unsuitable (villages, infrastructures, vineyards, woodlands, and any other woody vegetation area), following Santangeli and Dolman (Reference Santangeli and Dolman2011) and Santangeli et al. (Reference Santangeli, Cardillo, Pes and Aresu2023a). For the survey year of 2023, no such comparable map was available. Therefore, similarly to Santangeli et al. (Reference Santangeli, Cardillo, Pes and Aresu2023a), we obtained the most recent orthoimagery available from the Region of Sardinia (Ortofoto AGEA 2022, www.webgis2.regione.sardegna.it/geonetwork/srv/ita/catalog.search#/metadata) and manually updated the land use, based on the four classes, consistently with those available from the first period. These latter land-use maps were then ground-truthed using available photographs from Google Street Maps and directly from the fieldwork during the surveys in 2023. For each survey point we then calculated the change in land use (within the 500-m buffer area) over the recent 13 years by drawing the difference between present and past land-use cover value within each buffer and separately for each land-use category.
We then classified each point-count into protected or unprotected. We obtained the network of protected areas for Sardinia (including Natura 2000 sites as well as regional and national protected areas) from the World Database on Protected Areas (UNEP-WCMC and IUCN 2023). We ran a spatial intersection in ArcMap between the points and the protected area layer and identified protected and unprotected survey points. Finally, we extracted the mean soil degradation index within a buffer of 1 km around each point-count location. The soil degradation layer (Panagos et al. Reference Panagos, Broothaerts, Ballabio, Orgiazzi, De Rosa and Borrelli2024), relevant to the year 2023, collectively combines factors such as soil contamination with agrochemicals, reductions in invertebrate diversity, alteration of soil microbial communities, land-use intensification, among others, which are all relevant to the species (González del Portillo et al. Reference Gonzalez del Portillo, Arroyo, Garcia Simon and Morales2021; Morales and Bretagnolle Reference Morales and Bretagnolle2022).
Statistical modelling
We conducted modelling of the 969 point-count data surveyed in 2023 using the Distance package (Miller et al. Reference Miller, Rexstad, Thomas, Marshall and Laake2019) in R, version 4.2 (R Core Development Team 2021). We ran a detection model for the data. We explored several conventional distance sampling and multiple covariate distance sampling models. These included three key functions (half-normal, hazard rate, and uniform), with various adjustment terms (cosine or simple polynomial), and land use as a categorical covariate (see Table S1). Model comparison was performed using the Akaike information criterion (AIC) (Akaike Reference Akaike1979), with the model exhibiting the lowest AIC score considered the best fitting model. The input data for the models comprised the number of points from the nine areas across Sardinia, point-count identifier, radial distance for each detection, and land use as a covariate. Effort was set to one unit for all points because each point was visited once and with the same effort. All models were fitted after performing a 5% right truncation of the data (Buckland et al. Reference Buckland, Rexstad, Marques and Oedekoven2015). These models were used to derive the density and abundance estimates for bird species detected during the surveys. The best-fitting detection function model was used to calculate the effective detection radius for each land-use type, allowing us to adjust for variation in detectability among different habitats. This resulted in density estimates overall, and for each subpopulation.
For each survey point, the percentage coverage of the four land-use classes (arable, fallow, hay meadow, and unsuitable; extracted within the 500-m buffer) was calculated in GIS. Points were assigned to a specific dominant land-use category based on the dominant class within the buffer. If one class covered more than 50% of the buffer area, the point was classified under that category (i.e. the dominant land use). If no single class exceeded 50%, the point was categorised as “mixed” (M), representing heterogeneous landscapes with no predominant land-use class. Density estimates were then calculated for each land-use category and protection status (protected vs unprotected land).
We next quantified the influence of recent land-use changes (over a 13-year period; detailed above) on the current densities of Little Bustards. For this analysis, we excluded the points within the two populations of Nurra and Campidano South where the species has not been detected in the past decade or more. We first derived a measure of land-use change for each of the four categories around each point between 2010 and 2023. We next scaled the four land-use variables, as well as the current soil degradation variable, to zero mean and 1SD. Due to multicollinearity, especially in the land-use change variables, we ran five separate models, one for each variable, and the quadratic effect of each of them on the response. Due to the large number of zeros in the density, points with no detections, we converted the density to integer (using a rounding approach) and applied a negative binomial (Poisson distribution) across all models. We also included the identity of a subpopulation in the random structure to account for pseudo-replication of observations within the same subpopulation. We inspected the residual plots to ensure no violations of the model assumptions.
Results
Current population densities
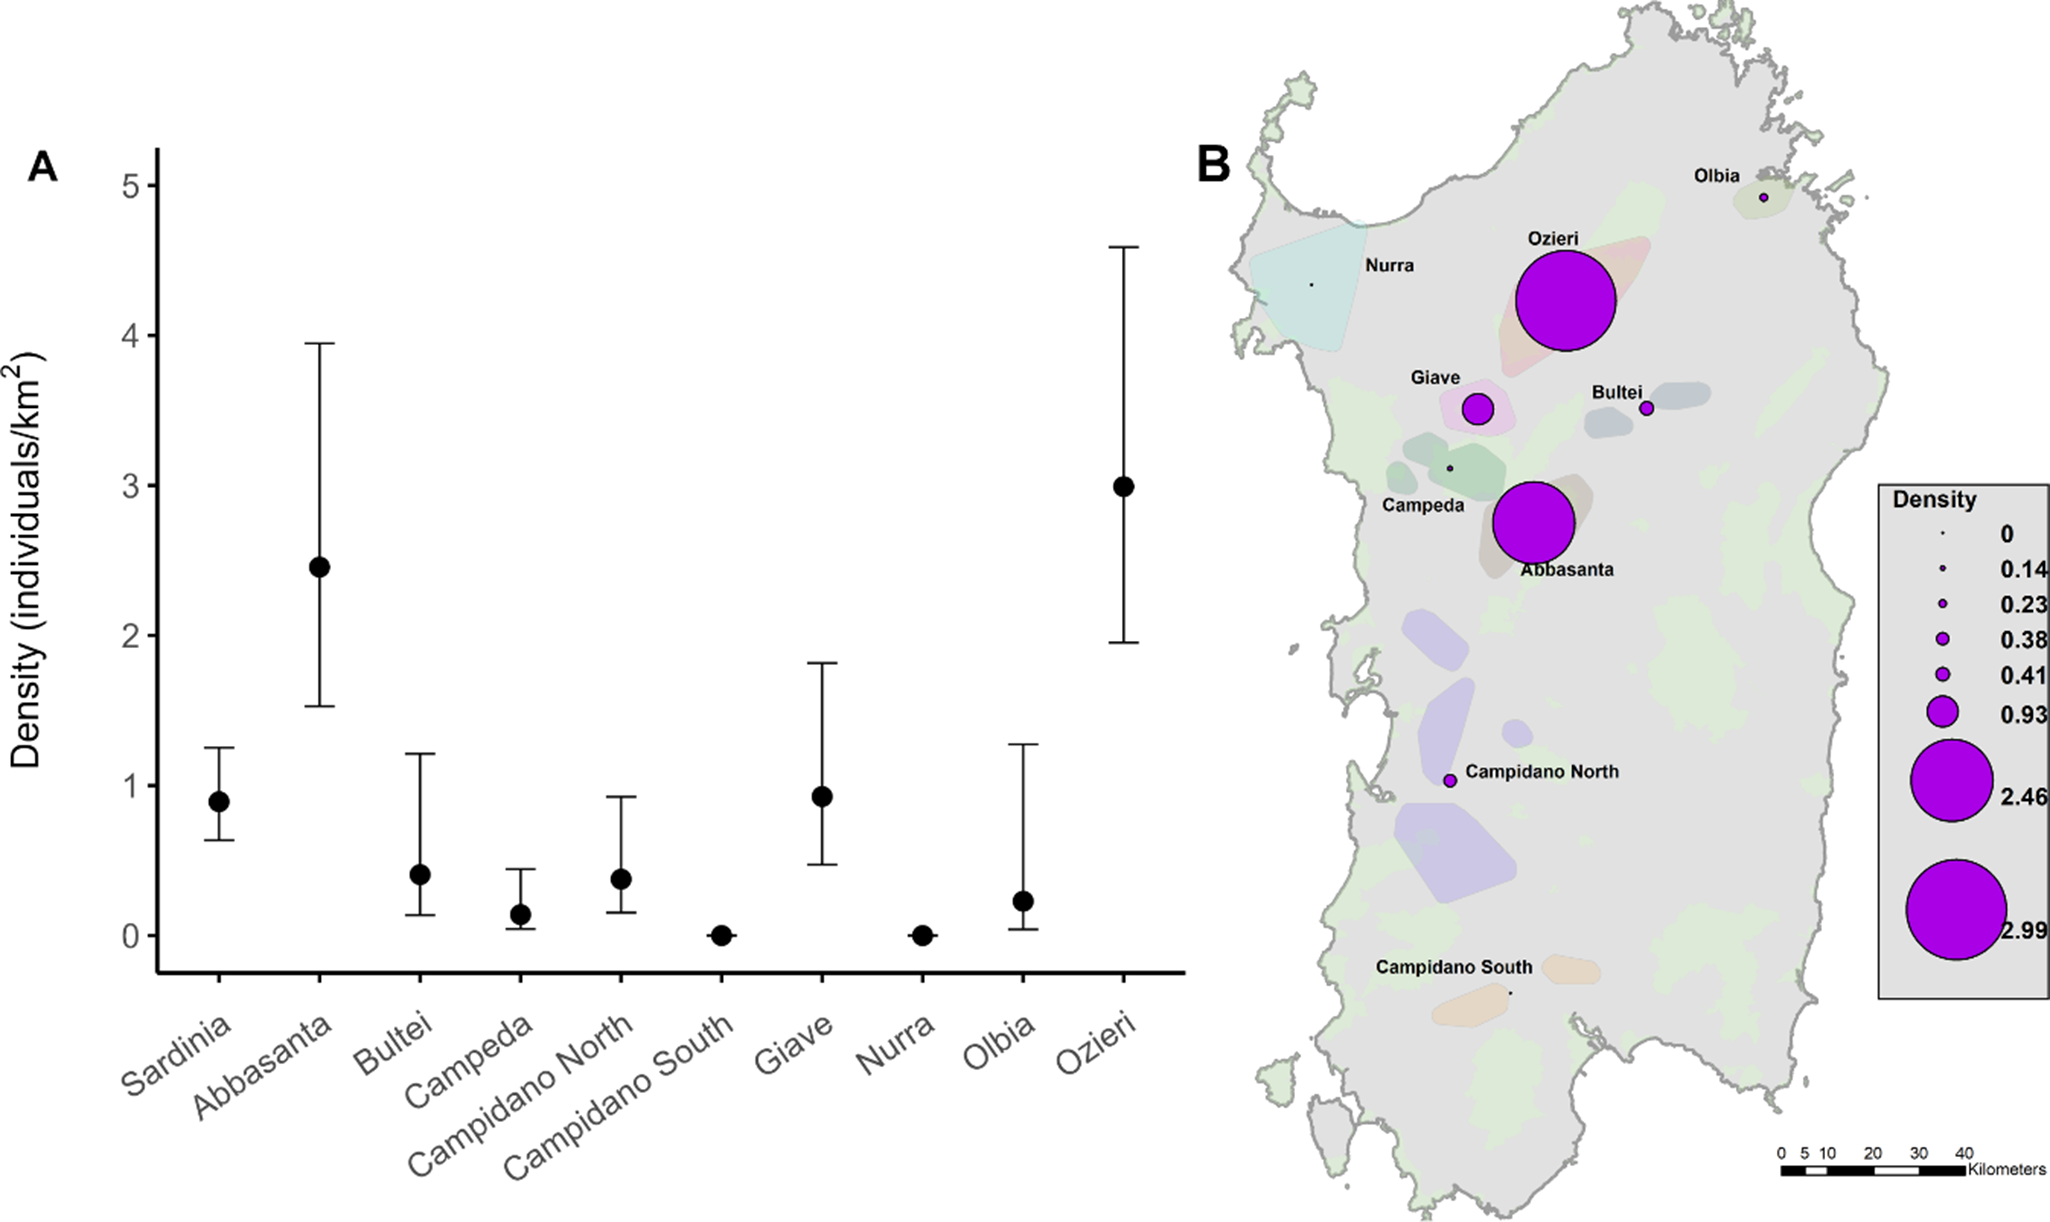
A total of 182 singing males was detected during the survey in 2023. All detections were estimated to be within ~450 m from the point after right-truncating 5% the data. Among the 11 models tested, the best fit was given by the hazard rate detection function including land use as a covariate. The Cramér–von Mises goodness-of-fit statistic was P = 0.734. The density of Little Bustards (individuals/km2) across the whole study region was 0. 89 individuals/km2 (95% CI = 0.64–1.25), with large variation between the nine subpopulations (Figure 2). Abbasanta and Ozieri subpopulations held the highest densities overall, supporting 78% of the entire population (in terms of number of males) in Sardinia. Conversely, no males were detected in Campidano South and Nurra during the surveys part of this work in 2023.
Density estimates (A) mean individuals/km2 with 95% CI across suitable habitats, including fallow, hay meadows, arable, and mixed land use) of Little Bustard males across the whole of Sardinia and in each of the nine monitored subpopulations. (B) Spatial variation in average density at the level of each population in Sardinia.

Effect of habitat, protection, and land-use change on occurrence
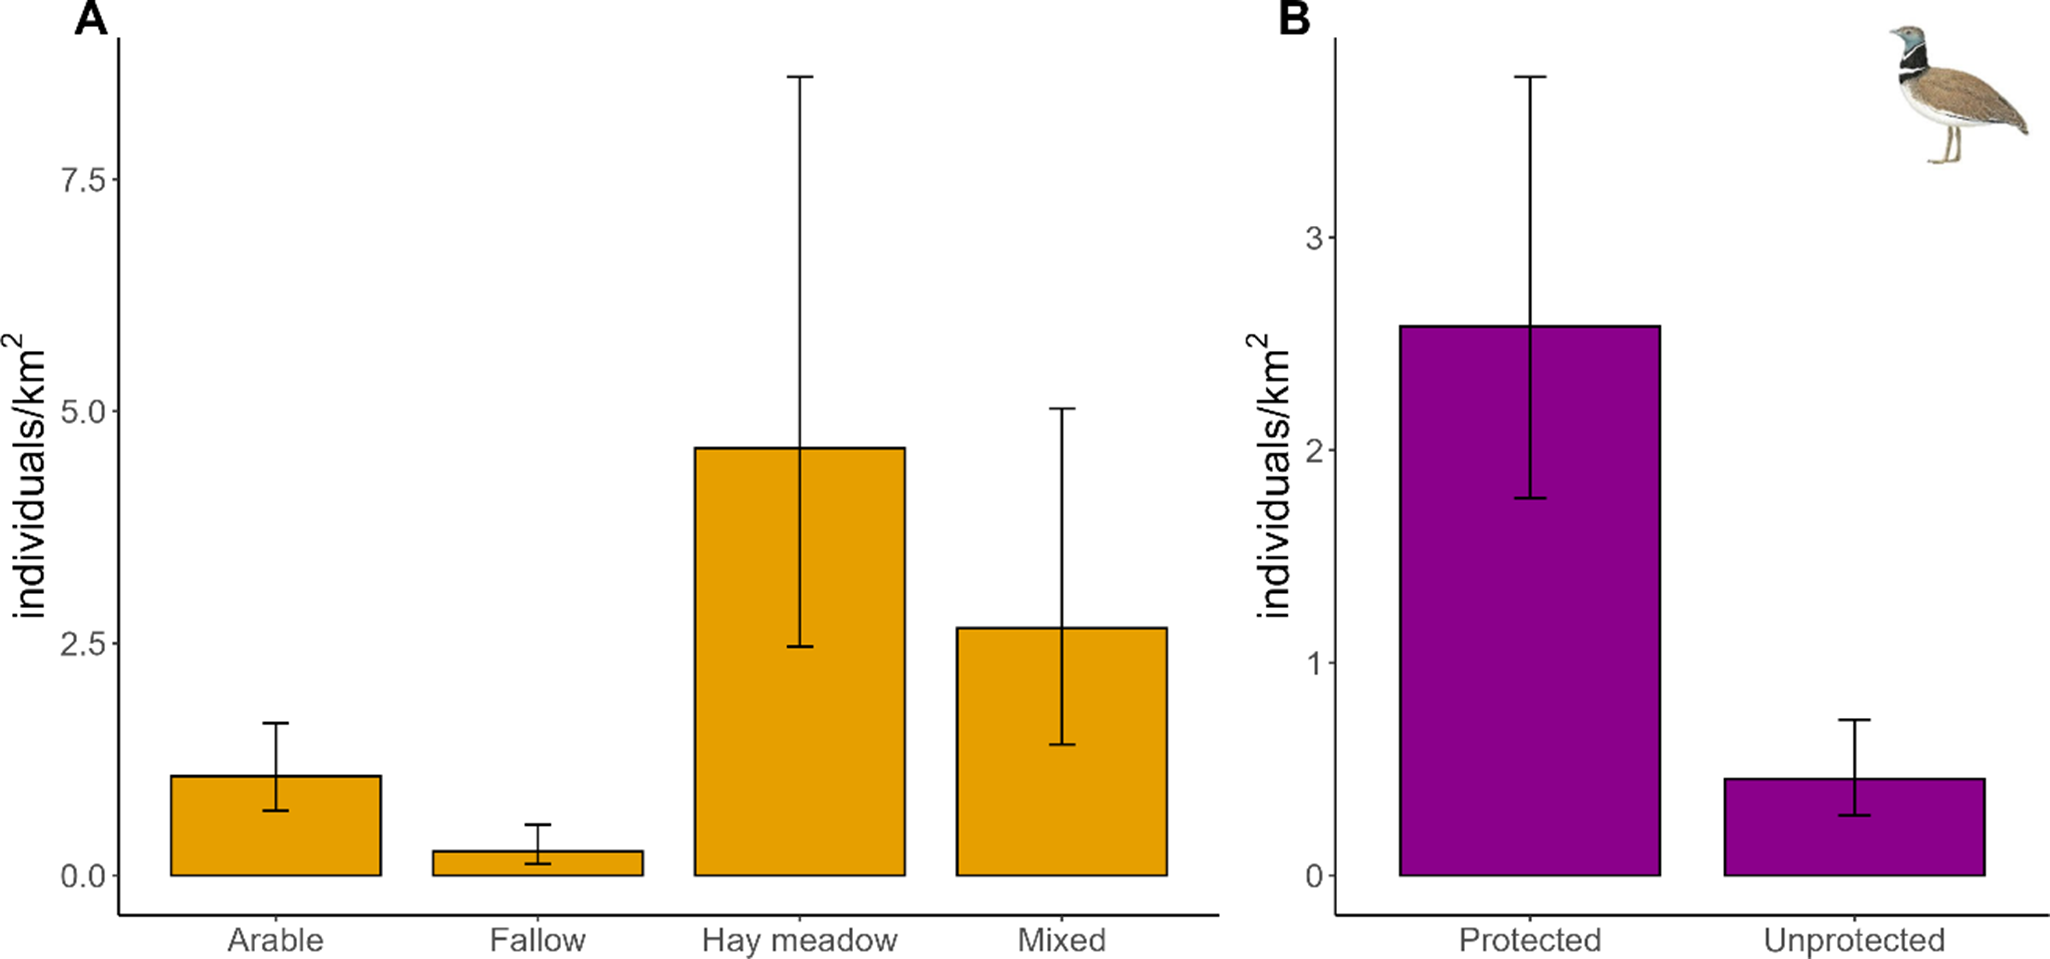
Little Bustards, across the whole region of Sardinia, predominantly occur in hay meadows and mixed land uses (density of males/km2: mean and 95% CI 4.60, 2.46–8.60, and 2.66, 1.41–5.03, respectively, whereas arable and fallow support lower densities (1.07, 0.70–1.64, and 0.26, 0.12–0.55, respectively) (Figure 3). Protected areas hold 85% of the total population of Little Bustard in Sardinia, with densities of 2.58 males/km2, 1.77–3.75 inside protected areas, and 0.45 males/km2, 0.28–0.73 in unprotected land.
Density estimates (mean individuals/km2 with 95% CI) of Little Bustard across four different land-use categories (A) and in protected vs unprotected land (B).

Current Little Bustard densities at the point level showed no significant association with recent changes in land use. Variations in land-use types, such as increases or decreases in the different land-use classes over the 13-year period considered, were not significantly linked to current Little Bustard densities (Table S2). We found no relationship between current soil degradation and current density of Little Bustard at the regional level (Table S2).
Discussion
Our findings indicate that the Little Bustard population in Sardinia remains at relatively low densities overall, with most extant individuals concentrated in two central-western subpopulations. The highest densities occur in hay meadows (often grazed by sheep after hay cutting), heterogeneous mixed-use landscapes, and within protected areas. Moreover, recent land-use changes and on-going soil degradation do not appear to be linked to the species’ current density.
The current densities of Little Bustard in Sardinia indicate that the species remains relatively scarce and localised on the island, with most individuals concentrated in just two subpopulations. The island-wide density of 0.89 males/km² is at the lower end of densities reported from other western populations in the Iberian Peninsula and France (Mañosa et al. Reference Mañosa, Bota, Villers, Bretagnolle, Morales, Bretagnolle, Traba, Morales and Bustard2021). Density varies widely among Sardinian subpopulations, ranging from very low (0.13 in Campeda) to relatively high (2.99 in Ozieri), a pattern consistent with other western European populations (Mañosa et al. Reference Mañosa, Bota, Villers, Bretagnolle, Morales, Bretagnolle, Traba, Morales and Bustard2021). We confirm the near extinction of the species in two historically occupied areas, i.e. Nurra in the north and Southern Campidano in the south, where no individuals were recorded in previous surveys (Nissardi and Zucca Reference Nissardi, Zucca, Tinarelli, Andreotti, Baccetti, Melega, Roscelli and Serra2014). However, a few males in Nurra have been reported in 2025, suggesting that the population, albeit very low, it is still not completely extinct. These near extinctions were likely driven by agricultural intensification and increasing anthropogenic pressures, which are also threatening the small populations of Campidano North and Olbia. Historical and comparable density estimates, using distance sampling, exist only for 2008 in three areas (Campeda, Abbasanta, and Campidano North; Santangeli and Dolman Reference Santangeli and Dolman2011). Comparisons suggest relative stability at low densities in Campidano North and Campeda, while Abbasanta has declined, with 2023 densities (2.46 males/km²) nearly 20% lower than in 2008 (3.02), though slightly higher than in 2022 (2.01), when a 30% decline was recorded (Santangeli et al. Reference Santangeli, Cardillo, Pes and Aresu2023a). Such annual fluctuations, also observed in France (Bretagnolle et al. Reference Bretagnolle, Denonfoux and Villers2018; Morales et al. Reference Morales, García and Arroyo2005), underscore the importance of caution when interpreting single-year estimates.
The highest densities of Little Bustards in Sardinia occur in hay meadows (which are also grazed) and heterogeneous mixed-use landscapes, consistent with previous findings (Santangeli and Dolman Reference Santangeli and Dolman2011). Hay meadows, cut two or three times in spring and grazed in between, remain open with low vegetation – an essential feature for displaying males to enhance visibility (Santangeli and Dolman Reference Santangeli and Dolman2011). We note however that hay meadows may also represent sink habitats for breeding females, whose breeding success may be compromised by mechanised hay meadow cutting in spring (Bretagnolle et al. Reference Bretagnolle, Denonfoux and Villers2018). This threat may be elevated in the near future if farmers decide to cut the hay multiple times during the spring and early summer. High densities in heterogeneous landscapes reflect the species’ need for both open areas for display and nearby shelter for males and breeding females (Martínez Reference Martínez1994; Morales et al. Reference Morales, Traba, Carriles, Delgado and García de la Morena2008; Wolff et al. Reference Wolff, Dieuleveut, Martin and Bretagnolle2002). Conversely, the low density of males in fallow land likely results from its low abundance in the study areas considered. When present, fallow fields can often be overgrazed by sheep and cattle, reducing food availability and shelter due to the loss of herbaceous vegetation (Faria et al. Reference Faria, Morales and Rabaça2012; Traba et al. Reference Traba, Morales, García de la Morena, Delgado and Krištín2008). The low densities of Little Bustard in arable land likely stem from the scarcity of this land use in key subpopulations such as Ozieri, Giave, and Abbasanta. Overall, the Little Bustard in Sardinia remains highly dependent on traditional agropastoral landscapes, which have persisted in an extensive form over recent decades. In contrast, the loss of such landscapes in mainland Italy has led to the species’ extinction there (Lardelli et al. Reference Lardelli, Bogliani, Brichetti, Caprio, Celada and Conca2022).
We found no relationship between current Little Bustard densities and recent land-use changes or current soil degradation. This may be due to the absence of significant land-use changes in the region or the species’ prior disappearance from areas that had already undergone transformation. In fact, local knowledge suggests that just before or during the 1980s in Sardinia there were vast campaigns to remove rocks and boulders from the landscape using machinery, making space for agriculture and hayfield cultivation. This land transformation was anecdotally linked to the decline of the Little Bustard across large areas of Sardinia (Schenk and Aresu Reference Schenk and Aresu1985). This suggests that Sardinia’s current strongholds for the species may not be under immediate threat from agricultural intensification, a major driver of farmland biodiversity loss across Western Europe (Donald et al. Reference Donald, Green and Heath2001). However, new pressures on Little Bustard habitats in Sardinia may arise from the expansion of renewable energy infrastructure, including solar PV and onshore wind farms (Cerri et al. Reference Cerri, Costantino, De Rosa, Banič, Urgeghe and Fozzi2024; Santangeli et al. Reference Santangeli, Cardillo, Pes and Aresu2023a), as well as mining (Tang and Werner Reference Tang and Werner2023). These threats could be exacerbated by global instability, such as wars and rising foreign taxes on raw materials, which may push European countries to accelerate domestic resource and energy production (Morales et al. Reference Morales, Diaz, Giralt, Sarda-Palomera, Traba and Mougeot2022; Saussay Reference Saussay2024). Beyond habitat loss, these developments could also increase mortality risks due to the expansion of the electricity grid, a well-documented threat to bustard species (Silva et al. Reference Silva, Marques, Bernardino, Allinson, Andryushchenko and Dutta2023).
The disproportionately high density of Little Bustards within protected areas in Sardinia – over five times higher than in unprotected areas – may seem to be encouraging for the species’ future. This pattern, previously documented in two subpopulations (Abbasanta and Campeda; Santangeli et al. Reference Santangeli, Cardillo, Pes and Aresu2023a), is now confirmed across the entire island. However, the mere designation of protected areas, often termed “paper parks”, is rarely sufficient for biodiversity conservation (González del Portillo et al. Reference Gonzalez del Portillo, Morales and Arroyo2024; Santangeli et al. Reference Santangeli, Weigel, Antão, Kaarlejarvi, Hällfors and Lehikoinen2023b), as a participatory approach involving local communities and effective management is crucial (Geldmann et al. Reference Geldmann, Barnes, Coad, Craigie, Hockings and Burgess2013, Reference Geldmann, Coad, Barnes, Craigie, Woodley and Balmford2018).
In Sardinia, two protected areas, Ozieri and Abbasanta, serve as key strongholds for the Little Bustard. Maintaining habitat quality through the preservation of extensive agropastoral practices is essential, alongside preventing infrastructure developments linked to renewable energy expansion. This poses a significant challenge, exemplified by the recent downsizing of parts of the Abbasanta protected area to accommodate solar PV plants (Santangeli et al. Reference Santangeli, Cardillo, Pes and Aresu2023a), and the increasing sprawl of agri-voltaic projects (Dupraz et al. Reference Dupraz, Marrou, Talbot, Dufour, Nogier and Ferard2011). The expansion of renewable energy infrastructure within protected areas is a growing global concern (Rehbein et al. Reference Rehbein, Watson, Lane, Sonter, Venter and Atkinson2020). In particular, agri-voltaic systems, currently permitted within protected areas under the guise of sustainable agricultural development, at least in Italy, require urgent impact assessments. Similarly, the effects on Little Bustard populations of wind energy infrastructure and mining must be thoroughly investigated before further habitat loss occurs. On the positive side, a proposal for designating two new areas, in Giave (size: 3,420 ha) and Bultei (1,610 ha) as Important Bird and Biodiversity Areas (IBAs) is underway. If this proposal materialises, these two IBAs may then be upgraded to SPAs with legal protection, therefore hindering habitat loss from energy and mining projects. This would benefit two important subpopulations and enhance the long-term prospects for the entire metapopulation of the species on the island.
Sardinia holds the last Italian stronghold of the Little Bustard, and the only island population of this species worldwide. Its persistence depends on urgent conservation efforts, including sustainable land-use planning through participation with local stakeholders, careful energy infrastructure siting, and reducing any potential risks from powerline mortality. Maintaining traditional agropastoral landscapes is crucial, alongside expanding and effectively managing protected areas to counter growing threats from renewable energy and mining.
The Little Bustard in Sardinia, as most other steppe birds across Europe, faces mounting sustainability challenges, demanding evidence-based interventions that integrate conservation with agricultural policies. Leveraging the CAP to promote habitat-friendly practices and ensure adequate financial incentives for farmers is crucial. Future conservation efforts must align with global biodiversity frameworks (Pérez-Granados et al. Reference Pérez-Granados, Benítez-López, Díaz, Gameiro, Lenzner and Roura-Pascual2025), translating commitments into tangible actions that reconcile agricultural sustainability with the preservation of steppe ecosystems and their emblematic species.
Supplementary material
The supplementary material for this article can be found at http://doi.org/10.1017/S095927092510035X.
Acknowledgements
The present research was carried out within the framework of the activities of the Spanish Government through the “Maria de Maeztu Centre of Excellence” accreditation to IMEDEA (CSIC-UIB) (CEX2021-001198). A.S. was supported by a “Ramón y Cajal” fellowship (RYC2022-036239-I) and a “Vicenç Mut” fellowship (PD004/2022). We also thank LIPU UK for financial support for the field monitoring. Anecdotal presence data for the discussion on the Nurra population were kindly provided by M. Sanna. Finally, we thank M. Morales and two anonymous reviewers for their insightful input during the revision of the manuscript. Code availability: all codes used here for the analysis and production of the figures are openly available in the Figshare repository: https://figshare.com/s/a722e76ab205bc739b2a


 Open access