


Introduction
Radiation fluxes generally prevail in the energy balance of glacier and snow surfaces. Shortwave radiation is often the dominant incoming flux, but sky longwave radiation can contribute similar or higher amounts of energy during cloudy periods because of increased atmospheric emissivity (e.g. Reference MullerMuller, 1985;Reference Granger and GrayGranger and Gray, 1990). When the albedo of snow is high, surface net radiation and melt energy can be higher under overcast skies than under clear skies (e.g. Reference Bintanja and van den BroekeBintanja and Van den Broeke, 1996). In mountainous regions, longwave radiation fluxes have received less attention than shortwave radiation, in part because of the scarcity and poor reliability of measurements. The comprehensive study by Reference Marty, Philipona, Frohlich and OhmuraMarty and others (2002) used a network of precise measurements in the Swiss Alps to investigate variation in longwave radiation with elevation and cloud cover. Recently, the longwave radiation balance of Earth surfaces has received much attention because of concerns over global warming (e.g. Reference Philipona, Behrens and RuckstuhlPhilipona and others, 2009). Considering that emission in longwave radiation is a passive flux, apart from the other energy fluxes, Reference OhmuraOhmura (2001) argued that the high efficiency of degree-day models in reproducing glacier melt results from sky longwave radiation, which is the largest heat source of melt in most climates. Reference Sicart, Hock and SixSicart and others (2008) applied this hypothesis to flux measurements on three glaciers in the tropical Andes, in the French Alps and in northern Sweden, and emphasized that degree-day models rely more on energy flux variability and covariance with temperature than on flux magnitude (as suggested by Reference BraithwaiteBraithwaite, 1981).
This study examines the sky longwave radiation at the surface of Glaciar Zongo, Cordillera Real, Bolivia (16°150 S, 5060ma.s.l.) during a complete hydrological year, 1999/ 2000. Reference Sicart, Wagnon and RibsteinSicart and others (2005) showed that high-altitude glaciers of the outer tropics are characterized by a marked seasonality of longwave radiation, participating in the seasonal variations of glacier melt. In the Andean Altiplano (˜4000ma.s.l.) at the foot of the Cordillera Real, the longwave radiation fluxes control radiative frost, which frequently causes losses in crop production during the austral winter (Reference Lhomme, Vacher and RocheteauLhomme and others, 2007).
The sky longwave radiation depends on the temperature and humidity of the atmosphere and on the cloud cover. Cloud emission is often calculated from observations of cloud cover, type and altitude. However, this information is rarely available in remote locations and is subject to errors. Reference Sicart, Pomeroy, Essery and BewleySicart and others (2006) in the mountains of northern Canada, and Reference Sedlar and HockSedlar and Hock (2009) on a glacier in northern Sweden, showed that a rough estimate of atmospheric solar transmissivity from measurements of global radiation can be used as a reliable index of cloud cover to parameterize cloud emissivity. In a similar but more complex approach in tropical mountains of East Africa, Reference Molg, Cullen and KaserMolg and others (2009) derived a cloud index by fitting a model of direct and diffuse solar irradiances to measurements on Kibo glacier at 5873 m a.s.l.
The objectives of our study are (1) to outline the characteristics of sky longwave radiation in high tropical mountains, (2) to compare clear- and cloudy-sky emissivity and identify their atmospheric controls, and (3) to derive a simple parameterization of the atmospheric emissivity suitable for glacier melt studies. Input data are from standard automatic meteorological stations. The calculations were performed at hourly and daily time-steps. Finally, an independent test of the parameterization of allsky longwave radiation was conducted at Glaciar Antizana, Ecuador (0°28’ S).
Location, Measurements and Climate
Glaciar Zongo is situated in the Huayna Potosi massif (16°150 S, 68°10’ W), Cordillera Real, Bolivia, on the western margin of the Amazon basin and the eastern margin of the Altiplano catchment. This valley-type glacier is 3 km long, has a surface area of 2.4 km2 and ranges from 6000 to 4900ma.s.l. Huayna Potosi is in the outer tropics, characterized by pronounced seasonality of precipitation and cloud cover, with a wet season in austral summer (September–April) and a dry season in winter (May-August) (e.g. Reference Garreaud, Vuille and ClementGarreaud and others, 2003). The hydrological year is counted from the end of the dry season, 1 September.
A Campbell automatic weather station operated at 5060m a.s.l. in the ablation area of the glacier during the hydrological year 1999/2000, recording air temperature and relative humidity (Vaisala HMP45C) and incoming short- and longwave radiation (Kipp & Zonen CM3 pyranometer and CG3 pyrgeometer) at 1 m above the surface. Half-hourly means derived from 20 s measurements were stored. Little terrain obstructs the sky at the weather station (the sky view factor is 0.94), hence longwave radiation emitted from surrounding terrain is negligible. The accuracy of unattended pyrgeometer measurements in mountain environments is typically ±10% (Reference Halldin and LindrothHalldin and Lindroth, 1992; Philipona and others, 2004). The main source of error is interference from solar radiation, leading to an overestimation of the longwave signal. This error is small (˜ 2%) on Glaciar Zongo, and no correction was applied (Reference Sicart, Wagnon and RibsteinSicart and others, 2005). Temperature and humidity measurements outside the thermal influence of the glacier were recorded by a weather station located at 4750ma.s.l., 150 m below and 1 km from the glacier terminus.
Figure 1 shows changes in air humidity and temperature and in short- and longwave irradiances during the hydrological year 1999/2000. The annual cycle of humidity reflects the alternation of the wet and dry seasons. In contrast, the thermal seasonality is low, <8°C for daily averages. The solar irradiance also exhibits small seasonal variations, as is typical for low latitudes. At the glacier surface, solar irradiance varies significantly over the short term due to clouds that reduce the extraterrestrial solar flux, mostly in the wet season when the extraterrestrial flux is maximal (austral summer). In the wet season, the longwave irradiance is high because of the wet and warm atmosphere and frequent clouds. In the dry season, the lowest values of longwave irradiance reflect the dependence of clear-sky emissivity on temperature and humidity. Since clear-sky emissivity is low at high altitude, variations in longwave irradiance can be considerable when clouds occur in the dry season;changes can exceed 100 Wm-2 from one day to the next.
Daily air relative humidity, RH, and temperature, T, recorded outside Glaciar Zongo at 4750ma.s.l., and incoming shortwave (S#) and longwave (L↓) radiation recorded on the glacier at 5060ma.s.l. from September 1999 to August 2000. The dashed curve shows the theoretical extraterrestrial solar irradiance, S extra. The gray curve shows the clear-sky longwave irradiance derived from Equations (1) and (2) with C = 1.24.

Parameterization and Data Analysis
As the majority of the longwave radiation received at the surface originates from the low atmosphere, the sky longwave irradiance in an open environment, L↓ (Wm 2), can be written as

where “εclear is the apparent clear-sky emissivity depending on the air temperature, T(K), and vapor pressure, e (hPa), of the air near the ground, a = 5.67x 10⁻⁸Wm-2K-4 is the Stefan-Boltzmann constant and F> 1 is the cloud emission factor describing the increase in sky emissivity due to cloud emissions.
Numerous parameterizations of clear-sky emissivity have been proposed as functions of air temperature, vapor pressure or both (see review by Reference BrutsaertBrutsaert, 1982). The parameterizations are often equivalent because of the good correlation between temperature and humidity. On glaciers, calculations of “εclear must account for the specific conditions of thermal inversion and cold temperatures (e.g. Reference Aase and IdsoAase and Idso, 1978;Reference Yamanouchi and KawaguchiYamanouchi and Kawaguchi, 1984). In tropical high mountains the parameterization must also account for the thin atmosphere at very high elevations. By integrating water-vapor emissivity in a mid-latitude standard atmosphere, Reference BrutsaertBrutsaert (1975) derived a parameterization that has been applied to various climates:

with C = 1.24 and m = 7. The parameter m comes from integrating the level of the emission of a slab of water vapor with CO2 in the atmosphere. The parameter C represents the relationship between vapor pressure and temperature near the ground and their profiles in the atmosphere, and should be adapted to the local climate.
The cloud emission factor, F, in Equation (1) can be derived from the measurements, as

Reference Lhomme, Vacher and RocheteauLhomme and others (2007) and Reference Molg, Cullen and KaserMolg and others (2009) derived a cloud-cover index from calculations of the atmospheric attenuation for solar radiation, similar to Beer’s law formulations, that they fitted to measurements of global radiation, accounting for the top-of-atmosphere solar radiation, altitude, solar angle and different sky transmissivity parameters. These calculations are relevant for short (e.g. hourly) time-steps, whereas changes in the relative positions of the clouds and sun introduce noise into any relationship between cloud emissivity in longwave radiation and solar radiation attenuation by clouds. These parameterizations also require the calibration of different turbidity or transmissivity coefficients. Here we used a bulk atmospheric transmissivity for solar radiation, τatm, as an index of cloud cover summed over the sunshine hours:

where S extra is the theoretical shortwave irradiance at the top of the atmosphere.
We tested the parameterization of Reference BrutsaertBrutsaert (1975) on Glaciar Zongo for clear-sky emissivity at the hourly and daily timescales. The relationships between F derived from Equation (3) and different meteorological variables (T RH and τ atm) were then explored to build a parameterization of all-sky longwave irradiance in tropical mountains. Partial linear correlations of L↓ with each term of Equation (1) written as a sum of logarithms were calculated to determine the atmospheric variables that drive the variations of longwave radiation.
Results and Discussion
Clear sky
Clear-sky longwave emissivity was first examined at hourly time-steps during daytime (the day length ranges from 11 to 13 hours throughout the year). Figure 2a shows that Equation (2) overestimates the sky emissivity derived from measurements of L↓ and T during a 6day period of clear sky in the dry season. Fitting C to the measurements (assuming m = 7) gives C˜ 1.15, i.e. somewhat less than the standard value. The atmospheric profiles of temperature and humidity may differ from dry to wet seasons, implying that parameter C would have different effective values (e.g. Reference Culf and GashCulf and Gash, 1993;Reference Crawford and DuchonCrawford and Duchon, 1999). However, on Glaciar Zongo clear-sky periods are rare in the wet season. Clear-sky emissivity calculations were also compared with the observations during the sunniest two days of the wet season, 12 and 19 November 1999 (Fig. 3). On these days, convective clouds reached the glacier in the late afternoon, causing a large increase in longwave irradiance. During the clear-sky hours, the fluctuations of sky emissivity were well simulated by Equation (2), but again the standard value of C seems too high. This discrepancy was certainly not due to measurement errors since solar radiation interference causes an overestimation of the longwave irradiance (since calculated clear-sky emissivity is higher than the measurements that are potentially biased towards too-high values, the error in the calculations may be underestimated in Figs 2 and 3). At the daily timescale, Figures 1 and 2b show that Brutsaert’s standard equation agrees well with the observed minima of L corresponding to clear-sky emissions, with e clear varying between 0.55 and 0.65 over the year.
Atmospheric emissivity (L↓/σ T 4) versus the ratio of vapor pressure, e, to air temperature, T. Dots show measurements. Curves show Equation (2) with C = 1.24 and 1.15. (a) Hourly daytime values in clear sky, 20–25 May 2000. (b) Daily values during the entire hydrological year 1999/2000.

Measured and modeled hourly nd measured global radiation S# on 12 and 19 November 1999. L# was calculated with C= 1.15 and 1.24 (Equation (2)).

The standard Brutsaert equation with C = 1.24 seems to overestimate the hourly clear-sky emissions during daytime, but correctly reproduces the daily averages. Nocturnal thermal inversion, related to low temperatures at low heights, may increase the effective value of C, implying higher C values for daily (24 hour) averages than for hourly values only during daytime (e.g. Reference PaltridgePaltridge, 1970). Reference Greuell, Knap and SmeetsGreuell and others (1997) reported increasing C values with depth of thermal inversion above glaciers. Reference Lhomme, Vacher and RocheteauLhomme and others (2007) fitted the value C = 1.18 to hourly L↓ measurements during daytime on the Bolivian Altiplano. Radiosonde profiles at El Alto airport (4060 m a.s.l.) indicated that the high elevation of the site causes high attenuation coefficients of the exponential decrease with height of the atmospheric temperature and humidity variables, leading to small values of C. Changes in temperature and humidity atmospheric profiles certainly are the main causes of changes in effective C values with elevation (C lower at high altitudes) and with the daily cycle (C higher during night-time). However, the derivation of Equation (1) shows that a variation of ΔC = 0.1 leads to ΔL|˜20Wm-2, i.e. ˜10% of clear-sky longwave irradiance on Glaciar Zongo, which remains L asmall compared to the uncertainty of the radiation measurement. In an alternative application of Brutsaert’s equation, Reference Marks and DozierMarks and Dozier (1979) accounted for elevation changes in a large mountain basin by adjusting the humidity and temperature input data, assuming a standard temperature lapse rate and constant relative humidity. We tested other parameter- izations, such as the modification of Brutsaert’s equation by Reference Konzelmann, van de Wal, Greuell, Bintanja, Henneken and Abe-OuchiKonzelmann and others (1994) to better account for the emissivity of greenhouse gases other than water vapor, and the calculations of Reference SatterlundSatterlund (1979) adjusted to cold temperatures. However, the agreement with the observations was not significantly improved.
Cloudy sky
Figure 4 shows the enhancement in sky emissivity by clouds, derived from Equation (3). On 10 days over the study year, F was slightly less than 1, indicating no cloud enhancement of the sky emission, probably due to radiation measurement errors or errors in the estimation of clear-sky emissivity from Equation (2). Clouds increased the sky longwave radiation by ˜20% on average; the increase exceeded 30% for one- third of the year, with a maximum increase of 55%, similar to the values of 45-65% reported by Reference Molg, Cullen and KaserMolg and others (2009) in the high tropical mountains of Africa and Peru, whereas this enhancement generally remains <30-40% at midlatitudes (e.g. Reference Kimball, Idso and AaseKimball and others, 1982). The large increase in L↓ by cloud emissions, also apparent in Figures 2b and 3, results from the dry and thin atmosphere overlaying the high-altitude tropical mountains. Reference Sicart, Wagnon and RibsteinSicart and others (2005) showed that changes in atmospheric cloud cover have greater effects on the incoming longwave radiation of tropical glaciers than on mid-latitude glaciers.
Histograms of (a) cloud emission factor, F, derived from Equation (3) and (b) atmospheric solar transmissivity derived from Equation (4). Daily values during the hydrological year 1999/2000.

The atmospheric transmissivity for shortwave radiation observed on the glacier showed two frequency peaks at r atm˜ 0.4 and 0.8, corresponding to the wet and dry seasons, respectively (Fig. 4b). High altitude caused high clear-sky shortwave transmissivity;ratm reached values close to 0.9. Figure 5 shows that high cloud emission factors were associated with low r atm, but the data scatter in the relationship is quite large. A linear fit to F is (r2 = 0.53; Fig. 5)

Cloud emission factor (F), versus atmospheric solar transmissivity (τ atm) daily values during the hydrological year 1999/2000. The linear regression line (Equation (5)) is indicated.

Thus, the simulated cloud enhancement of sky emissivity reaches 50% (F = 1.5) for r atm = 0.20, indicative of overcast sky, and linearly reduces to 0 (F = 1) for r atm = 0.80, indicative of clear sky.
Air temperature varies little and humidity is high during cloudy periods. Linear correlations of the cloud emission factor, F (derived from Equation (3)), with the relative humidity, RH, and with the variance in temperature,σ2T, were explored at the daily timescale. In 1999/2000, relative humidity was the variable best correlated to F (r2 = 0.78), whereas the variance in temperature was poorly correlated to F (r2 = 0.35). However, as F depends on e, the good correlation between e and RH (r2 = 0.90) artificially increased the correlation between RH and F by ‘spurious selfcorrelations’ (Reference KenneyKenney, 1982). Multiple regressions of F with r atm and did not give better results than the linear fit represented by Equation (5). Thus, the parameterization of all-sky longwave irradiance is

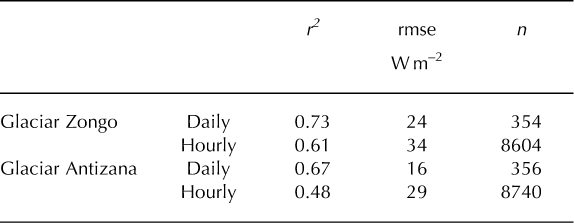
with τ atm as a fraction (Equation (4)) and C = 1.24 and 1.15 at the daily and hourly (during daytime) timescales, respectively. Figure 6 shows that Equation (6) is in fair agreement with observations on Glaciar Zongo, explaining ˜70% of the variance of the measurements with a root-mean-square error (rmse) <25 Wm-2 for daily estimates, i.e. close to the measurement uncertainty. As expected, the variability of hourly irradiances is less well simulated by Equation (6), but the rmse remains small (Table 1). High peaks of longwave irradiance due to thick clouds in the wet season are underestimated, whereas mean values are slightly over- estimated. Errors tend to cancel each other out and the cumulated error over the study period is small (<5%).
Comparison between longwave irradiance measurements and calculations from Equation (6) on Glaciar Zongo (September 1999 to August 2000) and on Glaciar Antizana (June 2005 to July 2006); r 2 is the coefficient of determination, rmse is the root-meansquare error and n is the number of samples
Difference between longwave irradiance measurements and calculations from Equation (6) versus the measurements. Daily values on Glaciar Zongo from September 1999 to August 2000.
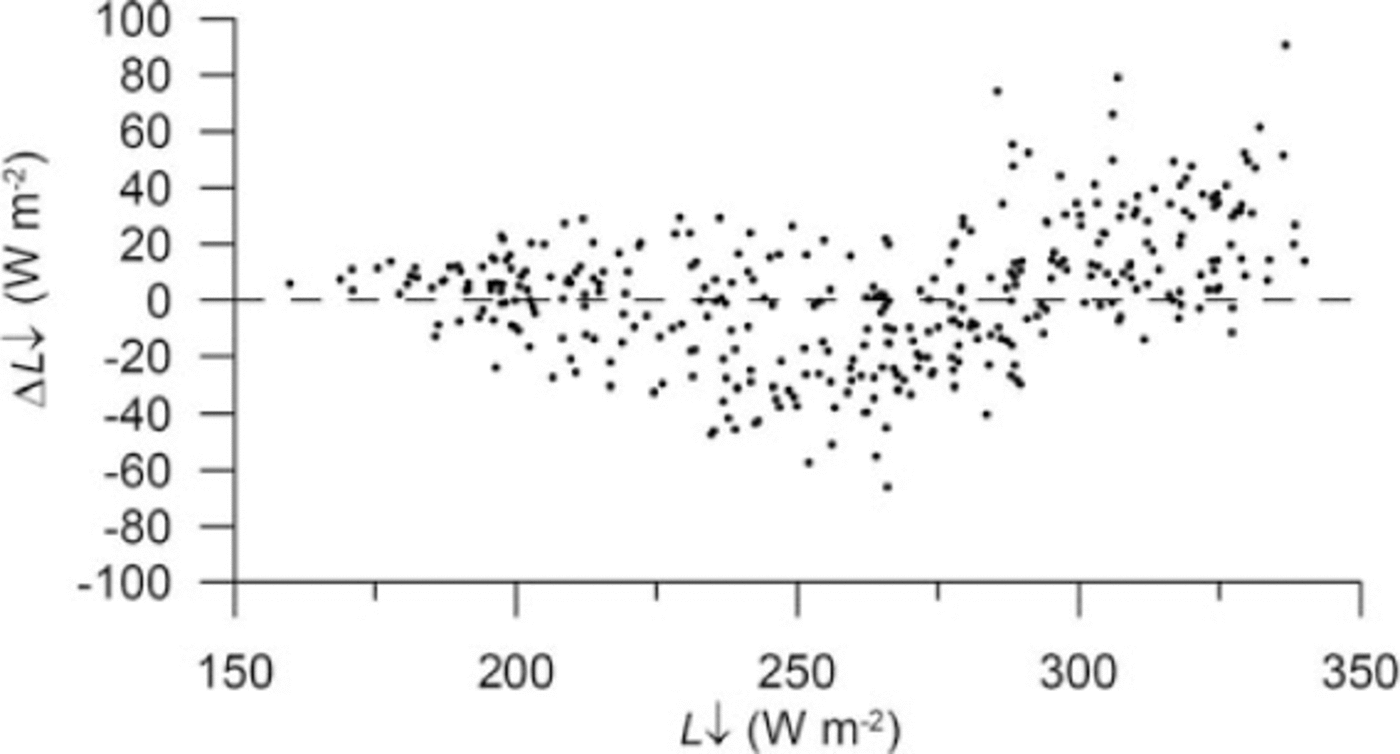
Over the year, the cloud emission factor derived from r atm dominated in the daily parameterization of L↓ : r2(ratm, L↓) = 0.56. In the dry season, clear-sky emission was very low and clouds caused a very large increase in L↓ (Fig. 1); longwave irradiance was well correlated with the cloud cover (r 2(r atm,L↓) = 0.78). In the wet season, longwave irradiance remained high, with reduced variability, and was not well correlated with the cloud cover, which also remained fairly constant and high (r 2(r atm,L↓) = 0.25). As a result, the calibration of the cloud emission factor was less efficient in the wet season and the error in longwave irradiance from Equation (6) is maximal from January to March, when longwave radiation fluxes are the greatest. Another source of error is that the calculation of F from Equation (5) does not account for nocturnal clouds. However, calculations of cloud emission during daytime only did not significantly reduce the deviation from the measurements, indicating that this error is small.
Equation (6) allows us to distinguish the atmospheric controls of the longwave radiation flux. On Glaciar Zongo, the main source of variations over the year of daily longwave radiation (coefficient of variation, c = 17%) was cloud emissions (c = 12%; partial correlation coefficient r p(L↓,F) = 0.69), whereas clear-sky emissivity and air temperature varied less and were poorly correlated with L↓ (c = 6% and 2%, respectively; r p(L↓, ε clear) = 0.33, r p(L↓, T) = 0.13).
Figure 7 and Table 1 show an independent test of Equation (6) using a year of data collected in the high mountains of the inner tropics of Ecuador (0°28’S, 4860 ma.s.l.), described in detail by Reference Wagnon, Lafaysse, Lejeune, Maisincho, Rojas and ChazarinWagnon and others (2009). Temperature, humidity and radiation were measured at ˜200 mfrom the snout of Glaciar Antizana using the same sensors as on Glaciar Zongo. The climate is more humid than in the outer tropics of Bolivia; longwave irradiance was high all year round, due to frequent clouds, without a pronounced seasonal cycle. At the daily timescale, high irradiances were slightly underestimated, but the calculations correctly reproduced the large enhancement of longwave radiation by cloud emissions. The variability of the hourly irradiances is significantly underestimated by the model because cloud emissions, whose diurnal variations are not well simulated, are greater than in Bolivia. However, the rms errors remain small for the daily and hourly estimates.
Daily longwave irradiance on Glaciar Antizana from June 2005 to July 2006. (a) Black curve shows measurements, red curve shows calculations from Equation (6) and gray curve shows clearsky irradiance derived from Equations (1) and (2). (b) Difference between measurements and calculations versus the measurements.

Conclusion
This study proposes a simple parameterization of sky longwave irradiance suitable for energy-balance and melt studies on tropical glaciers accounting for the characteristics of low latitudes (seasonality in terms of humidity variables rather than temperature) and of high altitudes (clouds strongly enhancing low emissivity of the thin and dry clear-sky atmosphere). Longwave irradiance at Glaciar Zongo could be simulated as a function of near-surface air temperature and humidity and of atmospheric transmissivity for solar radiation defined as the ratio of measured global radiation to the theoretical solar radiation at the top of the atmosphere, though the parameterization performed better for daily than hourly simulations. Clouds increased the longwave radiation by up to 55% and ˜20% on average;the variability of sky longwave radiation is controlled more by cloud emissions than by the temperature of the emitting low atmosphere. An independent test on Glaciar Antizana in the humid tropics of Ecuador indicated that the parameterization is suitable for a wide range of climate environments in the Central Andes.
Acknowledgements
The glaciological program is supported by the Institut de Recherche pour le Developpement (IRD). We are grateful for assistance received from Instituto de Hidraulica e Hidrología, Universidad Mayor de San Andres in La Paz, Bolivia. This work was sponsored by the French Observation de Recherche en Environnement network GLACIOCLIM and the Agence National de la Recherche (France) program TAG 05-JCJC-0135. We are grateful to two anonymous reviewers for making useful comments on the manuscript.



