


Structural imaging studies in bipolar disorder
Bipolar disorder is a highly heritable mood disorder with a global lifetime prevalence of approximately 1.0–2.4%, Reference Merikangas, Jin, He, Kessler, Lee and Sampson1 marked by pronounced transitions between manic and depressed mood states. The onset of bipolar disorder predominantly occurs in the late teens to mid-20s, Reference Bolton, Warner, Harriss, Geddes and Saunders2 a time when the brain is undergoing dynamic morphological changes. Reference Frangou, Modabbernia, Williams, Papachristou, Doucet and Agartz3,Reference Tamnes, Herting, Goddings, Meuwese, Blakemore and Dahl4 While numerous studies have examined structural imaging phenotypes in bipolar disorder, the majority have been cross-sectional and focused on participants aged 35 years and above, Reference Hanford, Nazarov, Hall and Sassi5,Reference Bora, Fornito, Yücel and Pantelis6 preventing the exploration of structural differences that relate to premorbid changes and illness onset. The largest longitudinal multisite study of established bipolar disorder to date, completed by the ENIGMA Consortium Reference Abe, Ching, Liberg, Lebedev, Agartz and Akudjedu7 using cortical parcellations and subcortical segmentation, identified accelerated ventricle enlargement and reduced cortical thinning of the fusiform and parahippocampal gyri in adults (age: M (mean) = 40, s.d. = 17 years) with bipolar disorder, relative to controls. Given the 60–90% heritability estimates for bipolar disorder Reference McGuffin, Rijsdijk, Andrew, Sham, Katz and Cardno8,Reference Lichtenstein, Yip, Bjork, Pawitan, Cannon and Sullivan9 and the dynamic nature of cortical development, Reference Bethlehem, Seidlitz, White, Vogel, Anderson and Adamson10 imaging studies in young first-degree relatives of bipolar disorder probands, who have elevated (5–10%) lifetime risk of developing bipolar disorder Reference Craddock and Sklar11 and other psychopathology, provide a unique opportunity to observe early brain morphology changes related to psychopathology risk, with minimal confounding effects of medication.
Structural imaging studies in ‘high-risk’ individuals
While more than 40 unique cross-sectional studies have examined brain imaging phenotypes among individuals with familial risk of bipolar disorder (i.e. ‘high-risk’ individuals), findings have been inconsistent. Variability in the location and direction of findings between studies may be partially attributed to age distribution differences, impacting the developmental time frame over which effect sizes and directions were reported. Variability in both sample size and ‘high-risk’ symptom presentation may also account for inconsistent findings. Further, cross-sectional studies are unable to examine developmental trajectories, limiting their capacity to provide insight into the structural imaging changes that are associated with illness onset.
To date, only seven longitudinal structural imaging studies of bipolar disorder ‘high-risk’ and control participants have been published. Reference Roberts, Lenroot, Overs, Fullerton, Leung and Ridgway12–Reference Sugranyes, de la Serna, Ilzarbe, Pariente, Borras and Romero18 Differential changes in the inferior frontal gyrus (IFG), over time, have been identified in two separate structural region-of-interest (ROI) studies. Reference Roberts, Lenroot, Overs, Fullerton, Leung and Ridgway12,Reference Papmeyer, Giles, Sussmann, Kielty, Stewart and Lawrie14 In the most recent of these publications, we examined cortical parcellations within a subset (controls n = 56, ‘high-risk’ n = 90) of the present sample. Reference Roberts, Lenroot, Overs, Fullerton, Leung and Ridgway12 Increased cortical thinning and volume reduction were observed in the ‘high-risk’ group, relative to controls, within five left prefrontal regions, including two subregions of the IFG. Reference Roberts, Lenroot, Overs, Fullerton, Leung and Ridgway12 Similarly, the Scottish Bipolar Family Study (controls n = 93, ‘high-risk’ n = 111; age M ≈ 21 years; inter-scan interval M ≈ 2.1 years) observed significant group differences over time in the left IFG parcellation. Reference Papmeyer, Giles, Sussmann, Kielty, Stewart and Lawrie14 Specifically, accelerated left IFG thinning was observed in the healthy ‘high-risk’ group (n = 92), relative to both control (n = 93) and symptomatic ‘high-risk’ groups (n = 19), providing converging support for IFG changes as a marker of bipolar disorder risk. Conversely, longitudinal analysis of a Spanish cohort (aged 6–17 years; three imaging time points with inter-scan interval M ≈ 2 years) revealed accelerated frontal lobe thinning in the symptomatic ‘high-risk’ group (n = 9), relative to controls (n = 49). Reference Sugranyes, de la Serna, Ilzarbe, Pariente, Borras and Romero18 However, the Spanish study focused on gross changes in each of the four cortical lobes, precluding comparisons with studies employing finer regional parcellations. All other longitudinal imaging findings within ‘high-risk’ populations have been observed in a single study and require replication. Additional longitudinal imaging studies, utilising a granular analytic approach, are required to establish a robust picture of cortical developmental trajectories in young ‘high-risk’ populations.
Aims
In the present study, we aimed to clarify differential cortical changes relating to family history of bipolar disorder, through the examination of vertex-level longitudinal whole-brain imaging data over a 2-year window, during a key period of brain development (adolescence and early adulthood). The vertex-wise whole-brain approach employed herein was intended to overcome a significant limitation of previous ROI studies whereby cortical changes that do not conform to preselected ROI boundaries may not be detected. To the best of our knowledge, this study represents the largest and most comprehensive longitudinal examination of high-resolution cortical changes related to familial risk of bipolar disorder to date.
Method
Participants
All participants were recruited through bipolar disorder research clinics, mental health organisations, families who had participated in other research, or responded to articles or advertisements in electronic and printed media, or public notice boards, as detailed elsewhere. Reference Nurnberger, McInnis, Reich, Kastelic, Wilcox and Glowinski19 Written informed consent was obtained from all participants aged 16 years and over, and for participants aged less than 16 years, written informed consent was obtained from a parent. The authors assert that all procedures contributing to this work comply with the ethical standards of the relevant national and institutional committees on human experimentation and with the Helsinki Declaration of 1975, as revised in 2013. All procedures were approved by The University of New South Wales Human Research Ethics Committee (HREC09/097, HC14128, HC191009).
Participants were aged between 12 and 30 years at baseline and comprised two groups (Fig. 1 and Table 1): (a) ‘high-risk’ participants (n = 105; female n = 64) who were the child or sibling of a proband diagnosed with bipolar-I, bipolar-II or schizoaffective disorder bipolar-type; and (b) control participants (n = 112, female n = 60) who had no first-degree relative with a history of bipolar-I, bipolar-II, schizoaffective disorder, schizophrenia, recurrent major depression, recurrent substance abuse, psychosis or psychiatric hospitalisation and no second-degree relative with a history of psychosis or psychiatric hospitalisation. Individuals with a lifetime or current diagnosis of bipolar-I, bipolar-II, schizoaffective disorder or schizophrenia at baseline were excluded from participation. Additional participant exclusion criteria are detailed in the Supplementary Material available at https://doi.org/10.1192/bjp.2025.10302. All participants were unrelated, as confirmed by genome-wide identity-by-descent analysis (see the Supplementary Material), and were of European (n = 164), mixed-European (n = 30) or East Asian (n = 23) ancestry, as determined by both self-report and genotype data (see the Supplementary Material).
Clinical and cognitive measures
On study entrance and annual follow-up, consensus DSM-IV diagnoses were established according to best-estimate methodology. Reference Leckman, Sholomskas, Thompson, Belanger and Weissman20 This was undertaken using the Kiddie-Schedule for Affective Disorders and Schizophrenia for School-Aged Children – Present and Lifetime Version Reference Kaufman, Birmaher, Brent, Rao, Flynn and Moreci21,Reference Nurnberger, McInnis, Reich, Kastelic, Wilcox and Glowinski22 or Diagnostic Interview for Genetic Studies, Reference Nurnberger, Blehar, Kaufmann, York-Cooler, Simpson and Harkavy-Friedman23 in conjunction with the Family Interview for Genetic Studies Reference Kaufman, Birmaher, Brent, Rao, Flynn and Moreci21,Reference Nurnberger, McInnis, Reich, Kastelic, Wilcox and Glowinski22 and available medical records. Additional clinical and cognitive measures are described in the Supplementary Methods.
Structural imaging acquisition and processing
A 3T Philips Achieva scanner (Royal Philips Electronics, Amsterdam, The Netherlands) was used to acquire T1-weighted images (n = 217 participants at baseline, n = 152 participants at follow-up). Each image set included 180 sagittal T1-weighted three-dimensional turbo field-echo images (repetition time/echo time = 5.5/2.5 ms, flip angle = 8°, field of view = 56 × 256 × 180 mm3, voxel size = 1 × 1 × 1 mm3, scan time = 371 s). Detailed procedures for magnetic resonance imaging (MRI) quality control and longitudinal processing with FreeSurfer are provided in the Supplementary Material.
Statistical analyses
Group differences in clinical and neuropsychological data were assessed using SPSS (version 28; IBM). For categorical variables, chi-squared or Fisher’s exact tests (where any cell count was n < 5) were used. For continuous variables, independent-samples t-tests were used for data that were normally distributed within groups; otherwise, Mann–Whitney U-test was used.
Measures of area, thickness and volume at each vertex of the left and right cortical surfaces were selected as dependant variables. By definition, cortical volume is the product of surface area and thickness; while these two-dimensional measures are significantly correlated, genetic factors that influence their anatomical development are somewhat independent. Reference Ivleva, Bidesi, Keshavan, Pearlson, Meda and Dodig24,Reference Mansur, McIntyre, Cao, Lee, Japiassu and Chen25 To fully explore processes that regulate neurodevelopment, Reference Ivleva, Bidesi, Keshavan, Pearlson, Meda and Dodig24 we examined each of these three morphological measures.
Separate spatiotemporal linear mixed effects (LME) models Reference Bernal-Rusiel, Reuter, Greve, Fischl and Sabuncu26,Reference Bernal-Rusiel, Greve, Reuter, Fischl and Sabuncu27 were applied to each dependent variable using FreeSurfer tools in MATLAB (version 2014b). The use of LME models facilitated the inclusion of participants with a single time point (n = 65) and variable inter-scan intervals (in years, M = 2.057, s.d. = 0.143), maximising sample size and statistical power. Reference Bernal-Rusiel, Greve, Reuter, Fischl and Sabuncu27 Each model included fixed effects for three dummy-coded variables representing both familial group and lifetime history of any DSM-IV diagnoses (Dx) at both baseline and follow-up; using a reference group of Dx-negative control participants (n = 75), group predictors represented:
(a) Dx-positive control (n = 33), (b) Dx-negative ‘high-risk’ (n = 36) and (c) Dx-positive ‘high-risk’ (n = 66).
Due to heterogeneous paths of transition from one diagnosis to another over time (i.e. heterotypic continuity or transdiagnostic staging), Reference Ratheesh, Hammond, Gao, Marwaha, Thompson and Hartmann28,Reference Picoito, Santos and Nunes29 transitions from one specific disorder at baseline to another disorder at follow-up were not able to be specifically modelled; individuals with such transitions were all represented in the Dx-positive group. Seven participants (control n = 4, ‘high-risk’ n = 3) who were Dx-negative at baseline developed a first-onset DSM-IV diagnosis at follow-up (Dx-new). Due to sample size limitations, these participants were excluded from primary LME modelling, but were included in post hoc analyses (described below). All LME models included a random effect for intercept (see the Supplementary Methods for iterative model selection), fixed effects for time (inter-scan interval in years) and the interaction of time and group (each of the three group indicator variables), as well as covariates of baseline age in years (mean centred), sex (male = 0, female = 1), ancestry (two dummy-coded covariates: European = 0, East Asian = 1; European = 0, mixed-European = 1) and current psychiatric medication use (medication-negative = 0, medication-positive = 1).
To determine whether primary LME findings were robust to correction for variability in gross brain morphology, secondary LME models of cortical area, thickness and volume were calculated, including the same fixed and random effects as the primary LME models but with an additional relevant covariate for gross brain morphology (i.e. total area, M thickness or intracranial volume). For both primary and secondary LME models, correction for multiple comparisons was completed for each model term and planned contrast, examining left and right hemispheres simultaneously across all vertices (n = 327 684). This was undertaken using the ‘lme_mass_fdr’ MATLAB function, included in FreeSurfer LME tools, which implements a standard false discovery rate (FDR) procedure. Reference Benjamini and Hochberg30 Term-specific FDR significance thresholds are provided in Supplementary Table 1.
To examine the magnitude of observed significant effects, β coefficients were extracted from generated LME output files, corresponding to each model term and planned contrast and adjusted for the effects of all other model terms. For baseline effects, these unstandardised effect size estimates represented the relative difference in cortical thickness, area or volume (in mm, mm2 or mm3, respectively). For effects over time, these unstandardised effect size estimates represented the relative yearly change in thickness, area or volume (in mm, mm2 or mm3, respectively).
Post hoc statistical analyses
To examine the impact of transition to psychopathology on familial group differences over time, post hoc analyses were undertaken on cortical clusters with a significant familial group-by-time interaction in the primary LME model (Table 2, Supplementary Table 2 and Fig. 1). For each cluster, multiple linear regression models were constructed to compare yearly rate-of-change of cluster-wise average cortical thickness (n = 4 models) or total volume (n = 9 models) between ‘high-risk’ individuals who: (a) were Dx-negative at baseline and developed a first new-onset DSM-IV diagnosis between time points (Dx-new; n = 3) and (b) were healthy (Dx-negative; n = 22) or had any lifetime DSM-IV diagnoses at baseline (Dx-positive; n = 50).
Schematic overview of study design, key findings and clinical significance. The left boxplot depicting primary analysis findings (in purple and orange) was generated from the standardised (number of standard deviations from 0) yearly rate-of-change across cortical thickness clusters (n = 4, in mm) and volume clusters (n = 9, in mm3) that demonstrated significant group-by-time interactions (following false discovery rate correction). The right boxplot depicting post hoc analysis findings (in green and blue) was generated from unstandardised yearly rate-of-change for cortical volume of the right pars orbitalis region of the inferior frontal gyrus (in mm3). As change over time could only be calculated for individuals with two imaging time points, data for participants with only a single imaging time point were not used in figure generation. Yearly rate-of-change was calculated using the formula ([time-2 cluster-wise value] – [time-1 cluster-wise value])/[time between scans, in years]. *Seven participants (control n = 4, ‘high-risk’ n = 3) who were Dx-negative at baseline and developed a first-onset DSM-IV diagnosis at follow-up (Dx-new) were excluded from LME modelling, due to sample size limitations. Dx-new, first onset of any DSM-IV diagnosis identified at follow-up, where no DSM-IV diagnoses were present at baseline; Dx-positive, positive for any lifetime DSM-IV diagnoses at both time points; Dx-negative, negative for any lifetime DSM-IV diagnosis at both time points.

As yearly rate-of-change could only be calculated for individuals with two imaging time points, ‘high-risk’ participants with only a single imaging time point were excluded from post hoc analyses (Dx-negative n = 14, Dx-positive n = 16). Yearly rate-of-change was calculated using the following formula:
 $$\small{\eqalign{& ([time{\hbox -}2\ cluster{\hbox -}wise\ value]-[time{\hbox -}1\ cluster{\hbox -}wise\ value])/\cr & \quad [time\ between\ scans,\ in\ years] }}$$
Two dummy-coded group indices were computed to undertake group comparisons:
-
(a) ‘high-risk’ Dx-new + Dx-positive versus Dx-negative (Dx-new = 0, Dx-negative = 1 and Dx-positive = 0);
-
(b) ‘high-risk’ Dx-new + Dx-negative versus Dx-positive (Dx-new = 0, Dx-negative = 0 and Dx-positive = 1).
In addition to dummy-coded group variables, post hoc regression models included all covariates from the primary LME model (age at baseline, inter-scan interval, sex, ancestry and current psychiatric medication use). Due to the exploratory nature of this analysis, correction for multiple post hoc comparisons was not completed.
Transparency declaration
As lead author, B.J.O. affirms that the manuscript is an honest, accurate and transparent account of the study being reported, that no important aspects of the study have been omitted and that any discrepancies from the study as planned have been explained.
Results
Demographic and clinical differences
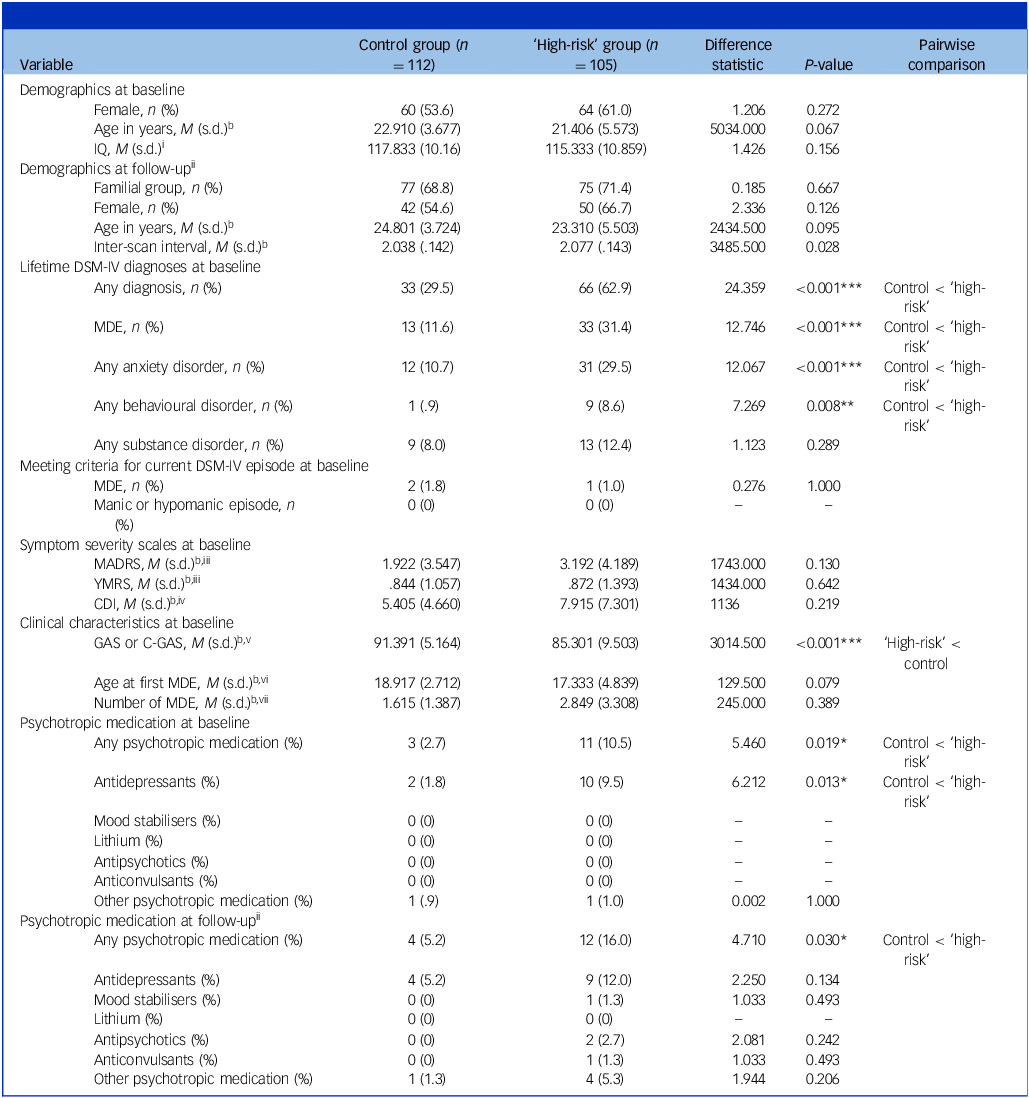
At baseline, ‘high-risk’ participants were more likely to have experienced a lifetime major depressive episode (MDE; control: 11.6%, ‘high-risk’: 31.4%; P < 0.001) and had higher rates of any lifetime DSM-IV diagnosis (control: 29.5%, ‘high-risk’: 62.9%; P < 0.001), lifetime anxiety (control: 10.7%, ‘high-risk’: 29.5%; P < 0.001) and lifetime behavioural diagnoses (control: 0.9%, ‘high-risk’: 8.6%; P = 0.008) (Table 1). In addition, ‘high-risk’ participants demonstrated significantly poorer functional outcomes at baseline, relative to controls (Global Assessment Scale or Children’s Global Assessment Scale score M = 85.301, s.d. = 9.503 versus M = 91.391, s.d. = 5.164, respectively; P < 0.001). While inter-scan interval distributions varied significantly between familial groups (U = 3485.500, P = 0.028), group median and M values (control median = 2.012, M = 2.037, s.d. = 0.142; ‘high-risk’ median = 2.042, M = 2.078, s.d. = 0.144) were comparable.
Summary statistics and group comparisons for demographic and clinical variablesa

IQ, intelligence quotient; MADRS, Montgomery–Åsberg Depression Rating Scale; YMRS, Young Mania Rating Scale; CDI, Children’s Depression Inventory; MDE, major depressive episode; GAS, Global Assessment Scale; C-GAS, Children’s Global Assessment Scale; M, mean.
a. All participants had an IQ above 83. Lifetime MDE was defined as meeting DSM-IV criteria for at least one MDE. Confidence ratings used the best-estimate methodology range from 1 to 4, where 1 represents criteria not met for a diagnosis and 4 represents a definite diagnosis. All diagnoses listed here had a confidence rating of 3 or higher. Nineteen participants transitioned between diagnostic categories from baseline to follow-up, after developing a new best-estimate DSM-IV diagnosis, with four participants transitioning to a bipolar-type diagnosis (full details are provided in the Supplementary Results).
b. Variable did not meet assumptions for parametric analysis, Mann–Whitney U was used.
ibased on available data for control (n = 78) and ‘high-risk’ (n = 66); iireported for control (n = 77) and ‘high-risk’ (n = 75) with both baseline and follow-up imaging time points available; iiiavailable for control (n = 64) and ‘high-risk’ (n = 47) aged 22 to 30 years; ivavailable for control (n = 42) and ‘high-risk’ (n = 47) aged 12 to 21 years; vavailable for control (n = 110) and ‘high-risk’ (n = 93); vireported for control (n = 12) and ‘high-risk’ (n = 33) with lifetime MDE observed; viireported for control (n = 13) and ‘high-risk’ (n = 33) with lifetime MDE observed.
*P < 0.05, **P < 0.01, ***P < 0.001.
Analysis of current medication use revealed significantly higher rates of any psychotropic medication in ‘high-risk’ relative to controls at both baseline (control: 2.7%, ‘high-risk’: 10.5%; P = 0.019) and follow-up (control: 5.2%, ‘high-risk’: 16%; P = 0.030) and higher rates of antidepressant use in ‘high-risk’ at baseline (control: 1.8%, ‘high-risk’: 9.5%; P = 0.013). Lithium use was not reported by any participant at either time point.
Fixed effect of familial group at baseline
No FDR-significant baseline differences were observed between familial groups for any LME model after controlling for diagnosis and other model covariates.
Fixed effect of any lifetime DSM-IV diagnoses at baseline
Significant effects of Dx were identified on cortical area (Supplementary Fig. 1) and volume (Supplementary Fig. 2) at baseline in the primary LME models which excluded covariates for gross brain measures (total area or intracranial volume). These effects were identified following FDR correction and after controlling for familial group and other model covariates. Specifically, 20 clusters showed larger cortical area in Dx-positive participants, compared with Dx-negative (Table 2 and Supplementary Table 2), with average group differences of 0.018 to 0.064 mm2; the four largest of these clusters were located in the left superior temporal (β = 0.0443, P < 0.001), left parahippocampal (β = 0.0374, P < 0.001), right caudal anterior cingulate (β = 0.0400, P < 0.001) and right inferior temporal (β = 0.0585, P < 0.001) regions. Similarly, a right posterior cingulate cluster showed larger cortical volume in Dx-positive, compared with Dx-negative (β = 0.1371, P < 0.001). None of these cortical area or volume clusters were significant after FDR correction in secondary LME models that included global measures of total area or intracranial volume as covariates, suggesting that variability in gross brain structure influenced the observed regional Dx differences. No effects of Dx were observed for cortical thickness in any LME model.
Summary of FDR-corrected significant cortical clusters related to effects of diagnosis at baseline and over time, from the primary linear mixed effects model

FDR, false discovery rate; β, beta estimate (unstandardised effect size); Tal, Talairach; L, left hemisphere; R, right hemisphere; Dx0, negative for any lifetime DSM-IV diagnoses; Dx1, positive for any lifetime DSM-IV diagnoses.
*Maximum P < 0.05, **Maximum P < 0.01, ***Maximum P < 0.001.
Other fixed effects at baseline
Significant findings for the fixed effects of age, sex and current psychiatric medication on cortical structure are provided in Supplementary Tables 2 and 3 and described in the Supplementary Results.
Fixed effect of time
Widespread and significant reductions in cortical area, thickness and volume were observed over time in all LME models, within each familial group (Fig. 2(a) and (b), Fig. 3(a) and (b), and Supplementary Figs. 3–6, respectively) and diagnostic group (Supplementary Figs. 7 and 8) (following FDR correction and after controlling for all other model terms). The location and size of significant cortical clusters are provided in Table 2 and Supplementary Tables 2 and 3, and detailed in the Supplementary Results.
Interaction of familial group and time (group-by-time)
Significant effects of the interaction of familial group and time were observed on cortical thickness (Fig. 1 and Fig. 2(c) and (d)) and volume (Fig. 1 and Fig. 3(c) and (d)) in the primary LME model, following FDR correction and after controlling for Dx and other model covariates. Four clusters located in the left inferior temporal (P < 0.001), left postcentral (P < 0.001), right lateral orbitofrontal (P < 0.001) and right precuneus (P < 0.001) regions (Table 2 and Supplementary Table 2) showed more rapidly decreasing cortical thickness in the ‘high-risk’ group when compared with controls, with an average group difference of 0.021 to 0.033 mm per year (Fig. 2(d)). Similarly, nine clusters showed more rapidly decreasing cortical volume in ‘high-risk’ when compared with controls, with an average group difference of 0.008 to 0.027 mm3 per year (Table 2 and Supplementary Table 2). The four largest of these clusters were located in the left fusiform (β = 0.0272, P < 0.001), left supramarginal (β = 0.0134, P < 0.001), right pars orbitalis (β = 0.0206, P < 0.001) and right precuneus (β = 0.0137, P < 0.001) regions (Fig. 3(d)). In the secondary LME models, all clusters observed in the primary LME model were again observed, with expanded cluster boundaries (Supplementary Table 3 and Supplementary Figs. 5 and 6). Twelve additional cortical clusters (one for thickness, 11 for volume) were also observed, showing the same pattern of more rapidly decreasing cortical thickness or volume in ‘high-risk’ when compared with controls. No significant familial group-by-time interactions were observed for cortical area in any LME model.
Clusters that demonstrated significant change in cortical thickness over time (within and between groups), from the false discovery rate corrected primary linear mixed effects model, (a) within the control group, (b) within the ‘high-risk’ group, (c) between the control and ‘high-risk’ groups and (d) line plots for all significant interactions of familial group and time in years. Panels (a)–(c) depict significant cortical clusters mapped onto left (L) and right (R) lateral and medial inflated cortical surfaces.

Clusters that demonstrated significant change in cortical volume over time (within and between groups), from the false discovery rate corrected primary linear mixed effects model, (a) within the control group, (b) within the ‘high-risk’ group and (c) between the control and ‘high-risk’ groups and (d) line plots for the four largest clusters that showed significant interaction of familial group and time in years. Panels (a)–(c) depict significant cortical clusters mapped onto left (L) and right (R) lateral and medial inflated cortical surfaces.

Interactions of familial group and diagnosis at baseline (group-by-Dx)
No significant interactions were observed between familial group and Dx at baseline in the primary LME model. However, in the secondary LME model, a significant interaction effect of familial group-by-Dx on the right postcentral area was observed after FDR correction and controlling for other model covariates (Supplementary Table 3 and Supplementary Fig. 9(a); β = 0.0552, P < 0.001). Specifically, an inverse relationship was observed between control and ‘high-risk’ groups for the effect of Dx on cortical area (Supplementary Fig. 9(b)): smaller cortical area was observed for Dx-positive controls, compared with Dx-negative controls, and smaller cortical area was observed for Dx-negative ‘high-risk’, compared with Dx-positive ‘high-risk’.
Post hoc analysis of acquired DSM-IV diagnosis during the inter-scan interval
Multiple linear regression analysis revealed a statistically significant group difference for yearly rate-of-change across one cortical thickness cluster (right precuneus) and six cortical volume clusters (left fusiform, supramarginal and inferior parietal, and right pars orbitalis, precuneus and supramarginal). Specifically, more rapidly decreasing thickness or volume were observed over time in Dx-new ‘high-risk’ relative to both Dx-negative and Dx-positive ‘high-risk’ (Fig. 1, Supplementary Table 4 and Supplementary Fig. 10).
Discussion
This study examined structural brain changes over time, at high resolution across the entire cortical mantle, in adolescent and young adult participants who were positive or negative for bipolar disorder familial risk. We observed accelerated reductions in left inferior temporal, left postcentral, right lateral orbitofrontal and right precuneus thickness in the ‘high-risk’ group relative to controls. ‘High-risk’ participants also demonstrated accelerated reductions in cortical volume over time, with the largest effects observed in the left fusiform and right pars orbitalis. All group-by-time interaction effects were FDR-corrected and robust to the addition of covariates for gross brain morphology. No group differences were observed in cortical area over time, suggesting that the group-by-time interactions observed for cortical volume were largely indexing group differences in cortical thickness. To the best of our knowledge, this work represents the first prospective longitudinal vertex-wise analysis of the impact of familial risk of bipolar disorder on cortical morphology.
Pattern of accelerated cortical changes in the ‘high-risk’ group
The observed group-by-time interaction effects demonstrated a consistent pattern of accelerated reductions in cortical thickness and volume within the ‘high-risk’ group, across multiple cortical regions. Extending beyond the examination of specific regional effects, the present whole-brain findings suggest a diffuse influence of genetic and/or environmental factors that are associated with bipolar disorder familial risk. Given the developmental period considered in the present study, specifically adolescents and young adults aged 12–30 years (the peak period for onset of bipolar disorder), Reference Bolton, Warner, Harriss, Geddes and Saunders2 it is possible that observed changes in the ‘high-risk’ group represent a premorbid alteration of developmental trajectories. Previously, we posited a pattern of greater cortical thickness and volume in ‘high-risk’ participants at earlier developmental stages, followed by accelerated cortical thinning and volume reduction associated with psychopathology development. Reference Roberts, Lenroot, Overs, Fullerton, Leung and Ridgway12 The present findings provide additional support for this model, given the thicker cortex and larger volumes observed in younger ‘high-risk’ participants, followed by accelerated thickness and volume decreases over large portions of the cortex (Fig. 1). In addition, significant post hoc findings highlighted more rapidly decreasing cortical thickness and volume in ‘high-risk’ participants who developed a first new-onset DSM-IV diagnosis between time points (n = 3), compared with both healthy (n = 22) and Dx-positive ‘high-risk’ (n = 50) participants. While our primary analysis revealed that Dx did not significantly interact with the predictors of group and time in models of cortical thickness and volume, it is possible that structural differences occur at illness onset and then attenuate over time. A study by Sugrnayes et al Reference Sugranyes, de la Serna, Ilzarbe, Pariente, Borras and Romero18 also provided indirect support for the model of psychopathology-induced cortical thinning, showing accelerated frontal lobe thinning in bipolar offspring who developed psychosis, relative to healthy controls. However, given the limited sample size of new first-onset diagnoses in both the present study (n = 3) and that of Sugrnayes et al (n = 9), these findings should be considered with caution and may not be generalisable. By contrast, Papmeyer et al Reference Papmeyer, Giles, Sussmann, Kielty, Stewart and Lawrie14 observed accelerated thickness reductions in healthy ‘high-risk’ individuals, aged 16 to 25 years at baseline, suggesting that accelerated cortical thinning over time may represent neuroprotective processes. In the present study, new first-onset diagnoses were observed in participants aged <16 years or >25 years at baseline, and the findings of Sugrnayes et al were reported for participants aged ≤16 years. Therefore, it is possible that differences in the observed developmental windows account for the divergent findings of Papmeyer et al. Reference Papmeyer, Giles, Sussmann, Kielty, Stewart and Lawrie14 Future longitudinal imaging studies that stratify participants by peak developmental period may provide additional insight into the pathological or protective nature of accelerated cortical reductions over time.
The IFG
The present observation of significant group differences in right pars orbitalis volume over time provides further support for the role of the IFG in risk of bipolar disorder. Two previous longitudinal imaging studies also observed accelerated reductions in IFG thickness Reference Papmeyer, Giles, Sussmann, Kielty, Stewart and Lawrie14 or volume Reference Roberts, Lenroot, Overs, Fullerton, Leung and Ridgway12 in ‘high-risk’ groups, relative to controls. Group differences in IFG volume have also been observed across numerous cross-sectional ‘high-risk’ studies. However, the direction of effect has varied, with greater right and bilateral IFG volumes in adolescent and adult ‘high-risk’ groups when compared with controls, Reference Cattarinussi, Di Giorgio, Wolf, Balestrieri and Sambataro31–Reference Zhang, Sweeney, Yao, Li, Zeng and Xu34 and smaller right and bilateral IFG volumes in symptomatic ‘high-risk’ groups. Reference Ivleva, Bidesi, Keshavan, Pearlson, Meda and Dodig24,Reference Mansur, McIntyre, Cao, Lee, Japiassu and Chen25 It is possible that these divergent findings represent different developmental stages on the trajectory to illness in bipolar disorder familial risk, with larger IFG volumes prior to illness onset, accelerated volume reduction on the trajectory to illness and smaller volumes associated with clinical diagnosis. In support of this model, multiple imaging studies in adults with established bipolar disorder have observed smaller right lateralised IFG volumes in participants with bipolar disorder when compared with controls. Reference Bora, Fornito, Yücel and Pantelis6 Conversely, Macoveanu et al Reference Macoveanu, Baare, Madsen, Kessing, Siebner and Vinberg13 observed larger bilateral IFG volumes in a ‘high-risk’ group independent of time, with the largest volumes in ‘high-risk’ individuals who developed psychopathology between time points. It is clear that differential structural changes in the IFG, a region whose functions include language processing, interoceptive awareness and emotional response inhibition, are associated with familial risk of bipolar disorder. However, it remains unclear how these changes relate to the development of psychopathology.
The lateral orbitofrontal cortex
The present study identified accelerated thickness reductions in the right lateral orbitofrontal cortex in the ‘high-risk’ group, relative to controls, supporting the findings of a previous ROI analysis within an overlapping cohort Reference Roberts, Lenroot, Overs, Fullerton, Leung and Ridgway12 and providing more granular locational detail. Previous case–control studies have unilaterally supported the hypothesis of lateral orbitofrontal volume reductions in ‘high-risk’ individuals relative to controls, with observations of smaller left Reference Eker, Simsek, Yilmazer, Kitis, Cinar and Eker35 and right Reference Lin, Xu, Wong, Wu, Li and Lu36 volumes across mixed age ranges. Similarly, case–control studies of adults with established bipolar disorder have provided evidence of smaller lateral orbitofrontal volume Reference Stanfield, Moorhead, Job, McKirdy, Sussmann and Hall37 and thinner cortex Reference Hibar, Westlye, Doan, Jahanshad, Cheung and Ching38 in participants with bipolar disorder relative to controls. It is possible that early structural alterations in lateral orbitofrontal regions represent premorbid biomarkers of future psychopathology.
The interaction between familial risk and lifetime psychopathology
In addition to longitudinal differences associated with familial risk of bipolar disorder, an interaction between familial group and lifetime diagnostic status was observed in the right postcentral cortex at baseline (after accounting for total cortical area). Among controls, smaller postcentral area was observed in Dx-positive when compared with Dx-negative participants, while in the ‘high-risk’ group, smaller postcentral areas were observed in Dx-negative participants. This inverse relationship between lifetime diagnostic status and brain structure between groups suggests that genetic and environmental factors associated with a family history of bipolar disorder mediate the structural brain changes that are associated with psychopathology. In addition, the static nature of this effect over time suggests the stabilisation of this structural difference at an early developmental stage. Two previous imaging studies of ‘high-risk’ adult populations have reported significant postcentral group differences, relative to controls, including smaller bilateral volume in ‘high-risk’ individuals with psychosis Reference Ivleva, Bidesi, Keshavan, Pearlson, Meda and Dodig24 and thinner right cortex in those with a genetic liability for bipolar disorder, Reference Hulshoff Pol, van Baal, Schnack, Brans, van der Schot and Brouwer39 albeit with no analogous analysis of cortical area. However, no case–control differences in postcentral structure were observed in the two largest cross-sectional studies of ‘high-risk’ participants to date. Reference Cattarinussi, Di Giorgio, Wolf, Balestrieri and Sambataro31,Reference de Zwarte, Brouwer, Agartz, Alda, Aleman and Alpert40 In addition, no group differences in postcentral area have previously been observed in individuals with bipolar disorder. Reference Hibar, Westlye, Doan, Jahanshad, Cheung and Ching38 It is possible that the present finding represents an early developmental group difference that is no longer present after transition to illness or in older ‘high-risk’ individuals.
Limitations and future directions
While the cohort employed herein was larger than any previous longitudinal imaging study of bipolar disorder familial risk, it was smaller than some cross-sectional imaging studies of bipolar disorder and familial risk of bipolar disorder, particularly those of consortia. Reference Hibar, Westlye, Doan, Jahanshad, Cheung and Ching38,Reference de Zwarte, Brouwer, Agartz, Alda, Aleman and Alpert40 Larger sample sizes in prospective longitudinal studies will improve statistical power to detect subtle premorbid developmental changes in cortical structure that are obscured in cross-sectional studies, particularly where age distribution impacts the developmental timeframe over which effects may be detected. Stratification by medication type and current psychiatric symptoms was not possible in the present study, due to the limited number of participants who were medicated or symptomatic at either time point. Furthermore, between baseline and follow-up, transitions between specific diagnoses, and from no diagnosis to first onset of a new diagnosis, could not be included in LME modelling, due to small numbers and limited power. While between-individual gyral variation may have impacted the accuracy of cortical parcellation following MRI co-registration, we sought to partially address this limitation by using the FreeSurfer longitudinal processing stream, which employs within-individual template registration. Reference Reuter, Schmansky, Rosas and Fischl41
It should be noted that most people with bipolar disorder in clinical settings do not have a positive family history, and the changes reported herein may not generalise to those who develop bipolar disorder ‘spontaneously’. Reference Ratheesh and Bechdolf42 Familial risk conflates both genetically inherited and environmental factors (e.g. shared household) associated with increased vulnerability for psychiatric illness. Accordingly, future studies incorporating specific genomic risk factors and indices of stress (e.g. family cohesion or conflict) Reference Stapp, Musci, Fullerton, Glowinski, McInnis and Mitchell43–Reference Hesam-Shariati, Overs, Roberts, Toma, Watkeys and Green45 may assist in teasing out the relative genetic and environmental contributions to the accelerated cortical changes observed in ‘high-risk’ youth. Future longitudinal examination of ‘high-risk’ individuals who transition to bipolar disorder will also provide greater clarity as to the mechanistic nature of observed structural imaging differences in precipitating or preventing illness. Finally, acquisition of additional longitudinal neuroimaging time points will enable the assessment of nonlinear developmental trajectories and tissue-specific trajectories that reflect variable peak maturation timing and brain ageing.
With a focus on the developmental window during which two-thirds of bipolar disorder onsets occur (i.e. adolescence and young adulthood), the present study provides a high-resolution map of widespread and accelerated changes of cortical structure in the context of bipolar disorder familial risk, which may guide future research and clinical prediction models. As family history is currently the strongest predictor of future psychopathology, these findings highlight the extent of bipolar disorder familial influences on cortical development.
Supplementary material
The supplementary material is available online at https://doi.org/10.1192/bjp.2025.10302
Data availability
The data that support the findings of this study are available on request from the corresponding author, J.M.F. The raw data are not publicly available due to ethical restrictions pertaining to participant privacy and confidentiality. Code for the magnetic resonance imaging (MRI) processing that was implemented in this study is freely available at https://surfer.nmr.mgh.harvard.edu/fswiki/FsTutorial/LongitudinalTutorial, and analytic code for the spatiotemporal linear mixed effects (LME) model is freely available at https://surfer.nmr.mgh.harvard.edu/fswiki/LinearMixedEffectsModels. Infrastructure and hardware used for data collection and analysis remain the property of the organisations affiliated with the authors of this manuscript. Requests for access to these materials may be directed to J.M.F.
Acknowledgements
We thank Adam Wright, Andrew Frankland, Vivian Leung, Kate Ridgway and Angela Stuart (UNSW) for their contributions to clinical data collection and management; Pui Ka Yeung and Lidan Zhang (NeuRA) for assistance in structural MRI processing; and Kersten Diers (German Center for Neurodegenerative Diseases (DZNE), Bonn, Germany) for advice on the implementation of the LME models. We also thank Kerrie D. Pierce and Anna Heath (NeuRA) for biospecimen sample handling prior to Illumina PsychChip genotyping, which was completed at the Icahn Institute for Genetics and Genomic Sciences, Mt Sinai School of Medicine, New York, USA, and Jessica Johnson and Doug Ruderfer (Mt Sinai) for sample processing and generation of genotype data.
Author contributions
Each named author made a substantial contribution to the work described herein. Acquisition of clinical and neuroimaging data was completed by G.R. and P.B.M. Best-estimate diagnoses were made after review of interviews and other clinical documents by P.B.M. and F.L. (now deceased). Pre-processing and quality control of neuroimaging data was completed by B.J.O. Collection and storage of blood samples was completed by P.R.S. and J.M.F. Genome-wide genotyping was completed by J.M.F. Imputation, quality control and analysis of genetic data was completed by C.T. and J.M.F. Analysis design was completed by B.J.O., D.H.-P., R.K.L. and J.M.F. LME model analyses were completed by B.J.O. and overseen by J.M.F. Demographic and clinical analyses were completed by B.J.O. and G.R. The manuscript was drafted by B.J.O. and the final version was reviewed, edited and approved by all named authors.
Funding
This work was supported by the Australian National Medical and Health Research Council (NHMRC) programme grant 1037196 to P.B.M.; NHMRC project grants 1066177 and 1063960 to J.M.F.; NHMRC Investigator grants 1176716 to P.R.S. and 1177991 to P.B.M.; NHMRC and Medical Research Futures Fund grant 1200428 and the Janette Mary O’Neil Research Fellowship to J.M.F., as well as the Lansdowne Foundation, GoodTalk charity and the Gordon Pettigrew Family. Additional philanthropic support was provided by Mrs Betty C. Lynch OAM (deceased) and Paul and Jenny Reid.
Declaration of interest
In 2023, J.M.F. received honoraria for contribution to a Speakers Bureau by Illumina and had travel expenses paid by Novo Nordisk Fonden (not related to this work).


 Open access
eLetters
No eLetters have been published for this article.