

Highlights:
1. Miaoling Formation and Kedao Group were deposited around 253 Ma and 243 Ma, respectively.
2. The eastern segment of the Paleo-Asian Ocean closed in a scissor-like manner along the Changchun-Yanji suture zone.
3. Remnants of the Paleo-Asian Ocean still existed in the early Middle Triassic.
1. Introduction
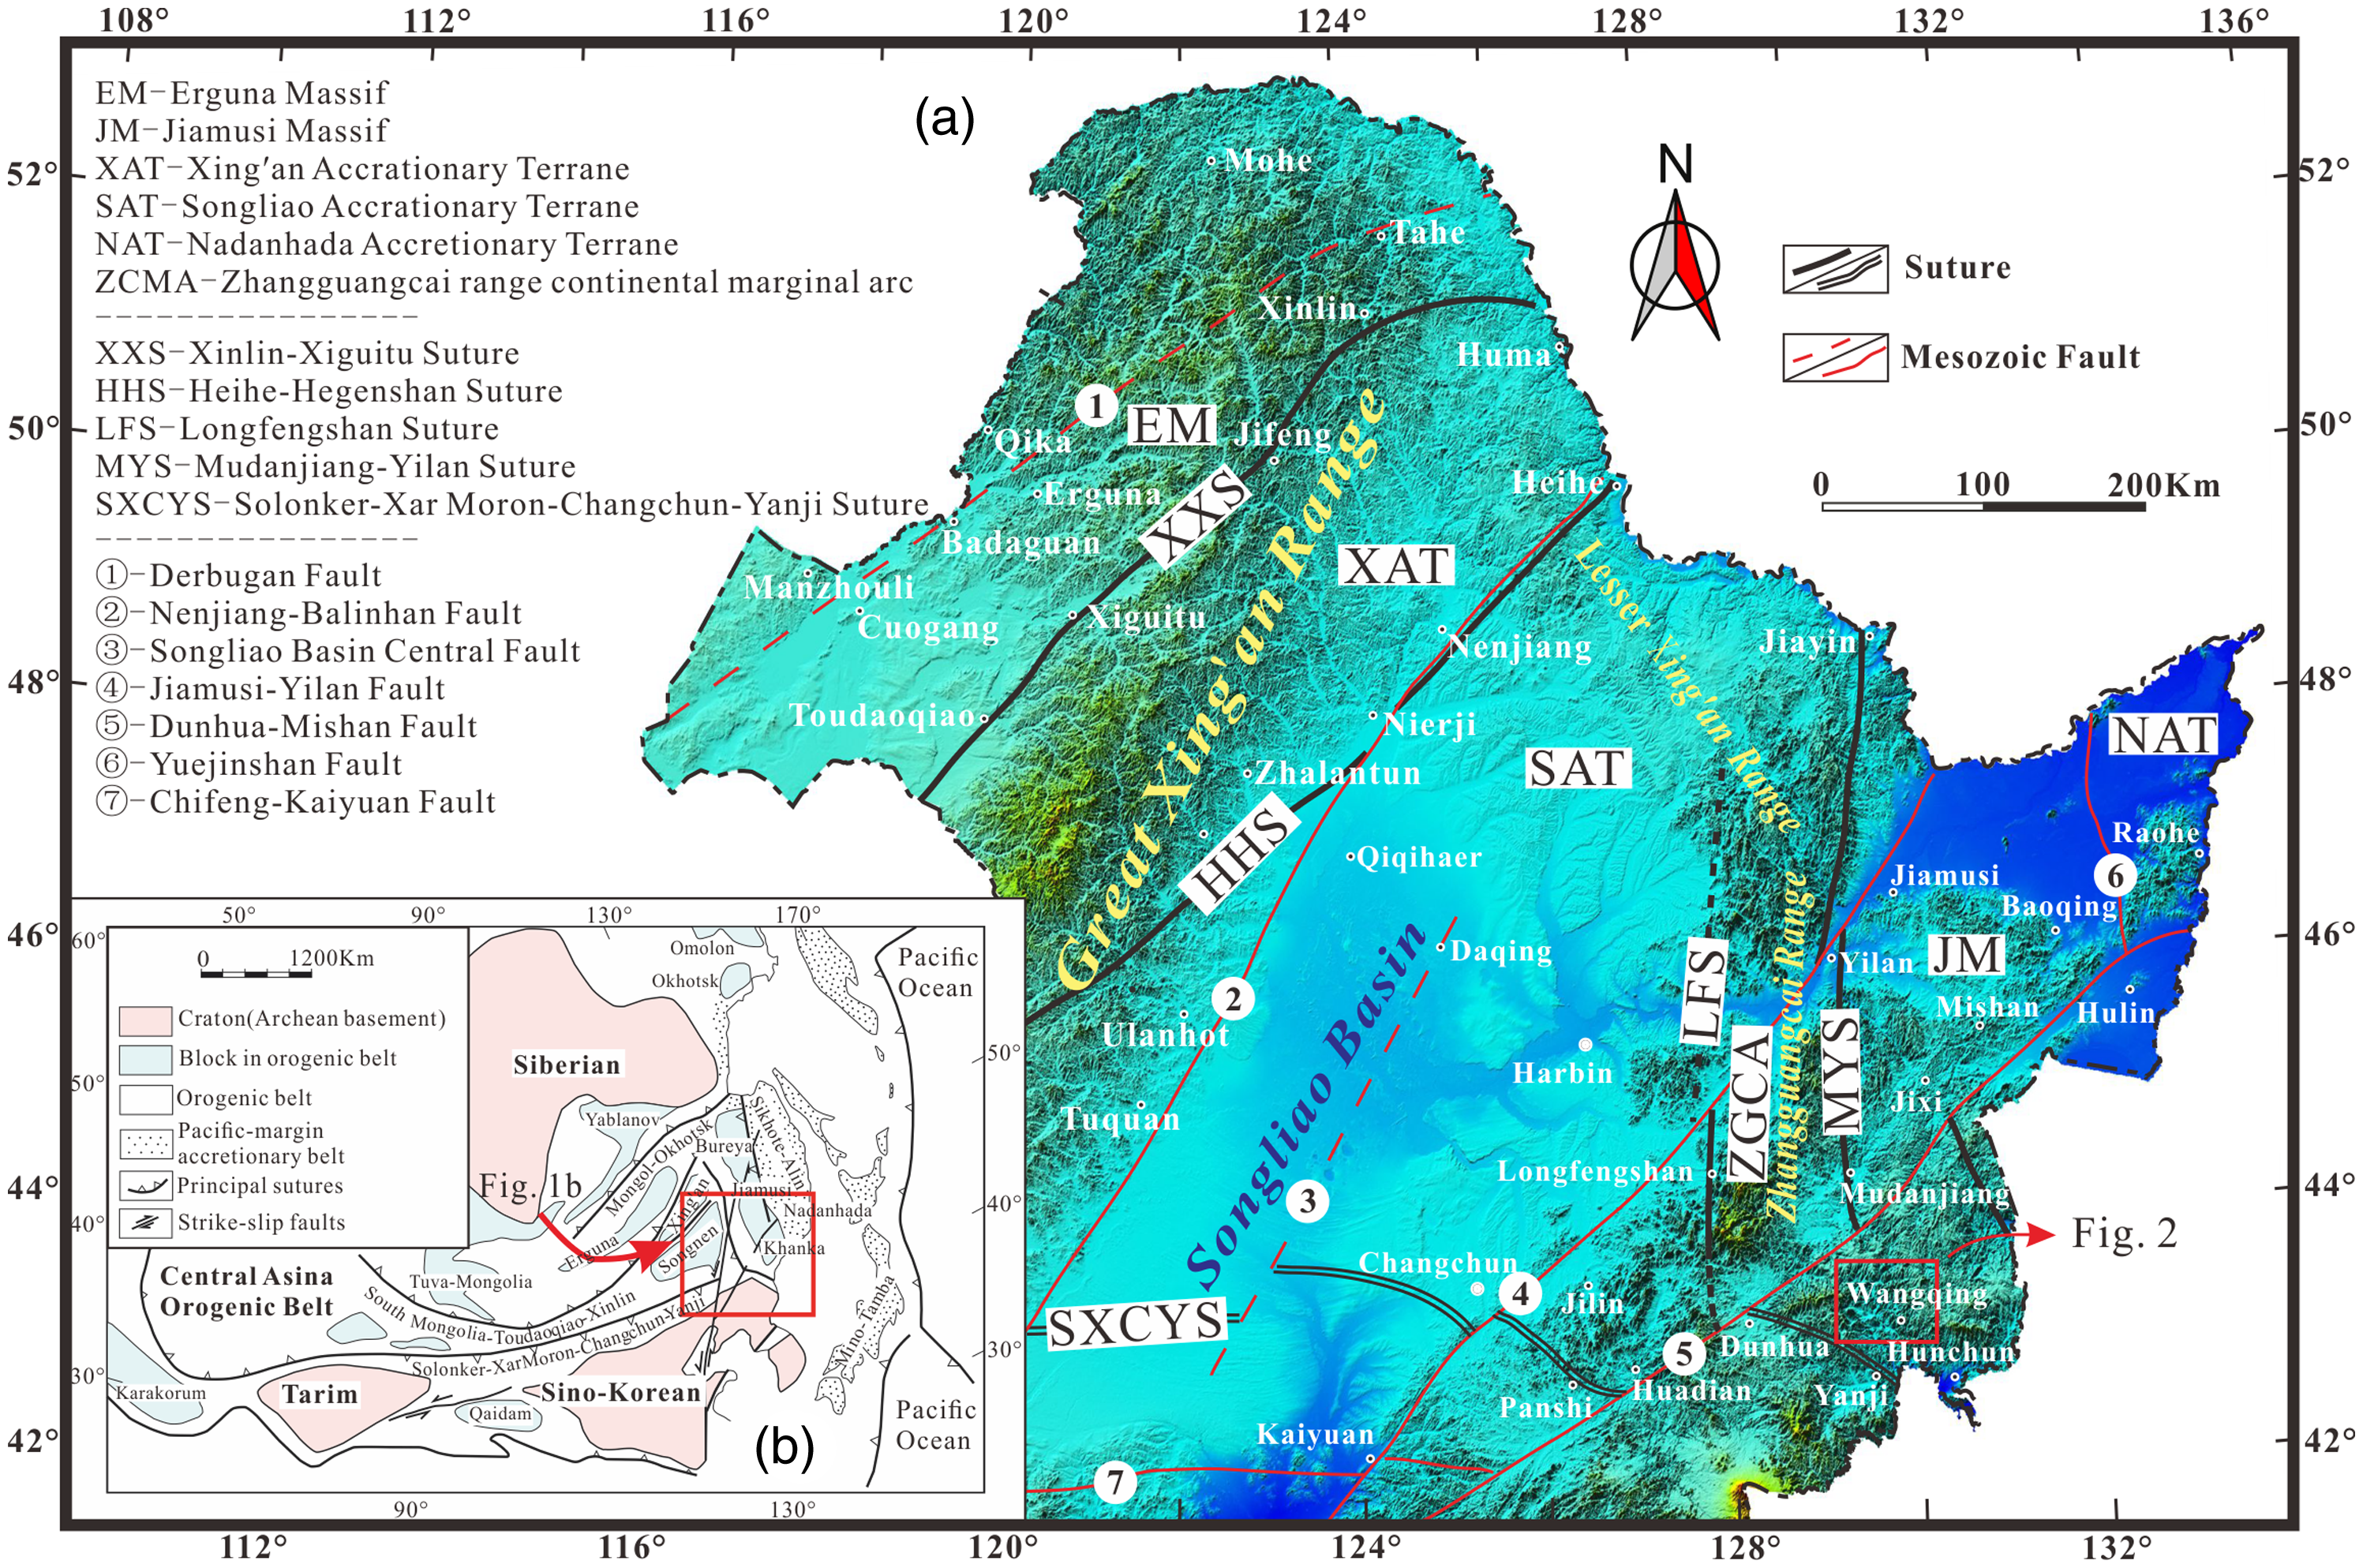
The Central Asian Orogenic Belt (CAOB), the largest accretionary orogenic belt on Earth, is situated between the Siberian Craton to the north, and the North China and Tarim Cratons to the south (Sengör et al. Reference Sengör, Natal’in and Burtman1993; Windley et al. Reference Windley, Alexeiev, Xiao, Kröner and Badarch2007; Wilde, Reference Wilde2015; Xiao et al. Reference Xiao, Windley, Sun, Li, Huang, Han, Yuan, Sun and Chen2015; Xu et al. Reference Xu, Zhao, Wang, Liao, Luo, Bao and Zhou2015; Chen et al. Reference Chen, Li, Shi, Li, Zhao and Zhang2022; Li, H.D. et al. 2022; Fig. 1a) and reflects a complex tectonic evolution closely connected to the closure of the Paleo-Asian Ocean (PAO) (Khain et al. Reference Khain, Bibikova, Kroner¨, Zhuravlev, Sklyarov, Fedotova and Kravchenko-Berezhnoy2002; Windley et al. Reference Windley, Alexeiev, Xiao, Kröner and Badarch2007; Xiao et al. Reference Xiao, Windley, Sun, Li, Huang, Han, Yuan, Sun and Chen2015; Zhang et al. Reference Zhang, Liang, Liu, Zheng and Li2019; Wu et al. Reference Wu, Zhao, Sun, Wilde and Yang2007; Pei et al. Reference Pei, Zhang, Wang, Cao, Xu, Wang, Wang and Yang2016). Northeastern China (NE China), also called the Xing’an-Mongolian Orogenic Belt (XMOB; Sun et al. Reference Sun, Wu, Zhang and Gao2004; Xu et al. Reference Xu, Zhao, Bao, Zhou, Wang and Luo2014), is located in the eastern segment of the CAOB and has witnessed the amalgamation of NE China massifs during Paleozoic and early Mesozoic, which from west to east are Erguna, Xing’an, Songnen and Jiamusi-Khanka massifs or terranes, all of which are separated by major faults or suture belts (Wu et al. Reference Wu, Zhao, Sun, Wilde and Yang2007, Reference Wu, Sun, Ge, Zhang, Grant, Wilde and Jahn2011; Zhou et al. Reference Zhou, Wilde, Zhang, Ren and Zheng2011a, b, Reference Zhou, Wang, Wilde, Zhao, Cao, Zheng and Zeng2015; Zhou & Wilde, Reference Zhou and Wilde2013; Cao et al. Reference Cao, Xu, Pei, Guo and Wang2012, Reference Cao, Xu, Pei, Wang, Wang and Wang2013; Santosh & Somerville, Reference Santosh and Somerville2013; Sun et al. Reference Sun, Gou and Wang2013; Xu et al. Reference Xu, Zhao, Bao, Zhou, Wang and Luo2014; Mi et al. Reference Mi, Liu, Li, Liu, Wang and Peng2017; Liu et al. Reference Liu, Liu, Zhao, Wang, Guan, Dou and Song2017; Li, Reference Li2006; Tang et al. Reference Tang, Xu, Wang, Wang, Xu and Zhang2013; Fig. 1a). This amalgamation of NE China (XMOB) and the North China Craton (NCC) along the Solonker-Xar Moron-Changchun-Yanji Suture (SXCYS) is commonly recognized as the final closure of the PAO, supported by evidence from magmatic rocks, structural features and palaeontological data (Sun et al. Reference Sun, Wu, Zhang and Gao2004; Jia et al. Reference Jia, Hu, Lu and Qiu2004; Wu et al. Reference Wu, Zhao, Sun, Wilde and Yang2007; Cao et al. Reference Cao, Xu, Pei, Wang, Wang and Wang2013; Zhou et al. Reference Zhou, Pei, Wang, Cao, Xu, Wang and Zhang2017; Wang et al. Reference Wang, Xu, Pei, Wang and Li2015a, b; Li et al. Reference Li, Xu, Wang, Tang, Sun and Wang2017; Yang et al. Reference Yang, Sun, Gou and Hou2017; Gu et al. Reference Gu, Zhu, Li, Su, Xiao, Zhang and Li2018; Du et al. Reference Du, Han, Shen, Han, Song, Gao, Han and Zhong2019). Nonetheless, there are still no definite conclusions about the final closure time of the PAO, as different scholars present varied perspectives. The closing process of the PAO during the Permain-Triassic has been inferred through the study of intrusive rocks exposed in the NCC and igneous rocks in NE China (Cao et al. Reference Cao, Xu, Pei, Wang, Wang and Wang2013; Guan et al. Reference Guan, Liu, Liu, Li, Wang, Chen and Zhang2022; Han et al. Reference Han, Li, Song, Liu, Zhong, Gao and Du2020, Reference Han, Li, Zhu, Zhong and Song2021; Song et al. Reference Song, Han, Gao, Geng, Li, Meng, Han, Zhong, Li, Du, Yan and Liu2018; Wang et al. Reference Wang, Xu, Pei, Wang, Li and Cao2015b; Wu et al. Reference Wu, Zhao, Sun, Wilde and Yang2007; Yuan et al. Reference Yuan, Zhang, Xue, Lu and Zong2016; Yu et al. Reference Yu, Zong, Yuan, Klemd, Wang, Guo, Xu, Hu and Liu2022). Some scholars, using high-quality paleomagnetic data and geological evidence, suggest the closure around 250 Ma (Zhao et al. Reference Zhao, Chen, Xu, Faure, Shi and Choulet2013; Ren et al. Reference Ren, Zhang, Sukhbaatar, Hou, Wu, Yang, Li and Chen2023). Conversely, others, focusing on sedimentary rocks, argue differently (Du et al. Reference Du, Han, Shen, Han, Song, Gao, Han and Zhong2019, Reference Du, Li, Han and Shen2021; Han et al. Reference Han, Zhong, Song, Han, Han, Gao, Du, Li, Yan and Liu2019; Liu J et al. Reference Li, Xu, Wang, Tang, Sun and Wang2017; Shi et al. Reference Shi, Ding, Liu and Zhou2020; Sun et al. Reference Sun, Han and Song2022; Wang et al. Reference Wang, Xu, Pei, Wang and Li2015a). Most studies agree that the final suturing occurred during the Permian-Triassic (Cao et al. Reference Cao, Xu, Pei, Wang, Wang and Wang2013; Du et al. Reference Du, Han, Shen, Han, Song, Gao, Han and Zhong2019, Reference Du, Li, Han and Shen2021; Guan et al. Reference Guan, Liu, Liu, Li, Wang, Chen and Zhang2022; Han et al. Reference Han, Zhong, Song, Han, Han, Gao, Du, Li, Yan and Liu2019, Reference Han, Li, Song, Liu, Zhong, Gao and Du2020, Reference Han, Li, Zhu, Zhong and Song2021; Li, Reference Li2006; Li & Zhao, 2007; Liu J et al. Reference Liu, Liu, Zhao, Wang, Guan, Dou and Song2017, Reference Liu, Zhang, Yin, Cheng, Liu, Zhao, Chen and Wang2020; Shi et al. Reference Shi, Ding, Liu and Zhou2020; Song et al. Reference Song, Han, Gao, Geng, Li, Meng, Han, Zhong, Li, Du, Yan and Liu2018; Sun et al. Reference Sun, Han and Song2022; Wang et al. Reference Wang, Xu, Pei, Wang and Li2015a, b; Wu et al. Reference Wu, Zhao, Sun, Wilde and Yang2007; Yuan et al. Reference Yuan, Zhang, Xue, Lu and Zong2016), while some propose it occurred before the Permian (Zhang et al. Reference Zhang, Chen, Dong, Pang, Shu, Wang and Yang2008; Shi et al. Reference Shi, Liu, Miao, Zhang, Jian, Zhang, Hou and Xu2010), or even before the Late Devonian (Xu & Chen, Reference Xu and Chen1997; Zhao et al. Reference Zhao, Chen, Xu, Faure, Shi and Choulet2013; Xu et al. Reference Xu, Zhao, Wang, Liao, Luo, Bao and Zhou2015; Zhu & Ren, Reference Zhu and Ren2017), or between the Late Devonian and Early Carboniferous (Tang, Reference Tang1989; Hong et al. Reference Hong, Huang, Xiao, Xu and Jin1995). Others suggest that closure spanned from the Permian to Triassic, encompassing late Early Permian (Yu et al. Reference Yu, Zong, Yuan, Klemd, Wang, Guo, Xu, Hu and Liu2022; Feng et al. Reference Feng, Liu, Zhong, Jia, Qi, Wang and Yang2010; Liu et al. Reference Liu, Hu, Gao, Feng, Feng, Coulson, Li, Wang and Qi2010), Middle to Late Permian(Sengör et al. Reference Sengör, Natal’in and Burtman1993; Chen et al. Reference Chen, Jahn, Wilde and Xu2000, Reference Chen, Jahn and Tian2009; Jian et al. Reference Jian, Liu, Kröner, Windley, Shi, Zhang, Zhang, Miao, Zhang and Tomurhuu2010; Lin et al. Reference Lin, Zhu, Yan, Song and Liu2013), Late Permian (Li, Reference Li2006; Wu et al. Reference Wu, Sun, Ge, Zhang, Grant, Wilde and Jahn2011), Late Permian to Early Triassic (Sengör et al. Reference Sengör, Natal’in and Burtman1993; Li, Reference Li1998, Reference Li2006; Xiao et al. Reference Xiao, Windley, Hao and Zhai2003; Sun et al. Reference Sun, Wu, Zhang and Gao2004; Zhang et al. Reference Zhang, Wu, Wilde, Zhai, Lu and Sun2004; Wu et al. Reference Wu, Zhao, Sun, Wilde and Yang2007, Reference Wu, Sun, Ge, Zhang, Grant, Wilde and Jahn2011; Xu et al. Reference Xu, Ji, Pei, Meng, Yu, Yang and Zhang2009; Peng et al. Reference Peng, Qi, Zhou, Lu, Dong and Li2012; Cao et al. Reference Cao, Xu, Pei, Wang, Wang and Wang2013; Eizenhöfer et al. Reference Eizenhöfer, Zhao, Zhang and Sun2014; Li et al. Reference Li, Zhou, Brouwer, Xiao, Wijbrans, Zhao, Zhong and Liu2014; Wilde, Reference Wilde2015; Han et al. Reference Han, Zhou, Wang and Cao2015; Guo et al. Reference Guo, Li, Fan, Li, Zhao and Huang2016; Wu & Li, Reference Wu and Li2022), Late Permian to Middle Triassic (Jia et al. Reference Jia, Hu, Lu and Qiu2004; Wang F et al. Reference Wang, Xu, Xu, Gao and Ge2015; Xiao et al. Reference Xiao, Windley, Sun, Li, Huang, Han, Yuan, Sun and Chen2015; Liu et al. Reference Liu, Liu, Zhao, Wang, Guan, Dou and Song2017; Guan et al. Reference Guan, Pei, Wei and Li2023) and Middle-Late Triassic (Peng et al. Reference Peng, Qi, Zhou, Lu, Dong and Li2012; Zhou & Wilde, Reference Zhou and Wilde2013). This controversy largely arises from insufficient time constraints and sedimentological data for the transition from subduction to collision in the eastern segment of CAOB (Zhang et al. Reference Zhang, Qiu, Yan, Zhao, Cai, Zhang, Chen, Li, Song, Zheng, Sun, Gong and Ariser2023).
Tectonic sketch map of the Central Asian Orogenic Belt (a; Zhou & Wilde, Reference Zhou and Wilde2013) and NE China (b; Liu et al. Reference Liu, Liu, Zhao, Wang, Guan, Dou and Song2017).
This uncertainty about the provenance of Late Permian to Triassic sedimentary rocks in this area and the absence of constraints from related orogenic events further exacerbate the differing viewpoints. The Wangqing area in eastern Jilin Province, adjacent to the Changchun-Yanji suture zone, plays a key area in elucidating the final closure of the eastern end of PAO (Fig. 2). This study focuses on petrology, geochronology and geochemistry investigations conducted on sandstone samples from the Middle Permian Miaoling Formation and Upper Triassic Kedao Group in the Wangqing area, aiming to enhance the understanding of the evolution and closure history of the eastern PAO from a perspective of provenance analysis.
Detailed geological map of the Wangqing area showing the stratigraphic distribution and sampling locations.

2. Geological setting and sample descriptions
2. a. Geological setting
The SXCYS is bordered by the eastern CAOB to the north and the NCC to the south. NE China is located in the east segment of the CAOB, also known as the XMOB, which consists of numerous micro-blocks, including the Erguna Block, Xing’an Block, Songnen-Zhanggaungcai Range and Jiamusi-Khanka massifs or terranes (Ge et al. Reference Ge, Wu, Zhou and Zhang2005; Huang et al. Reference Huang, Zhao, Zhang, Hou, Chen, Zhang and Depaolo2006; Li, S.K. et al. Reference Li, Liu, Zhou and Liu2020). The NCC, the oldest and largest known craton in China, is divided into the Western Block and the Eastern Block, which amalgamated along the Trans-North China Orogen around 1.85 Ga (Zhao et al. Reference Zhao, Cawood, Li, Wilde, Sun, Zhang, He and Yin2012). Jilin Province features a series of discontinuous Permian-Triassic sedimentary sequences along the Changhun-Yanji suture, witnessing the amalgamation of NE China blocks and the NCC, preserved within the extensive “granite ocean” (Cao et al. Reference Cao, Xu, Pei, Wang, Wang and Wang2013). The study area in the Wangqing area in the east of Jilin Province, adjacent to the southeastern XMOB and the northern NCC (Fig. 1a), is pivotal in reconstructing the final closure process of the PAO and the collision between the NCC and NE China.
The tectonic evolution history of NE China is complex, featuring Phanerozoic granitoids and Paleozoic to Mesozoic sediments, such as the Middle Permian Miaoling Formation and the Triassic Kedao Group. Intrusions associated with the PAO tectonic domain are primarily I-type granites and mafic to ultramafic rocks, while those related to the Paleo-Pacific tectonic domain consist mainly of A-type and I-type granites, with fewer mafic intrusions. Different formations often exhibit distinct lithological characteristics and different fossil assemblages. Previous studies on the Miaoling Formation have focused on volcanic interlayers (Lu et al. Reference Lu, Ren, Hou, Li, Hao and Shang2022), while the definition of the Kedao Group remains unclear (Yu, Reference Yu2017). Therefore, for our study, we select the Miaoling Formation and the Kedao Group in the Wangqing area, Jilin Province, as our sampling locations are closer to the Changchun-Yanji suture zone, providing better representation.
Sun (Reference Sun1988) defined the Miaoling Formation as marine siliceous pyroclastic rocks intercalated with intermediate-felsic lavas, siltstone and limestone lenses. It exhibits a conformable contact with the upper Hongtaiping Formation and an angular unconformable contact with the lower Kedao Group. Its lower part is predominantly composed of grey and grey-green feldspathic quartz sandstone, greywacke and siltstone, intercalated with thin lenses of limestone; the upper part is mainly characterized by sandstone, siltstone and shale, interbedded with thick lenses of limestone.
Yin et al. (Reference Yin, Li, Wang, Hu, Dai and Zhao2011) concluded that the Kedao Group consists of Permian marine strata, divided into the Shanguqi and the Tanqian formations, which are mainly composed of fluvio-lacustrine deposits. Its upper part is in parallel unconformity with the Daxinggou Group, and the lower part is in angular unconformity with the Miaoling Formation. This group consists mainly of conglomerate, tuffaceous siltstone, arkose and shale with intercalated allochthonous limestone blocks (Shen et al. Reference Shen, Du, Han, Song, Han, Zhong and Ren2019; see Fig. 3 for more details).
Stratigraphic columns of the study area with sampling locations.

2. b. Sample descriptions
Five samples were collected in the study area (Fig. 2), including mudstone 23JL34, grey-black mudstone 23JL36 and graywacke 23JL38 from the Miaoling Formation and grey-black siltstone 23JL30, blueish-grey mudstone 23JL33 from the Kedao Group.
2. b.1. Miaoling formation
Samples 23JL34 (43°34′57.35″N, 129°34′0.75″E) and 23JL36 (43°25′36.77″N, 129°32′16.37″E) are both mudstones with over 90% argillaceous content; the primary difference is their colour under microscope, with 23JL34 appearing yellow-brown (Fig. 4a and d) and 23JL36 grey-black (Fig. 4b and e).
Field photographs (a-c) and photomicrographs (d-f) of analyzed samples from the Miaoling Formation.

Sample 23JL38 (43°3′12.36″N, 129°51′48.77″E) is a graywacke from Shixian town, characterized by low maturity, with 50% matrix and 50% clastic fragments, featuring 70% quartz, 5% polycrystalline quartz and 25% feldspar, with poorly sorted, sub-rounded grains and aligned mineral fragments (Fig. 4c and f).
2. b.2. Kedao group
The Kedao Group is dominantly exposed in Miaoling, Kedao, Xiangrenping, Houdidong, Wangqing and Sidonggou in the Yanbian area, with an exposed area of approximately 189 km2 (RGSR, 2007). Predominantly composed of conglomerate and tuffaceous siltstone, these strata contain few fossils and exhibit contested age estimates (BGMRJP, 1997). While some studies suggest a Permian origin (BGMRJP, 1997), recent evidence indicates an Early-Middle Triassic age, supported by Triassic fossils (Zhou, Reference Zhou2009) and geochronologic data from the Yanji area.
Sample 23JL30 (43°27′53.65″N, 129°43′24.31″E) is a grey-black siltstone from the eastern Miaoling Quarry, characterized by low maturity and composed of 35% matrix and 65% clastic fragments. It comprises 80% quartz and 20% feldspar, featuring a clastic texture with poorly sorted, sub-rounded grains and a clear alignment of mineral fragments (Fig. 5a and c).
Field photographs (a-b) and micrographs (c-d) of analyzed samples from the Kedao Group.

Sample 23JL33 (43°34′0.38″N, 129°36′3.54″E) is a blueish-grey mudstone in the southwest of Tianqiaoling town, containing over 90% argillaceous materials and presenting challenges for mineral identification (Fig. 5b and d).
3. Analytical methods
3. a. LA-ICP-MS zircon U-Pb dating
Selected zircon grains (Fig. 6) were mounted into an epoxy resin disc and polished to about half-sections to expose grain interiors. Cathodoluminescence (CL) images coupled with transmitted and reflected light micrographs were obtained to examine the internal structures. Zircon U-Pb isotopic and trace element analyses were performed using an ASITM RESOlution-LR Series 193 nm excimer laser ablation instrument (LA) coupled with Thermo ScientificTM iCAPTM RQ series inductively coupled plasma mass spectrometry (ICP-MC) at Key Laboratory of Orogen and Crust Evolution, Peking University and Hebei Key Laboratory of Strategic Critical Mineral Resources, Hebei GEO University. The laser spot diameter is 29μm, the frequency is 6 Hz and the energy density is 3 J/cm2. High-purity argon gas is used as the carrier gas and high-purity He and N2 gas are used to increase sensitivity. The background of 204Pb and 202Hg is usually less than 100 cps. Calibration for the zircon U/Pb ratios and trace elements was carried out by using the standard zircon 91500 (1062 Ma; Wiedenbeck et al. Reference Wiedenbeck, Alle, Corfu, Griffin, Meier, Oberli, Vonquadt, Roddick and Spiegel1995) and glass standard NIST 610, respectively. Zircon standard Plésovice (337 Ma; Sláma et al. Reference Sláma, Košler, Condon, Crowley, Gerdes, Hanchar, Horstwood, Morris, Nasdala, Norberg, Schaltegger, Schoene, Tubrett and Whitehouse2008) and GJ-1 are also used to supervise the deviation of age measurement/calculation. Those external standards were analyzed once per five unknown samples. The contents of trace elements in all zircons were also calculated using 91Zr as an internal standard. Isotopic ratios and element concentrations of zircons were calculated using GLITTER (ver. 4.4.2, Macquarie University) and iolite ver. 4.3.0. The common lead was corrected using LA-ICP-MS Common Lead Correction (ver. 3.15), following the method of Anderson (Reference Andersen2002). Concordia diagrams and weighted average plots were obtained using Isoplot/Ex (3.0) (Ludwig, Reference Ludwig2003). Probability density distribution plots were produced using AgeDisplay (Sircombe, Reference Sircombe2004). Uncertainties on individual analyses are reported at the 2σ and mean ages for pooled U/Pb analyses are calculated at a 95% confidence interval.
Cathodoluminescence (CL) images of representative detrital zircons from all dated samples. Circles mark dating spots (red for U-Pb isotopic tests, yellow for Hf isotopic tests.). Below zircons refer to the U-Pb ages, above are dating numbers.

All the errors are within 2σ interval, and the isotopic ages plotted in the diagrams for the relative probability of the ages of the samples. The 207Pb/206Pb age is used when the age is over 1000 Ma, while the 206Pb/238U age is used when the age is younger than 1000 Ma due to the imprecise measurement of 207Pb in young grains (Sircombe, Reference Sircombe1999). The ages with discordance degree over 10% were excluded when Mapping.
3. b. Major and trace element determinations
The siltstone samples used for whole-rock analysis were crushed to ∼200 mesh in an agate mill after the removal of altered surfaces. Major and trace elements compositions were determined by using an X-ray fluorescence spectrometer and ICP-MS (Agilent 7700x), respectively, at the Key Laboratory of Mineral Resources Evaluation in Northeast Asia, Ministry of Natural Resources, Jilin University, Changchun, China, after the sample powders had been dissolved in Teflon bombs. The analytical results for the BHVO-1 (basalt), BCR-2 (basalt) and AGV-1 (andesite) standards yielded values of analytical precision that were better than 5% for major elements and 10% for trace elements (Rudnick et al. Reference Rudnick, Gao, Ling, Liu and McDonough2004).
3. c. Hf isotope analysis
Zircon Hf isotope ratios were measured using a Neptune (Plus) MC-ICP-MS (ThermoFisher ScientificTM, USA) equipped with an ASITM RESOlution-LR Series 193 nm excimer laser ablation instrument, which is hosted at the Hebei Key Laboratory of Strategic Critical Mineral Resources, Hebei GEO University, China. These analyses were performed with a laser beam diameter of ca. 43 μm and 5 Hz repetition rate, yielding a signal intensity of ∼1.2 v at 179Hf during the analysis of the standard zircon GJ-1. The ablation time is 40 s, yielding pits of 30–40 μm deep. Masses 172, 173, 175, 176, 177, 178, 179 and 180 were simultaneously measured in static-collection mode. Standard zircons GJ-1 were used as external standards and were analyzed twice before and after every 10 analyses. The resulting data were normalized to 179Hf/177Hf = 0.7325 using an exponential correction for mass bias. The interference of 176Lu on 176Hf was corrected by measuring the intensity of the interference-free 175Lu isotope and using the recommended 176Lu/175Lu ratio of 0.02655. The mean 173Yb/172Yb ratio on the zircon sample itself was measured to calculate the mass fractionation factor βYb, and the signal intensity of 176Yb was calculated based on the signal intensity of 173Yb and the calculated βYb, and then used to correct the interference of 176Yb on 176Hf.
4. Analytical results
4. a. Zircon U–Pb dating
4. a.1. Miaoling formation
A total of 142 concordant U-Pb dating analyses from three samples in this study were obtained, and the results are given in Supplementary Table 1. All dated zircons, ranging in size from 30–220 μm, are euhedral to subhedral with some corrosion marks (Fig. 6). Their high Th/U ratios of 0.02–2.17 (over 98% are above 0.1) and clear oscillatory zones (Fig. 6) indicate a magmatic origin (Wu & Zheng, Reference Wu and Zheng2004).
In sample 23JL34, 42 zircon grains yield concordant ages ranging from 248 ± 9 Ma to 915 ± 26 Ma (Fig. 7a; Supplementary Table 1), grouped as 248–284 Ma (42 grains, peaking at 254 Ma), 316–500 Ma (12 grains, peaking at 410 Ma) and 638–915 Ma (6 grains) (Fig. 7b). The youngest ages yield the 206Pb/238U weight mean age of 252 ± 3.7 Ma (Fig. 7c; Mean Square Weighted Deviation (MSWD) = 0.086, n = 18), with a mean Th/U ratio of 0.64.
U-Pb concordia diagrams of detrital zircons from the Miaoling Formation; ellipses represent 2σ uncertainties (blue ellipses represent the group of the youngest concordant ages).

In sample 23JL36, 50 concordant zircons show concordant ages from 247 ± 15 Ma to 428 ± 10 Ma (Fig. 7d; Supplementary Table 1), predominantly in the age group of 247–276 Ma (47 grains, peaking at 258 Ma) (Fig. 7e). The youngest zircons yield the 206Pb/238U age of 253 ± 2.9 Ma (Fig. 7f; MSWD = 0.22, n = 28), with a mean Th/U ratio of 0.53.
For sample 23JL38, 50 zircon grains yield concordant ages from 249 ± 6 Ma to 1420 ± 19 Ma (Fig. 7g; Supplementary Table 1), which can be subdivided into groups of 249–303 Ma (25 grains, peaking at 256 Ma), 463–553 Ma (10 grains, peaking at 503 Ma) and 623–1420 Ma (15 grains) (Fig. 7h). The youngest zircons yield the 206Pb/238U weight mean age of 254 ± 3.1 Ma (Fig. 7i; MSWD = 0.30, n = 13), with a mean Th/U ratio of 0.57.
4. a.2. Kedao group
A total of 89 concordant U-Pb dating analyses from two samples in this study were obtained, and the results are given in Supplementary Table 1. All dated zircons, ranging in size from 30 to 200 μm, are euhedral to subhedral with some corrosion marks (Fig. 6). They exhibit high Th/U ratios of 0.08–2.13 (over 98% are above 0.1) and clear oscillatory zones (Fig. 6), indicating a magmatic origin (Wu & Zheng, Reference Wu and Zheng2004).
For sample 23JL30, 57 zircons yield concordant ages ranging from 238±8 Ma to 1178±34 Ma (Fig. 8a; Supplementary Table 1), falling into groups of 238–271 Ma (29 grains, peaking at 246 Ma), 303–363 Ma (6 grains, peaking at 337 Ma), 405–532 Ma (11 grains) and 707–1178 Ma (11 grains) (Fig. 8b). The youngest concordant zircon yields the 206Pb/238U age of 245 ± 2.7 Ma (Fig. 8c; MSWD = 0.31, n = 18), with a mean Th/U ratio of 0.52.
U-Pb concordia diagrams for detrital zircons from the Kedao Group; ellipses represent 2σ uncertainties (blue ellipses represent the group of the youngest concordant ages).

For sample 23JL33, 32 concordant zircons yield a broad age spectrum ranging from 237 ± 6 Ma to 1801 ± 19 Ma (Fig. 8d; Supplementary Table 1), which can be divided into groups of 237–310 Ma (22 grains, peaking at 242 Ma), 445–708 Ma (9 grains, peaking at 460 Ma and 518 Ma) and 1801 Ma (Fig. 8e). The youngest zircons with a mean Th/U ratio of 0.66 yield the 206Pb/238U age of 242±4.8 Ma (Fig. 8f; MSWD = 0.48, n = 7).
4. b. Major and trace elements
4. b.1. Major elements
Whole-rock major and trace elemental analyses were carried out on the fifteen sandstones and the data are provided in Supplementary Table 2. Samples from the Miaoling Formation have higher contents of TFe2O3, CaO, MgO, Na2O, Ti2O, P2O5 and MnO, but lower contents of SiO2, Al2O3 and K2O than those from the Kedao Group. The SiO2/Al2O3 ratios are relatively low (3.13–5.68; average 3.92), classifying the samples as immature rocks (Peittijohn et al. Reference Pettijohn, Potter and Siever1972; Herron, Reference Herron1988). In the lithological discrimination (Fig. 9), all samples from both formations are plotted in the greywacke area, consistent with our microscopic observations (Figs. 4 and 5).
Geochemical classification diagrams of the Miaoling Formations and Kedao Group (after Pettijohn et al. Reference Pettijohn, Potter and Siever1972 and Herron, Reference Herron1988).

4. b.2. Trace elements
The chondrite-normalized Rare Earth Elements (REEs) distribution patterns of all samples are similar to those of the average upper continental crust (Rudnick & Gao, Reference Rudnick and Gao2014), featuring enriched Light Rare Earth Elements (LREEs) ((La/Yb)N = 1.79–7.13; averagely 4.29), flat Heavy Rare Earth Elements (HREEs) ((Gd/Yb)N = 0.95–2.42; averagely 1.45) and slight to moderate negative Eu anomalies (Fig. 10a), with no Ce anomaly. The enrichment of LREEs and depletion in HREEs are obvious for all samples, reflected in their similar right-dipping curves. The mantle-normalized multi-element variation diagram of trace elements shows a consistent trend (Fig. 10b), indicating depletion of high-field strength elements (HFSE) Nb, Ta and of large-ion lithophile elements Sr, while showing slight enrichment in Ba, Th, La, Ce, Nd, and Sm in HFSE and Zr, K in large-ion lithophile elements, although the enrichment of La and Ce is not conspicuous.
Chondrite-normalized REE patterns (left) and Primitive Mantle trace element diagrams (right) for the studied sandstones. The normalizing values for REE and trace elements are from McDonough & Sun (Reference McDonough and Sun1995) and Boynton (Reference Boynton1984), respectively. Data for the average upper continental crust are from Rudnick & Gao (Reference Rudnick and Gao2014).

4. c. Hf Isotope results
We conducted Hf isotope analysis on representative Paleozoic to Mesozoic zircon grains from sedimentary rocks of the Miaoling Formation and Kedao Group (Supplementary Table 3 and Fig. 11).
Hf isotopic compositions of detrital zircons from Miaoling Formation (yellow) and Kedao Group (blue) in the study area (Yang et al. Reference Yang, Wu, Shao, Wilde, Xie and Liu2006).

The Hf isotopic compositions of 28 detrital zircons from the Miaoling Formation (23JL34, 23JL36 and 23JL38) were analyzed. Paleozoic zircons (495–254 Ma) exhibit 176Hf/177Hf ratios ranging from 0.2823145 to 0.2829695, with εHf(t) values varying between −6.09 and 12.43, and the TDM2 are 1830–493 Ma. Mesozoic zircons (251–247 Ma) exhibit 176Hf/177Hf ratios ranging from 0.282512 to 0.282947, with εHf(t) values varying between -3.90 and 11.5, and the TDM2 ranging from 1272 to 488 Ma (Supplementary Table 3).
The Hf isotopic compositions of 12 detrital zircons from the Kedao Group (23JL30 and 23JL33) were analyzed. Paleozoic zircons (438–252 Ma) exhibit 176Hf/177Hf ratios ranging from 0.2824738 to 0.282837, with εHf(t) values varying between -2.20 and 7.59, and the TDM2 of 1499–794 Ma. Mesozoic zircons (250–239 Ma) exhibit 176Hf/177Hf ratios ranging from 0.2825632 to 0.282849, with εHf(t) values varying between -2.07 and 7.66, and the TDM2 of 1407–784 Ma (Supplementary Table 3).
5. Discussion
5. a. The sedimentary ages of the miaoling formation and kedao group
The deposition time of a sedimentary strata is much younger than its sediments, allowing detrital zircons within a formation to help constrain the maximum deposition ages (Fedo, Reference Fedo2003). This method relies on the assumption that the U-Pb system of analyzed zircons remained undisturbed by post-depositional tectonic-metamorphic or hydrothermal events (Zeh & Gerdes, Reference Zeh and Gerdes2012). In this study, combined with age-diagnostic fossils and intruded dykes, the mean age of the youngest overlapping zircon grains at 2σ uncertainty (Dickinson & Gehrels, Reference Dickinson and Gehrels2009) was used to estimate the maximum deposition ages of the Miaoling Formation and Kedao Group in Wangqing area.
5. a.1. Miaoling formation
Extensive research has been conducted on the Miaoling Formation; however, its deposition time remains a point of contention. Gathering all data from these three samples (23JL34, 23JL36 and 23JL38), the maximum depositional age of the Miaoling Formation was determined to be late Permian by the 57 youngest concordant zircons having a weighted mean 206Pb/238U age of 253 ± 1.9 Ma (Fig. 14d; MSWD = 0.19, n = 57). Among all 142 concordant zircons, only 21 are older than 600 Ma, with the oldest three grains yielding the 207Pb/206Pb age of 1005 ± 36 Ma, 1209 ± 24 Ma and 1420 ± 19 Ma (Fig. 14c). Phanerozoic ages peak at 256 Ma (Fig. 14c). This late Permian maximum depositional age is obviously younger than the previously published youngest cluster of zircons in sandstones with the age of ca. 265 Ma (Lu et al. Reference Lu, Ren, Hou, Li, Hao and Shang2022).
5. a.2. Kedao group
Divergent views exist regarding the sedimentary ages of the Kedao Group, ranging from the Late Permian to the Late Triassic (Zhou, Reference Zhou2009; Yu, Reference Yu2017; Zhou et al. Reference Zhou, Pei, Wang, Cao, Xu, Wang and Zhang2017; Du et al. Reference Du, Han, Shen, Han, Song, Gao, Han and Zhong2019). Combining all the data from two samples together, the 20 youngest concordant zircons of the Kedao Group yielded a weighted mean 206Pb/238U age of 243 ± 2.7 Ma (MSWD = 0.24, n = 20) (Fig. 14b), implying the maximum depositional age of Middle Triassic (ca. 243 Ma). Precambrian zircons constitute a significant proportion in all analyses (15.7%), with 14 grains older than 600 Ma, while the Phanerozoic ages with peaks of 245 Ma and 468 Ma (Fig. 14a).
5. b. Provenance analysis of Miaoling Formation and Kedao Group in the study area
The chemical index of alteration (CIA) is useful for quantitatively assessing weathering intensity (Fedo et al. Reference Fedo, Nesbitt and Young1995; Nesbitt & Young, Reference Nesbitt and Young1984). The samples show an average CIA value of 68.60, reflecting weak initial chemical weathering (Fig. 12a; Fedo et al. Reference Fedo, Nesbitt and Young1995). In the A-CN-K diagram (Fig. 12b), the average Chemical Index of Weathering is 77.85, about 10% higher than the CIA. The weathering trend deviates slightly to the right (Fig. 12a), indicating a potassium metasomatism influence during diagenesis, which indicates a nearby source and a short transportation distance. The intersection of the weathering trend line and the plagioclase-K-feldspar line indicates a higher plagioclase content than K-feldspar in parent rocks (Fedo et al. Reference Fedo, Nesbitt and Young1995), indicating a provenance related to felsic igneous. Analyzed detrital zircons, in this study, show a positive correlation between U and Y concentrations, suggesting origins from intermediate-acidic igneous rocks such as granite, syenite and pegmatite. The trace element analysis of zircons also indicates that the parent rocks were primarily felsic igneous, although some points suggest minor mixture of mafic rocks (Fig. 13a, b, c, and d). Overall, these characteristics indicate that the REE contents of the sandstones approximate the global average for continental upper crust, with their provenance related to felsic rocks in the upper crust.
A-CN-K weathering diagram of major elements (after Nesbitt & Young, Reference Nesbitt and Young1984) in sandstones from the Wangqing area. The solid arrow represents the ideal weathering trend line of each igneous rock, according to data from Condie (Reference Condie1993). A: Al2O3, CN: CaO*+Na2O, K: K2O.

The fields of zircon compositions used as discriminants for different rock types (Belousova et al. Reference Belousova, Griffin, O’Reilly and Fisher2002). (a) Zircon Y versus U, (b) Zircon Nb versus Ta, (c) Zircon Y versus Yb/Sm, (d) Zircon Y versus Nb/Ta, (e) Zircon Nb/Hf versus Th/U (Yang et al. Reference Yang, Gawood, Du, Huang, Huang and Tao2012) and (f) Zircon Hf/Th versus Th/Nb (Yang et al. Reference Yang, Gawood, Du, Huang, Huang and Tao2012).

Both the sandstones from Miaoling Formation and Kedao Group exhibit characteristics of greywackes (Figs. 4, 5, and 9), with low compositional and textural maturities indicating a nearby provenance. These samples contain a high proportion of argillaceous materials and various sizes of mineral clasts. The CL images of euhedral detrital zircons further support a relatively near source. Possible provenance areas for these formations include the NCC to the south and the NE China massifs (Zhangguangcai Range and Jiamusi-Khanka block) to the north (Fig. 1a). Detrital zircons carry geochronological information about their source rocks and have high diagenesis stability (Wu & Zheng, Reference Wu and Zheng2004), providing them a valuable for provenance analysis of sandstones at plate margins or orogenic belts.
The age distributions of these two formations exhibit the same characteristics, as evidenced by variations in the proportion of each age group and the distribution of peak ages (Fig. 14). The Miaoling Formation is characterized by the overwhelming majority of Phanerozoic zircons (81.3%), with 118 out of 145 grains. A peak age of ca. 256 Ma can be perfectly related to the Permian granitic magmatism (256–252 Ma; Yu et al. Reference Yu, Wang, Xu, Gao and Tang2013) and magmatic activities linked to the westward subduction of an ancient oceanic plate in the southern Jiamusi-Khanka block (272–257 Ma; Long et al. Reference Long, Xu, Guo, Sun and Luan2019). A peak age of ca. 504 Ma is consistent with the ∼500 Ma late Pan-African crystal basement in NE China massifs (Xiong et al. Reference Xiong, Xu, Wang and Ge2020; Hua et al. Reference Hua, Zhang, Zhang, Xiao and Zhang2019; Li, Y. et al. 2017; Wen et al. Reference Wen, Liu, Gao, Xu, Li, Feng, Zhou and Liang2017; Wang et al. Reference Wang, Xu, Meng, Cao and Gao2012; Wu et al. Reference Wu, Sun, Ge, Zhang, Grant, Wilde and Jahn2011; Yang et al. Reference Yang, Ge, Zhao, Dong, Bi, Wang, Yu and Zhang2014; Zhou et al. Reference Zhou, Zhang, Wilde and Zheng2011b, Reference Zhou, Wang, Wilde, Zhao, Cao, Zheng and Zeng2015, Reference Zhou, Wilde, Zhao and Han2018), representing typical differences from the NCC. In addition, a minor peak at 920 Ma in the Neoproterozoic is consistent with the magmatic activities in NE China, implying a strong affinity. Both the Kedao Group and Miaoling Formation exhibit similar magmatic activity peaks at 245 Ma, 468 Ma and 876 Ma, while zircon grains older than 1000 Ma are rare in both formations, lacking distinct peaks, which highlights a clear deviation from the zircon curve of the NCC (Fig. 14).
Vermeesch (Reference Vermeesch2013) proposes multidimensional scaling (MDS) as a valuable statistical tool for geological data analysis. The solid line signifies the strongest correlation, while the dashed line represents the second strongest correlation. Through MDS analysis, both the Miaoling Formation and Kedao Group have a higher affinity with NE China (Fig. 15). Zircons from these formations exhibit similar Hf isotopic compositions consistent with those from the CAOB, in line with the Hf isotope results of the magmatic rocks in the study area (Fig. 11; Shi et al. Reference Shi, Ding, Zhou, Nie and Zhang2022; Lu et al. Reference Lu, Ren, Hou, Li, Hao and Shang2022; Shi et al. Reference Shi, Ding, Liu and Zhou2020), indicating a certain level of data reliability. The TDM2 did not provide evidence for an age of 2.5 billion years. Based on various evidence, we can confidently infer that the samples from both the Miaoling Formation and Kedao Group originated from NE China (Zhangguangcai Range and Jiamusi-Khanka block). Additionally, combined with the findings from other studies, we can boldly infer that the Permian to Triassic stratigraphic source areas in the eastern part of Jilin Province are more closely related to NE China (Sun et al. Reference Sun, Song, Han, Ji, Zhou, Qin, Li and Zhong2023; Du et al. Reference Du, Han, Shen, Han, Song, Gao, Han and Zhong2019, Reference Du, Li, Han and Shen2021; Zhang et al. Reference Zhang, Liang, Liu, Zheng and Li2019), further supported by Hf isotope results from igneous rocks exposed in the surrounding area (Cao et al. Reference Cao, Xu, Pei, Wang, Wang and Wang2013).
a-b. Age probability histograms of detrital zircons with concordant ages and the youngest weight mean age from the Kedao Group; c-d. Age probability histograms of detrital zircons with concordant ages and the youngest weight mean ages of the Miaoling Formation; e. The data originate from NE China (Zhangguangcai Range and Jiamusi-Khanka block; data from Du et al. Reference Du, Han, Shen, Gao, Han, Song, Li, Zhong, Yan and Liu2016; Meng et al. Reference Meng, Xu, Pei, Yang, Wang and Zhang2011; Wang et al. Reference Wang, Xu, Meng, Cao and Gao2012, Reference Wang, Xu, Xu, Gao and Ge2015; Yu et al. Reference Yu, Wang, Xu, Gao and Tang2013; Luan et al. Reference Luan, Xu, Wang, Wang and Guo2017; Li, Y. et al. 2017; Long et al. Reference Long, Xu, Guo, Sun and Luan2019; Xue et al. Reference Xue, Tang, Xu, Luan, Long and Liu2023; Hua et al. Reference Hua, Zhang, Zhang, Xiao and Zhang2019; Li, H.D. et al. 2022; Meng et al. Reference Meng, Liu, Liang, Qin, Ju and Li2017; Mou et al. Reference Mou, Pei, Shi and Wei2023; Pu et al. Reference Pu, Zhang, Guo, Zeng, Fu, Zhang and Liu2015; Wen et al. Reference Wen, Liu, Gao, Xu, Li, Feng, Zhou and Liang2017; Xiong et al. Reference Xiong, Xu, Wang and Ge2020; Zhang et al. Reference Zhang, Wang, Zang, Li, Li, Liu, Liu and Li2021; Zhao et al. Reference Zhao, Xu, Zhang, Ni and Ma2021; Zhao et al. Reference Zhao, Tang, Yang, Zhang and Luo2023; Zhou et al.Reference Zhou, Jie, Wilde and Guo2013). f. The data originate from North China Craton; data from Liu et al. Reference Liu, Zhang, Yin, Cheng, Liu, Zhao, Chen and Wang2020, Reference Liu, Zhang, Liu, Yin, Xu, Cheng, Zhao and Wang2021; Chen et al. Reference Chen, Xing, Liu, Li, Yang, Tian, Yang and Wang2017, Reference Chen, Li, Xing, Yang, Tian, Zhang, Li, Liu and Yang2020; Fu et al. Reference Fu, Sun, Wang, Zhong, Na, Yang, Zhang and Yu2018; Li, G.S. et al. 2022; Liu et al. Reference Liu, Peng, Zhao, Cui, Yang and Wen2018; Pei et al. Reference Pei, Wang, Cao, Xu and Wang2014; Peng et al. Reference Peng, Liu, Zhao, Zhao, Cui, Yang, Zhao and Wen2020; Peng & Wang, Reference Peng and Wang2018; Shao et al. Reference Shao, Li, Wang, Chen and Ren2014; Yang et al. Reference Yang, Liu, Song, Yang, Wang and Wang2022; Zhang et al. Reference Zhang, Jin, Wang, Zheng, Li and Li2015; Zhang et al. Reference Zhang, Liu, Zhang, Liu, Li, Ge, Liang and Zhao2022; Zhang et al. Reference Zhang, Xing, Ma, Du, Sun, Huang and Cui2013).

Multidimensional scaling (MDS) analysis results of Miaoling Formation, Kedao Group and surrounding potential source areas (NE China and North China Craton). a. After the standard K-S test. b. After the standard Kuiper test. (Vermeesch, Reference Vermeesch2013).

5. c. Tectonic setting
The oceanic subduction-continental collision system has become a research hotspot in recent years (Dai et al. Reference Dai, Li, Li, Somerville, Suo, Liu, Gerya and Santosh2018; Li et al. Reference Li, Suo, Li, Liu, Dai, Wang, Zhou, Li, Liu, Cao, Somerville, Mu, Zhao, Liu, Meng, Zhen, Zhao, Zhu, Yu, Liu and Zhang2018a, b, Reference Li, Suo, Li, Zhou, Santosh, Wang, Wang, Guo, Yu, Lan, Dai, Zhou, Gao, Zhu, Liu, Jiang, Wang and Zhang2019; Yu et al. Reference Yu, Li, Zhang, Peng, Somerville, Liu, Wang, Li, Yao and Li2019a, b, c; Zhang et al. Reference Zhang, Liang, Liu, Zheng and Li2019). The amalgamation of the NE China (XMOB) and the NCC along the SXCYS is widely believed to record the subduction and closure of the PAO (Sun et al. Reference Sun, Song, Han, Ji, Zhou, Qin, Li and Zhong2023), as indicated by the evidence from magmatic rocks, structural features and palaeontological data (Sun et al. Reference Sun, Wu, Zhang and Gao2004; Jia et al. Reference Jia, Hu, Lu and Qiu2004; Wu et al. Reference Wu, Zhao, Sun, Wilde and Yang2007; Cao et al. Reference Cao, Xu, Pei, Wang, Wang and Wang2013; Wang et al. Reference Wang, Xu, Pei, Wang and Li2015a, b; Li et al. Reference Li, Xu, Wang, Tang, Sun and Wang2017; Yang et al. Reference Yang, Sun, Gou and Hou2017; Zhou et al. Reference Zhou, Pei, Wang, Cao, Xu, Wang and Zhang2017; Gu et al. Reference Gu, Zhu, Li, Su, Xiao, Zhang and Li2018; Du et al. Reference Du, Han, Shen, Han, Song, Gao, Han and Zhong2019). In contrast to previous studies, we take a perspective of provenance analysis by concentrating on the sedimentary strata through petrology, geochronology and geochemistry in the Wangqing area along the suture zone between the NCC and NE China (Fig. 1b). The Permian Miaoling Formation major consists of polycyclic sandstone, siltstone, silty mudstone and is the product of an arc-basin series. The Tanqian Formation, representing a muddy construction beneath the Carbonate Compensation Depth line of the abyssal plain, and the Shanguqi Formation, reflecting continental slope turbidites, together constitute the Kedao Group, which belongs to a deep-water slope-basinal sedimentary system (RGSR, 2007). The samples analyzed in this paper align well with previously established conditions. The Miaoling Formation and Kedao Group show distinct characteristics in various tectonic diagrams based on both major and trace elements (Figs. 9 and 10), with all geochemical data indicating their orogenic origin (Fig. 12e and f).
Zircon transport processes mainly influence the age distribution of detrital zircons in the strata, with peak age compositions effectively reflecting the tectonic environment of the sedimentary basin (Cawood et al. Reference Cawood, Hawkesworth and Dhuime2012). The convergent plate boundary is characterized by a large proportion of zircon ages close to the deposition age of the sediment, whereas sediments in collisional, extensional and intracratonic settings contain higher proportions of older ages reflecting the history of the underlying basement (Cawood et al. Reference Cawood, Hawkesworth and Dhuime2012). The majority of detrital zircons from the Miaoling Formation (70%) and Kedao Group (64%) have crystallization ages (CA) close to the depositional ages (DA) (CA-DA < 100 Ma), similar to the sedimentary facies of a convergent environment (Fig.16).
Summary plot of the general fields for convergent (A: red field), collisional (B: blue field), and extensional basins (C: greenfield). From the variations observed between the different fields, a model that predicts the tectonic setting of sedimentary packages of unknown origin is proposed based on differences between the crystallization and depositional ages (CA-DA) of the zircons.

Verma & Armstrong-Altrin (Reference Verma and Armstrong-Altrin2013) developed new discriminant-function-based major-element diagrams for classifying siliciclastic sediments from island or continental arc, continental rift and collision settings. The results of all sandstones indicate that the Wangqing area is still within the continental island arc (Fig. 17), reaffirming previous conclusions and indicating ongoing subduction of the PAO in this area during the Middle Triassic.
New discriminant-function multidimensional diagram for high-silica (a) and low-silica (b) clastic sediments from three tectonic settings (arc, continental rift and collision) (Verma & Armstrong-Altrin, Reference Verma and Armstrong-Altrin2013).

Recent studies on PAO evolution have documented considerable sedimentary evidence. Research on the southern part of the Great Xing’an Range and the Songliao Basin in NE China indicates that the PAO closed on the western side of the Changchun-Yanji suture zone in the Late Permian (He et al. Reference He, Fang, Zhang, Pei, Ming, He and Zhang2023; Zhang et al. Reference Zhang, Qiu, Yan, Zhao, Cai, Zhang, Chen, Li, Song, Zheng, Sun, Gong and Ariser2023). However, an alternative argument proposes a delayed closure of the eastern segment between the Middle Triassic and the Late Triassic (Zhang et al. Reference Zhang, Liang, Liu, Zheng and Li2019; Du et al, Reference Du, Han, Shen, Han, Song, Gao, Han and Zhong2019). Igneous rocks in this region provide additional supporting evidence (Cao et al. Reference Cao, Xu, Pei, Wang, Wang and Wang2013; Sun et al. Reference Sun, Song, Han, Ji, Zhou, Qin, Li and Zhong2023). Considering our new data with previously published data, Sun (Reference Sun, Song, Han, Ji, Zhou, Qin, Li and Zhong2023) suggests that the volcanic interlayers of the Yangjiagou Formation formed in a syn-collisional setting, implying a remnant ocean basin remained along the Changchun-Yanji suture zone during the Early Triassic. Furthermore, simulations of the crustal thickness in the central Jilin Province show that the crust gradually thickened from 280 Ma to 245 Ma, with the subduction of oceanic crust contributing to the continuous thickening of the continental crust (Guan et al. Reference Guan, Pei, Wei and Li2023). On a broader scale, Liang et al. (Reference Liang, Liu, Zheng, Li, NEUBAUER and Zhang2019) summarize thermochronological data suggesting that significant strike-slip movement likely occurred in the Late Triassic, attributed to the eastward extrusion of the XMOB and far-field forces related to Late Triassic convergence following the final closure of the PAO.
The Miaoling Formation and the Kedao Group mainly originated from continental island arcs of NE China, including the Zhangguangcai Range and Jiamusi-Khanka block. During their sedimentation, a reduced remnant ocean basin remained in the Wangqing area, indicating that the PAO has not yet completed its closure until the early Middle Triassic (ca. 243 Ma; Fig. 18). Combining previous research suggests the final closure of the easternmost segment of the PAO likely occurred between the latest Middle Triassic and early Late Triassic in a scissor-like manner.
A sketch of the tectonic evolutionary pattern of the Paleo-Asian Ocean during 253–243Ma.

6. Conclusions
This study investigated the geochronology and geochemistry of the sandstones of the Miaoling Formation and the Kedao Group in the Wangqing area of NE China to determine their provenance and tectonic setting.
1. New LA–ICP–MS zircon U–Pb dating results show that the sedimentary rocks from the Miaoling Formation were deposited around 253 Ma, while the maximum depositional age of the Kedao Group is early Middle Triassic (ca. 243 Ma).
2. The Miaoling Formation and the Kedao Group are dominantly composed of Phanerozoic sediments originating from the NE China, suggesting that their parent rocks were likely felsic igneous rocks from an orogenic tectonic setting.
3. The provenance of these sedimentary strata has remained relatively consistent, implying that around 243 Ma, a small remnant ocean basin of PAO still existed in this area, and the continental blocks on the north and south sides had not yet completely converged. The final closure of the easternmost segment of the PAO likely occurred between the latest Middle Triassic and early Late Triassic in a scissor-like manner.
Supplementary material
The supplementary material for this article can be found at https://doi.org/10.1017/S0016756824000359
Acknowledgements
Special thanks to Qi Zheng from the School of Foreign Language Education, Jilin University, for the linguistic review that significantly improved the quality of the manuscript. We are grateful to the reviewers who helped improve the paper, and the editors for handling, editing and advising.
Financial support
This study was supported by the National Key R&D Program of China (Grant No. 2022YFF0800401-2), the National Natural Science Foundation of China (Grant No. 42130305) and Taishan Scholars (tstp20231214).
Competing interests
The authors declare that they have no known competing financial interests or personal relationships that could have appeared to influence the work reported in this paper.


 Open access