
Located on the northern fringe of the Maya central lowlands, the Río Bec region is distinguished from other sectors of the area by its atypical architecture and iconography, as well as its specific settlement patterns. Whereas most of the lowland sites are characterized by an epicenter more densely nucleated than its residential periphery and shaped by large public buildings, the Río Bec site can be defined as a relatively continuous and loose settlement consisting basically of residential clusters scattered over a wide area (Figure 1). Forming clusters not much larger (in structure numbers) than those of the more modest dwellings among which they are inserted, a few large residences are scattered that stand out because of their monumental architecture. These edifices concentrate most of the features of the famous Río Bec architecture and façade decoration. The first archaeologists to explore the region (Merwin Reference Merwin1913; Ruppert and Denison Reference Ruppert and Denison1943; Thompson Reference Thompson1936; and later, Adams Reference Adams and Ashmore1981) had already remarked on this particular regional pattern and applied the term “groups” to the small clusters with monumental edifices. Less interested in settlement patterns, Potter (Reference Potter1977), then Gendrop (Reference Gendrop1983, Reference Gendrop1987) and Andrews (Reference Andrews1999), focused on the architecture, which they studied technically and stylistically. The first stratigraphic excavation of one of the large buildings was done by Thomas in the 1970s in Merwin's Group B (Thomas and Campbell Reference Thomas and Campbell2009), although he also gave attention to local settlement patterns and land use features, which was precisely what Eaton (Reference Eaton1975a, Reference Eaton1975b), Adams (Reference Adams and Adams1977, Reference Adams and Ashmore1981), Peña (Reference Peña Castillo1987), Thomas (Reference Thomas1981), Turner (Reference Turner1983), and Carrasco Vargas (Reference Carrasco Vargas1989, Reference Carrasco Vargas1994; Carrasco Vargas et al. Reference Carrasco Vargas, Boucher and Peña Castillo1986) explored and considered a priority for Río Bec and other sites of the Río Bec region like Chicanna, Hormiguero, and Becan. This divided focus—with architectural style on the one hand, and settlement patterns on the other—is due in part to academic interests and expertise, whereas issues raised by each are obviously deeply connected and must, in some way, be scrutinized together. The Río Bec project (2002–2010) had among its main objectives to understand how the large buildings were technically and stylistically built, when the architectural style emerged and developed, but also what sorts of sociopolitical dynamics are reflected by the overall settlement patterns that include such grand residences; that is, how those edifices had been economically and socially produced. One prerequisite was to rely on a fine-resolution chronology so as to temporally frame the production of the buildings, as well as the formation, growth, and final disintegration of the Río Bec settlement with its conspicuous morphology.
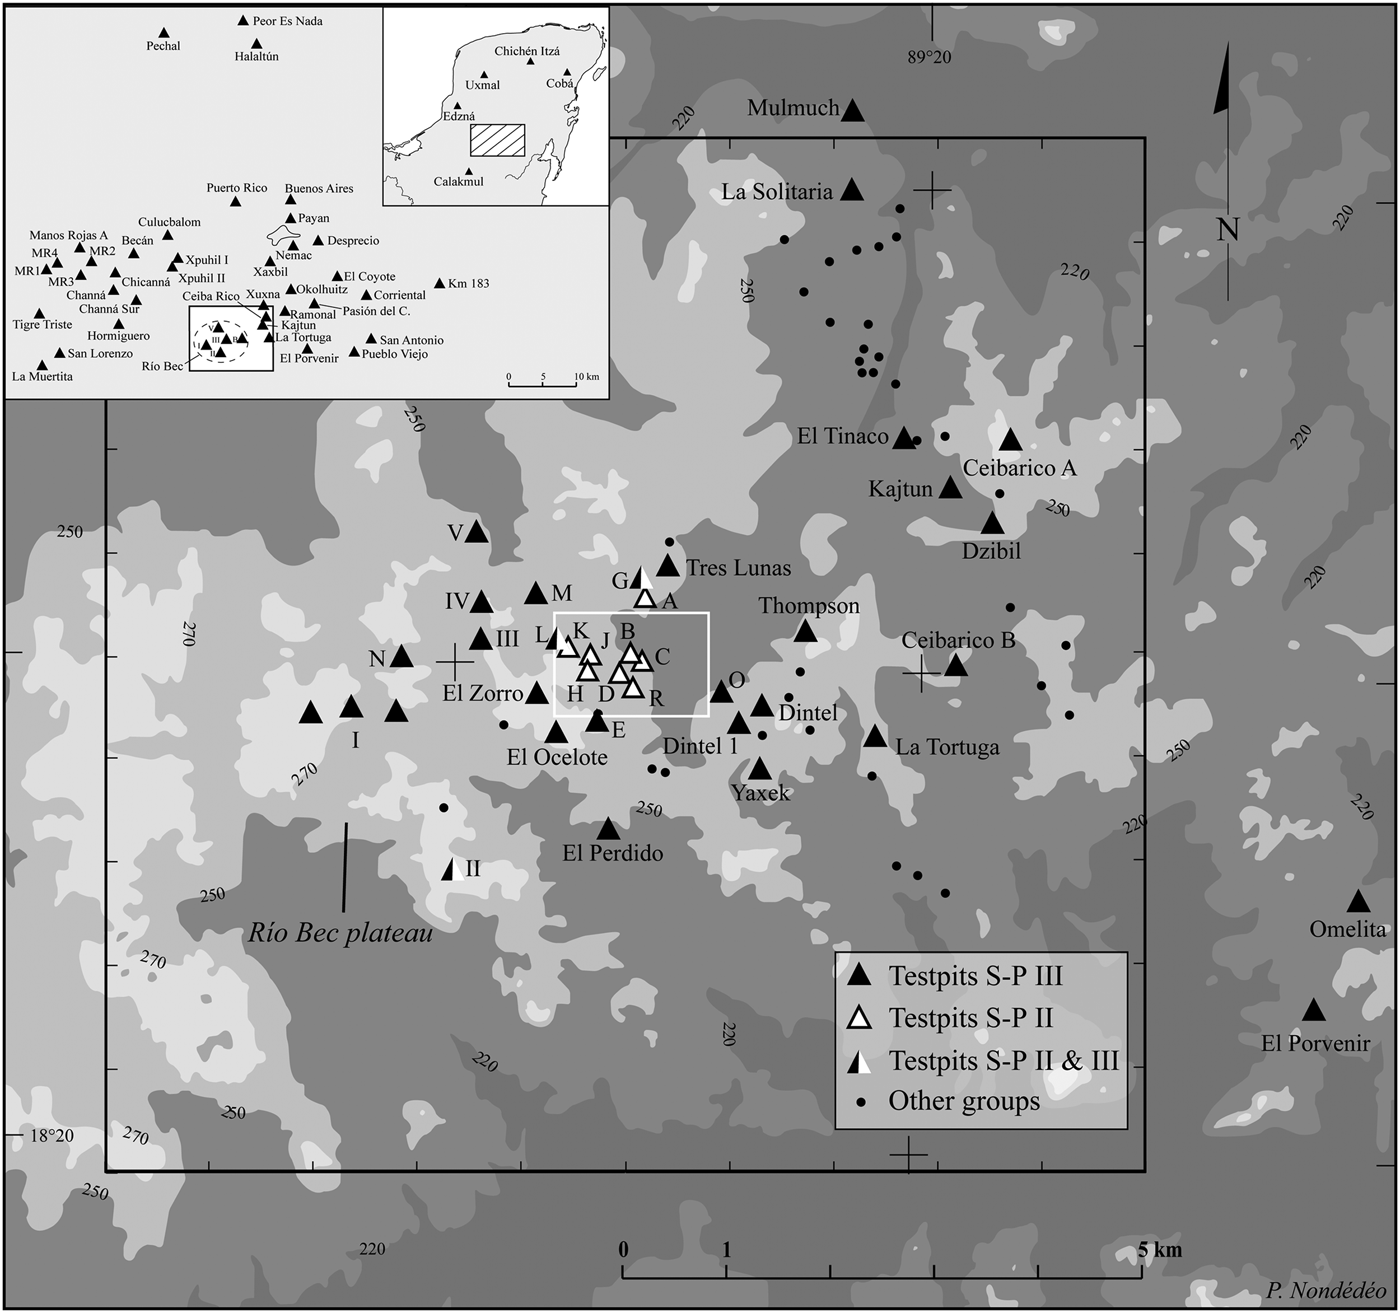
The Río Bec micro-region (100 km2, denoted by the black outline) and nuclear zone (159 ha, denoted by the white outline) showing the location of the 73 monumental groups recorded during the survey. Black triangles represent the groups test-pitted in Sub-Project III; white triangles those test-pitted in Sub-Project II; and the black and white triangles the groups test-pitted in both Sub-Projects. The selected contour lines highlight the Río Bec Meseta (light shade, 250 m asl)—where most of the groups are established—in contrast with the unoccupied drainage zones (dark shade, 200 m asl). Map by Philippe Nondédéo.

The present paper is strictly limited to the temporal framework, the distinct methods used to establish it, and the distinct ways it is applied to both monumental architecture data and those data reflecting settlement dynamics. Although intimately related, Río Bec architecture and the overall peculiar settlement in which it is embedded cannot be dated and dealt with temporally in the same way but, rather, require specific data collection strategies in fieldwork. Also provided here is the preliminary interpretation that the chronological framework offers in terms of both the Río Bec stylistic sequence and what can be termed “the Río Bec settlement history.” Technical and stylistic matters of Río Bec architecture per se are not touched upon here (see Michelet et al. Reference Michelet, Nondédéo, Patrois, Gillot and González G.2013), however, and neither is the spatial analyses of settlement patterns (Nondédéo et al. Reference Nondédéo, Arnauld and Michelet2013), nor any discussion of social and political organization (Arnauld et al. Reference Arnauld, Michelet and Nondédéo2013). For the sake of the present paper, monumental architecture at Río Bec is defined by large vaulted residences consisting of, maximally, a good dozen rooms with masonry benches (Figure 9), each one generally associated with two or three smaller vaulted houses and what appears to be an unvaulted kitchen (according to several excavated cases, such as 5N2b in Group A or 7N3 in Group D). Public buildings like ballcourts, pyramid-temples, and long halls have only been found in three groups: Kajtun to extreme east of the project study area, Group II to the southwest, and Group V to the northwest, with all three groups devoid of residential concentration (see Michelet et al. Reference Michelet, Nondédéo, Patrois, Gillot and González G.2013; Nondedeo et al. Reference Nondédéo, Arnauld and Michelet2013).
The Rio Bec architectural style and its chronology has been the focus of interest for several scholars, including Andrews (Reference Andrews1999), Gendrop (Reference Gendrop1983), and Bueno Cano (Reference Bueno Cano1989, Reference Bueno Cano1994, Reference Bueno Cano1999), who all propose a preliminary stylistic framework (see also Benavides Castillo Reference Benavides Castillo2007; Freer Reference Freer1976, Reference Freer2006; Rojas Durán Reference Rojas Durán1975). This resulted in the placement of the Río Bec apogee in the Late-Terminal Classic period (a.d. 550–950/1000), an interval that we now know rather corresponds to the entire, but gradual development of the Río Bec architectural style. To build a stylistic chronological sequence is nothing new in the field of archaeology. Provided that a representative sample of a wide array of buildings is correctly dated, their seriation requires careful selection of diagnostic features and a chronological framework considered valid for the whole sample. The Río Bec project ceramologist, Sara Dzul, initially relied on the Becan chrono-ceramic sequence established by Ball (Reference Ball1977), although some adjustments were required based on the local context, as settlement histories of both sites are distinct.
Working within this broader chronological framework, we also need to identify construction episodes of either large or small buildings built in reasonably short time spans, not only refining the stylistic sequence, but also reconstructing settlement sociopolitical and economic dynamics. Not all residential clusters or groups in the Río Bec site include monumental buildings that can be dated by stylistic seriation or similar comparative method. Preliminary surveys (Carrasco Vargas et al. Reference Carrasco Vargas, Boucher and Peña Castillo1986; Michelet et al. 2004) identified a large number of smaller residential units surrounding the main buildings, some with Río Bec style houses, yet many with simpler, still vaulted structures, not to mention the unvaulted structure mounds. Their chronological placement, as well as their relationship with the main groups, remained utterly undefined when the project started. It was necessary to date, not only their occupation, but even more importantly, their construction episodes in relation to their monumental neighbors. This was necessary in order to reconstruct moments of emulation, cooperation, and competition among coresident, neighboring social groups. As amply discussed by other papers in this special section (see Arnauld et al. Reference Arnauld, Michelet and Nondédéo2013; Michelet et al. Reference Michelet, Nondédéo, Patrois, Gillot and González G.2013) for the Río Bec region at least—and possibly for the whole Classic Maya lowlands—our postulate is that all aspects of house construction are considered as significantly reflecting determinant social, political, and economic processes. Even though the discussion and interpretation of the latter remain beyond the limits of this paper, their basic definition as chronological markers resting on ceramics, radiocarbon dates, and Maya calendar dates is its main focus.
Below we discuss first how the chrono-ceramic framework has been constructed to answer the specific issues that the Río Bec Project deals with and, second, how a fine-resolution method was devised to date the construction (and occupational) phases of test-pitted and excavated residential units—all selected for their architecture and spatial situation in plausible coresident groups (coresidence is discussed in Arnauld et al. [Reference Arnauld, Michelet and Nondédéo2013]). We then offer a narrative of the Río Bec settlement history at two spatial scales: the “nuclear zone” (159 ha) and the “micro-region” (100 km2), both delineated and (arbitrarily, in some way) defined in what we term the “Río Bec zone” rather than “site” (Figure 1). Both are technical labels without any interpretative meaning, even though at the outset the nuclear zone was defined so as to include most of the then known Río Bec groups, with the famous Group B at its geographic center. The last part of the paper is dedicated to the Rio Bec architectural and stylistic sequence at the micro-regional scale, based on a series of dated construction and occupation episodes for 39 representative buildings with standing architecture.
Whereas the temporal sequence here presented is specific to the Río Bec zone, it holds significance for other neighbouring regions. Considering that the atypical Río Bec region is spatially close to the Maya lowland central area, the multi-faceted knowledge of its chronology should also help locate and define, in time, this regional phenomenon midway between such influential neighbors as Dzibanche and Calakmul, possibly allowing us to achieve, through further research, some understanding of political relations and interactions in this part of the Maya lowlands.
A GENERAL TIME FRAMEWORK FOR DATING BUILDINGS AND SETTLEMENT DYNAMICS
It is important to note that, in terms of queries and methods, both scales of inquiry in the Río Bec project complement one another (Figure 1). When the project began in 2002, 10 of the 25 previously-identified groups located in the 159 ha nuclear zone were considered to belong to the Río Bec style (Carrasco Vargas et al. Reference Carrasco Vargas, Boucher and Peña Castillo1986; Merwin Reference Merwin1913; Périgny Reference Périgny1908; Ruppert and Denison Reference Ruppert and Denison1943; Sapper Reference Sapper1897; Schmidt Reference Schmidt1981; Sulak Reference Sulak2001; Thompson Reference Thompson1936). Encompassing these 25 groups, the micro-region (10 × 10 km in area) has been defined so as to provide a broad spatial context for the nuclear zone, allowing for a better understanding of overall topography and hydrography. During the course of the project research, the nuclear zone scale proved to be the appropriate scale for data collection related to the study of settlement dynamics, whereas the micro-regional scale, after the 2002–2003 surveys that brought many discoveries of additional groups with large buildings, proved more adequate for establishing their construction sequences. In total, between 2003 and 2008, beyond relocating and redescribing the 25 extant groups, we identified 48 “new” monumental groups, bringing the total to 73 in the micro-region (Nondédéo et al. Reference Nondédéo, Arnauld and Michelet2013). The resulting increase in architectural evidence has been extremely useful for developing a stylistic sequence, since no less than 52 of the recorded monumental edifices still have substantial architectural remains—28 of which still retain decorative elements on their façades (Nondédéo and Dzul Reference Nondédéo, Dzul, Castillo and Pacheco2010; Nondédéo and Patrois Reference Nondédéo, Patrois, Monod-Becquelin, Breton and Ruz2010).
For the specific purposes of the targeted stylistic sequence and settlement history, distinct programs of test pits were applied to the work zones. Based on an architectural hierarchy of edifices established separately (see Nondedeo et al. Reference Nondédéo, Arnauld and Michelet2013: Table 5), a selection of 35 representative groups (48% of the sample; Sub-Project III) received 88 test pits (Figure 1). All were dug into the building platform close to the superstructure's exterior façade (as 2 × 2 or 2 × 3 m units) so as to reach all fill layers down to the limestone substrate. As a result of our thorough, systematic survey we discovered that the 159 ha nuclear zone encompasses many more modest and middle-sized residential units than monumental groups (125 residential units versus 73 monumental groups). So as to characterize the dynamics of formation and abandonment of major residences and lesser neighbors, 36 residential units were selected and a systematic program involving 81 test pits was applied (30% of the sample; Sub-Project II) (Figure 2). The test pits were dug either in patios and/or in building platforms (as 2 × 2 or 2 × 3 m units). Nine additional units pertaining to monumental Groups A, B, and D were entirely excavated (including room floors and fill, rear portions, and patio floors; Sub-Project V). Also, seven smaller units were tested to clarify their spatial association with the agrarian system (Sub-Project VIII) (see Lemonnier and Vannière Reference Lemonnier and Vannière2013). Accounting for the latter and Groups A, B and D full-coverage excavations, the total excavated units reached 52 out of 125 (or 42%). It must be emphasized that, in order to reconstruct social dynamics around the best-known monumental units, every minor unit located close to Groups A, B, and D has been tested or excavated (see Arnauld et al. Reference Arnauld, Gongora, Déodat, Castillo and Pacheco2010).
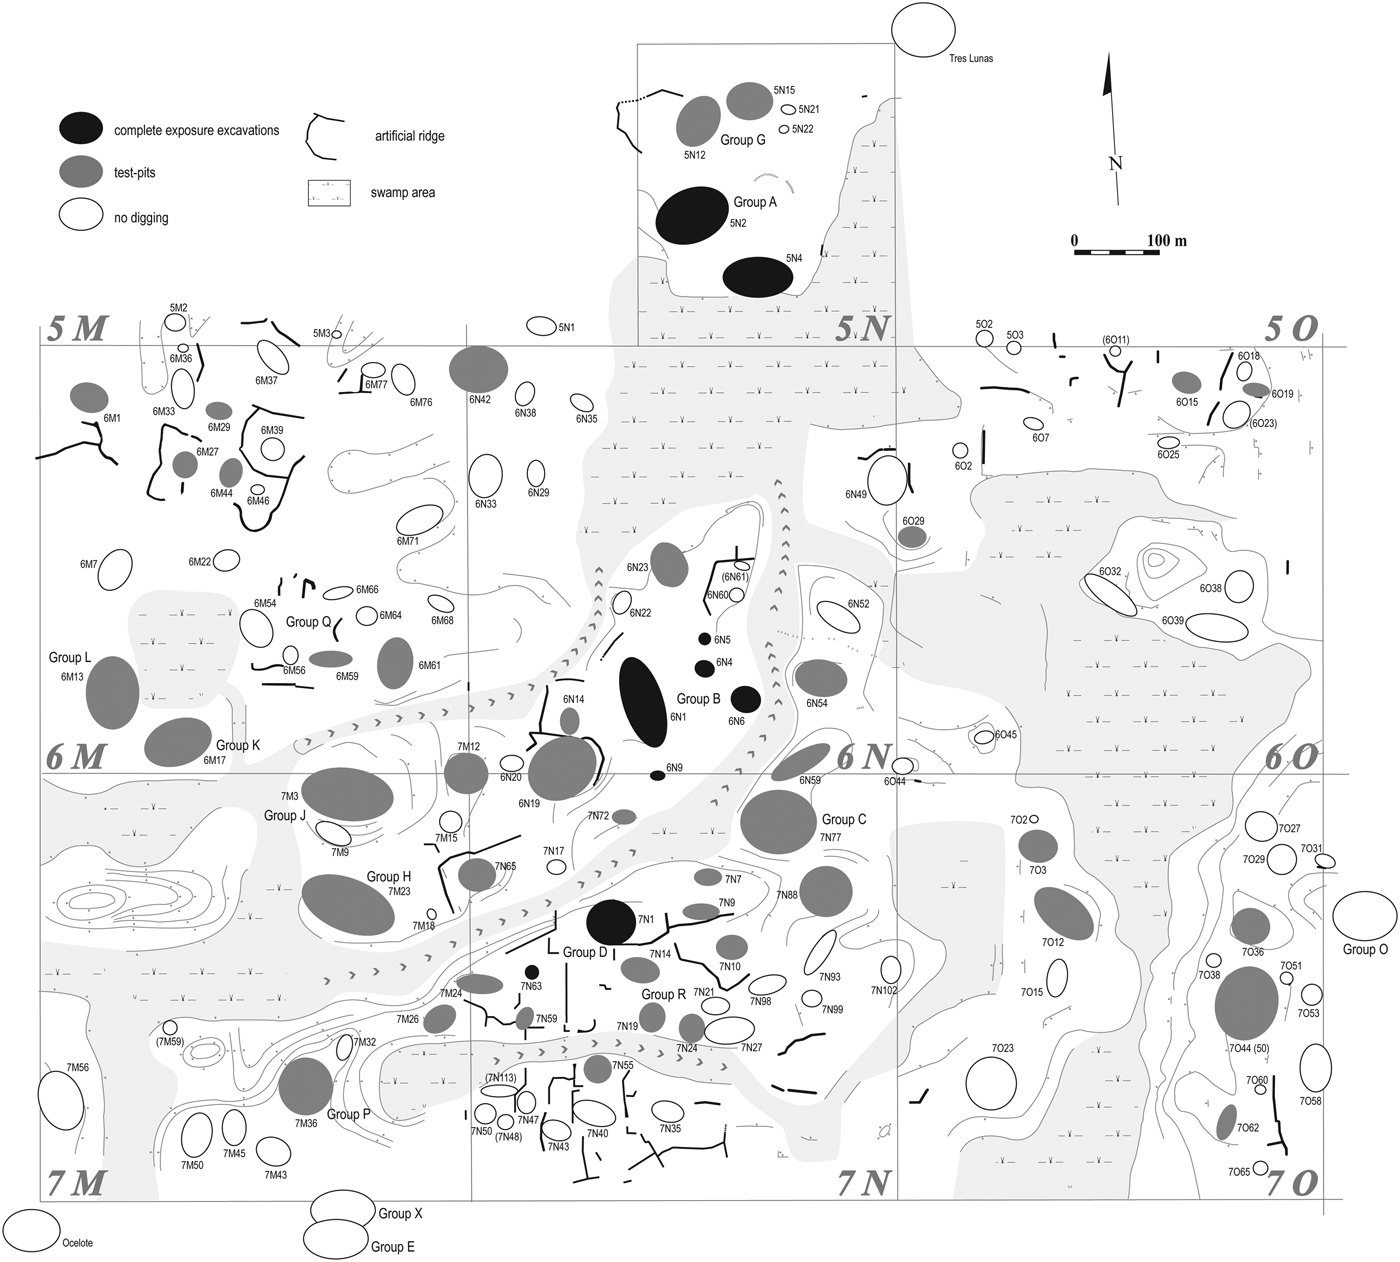
Simplified map of the nuclear zone (159 ha) showing the distribution of excavated units (black ovals), test-pitted units (grey ovals), and unexcavated units (white ovals). Dimensions of oval symbols cover the extent of each residential unit; the largest represent the monumental groups, labeled A-H, J-L, and O-R. Map by Eric Taladoire, M. Charlotte Arnauld, and Philippe Nondédéo.
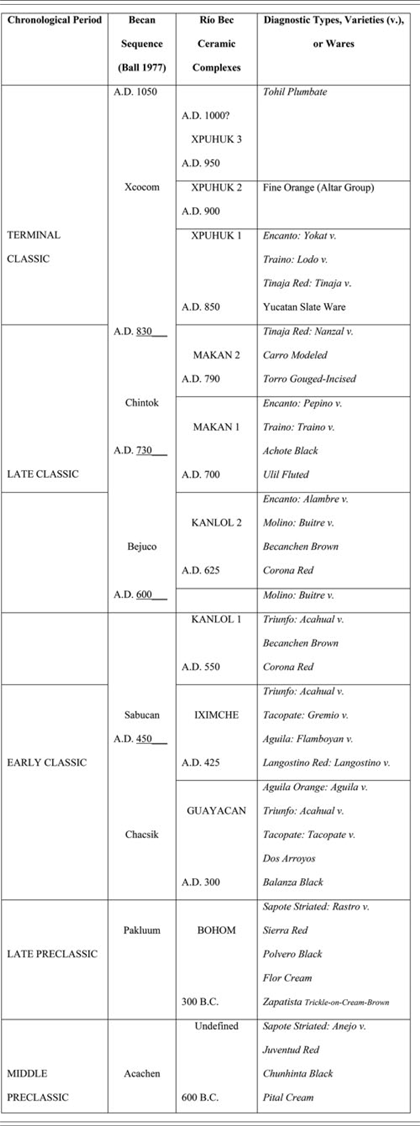
Ceramic material collected from all test pits amounted to about 77,000 sherds, to which must be added those from Groups A, B, and D excavations, for a grand total of approximately 194,000 sherds. Dzul first classified this material according to the Type-Variety method, and drew the main lines of the sequence through definition of seven major complexes (including 138 types and 175 varieties) (Dzul and Taladoire Reference Dzul, Taladoire, Castillo and Pacheco2010). The sequence broadly follows that of Becan sequence divisions defined by Ball (Reference Ball1977), in particular the Bejuco (a.d. 600–730), Chintok (a.d. 730–830), and Xcocom (a.d. 830–1050) phases, with minor local modifications. The sequence begins in the Middle Preclassic (600 b.c.), thus confirming Ball's hypothesis of a Preclassic period occupation of the area, and ends around a.d. 950/1000 with the sporadic presence of Late Postclassic period material.
In an effort to confirm and refine the preliminary ceramic sequence subdivisions, three seriations of ceramic lots were carried out, each corresponding to distinct ceramic collections and scales of analysis; for example, Groups B and D (Sub-Project V), the nuclear zone (Sub-Project II), and the micro-region (Sub-Project III). After discarding quantitatively insufficient, non-chronologically significant, or stratigraphically unsealed and mixed-level lots, Forné sorted the remaining ceramics into three distinct seriation diagrams. As done in previous studies (Forné Reference Forné2006), some of the Type-Variety categories showing similar chronological behavior have been merged in order to obtain statistically and quantitatively representative samples (for example, the “Fine Orange” category includes Altar and Balancan groups). The three seriation sequences were then evaluated individually by means of a factor analysis (principal component analysis), showing the distribution of the seriated typological categories in a multidimensional space according to their degree of dissemblance. The resulting graph is a projection on a two-scale dimension formed by the two most representative axis of the multiscale analysis, identifying coherent clusters of points that are significantly different from others. The method allows the ceramicist to treat enormous quantities of data simultaneously and to validate objectively (even if it is insufficient per se) those results obtained through other means such as, for example, “battleship-curve” sequences (for similar procedures see Drennan Reference Drennan1976; Duff Reference Duff1996; Forné Reference Forné2006; Ichon and Arnauld Reference Ichon and Arnauld1985; Michelet et al. Reference Michelet, Becquelin and Arnauld2000; Robertson Reference Robertson, Robertson and Freidel1986; Viel Reference Viel1993; Viel and Ichon Reference Viel and Ichon1984).
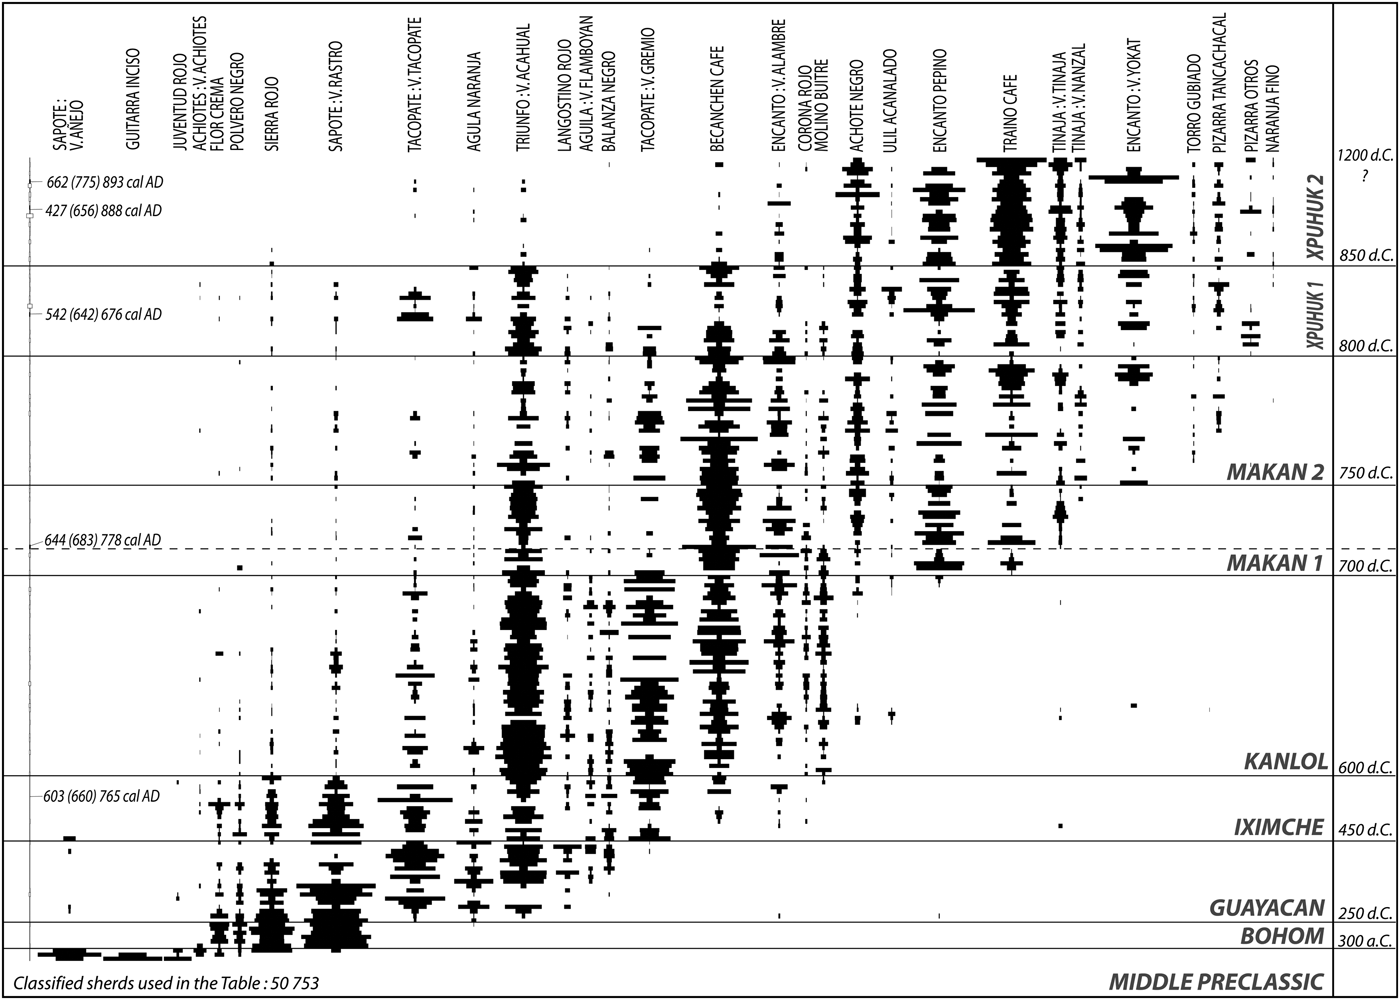
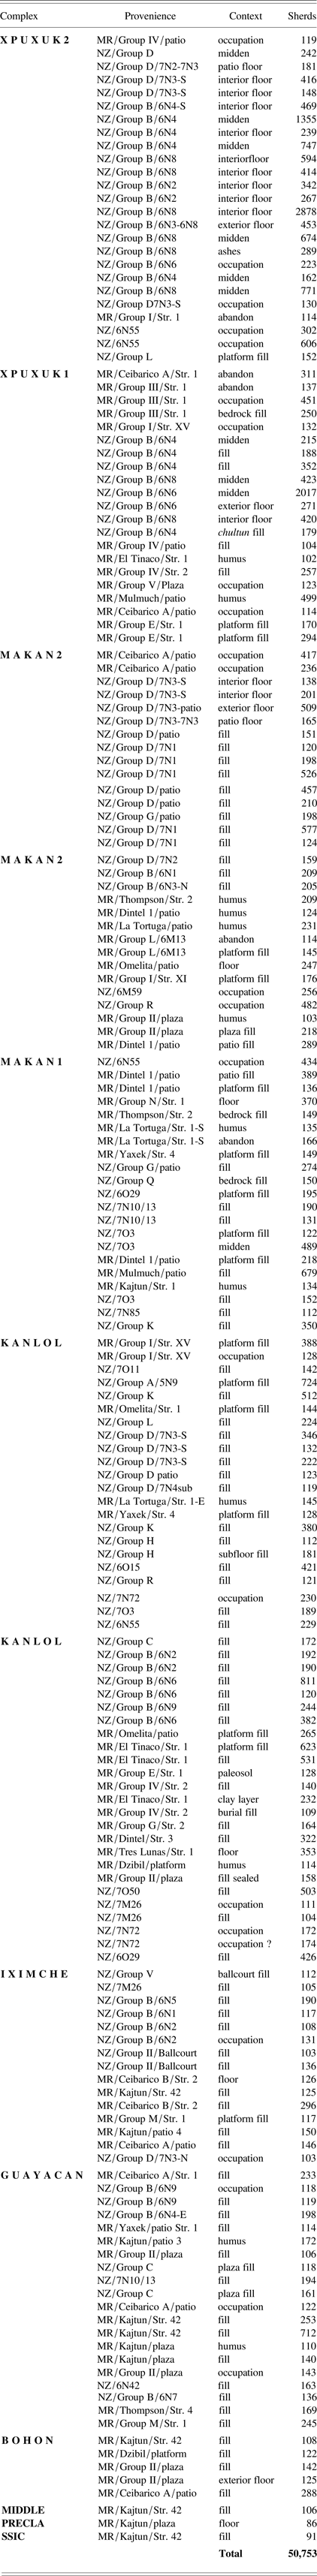
The next step was to build a general framework valid for both the nuclear zone and micro-region scales. Fortunately, the three seriations (totaling 338 lots and 37 types; n = 69,500 sherds) together show coherent variation through time. A final selection of the most discriminant lots and types across the three seriated graphs (187 lots and 30 types; n = 50,753 sherds) allowed Forné to construct a graph that defines the Río Bec general chrono-ceramic sequence. Figures 3 and 4 present the corresponding Río Bec sequence diagram and factor analysis, and Table 1 provides the provenience and contexts of the seriated lots. Owing to this two-step method, the obtained sequence is valid for the entire micro-region occupation—nuclear zone included—and for all digging methods as well (Sub-Projects, see above). The typological composition of the ceramic complexes is defined on the basis of this sequence.
Río Bec sequence based on the frequency seriation of ceramic lots from all excavation and testing Sub-Projects (2002–2010). Table 1 provides the provenience of seriated lots (horizontal lines). The stratigraphic order of lots obtained from the same excavation unit is maintained (the deepest and earliest ones in the lower part; the latest ones in the upper part). Each column represents a ceramic type, variety, group, or a combination of typological categories showing similar behavior in time, sorted from left to right according to their chronological appearance. Each black bar represents the percentage, or frequency, of that ceramic category in the corresponding lot (based on total of sherds per lot. Note that the number of eroded sherds is very low). The trends in typological frequency reflect ceramic change through time rather than space, since all the excavated Río Bec sectors appear mixed in this graph (see Figure 4). Significant, synchronous changes in frequency allowed the analyst to divide the graph into several ceramic complexes. Accepted radiocarbon dates are inserted (left) in the lot they are associated with. Absolute dates given to ceramic complexes are those given in Table 2. Chart by Mélanie Forné.
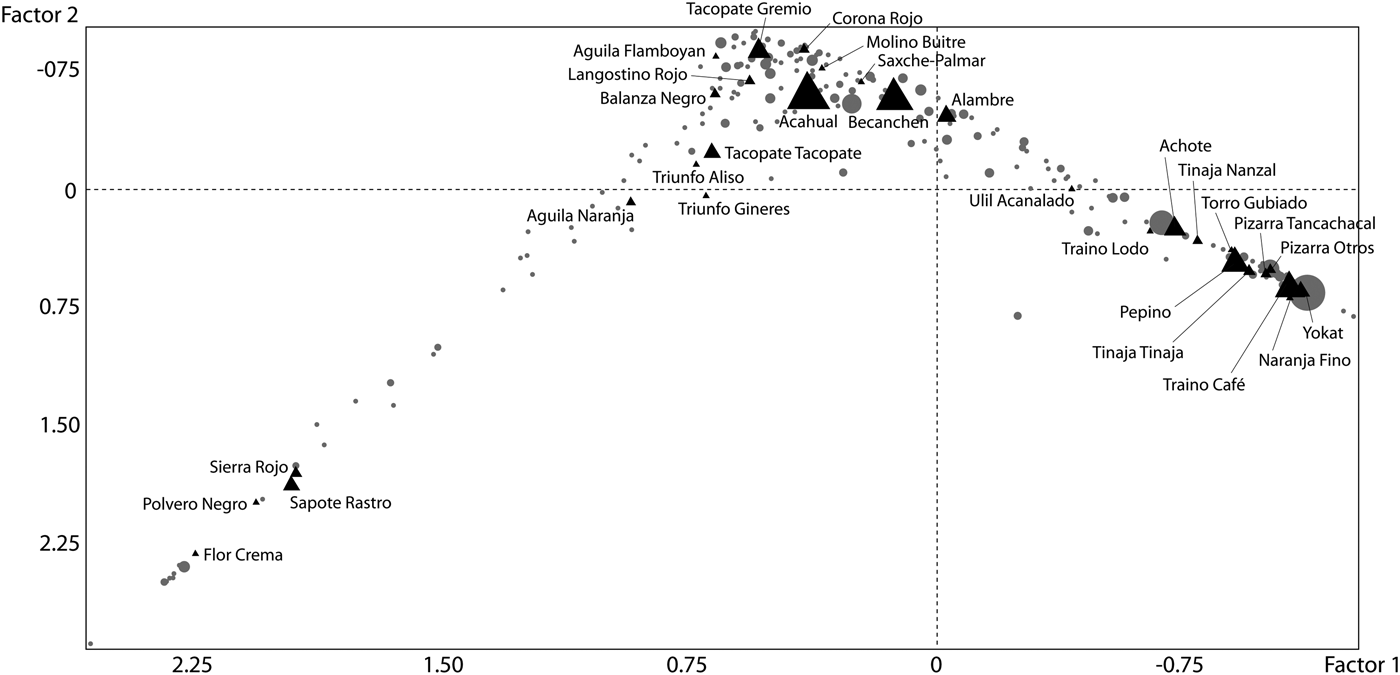
Factor analysis (principal components analysis) evaluating the seriation shown in Figure 3. The graph presents the multivariate distribution of ceramic typological categories (triangles) and excavated lots (gray dots), their size being proportional to their statistical weight. The two principal axes represent 40.26% of the analysis (Factor 1 with a 22.25% representativity and Factor 2 with 18.01%). The distribution in a curve (as per usual in factor analysis) is considered chronologically significant as stratigraphic order is maintained (here from left to right). Distance between groups allowed the analyst to determine clusters, which, in turn, validate the clusters obtained previously in Figure 3, as they show the same association of typological categories and archaeological lots. Middle Preclassic period lots and types were excluded from this graph to avoid an extreme clustering of later units that obscures the pattern. Chart by Mélanie Forné.
Detailed provenience of 187 ceramic lots selected from the three preliminary seriation exercises, resulting in this final graph representing the entire Río Bec chronological sequence (sherd total: n = 50,753). Contexts are located either within the micro-region (MR) or within the nuclear zone (NZ); numerals with letter correspond to the structure code within groups
THE RÍO BEC CHRONO-CERAMIC SEQUENCE
The Río Bec sequence follows the main trends of the Becan sequence (Ball Reference Ball1977), even if some peculiarities unique to Río Bec can be observed. Whereas both sequences start during the Middle Preclassic, the occupation at Becan seems to last far longer than at Río Bec, with an early Postclassic phase clearly attested and illustrated by Chichen Itza-related ceramics—a material totally absent at Río Bec (see also Ball and Taschek Reference Ball, Taschek and Aimers2013). Table 2 outlines the ceramic definition of all identified complexes and sub-complexes. The absolute chronology combines Ball's dating for the Becan complexes with modifications based on local ceramic studies and two series of absolute dates obtained at Río Bec (radiocarbon and calendar from stelae inscriptions). The latter are briefly presented and discussed below.
Ceramic composition of the Río Bec complexes (by Sara Dzul). Most types were originally established by Ball (Reference Ball1977) at the site of Becan
Table 2 calls for a few comments. The Middle and Late Preclassic period Bohom complex suggests a strong central lowland affiliation for the Río Bec occupation, yet the presence of Yucatan Gloss and Opaque wares from the northern lowlands (Tipikal and Maxcanu groups) should not be neglected. At the transition from the Late Preclassic to the Early Classic period, we consider the Guayacan complex as an early manifestation of the later Iximche complex. In much the same way, Iximche sherds were frequently found in association with the subsequent Kanlol complex ceramic types, thus implying some continuity, at least for the most popular types. This led us to forward the possibility of a transitional phase between the Iximche and Kanlol phases, now labeled Kanlol 1 and tentatively dated to a.d. 550–625 (Dzul and Taladoire Reference Dzul, Taladoire, Castillo and Pacheco2010). Generally speaking, the second half of the Early Classic period shows the definite rise of a local ceramic identity, with modes specific to the Río Bec region, influenced in some respects by northern ceramic traditions (Maxcanu and Batres groups). Ball (Reference Ball1977:6) saw a gradual transition from the end of the Early Classic to the beginning of the Río Bec phenomenon, stating that “Bejuco is seen as developing smoothly out of Sabucan, at about AD 600.” Actually, the Kanlol complex remains difficult to define as it is often found associated with materials either from the Iximche or later Makan complexes, or in many lots with both. Yet a few lots include pure material. The only radical change would be the presence of specific, although scarce, Late Classic modes such as polychrome on orange and/or cream.
At Río Bec, the seriations clearly evidence the existence of a strong Makan complex (a.d. 700–850) that we were able to divide into two facets. Most of the epigraphic calendar dates deciphered at Río Bec fall within the Makan interval (see below). At Becan, the roughly contemporaneous Chintok Complex (a.d. 730–830), ill defined due to a lack of homogeneous deposits, has been apparently reevaluated as falling between a short Bejuco-Chintok transition (approximately a.d. 750) and a “Xcocom a” facet (a.d. 850–950) (Ball and Taschek 2013). As a typical Terminal Classic period complex, Xpuhuk (a.d. 850–950/1000) is devoid of Early Postclassic markers. The seriations point out a clear subdivision, with a Xpuhuk 1 facet characterized by the presence of Slate wares, and a Xpuhuk 2 facet defined by the appearance of Fine Orange wares. Xpuhuk 3 is tentatively defined by the presence (albeit scanty) of Tohil Plumbate, which can be reasonably locally dated from a.d. 950 (Charlotte Arnauld [citing Hector Neff], personal communication, 2007), but it is sparsely distributed (in Group B and at La Tortuga). Keeping this in mind, we can reasonably situate the end of the Río Bec occupation in masonry houses around a.d. 950/1000.
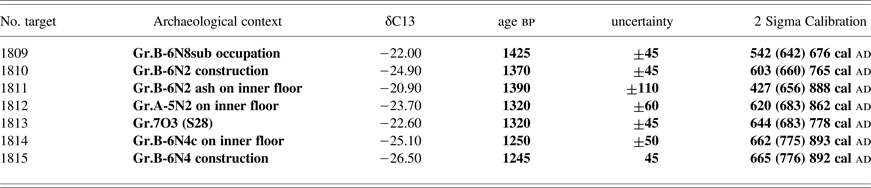
Although a primary project goal has been to achieve better chronological control, our investment in radiocarbon dating has been intentionally limited. Of the seven dates obtained after completing the first field season (2003), three are imprecise (1811, 1814, 1815; see Table 3 and Figure 3), one (1809) comes from an early hearth covered by a late secondary midden. The three remaining dates (1810, 1812 and 1813) only turned out useful for refining the absolute chronology of the Río Bec complexes, in particular pushing the beginning of the Makan phase from a.d. 750 back to a.d. 700.
Radiocarbon dates obtained from archaeological contexts at Río Bec from 2003 excavations (Laboratory CNRS Gif-sur-Yvette; calib radiocarbon calibration program, Calib version 5.0, copyright 1986–2005, by M. Stuiver and P. J. Reimer)
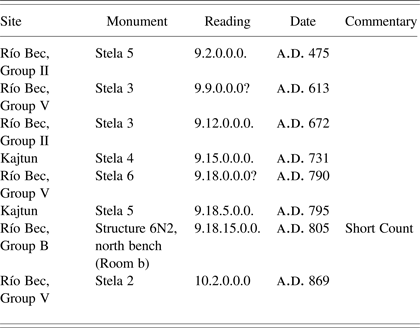
In the ceramic complexes absolute assignment, priority is given to Ball's determinations, along with those obtained in more recent research by Sylviane Boucher and Nidia Rojas Durán as re-evaluated by Dzul. We also take into account the epigraphic dates on the carved stelae and on a painted bench (Arnauld and Lacadena Reference Arnauld and Lacadena2004; Nondédéo and Lacadena Reference Nondédéo and Lacadena2004). The eight epigraphic dates deciphered at Río Bec (Table 4) validated the ceramic assignment of the fill in which each stela was erected (for example, a.d. 613 from Group V Stela 3, and a.d. 731 from Kajtun Stela 4). More precisely, Group V Stela 6 (a.d. 790) erected on a Makan platform aptly dates the Makan 1/Makan 2 transition, which is in agreement with the associated ceramic change.
Calendar dates from inscribed stelae and a single glyph painted on a bench at Río Bec (Lacadena Reference Lacadena2007; Nondédéo and Lacadena Reference Nondédéo and Lacadena2004)
Some complex subdivisions or facets remain imprecisely dated (Iximche/Kanlol transition, Kanlol 1/Kanlol 2, Xpuhuk 1/Xpuhuk 2). We arbitrarily assign them equivalent lengths—Kanlol 1 and Kanlol 2 are assigned 75 years each, the three Xpuhuk facets, 50 years each, while respecting for Xpuhuk 3 the emergence date in relation to the presence of Tohil Plumbate (a.d. 950). Such modeling is based on the supposed temporal equivalence of the seriated ceramic lots within a given complex, or time phase. Most lots mainly come from layers of sealed platform fill that were originally taken from piles of stones, lithic remains, and scraped ceramic middens that we found prepared in the vicinity of the platforms to be built (those left unused in situ). Management of this material related to construction processes and intensive infield agriculture appears to have been systematic (Arnauld et al. Reference Arnauld, Gongora, Déodat, Castillo and Pacheco2010), so that the premise of temporal equivalence is reasonably acceptable. Moreover, the three seriation exercises made it possible to check for anomalies. The total duration of a construction episode, however, from the platform base to the superstructure top, has not been evaluated independently from ceramics, although one epigraphic date can provide an indication. In large-sized Structure 6N2—entirely excavated in Group B—the platform fill layers do not include materials that date to later than a.d. 700 (Kanlol 2; a.d. 625–700); the upper layer below the Room c bench has been radiocarbon dated to 603 (660) 765 cal a.d. (2σ; date 1810 in Table 3); and the fill of the opposite bench in Room b is cross-dated with ceramics to a.d. 700–790 (Makan 1), with this same bench bearing the painted date a.d. 805 (Arnauld and Lacadena Reference Arnauld and Lacadena2004), which should correspond to the building inauguration date. It is then reasonable to infer a construction time span for both platform and superstructure of at least a hundred years (four to five generations) or more (Arnauld Reference Arnauld2011).
GRAPHIC OUTLINE OF SETTLEMENT HISTORIES AT TWO SPATIAL SCALES
Episodes of hard-fill construction for Río Bec masonry residences can be dated precisely by means of the latest sherds included in the fill, as they provide the baseline for dating the latest stages in room construction (see Michelet et al. Reference Michelet, Nondédéo, Patrois, Gillot and González G.2013). Construction of masonry walls and roofing cannot be dated, as these parts rarely contain sherds. Sherds associated with floors and stratigraphically related middens and kitchens date occupation components. All dated components are grouped graphically in two diagrams, contrasting the construction episodes (dark shade) against the occupation components (medium shade) detected in the excavated or tested dwelling units, including monumental groups. The diagram presented in Figure 5 corresponds to the scale of the micro-region (100 km2), while that in Figure 6 corresponds to the scale of the nuclear zone (159 ha). Each diagram thus reconstructs the builders' activities in the sector under study as faithfully as possible, measured by a time span unit of 50 years. The earlier components shown in light shading do not correspond to occupational levels in situ, but to concentrations of earlier ceramics included in platform fills accumulated in later times. We call these specific features “basketloads,” as many of those deep sherds were found concentrated, probably carried over from earlier close-by occupational contexts into the fill of structures in the building process, as a normal, perhaps symbolic, procedure. They must reflect an occupational component located close to the residence under construction, although the location of these associated structures remains unknown. As shown in the nuclear zone settlement history (see below), early Río Bec corresponds with a loose, dispersed pattern with numerous minor clusters that we know of mainly by those basketloads, and also under leftover stone piles (see below). Truly vertical superpositioning of residences is rare (although present in Group K), yet a few cases of horizontal architectural “succession” have been detected, which tends to confirm that the buildings were erected over extended periods (Carrasco Vargas and Boucher Reference Carrasco Vargas, Boucher, Andrews and Gendrop1985; Michelet et al. Reference Michelet, Nondédéo, Patrois, Gillot and González G.2013) and with lateral displacement. This is why the settlement dynamics are as relevant to study chronologically as the architectural stylistic sequence.
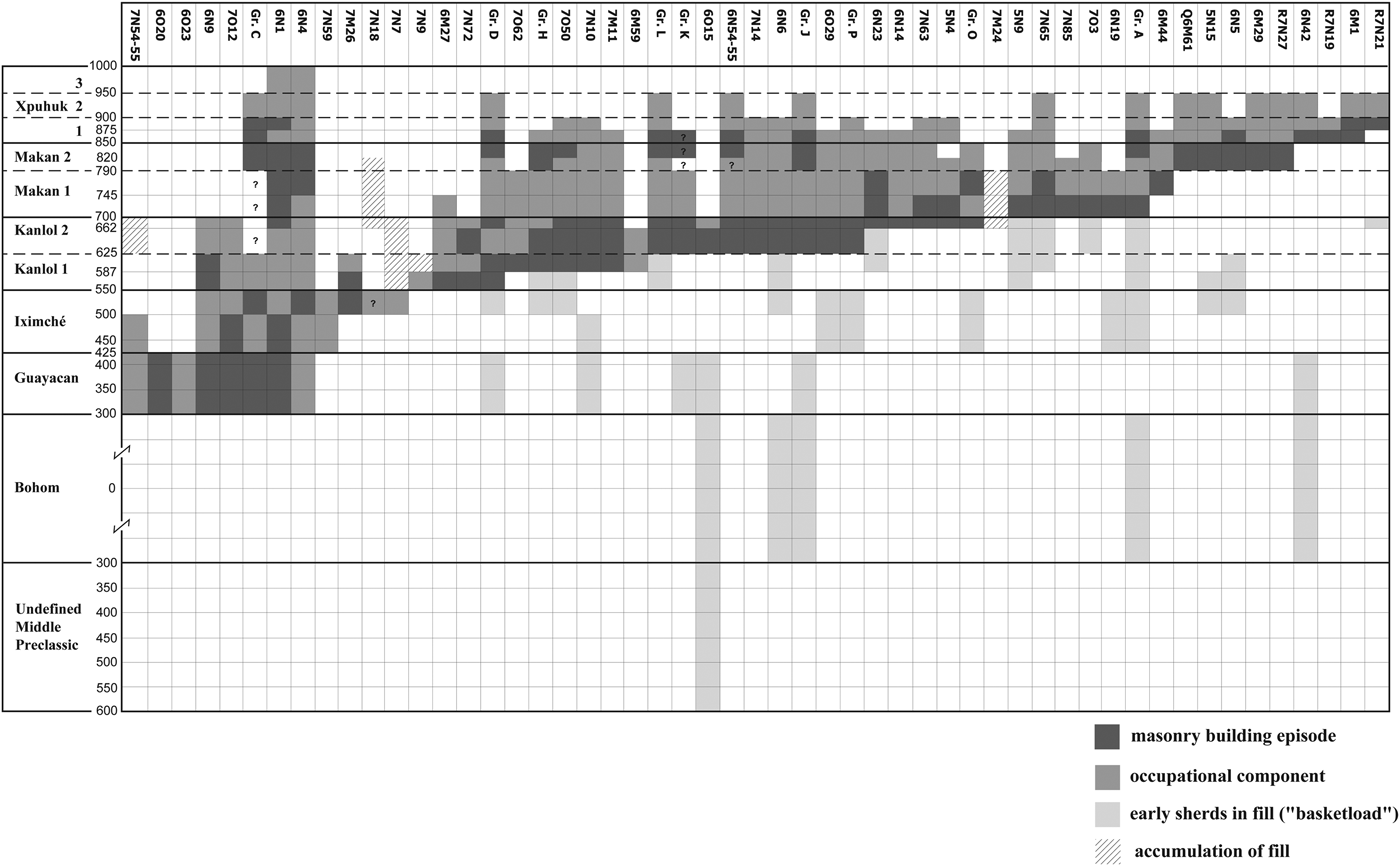
Diagram summarizing the occupation and construction components for the monumental groups tested or excavated in the Río Bec micro-region (Sub-Project III). Dark grey represents the construction phases (buildings or open spaces) detected during the excavations, while medium grey indicates the length of post-construction occupation. Light grey indicates important early sherd concentrations (“basketloads”) in more recent fills. Most basketloads are dated to the Iximche phase that corresponds to demographic growth in the Río Bec micro-region. Less significant occurrences of early sherds in recent fills are excluded from the diagram as they do not necessarily suggest a previous occupation of the group. Diagram by Philippe Nondédéo.

Diagram summarizing occupation and construction components in the 159 ha nuclear zone. Note that monumental groups are included as household units, most of them representing only one unit each. Group B includes 6N1, 6N4, 6N5 and 6N6 units (Sub-Project II by Eric Taladoire; Sub-Project V by M. Charlotte Arnauld; Sub-Project VIII by Eva Lemonnier).
On the 100 km2 scale, the diagram (Figure 5) includes 29 of the 73 micro-region groups, to which were added the sequences of completely excavated Groups A, B, and D in the nuclear zone. The dating for each construction episode is based on presence-absence, association, and frequency of ceramic types in platform fills, taking into account the precise position of types in the corresponding seriation (the latest sherds being taken as terminus post quem). In some cases, the temporal resolution can be confidently brought down to 20 years using some well-dated diagnostic types (Ulil Fluted, Torro Gouged-incised, Tancachacal Slate, as well as Slate wares like Muna, Ticul, and Dzitas Groups, and Fine Orange wares, including the Altar Group). As for the occupation components, evaluating the time span they cover is more difficult given the almost total absence of primary middens and the relative rarity of sherds on residential floors. It is especially problematic to estimate the terminal occupation point of those edifices or groups built at the end of the Late Classic period and beginning of the Terminal Classic. Nevertheless, thanks to its 32 construction/occupation components for 73 monumental groups, the micro-region diagram serves as a basis for the distribution maps presented and discussed in this paper (Figure 7).
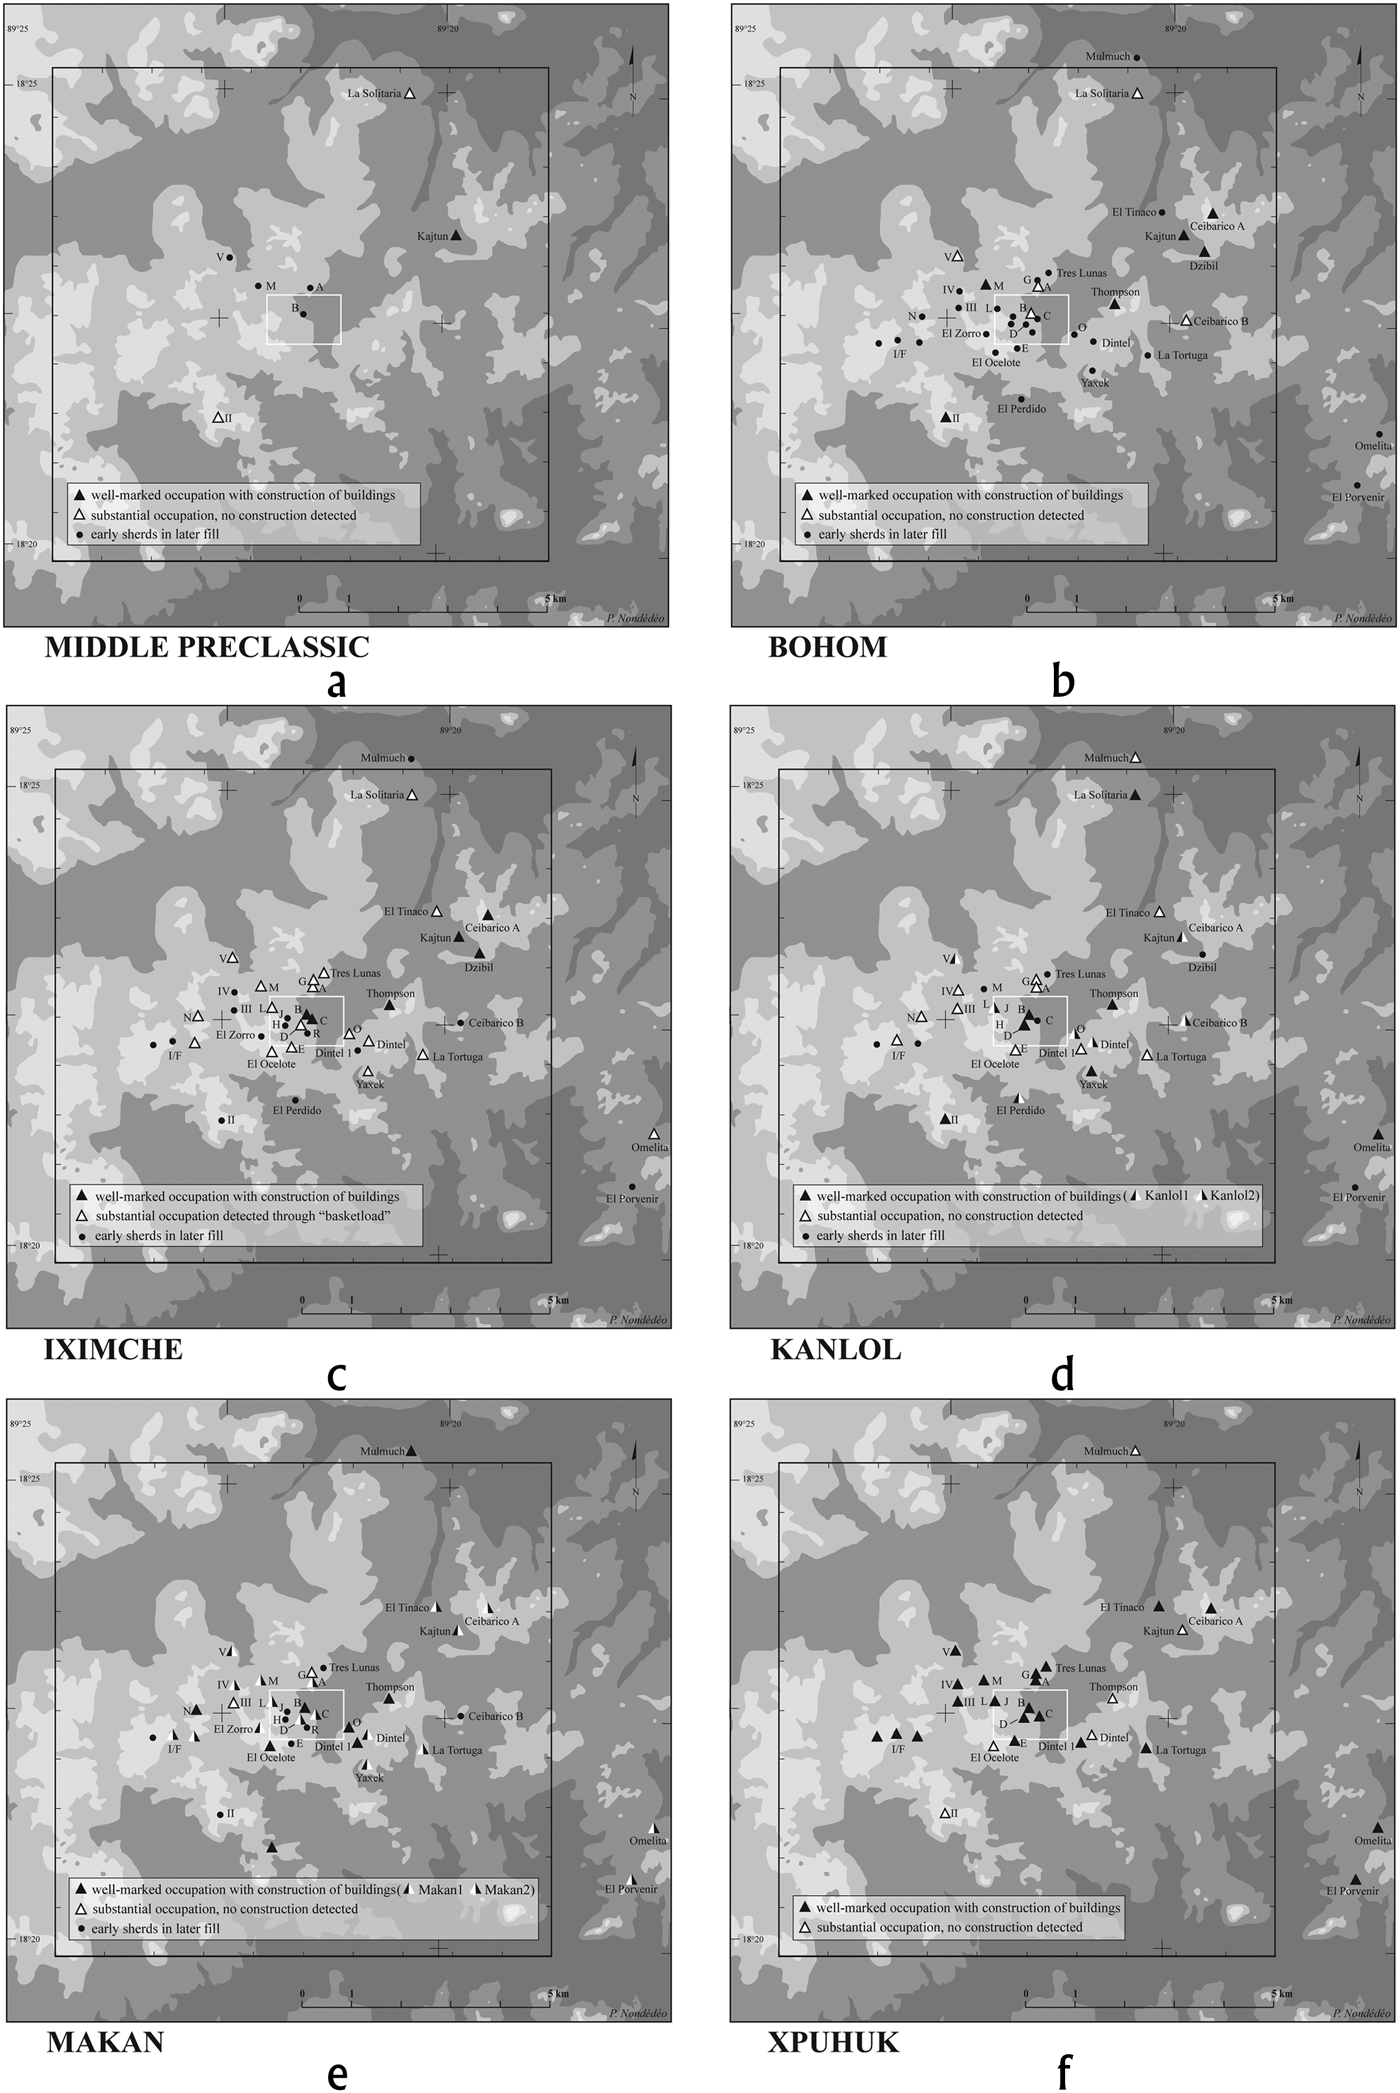
Distribution map of dated monumental groups in the Río Bec micro-region for the main chrono-ceramic phases. Black triangles indicate construction episodes and white triangles the densely occupied groups, without associated structures detected. Black dots indicate the groups where only a few sherds from a specific phase were recovered. Map by Philippe Nondédéo.
The diagram concerning the 159 ha nuclear zone (Figure 6) is based on all test-pits and excavations carried out locally. Of the 125 identified residential units, 34 smaller units were test-pitted, and 19 units of superior rank belonging to monumental groups were either tested or fully excavated. In comparison with the micro-region diagram, occupation is more restricted in time, as no masonry construction has been found for the Preclassic period, except perhaps in Group C. We show below that all surveys and testpits from Sub-Projects II (settlement dynamics) and VIII (agricultural landscape modifications), however, revealed the existence, prior to the Río Bec style constructions, of an earlier dwelling system that subsequently underwent extensive alterations. This settlement history is outlined first, before dealing with the micro-region settlement history as the latter is directly related to the architectural stylistic sequence—the focus of the last part of this study.
SETTLEMENT HISTORY OF RÍO BEC AT THE 159 ha SCALE
At this scale, analytical units are not clusters of monumental buildings as in the micro-region (100 km2), but social units corresponding to each household (Nondédéo et al. Reference Nondédéo, Arnauld and Michelet2013; Robin Reference Robin2003). Their temporal evolution reflects social dynamics on a more local scale than that of the micro-region. Apparently, the Figure 6 diagram reflects a rapid emergence of early simple traits of the Río Bec architectural style during the Kanlol phase (a.d. 550–700), as masonry constructions multiplied quasi-simultaneously. Continuous during the Makan phase, the process appears restricted to earlier residential units that undertook the building of major residences (in Groups B, D, L, K, J, A, and 7O50), while foundations of new units were less numerous (12 foundations in Makan as opposed to 23 in earlier Kanlol). This relative decline is the first indication of a contraction process by which some of the minor units were abandoned while large multi-room residences were being built nearby in long-lasting construction episodes. As more and more large houses were modified and expanded by a second series of constructional components, (dark-shaded on Figure 6, and dating to Makan 1 and 2), fewer and fewer new units were founded. Constructions occupied until the end of the sequence are few; for example, Group B was occupied throughout the Late-Terminal Classic periods. The spectacular growth of Río Bec style construction in Group C since Makan 2, its parallel evolution with Group B during the Terminal Classic period and their spatial proximity (Figure 2) suggest they could have formed a pair at the top of the hierarchy in the nuclear zone (see Nondédéo et al. Reference Nondédéo, Arnauld and Michelet2013). Locally, Groups B and C seem to reflect the “founding ancestors” principle discussed by McAnany (Reference McAnany1995) and others; that is, that the earliest occupants become the most powerful, at the local level, across time. Nevertheless, the nuclear zone occupation appears to be late (in comparison with the micro-region as a whole, see below): Figure 6 suggests that it was practically uninhabited in the Late Preclassic period, excepting its eastern part, since the large majority of dated units apparently did not exist before a.d. 550, when they started building masonry structures. Yet this is in large part a bias due to our focus on vaulted architecture, and the early part of the diagram calls for some additional data.
Basketload-type components occur in only five of the 52 dated units, which would tend to confirm that Preclassic occupation must have been reduced and scattered in the nuclear zone, save in a few minor groups. Occupation apparently excels at the beginning of the Early Classic in Guayacan with Groups B and C, possibly also L, and their neighbors then founded, along with Unit 7O12 in the south-east, and Unit 7N55 in the south (eight units in total). In the subsequent Iximche phase, four additional units are scarcely more dispersed; likely an artifact of our testing strategy that assigned priority to Groups A, B, and D neighboring units. Moreover, in these 12 early units, six include only unvaulted structures with low stonewalls, and two types of stone piles—egg-shaped and circular. Of all the non-agrarian surface structures recorded during the nuclear zone survey, unvaulted structures represent 36% (M4 [158] and M3 [24] types, n = 501) (see Nondédéo et al. Reference Nondédéo, Arnauld and Michelet2013:Table 6), and both types of stone piles together 30% (TP2 [32] and TP1 [121] types, n = 501), which is a regionally frequent feature (see Lemonnier and Vannière Reference Lemonnier and Vannière2013). Even though stone piles were not systematically recorded, all four structures types are by far the most common in the 159 ha, yet, as mentioned, their representation in the diagram is minimal. Besides ceramic basketloads, they are the only visible evidence for occupation prior to the masonry dwellings. Among the 121 circular stone piles, 10 were excavated revealing that they lie directly on bedrock without covering any earlier occupational remains; they differ from the (32) long stone piles in that they lack any retaining walls and they include only early sherds (Iximche and Kanlol). They are interpreted as altered remains of small, early residential platforms modified by later stone removal from their walls and fill, although some of them perhaps acquired an agrarian function later on (Lemonnier and Vannière Reference Lemonnier and Vannière2013). In contrast, all four excavated egg-shaped piles consist each of a larger accumulation of layers of stones of various sizes covering earlier stonewalls, all dated to the Bohom to Iximche phases (Lemonnier and Vannière Reference Lemonnier and Vannière2013). While the proportion of piles in both types that do represent early dwellings cannot be evaluated precisely, there is a good possibility that it is high, especially in the most abundant circular type. Both types, along with unvaulted structures, form the underlying level of a palimpsest of a settlement system quite different from the one built in subsequent Kanlol-to-Xpuhuk times. A more systematic testing of these features would probably show that occupation was locally widespread during the Late Preclassic Bohom phase, with a marked development during Guayacan, Iximche, and early Kanlol 1 phases of a loose, dispersed settlement pattern, with numerous minor groups. Moreover, the test pit program in some of the typical Río Bec groups (generally assigned only to the apogee period) suggests that they had a substantial Early Classic occupation; for example, Groups C or L. This was unexpected and could not have been inferred without excavation.
If this underestimated early settlement system is to be taken into account, it is clear that the phenomenon of contraction in the nuclear zone from Kanlol to Makan and Xpuhuk times is the hidden facet of what seems more apparent in the diagram, the uninterrupted increase of occupational components—16 in Kanlol 1, 28 in Kanlol 2, 30 in Makan 1, 32 in Makan 2, with the increase actually stabilizing in the broader Makan phase. As mentioned, the curve of new foundation construction also levels off with time. Dating a larger sample of unvaulted structures and stone piles would probably confirm and enhance the contraction pattern by which more and more lesser units were abandoned as the number of large residences increases in Kanlol-Makan times (Arnauld et al. Reference Arnauld, Michelet, Vannière, Nondédéo, Lemonnier, Arnauld, Manzanilla and Smith2012). A somewhat divergent evolution is apparent in the northeastern quadrant (Figure 2), which seems to have lagged behind all other sectors after the Kanlol phase (Taladoire Reference Taladoire2007).
Our systematic testing of units close to monumental Groups A, B and D enabled us to outline a few “contraction stories,” that is, sequences of dated abandonment episodes which occurred in direct proximity to those three groups (see Michelet et al. [Reference Michelet, Nondédéo, Patrois, Gillot and González G.2013] for a detailed discussion of Group A, Structure 5N2). For example, in Group B, at the same time fill was being piled up in preparation for the construction of the large 6N1 and 6N2 residences (at the end of Kanlol 2), two other units were abandoned to the south, as well as an additional one to the west just before the building process ended (at a.d. 790–805), whereas two eastern units continued to develop (Arnauld et al. Reference Arnauld, Gongora, Déodat, Castillo and Pacheco2010). Units neighboring Group D (east and south) provide another instance: when the first-stage group was built (during the Kanlol 1 phase), two close-by small units were abandoned. On the whole, although underestimated in the Figure 6 diagram, a decreasing trend in unit foundations goes along with settlement contraction and large residence construction. That this trend must be interpreted in social terms as a process of absorption of small units—with variable degrees of success—into those in which large Río Bec residences were being built is beyond the scope of the present paper (see Arnauld Reference Arnauld2011; Arnauld et al. Reference Arnauld, Michelet, Vannière, Nondédéo, Lemonnier, Arnauld, Manzanilla and Smith2012; Michelet et al. Reference Michelet, Nondédéo, Patrois, Gillot and González G.2013). This is one of the most promising, albeit unexpected, outcomes of our dual-focus research on chronology applied to architecture and settlement dynamics. It has enabled us to hypothesize precisely how monumental construction was produced and how it impacted local, coresident settlement.
SETTLEMENT HISTORY AT THE MICRO-REGIONAL SCALE
Within the micro-region (Figure 7), 32 dated groups figure amongst the most important architecturally and represent the highest rank in the hierarchy established for all groups (Nondédéo et al. Reference Nondédéo, Arnauld and Michelet2013:Table 5). The minor monumental groups received less attention, introducing a slight bias in the resulting occupation maps, especially for the north part of the zone between El Tinaco and La Solitaria. Nonetheless, the sample is representative, as it includes 100% of groups assigned to Ranks 1 and 2, 83% to Rank 3, 70% to Rank 4, and 30% to the most frequently ocurring Rank 5.
Occupation began sporadically in the Middle Preclassic period (600–300 b.c.). Only seven settlements provided ceramics from this period, most in limited quantity, while a few sherds were also recorded in the nuclear zone. Three groups, however, held our attention: La Solitaria, where a concentration of material from this phase was found in a later fill indicating an early occupation nearby, and Groups II and Kajtun that were founded during this phase. High concentrations of Middle Preclassic sherds have been discovered in Group II, but not directly associated with a structure. At Kajtun, buried deep down in the site's central plaza, a quadrangular platform built of roughly-hewn stones faced with a thick layer of stucco was located. This early platform (.44 m high) was subsequently incorporated into several layers of fill that ultimately formed the later plaza, with no hint of any domestic context. Whereas the early fill layers were laid in the Middle Preclassic period, the later ones can be dated to the Late Preclassic transition, suggesting that from the end of the Middle Preclassic onward the site of Kajtun already had a public space, probably reflecting its social and political importance (Nondédéo and Lacadena Reference Nondédéo and Lacadena2004).
During the Bohom phase (300 b.c.–a.d. 300), occupation became more widespread in the micro-region as well as in the nuclear zone, and most of the later Río Bec-style groups were founded or, at least, contain material from this phase in later fills. But Bohom phase ceramics are not abundant, representing only 12% of all studied material. The groups previously occupied begin their rise, especially those in the sectors defined by Kajtun, Dzibil, and Ceibarico A to the northeast; the eastern part of the nuclear zone, in Group C; Groups V-M to the northwest; and, Group II to the southwest, all suggesting some occupation continuity. The rise of these entities is apparent in the construction of surfaces for plazas (Kajtun, Group II), for patios (Ceibarico A, Thompson), or for platforms (Dzibil, Group M). No superstructure dating to this period, however, has ever been detected in excavation. In the Bohom phase, Kajtun and Group II are certainly the major settlements in the micro-region, and are clearly distinguished from the others by their organization around a vast central plaza constructed and/or remodeled several times during the phase. One can speculate that preliminary versions of the pyramidal buildings now visible on the plaza sides may have existed as early as this phase. These two examples indicate that the Late Preclassic in the micro-region corresponds to the time when the central lowlands “Peten tradition” was most influential, diffusing its model of spatial organization focused on large public plazas.
The Guayacan phase (a.d. 300–425) seems to mark a rupture in the occupational development—or even maybe a regression—with little ceramic material collected (6% in total) and few detected construction episodes. But this unexpected view of the collections might be the result of a bias in our knowledge of local Guayacan complex material markers (see Ball Reference Ball1977:138–139). The Iximche phase (a.d. 425–550) corresponds to a new rise for the micro-region, also noted for the nuclear zone, apparent from a more widespread and intense occupation reaching its apogee later in the Kanlol-Makan phases. As in the nuclear zone, every tested group yielded Iximche material, which represents 30% of the total sample, and several groups even seem to have been founded in this phase, such as Group C or 7N44. Occupation then intensified as indicated, on the one hand, by significant “basketload” features present in 16 groups that represent huge quantities and concentrations of Iximche midden material reused in later fills, suggesting close-by occupation during the Iximche phase. On the other hand, by some building activity resulting in the renovation of a public plaza (Kajtun) and private spaces (Ceibarico A, Thompson, Kajtun), as well as the construction of 6N4sub and 6N3sub in Group B. In Group II, although no trace of rebuilding has been identified, epigraphy indicates the erection of the micro-region's first carved monument, Stela 5, which was dedicated in a.d. 475 (although found at the summit of pyramidal structure III, its original location may have differed). The presence of this monument and its iconography—an individual trampling a captive and associated with a dwarf—certainly suggest an attempt to establish a royal dynasty at that time and place in the Early Classic period (Nondédéo and Patrois Reference Nondédéo and Patrois2007). The public ritual complex in Group II's central space must have been remodeled or enlarged, at least in part, during this phase. Notably, although Group II followed the central lowlands traditional style, the rest of the micro-region apparently began shifting toward the emergence of (what would become) the Río Bec phenomenon. This phase of gestation is particularly discernible in the ceramic tradition which then acquired its own identity, influenced by traditions from the north of the Yucatan Peninsula.
As hypothesized by Ball (Reference Ball1977) and Bueno Cano (Reference Bueno Cano1999), the Kanlol phase (a.d. 550–700) witnesses the initiation of the Río Bec phenomenon, with the foundation of new patios and the emergence of the first examples of Río Bec-style monumental architecture. Regionally, occupation appears to intensify, as ceramics from this phase constitute 27% of the sample, and all the groups were occupied—although substantial disparities exist from one sector to another. Kajtun was progressively abandoned. In the same way, Group II seems to have experienced a noticeable decrease in its activities (Kanlol phase ceramics amount to 9% only at this group); although, paradoxically, a ballcourt was built in Kanlol 1 (a.d. 550–625) and a new stela dedicated there in a.d. 672. In Group V, Stela 3 was dedicated in a.d. 613, and the ballcourt would have been built in the Kanlol 1 phase. Yet Kanlol phase ceramics are under-represented (18%) in relation to the micro-region's average for these types. Otherwise, with at least 17 constructions identified, the Kanlol phase was undeniably a time of activity as new patios were founded (Group D, Yaxek–Las Escobas, Omelita, La Solitaria, Ceibarico B, and Dintel). What must be noted here is the edification of the first major Río Bec-style residences, simple in ground plan with only one or two rooms in Kanlol 1 (Yaxek-Las Escobas, Structure 1), but followed by more complex construction plans in the Kanlol 2 subphase. For example, La Solitaria Structure 1, with its solid masonry blocks placed at the corners of the front façade, foreshadows the towered buildings that would flourish in the following chronological phase. Along with these first Río Bec-style edifices, a singular iconographic theme also developed centered on the image of the terrestrial Earth monster that would first decorate inset panels, and then roof combs. Toward the end of the Kanlol phase, around a.d. 650–680, more complex buildings emerged, such as Structure 1 in both Thompson and Group O, marking the introduction of multiroom edifices in the micro-region, a building type that suggests the rise of powerful houses in control of those groups.
The following Makan phase (a.d. 700–850) marked the micro-region's apogee in terms of architectural dynamism, a continuous trend until the beginning of the Terminal Classic period (Xpuhuk 1 phase; a.d. 850–900). But the scope of this development was varied: certain groups were at their zenith (Thompson, Groups B, N, O, Dintel 1, El Ocelote, Mulmuch, to name a few), while others were simply ascending and would only reach their apogee at the transition to, or in, the following phase (Groups I, III, IV, V, A, E, M, G, Ceibarico A, Omelita, El Porvenir, El Tinaco, La Tortuga). Still others were occupied, but clearly declining before being abandoned (Groups II, Kajtun, Yaxek-Las Escobas, Ceibarico B). Even though occupational levels appear less intense in the Makan phase as opposed to the Kanlol phase (in terms of the number of occupied groups and associated ceramic proportions [12%]), construction activities testify to an unprecedented dynamism—no less than 26 edifices date to the 150-year long Makan phase, among which 10 date to the later Makan 2 subphase (a.d. 800–850). These activities in the Makan phase completely remodeled the micro-region's sociopolitical landscape, reflecting the emergence of new social groupings now able to erect multiroom residences, some with towers (Groups N, B) and others with zoomorphic doors (Yaxek-Las Escobas, Structure 2). As seen in the nuclear zone, the contraction process accompanied extensive monumental construction, which means that it must have provided, rather than diverted, labor force through coresidence concentration (see more detailed discussion in Arnauld et al. [Reference Arnauld, Michelet, Vannière, Nondédéo, Lemonnier, Arnauld, Manzanilla and Smith2012] and Michelet et al. [Reference Michelet, Nondédéo, Patrois, Gillot and González G.2013]).
The Terminal Classic period Xpuhuk phase (a.d. 850–1000) has two contrasting subphases; an early one (Xpuhuk 1; a.d. 850–900), which is an extension of the Makan 2 apogee with a certain amount of new constructions, and two late subphases (Xpuhuk 2 and 3; a.d. 900–1000) during which building activities almost totally ceased, followed by an extensive decrease in occupation until a practically complete abandonment in Xpuhuk 3. Taking the Terminal Classic period as a whole, the decreasing number of occupational components reflects a contraction of the micro-region settlement, yet a simultaneously emergent pattern of marked nucleation of residential units occurs within a few groups in full development (El Porvenir, Omelita, Group I). The Terminal Classic period also marks the heyday of towered buildings that were first built at the end of Makan that were still occupied (Groups A, B, L, M, I, Ceibarico A), with the exception of Group N, coupled with the appearance of new groups (El Porvenir, Tres Lunas, La Tortuga). Multiroom edifices continued to be built on platforms (Group V, Structure 4 and Group IV, Structure 1), as were simpler one- to four-room residences (Groups D, E, G, I, El Tinaco, III). Among the important groups of this phase, Group V is the only one with a Terminal Classic period stela, Stela 3 (a.d. 869)—the latest in the micro-region. This group also has one of the rare central plazas to be constructed following the Rio Bec apogee.
It is now established that, after the abandonment of the monumental groups, part of the local population remained until some time into the Postclassic period, although this occupation is difficult to trace. Besides occasional visits in the Late Postclassic period that left ritual censer deposits at the foot of some highly symbolic monuments, one of the best pieces of evidence for human presence comes from the graffiti. The position of certain graffiti on the upper part of walls can only be explained if they had been drawn by someone standing on top of the debris that accumulated within the rooms (Patrois and Nondédéo Reference Patrois, Nondédéo, Lorenzo and Muñoz Cosme2009). Moreover, whether superimposed or not over earlier motifs, certain themes that are represented clearly evoke Postclassic motifs (Ceibarico A, El Porvenir, Group B, and outside the micro-region at Pasión del Cristo) (see Patrois Reference Patrois2013).
BIRTH, RISE, AND DEMISE OF A STYLE: THE RIO BEC ARCHITECTURAL SEQUENCE
The micro-region architectural sequence is based on the chronological ordering of a sample of buildings (Figure 8) that have been cross-dated based on the relationship of their constructional stages with the Río Bec ceramic phases and their subdivisions in shorter time spans. As stated at the beginning of this paper, ceramics were obtained from test pits dug into the basal platforms of building edifices specifically selected on the basis of their rank (Nondédéo et al. Reference Nondédéo, Arnauld and Michelet2013:Table 5) and the quality of architectural preservation and/or the visibility of their iconographic programs. Detailed construction sequences have been established for 36 of the tested buildings, as well as those of the largest buildings that were entirely excavated; that is, Structures 5N2 (Group A), 6N1 (Group B), and 7N1 (Group D), each dated according to the ceramic material associated with platform fill layers. The aim of this study was to validate, or indeed refine, through the ceramic chronology, the regional Río Bec architectural sequence as proposed by Gendrop (Reference Gendrop1983, Reference Gendrop1987) and Andrews (Reference Andrews1999)—mainly through stylistic criteria. We also tried, as far as possible, to test pit the middens adjoining buildings in order to define the length of occupation. The chronological ordering of those 39 sequences (Figure 8) highlights four episodes of intense building activity, which also correspond to the main stylistic phases defined by specific traits present on contemporaneous buildings. The resulting overall stylistic sequence stretches from the very origins of the Río Bec phenomenon (at approximately a.d. 550) up until the end of the occupational sequence at around a.d. 950/1000 (not including the architectural phases previous to the advent of the Río Bec phenomenon). The four established phases are called Río Bec Temprano, Río Bec Tardío 1 and 2, and Río Bec Terminal, to preclude any confusion with the ceramic phase names.
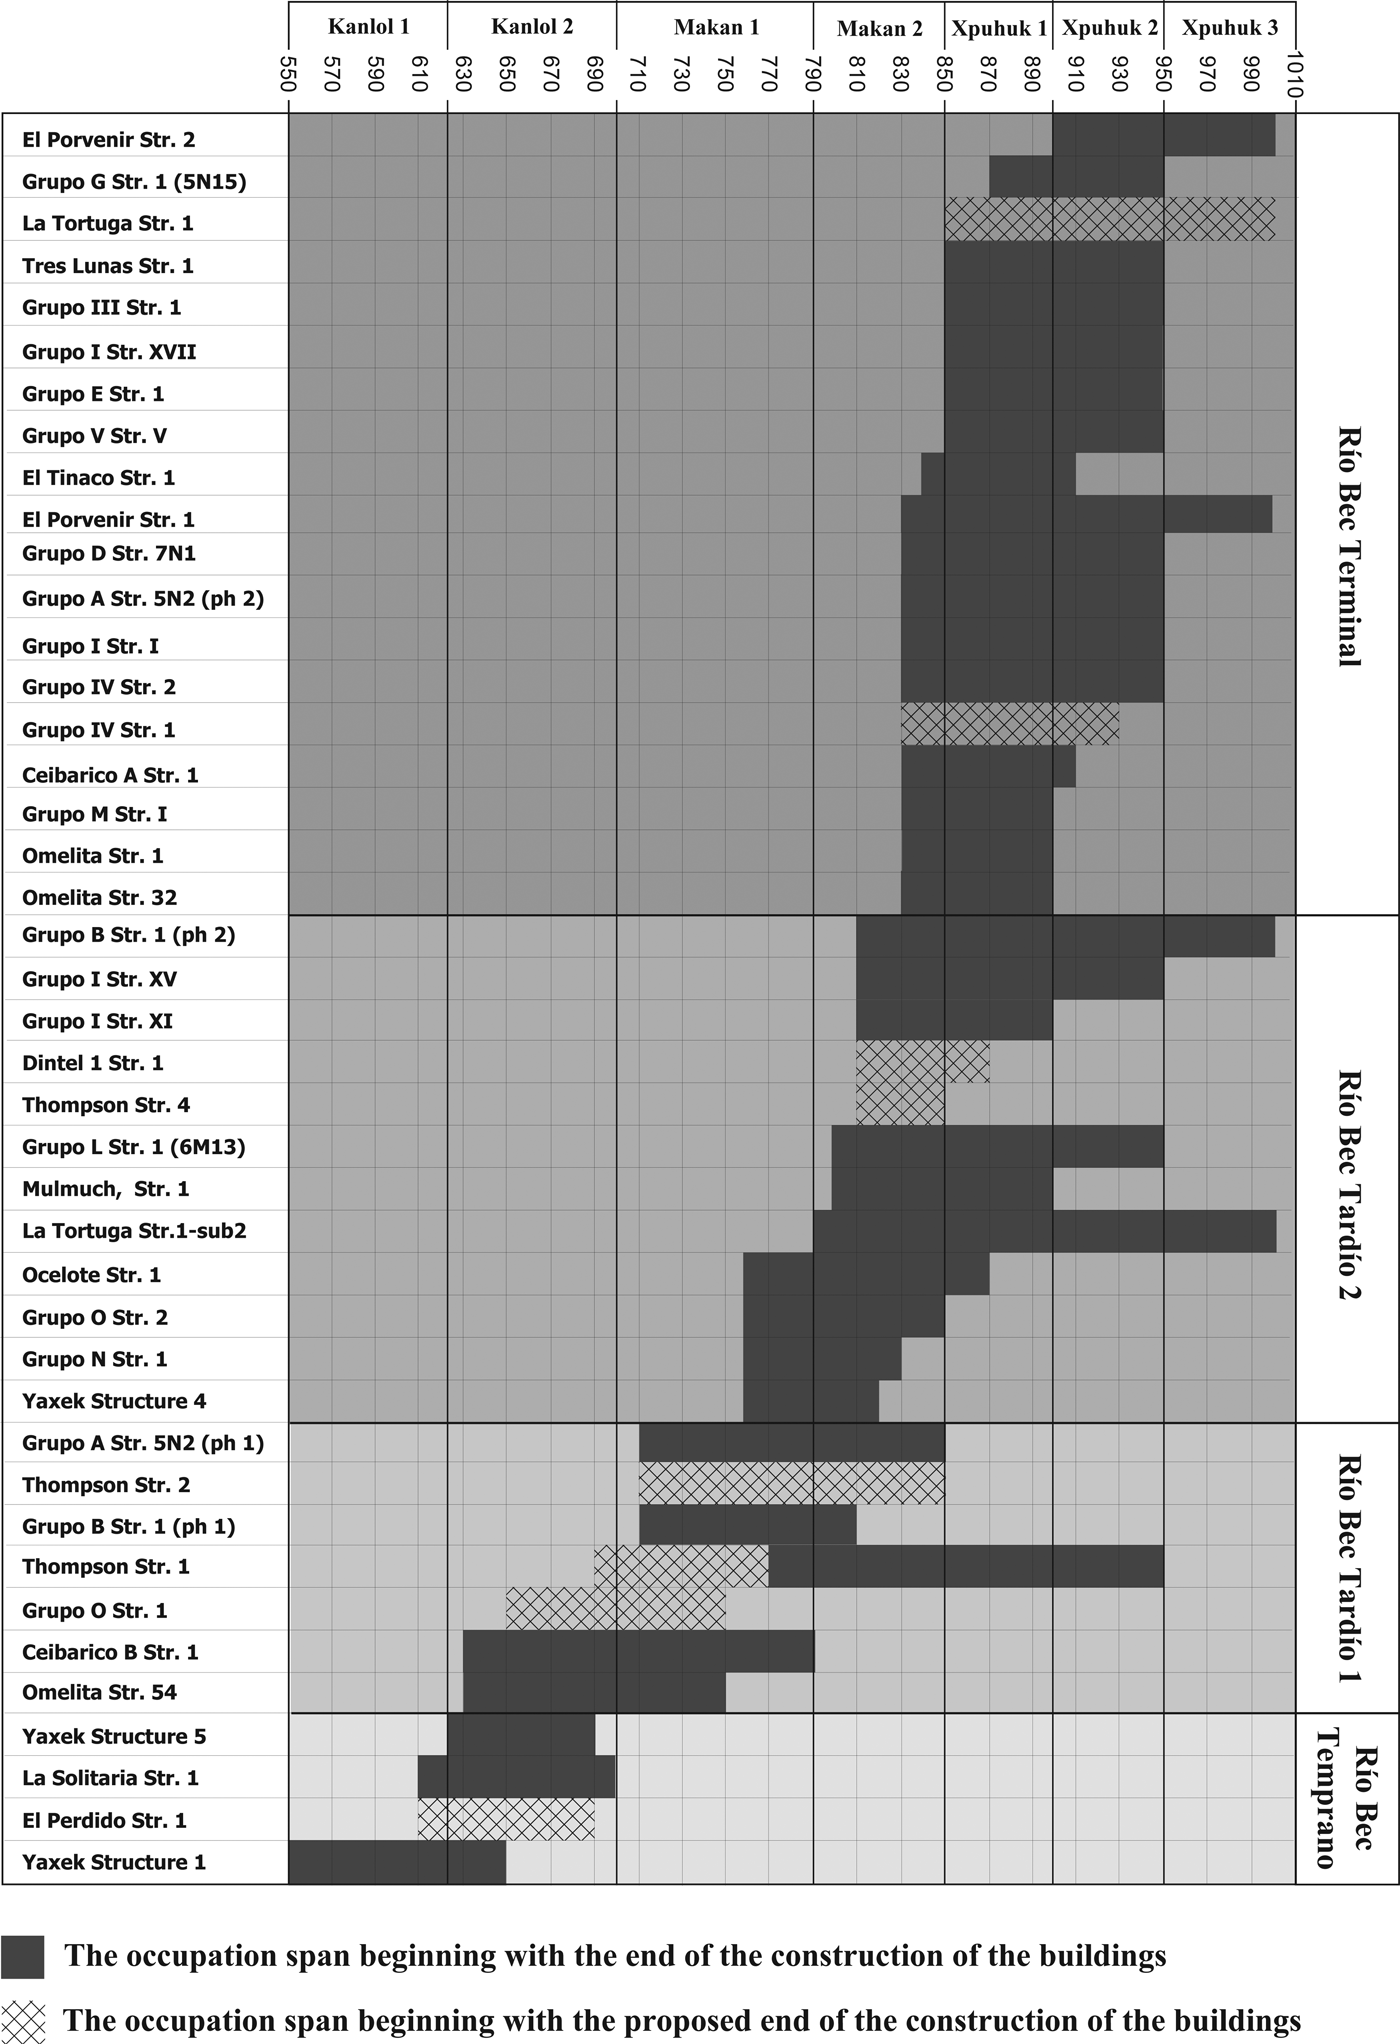
Chronological ordering of the 43 building sequences corresponding to 39 large edifices dated through Sub-Projects II, III, and V. The latest sherds in upper platform fill and the earliest sherds on built floors date the construction of each superstructure. Dark shade represents the edifice occupation span from the end of the construction process, while the hatched marks indicate the proposed end of construction and occupation. In some cases (Structures 6N1 and 5N2, and La Tortuga, Structure 1), the same building is noted twice if earlier substructures have been identified and dated. Chart by Philippe Nondédéo.
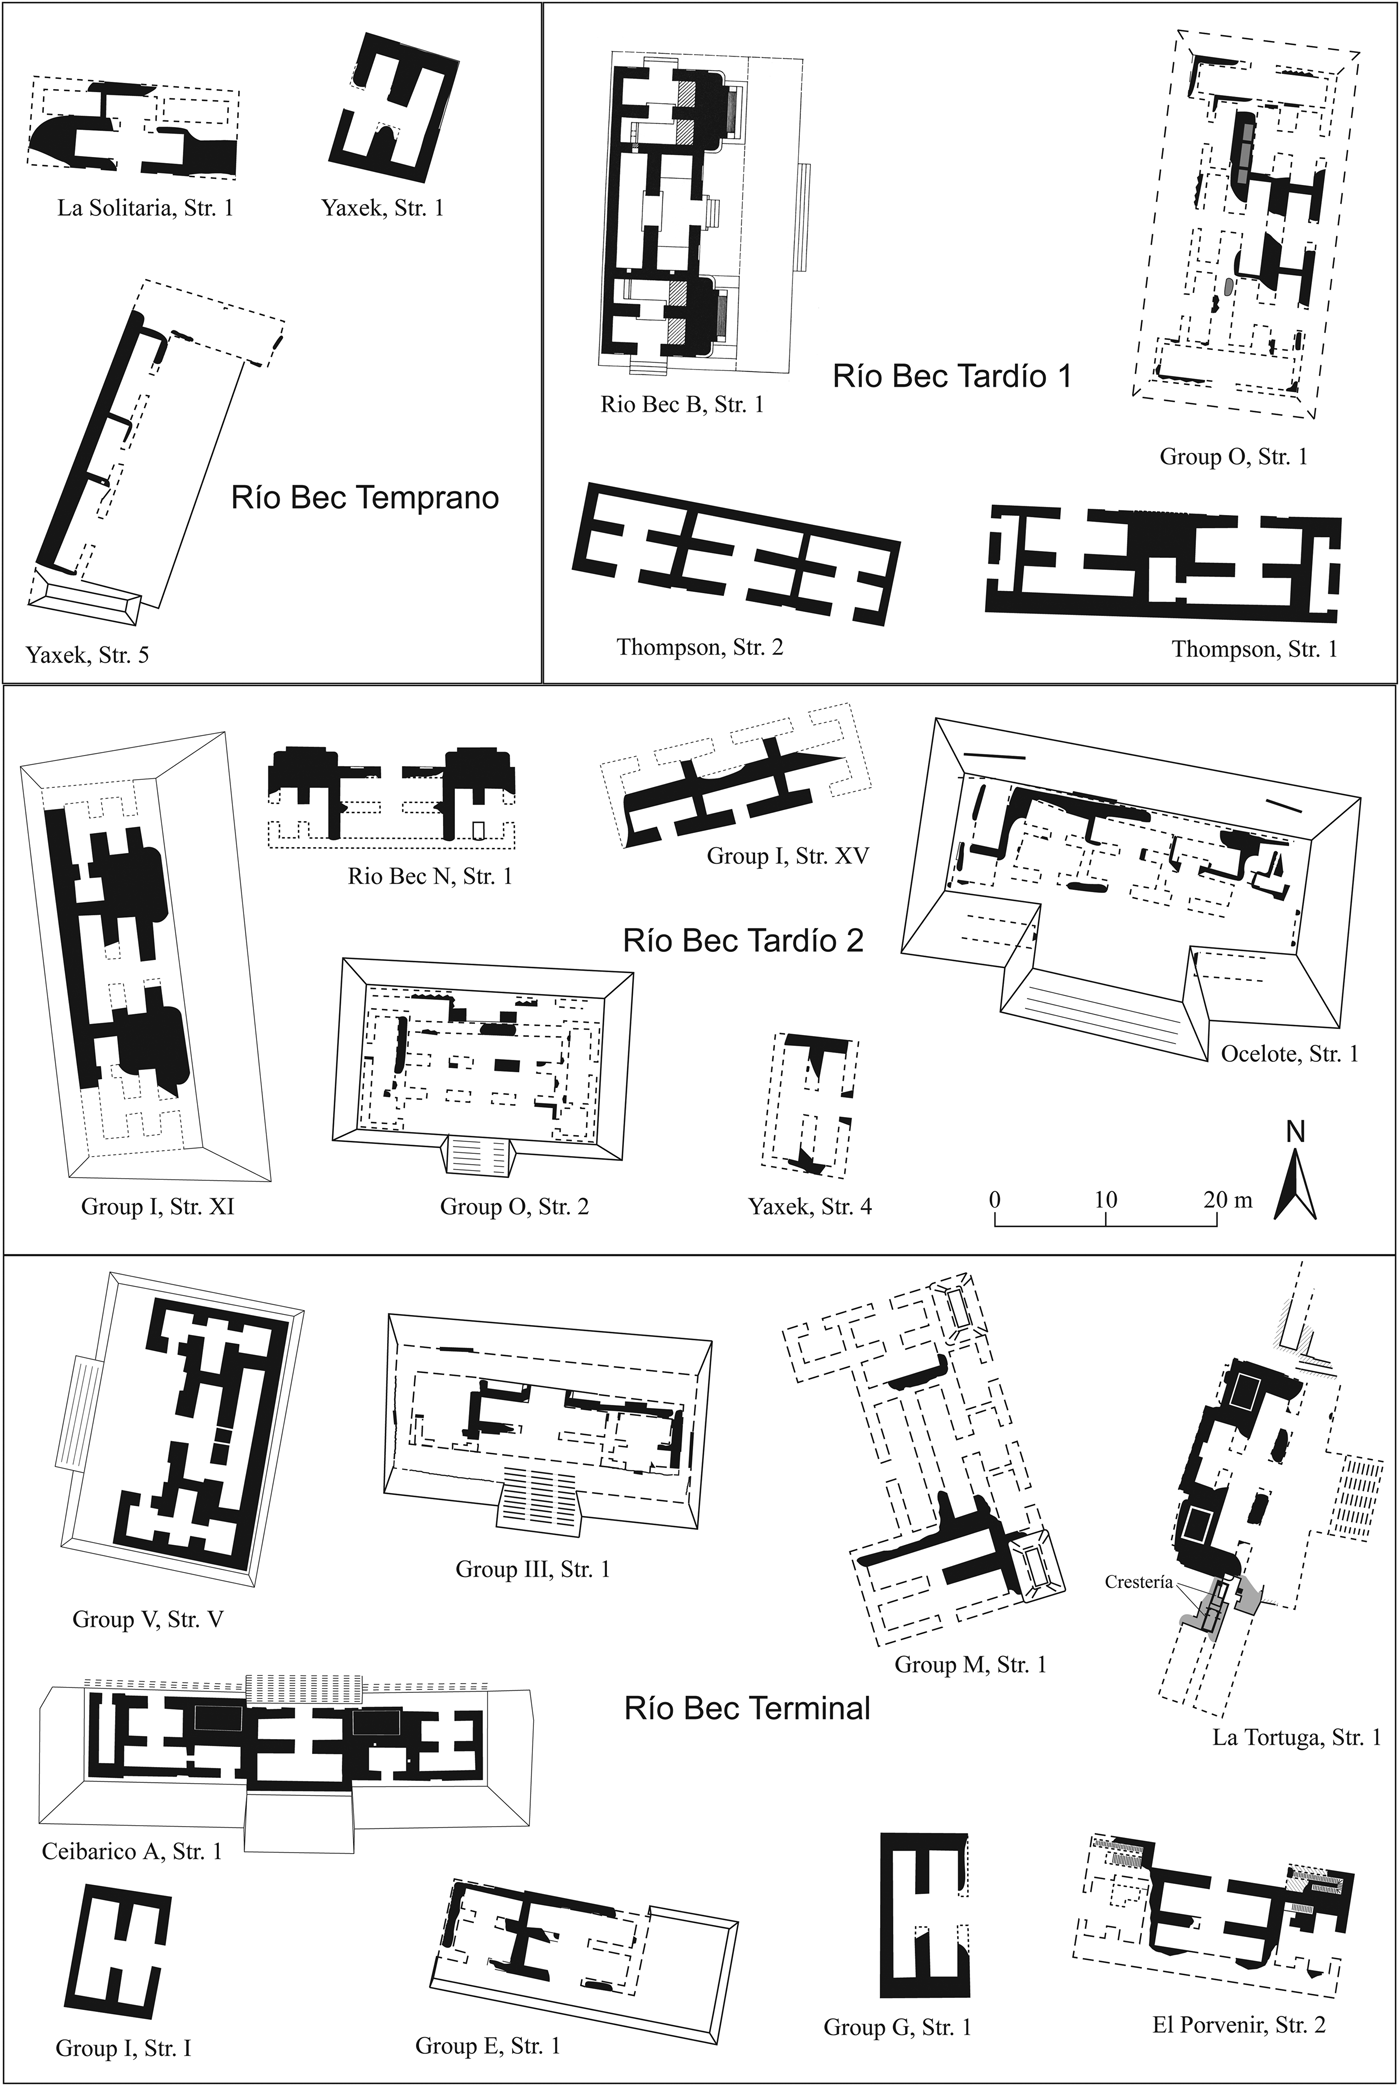
The earliest phase, Río Bec Temprano (a.d. 550–625), corresponds to the establishment of the style (Figure 9). Buildings had two to four rooms and only a few decorative elements (Yaxek, Structure 1), including the checkerboard panels that seem to be among the earliest decorative forms (La Solitaria, Structure 1). In the latter building, masses of masonry located at both extremities of the façade seemingly foreshadowing what would much later become towers. The new architecture was still in its infancy, notable in the vaults with their rectilinear and asymmetrical (La Solitaria, Structure 1) or concave (Yaxek, Structure 5) profiles.
Sample of building ground plans representative of architectural phases proposed for the Río Bec micro-region. All structures are represented at the same scale, in their original orientation (after Andrews Reference Andrews1999; Carrasco et al. Reference Carrasco Vargas, Boucher and Peña Castillo1986; Merwin Reference Merwin1913; Nondédéo and Dzul Reference Nondédéo, Dzul, Castillo and Pacheco2010; Nondédéo and Patrois Reference Nondédéo, Patrois, Monod-Becquelin, Breton and Ruz2010; Ruppert and Denison Reference Ruppert and Denison1943).
The following phase, Río Bec Tardío 1 (a.d. 630–710), is distinguished by the rise of multichamber buildings adopting a tripartite layout, the most common form being the six-room variant with three tandem rooms (three pairs of front and rear rooms; Thompson Group, Structure 2 and Group B, Structure 6N1). One exceptional edifice has 11 rooms (Group O, Structure 1), but its dating remains open to discussion. Yet many structures exist with only one or two rooms. Among the innovations, the most notable is perhaps the emergence of roofcombs decorated with the Earth monster mask (Ceibarico B, Structure 1; Group O, Structure 1; Group B, Structure 1), while façade decoration in general became more frequent, though often limited to sculptured panels with a checkerboard design (Group B, Structure 1), stepped frets (Thompson, Structure 1), or plain panels (Thompson, Structure 2).
The following Río Bec Tardío 2 phase (a.d. 760–810; no known foundation dates from the period a.d. 710–760) is marked by the rise of the Río Bec style preceding the apogee of the following phase. On the micro-regional scale, the number of edifices built increased substantially during this phase. What no doubt most clearly defines this phase is the emergence of towered edifices, of which one of the earliest examples seems to be Group N, Structure 1, which dates to the beginning of the phase, followed by the famous Group B, Structure 6N1 at the end of the phase. This feature spread quickly at the end of Río Bec Tardío 2, and is also found at Group I, Structure XI, and Group L, Structure 6M13. Contrary to earlier interpretations (Bueno Cano Reference Bueno Cano1999; Gendrop Reference Gendrop1983, Reference Gendrop1987), and as far as our studied micro-region is concerned, the emergence of this type of building is quite late and seems to emerge in the west before spreading east and north. Parallel to the proliferation of towered edifices, a monumental tendency is marked by the building of great platforms (Ocelote, Structure 1; Group O, Structure 2; Group I, Structures XI and XV) supporting these new multiroom edifices. Elevated locations tend to be preferred for the larger residences, now often set on hilltops (Group L, La Tortuga) (see Nondédéo and Patrois Reference Nondédéo, Patrois, Monod-Becquelin, Breton and Ruz2010). A wide diversity in the number of rooms is apparent, but even more notable is the emergence of long halls with open façades—possibly reinforcing the role of these buildings as meeting places. Another new feature is the zoomorphic door, either integral (Yaxek, Structure 4) or partially integrated (Group I, Strructure XI), but their number seems locally more limited than in other parts of the Río Bec region. Lastly, among the decorative motifs that now enrich the iconographic corpus, the cross design decorates upper fake temples, façade panels, and/or atadura molding (three-element molding, in cross section, with bevelled profiles on the top and bottom of a squared profile). The latter was borrowed from more northerly regions and appears locally around a.d. 800.
The Río Bec Terminal phase (a.d. 830–900) again sees wide-scale building activity, with no less than 16 truly monumental edifices constructed between a.d. 830 and 850 (Makan 2 ceramic subphase). The greatest diversity is witnessed in the types of structures, most having one to six rooms each, but a few with even more. Towered buildings are more frequent (Group M, Structure 1; Ceibarico A, Structure 1; La Tortuga, Structure 1; El Porvenir, Structure 2; etc.) and they diffuse toward the east, while the zoomorphic doors are confined to the west (Group I, Structure XVII). With many more towered edifices, the previous monumental trend becomes the rule for multiroom buildings (Group III, Structure I; Group V, Structure V; etc.). This final period is also marked by an abundance of decoration, whether on roof combs (Omelita, Structure 1), in stucco modeled friezes (Tres Lunas, Structure 1; Omelita, Structure 32), or carved panels (Group III, Structure 1; El Porvenir, Structure 1). Façades could also be decorated with embedded columns (El Porvenir, Structures 1, 2, and 4; Group C, Structure 7N-75) or false glyphs on medial moldings (Group A, Structure 5N2). Yet a series of buildings from this phase were left undecorated—generally residences with only one to four rooms (Group I, Structure 1; Group G, Structure 1; El Tinaco, Structure 1; Group E, Structure 1). After a.d. 900, many buildings were still occupied in the micro-region, but no new construction has been detected, with the most recent construction occurring at El Porvenir.
CONCLUDING REMARKS
Many results of the chronological research presented in this paper call for extensive discussion. The latter is provided in other papers of this special section, as each summons, at length, a large amount of additional data that cannot be dealt with here. The architectural sequence we established at the micro-regional (100 km2) scale was certainly an expected outcome, and many scholars acquainted with the development of Yucatan Maya styles will not be surprised to learn that the Río Bec style did not appear out of nowhere, but instead resulted from a slow integrative process of sequential innovations in architecture (morphology and building types) as well as in iconography. Yet the late introduction of towers and zoomorphic doorways should also be seen as a perfect illustration of the same process, and Río Bec architecture should be considered a late phenomenon as its apogee falls at the transition from the Late to Terminal Classic period (from around a.d. 830 onward). This gradual evolution differs somewhat from previous stylistic datation of Río Bec edifices and could certainly not be inferred without any excavations, but rather needed a good deal of excavation work.
Construction of large multiroom residences developed along with a process of settlement contraction during the Late Classic period, from approximately a.d. 700 onward, with a subsequent process of nucleation clearly discerned on the eastern and western sides of the micro-region (Nondédéo et al. Reference Nondédéo, Arnauld and Michelet2013). What appears to have been a relatively short-lived phenomenon (four centuries) originating outside of the Río Bec micro-region, is probably related to the potential of a center like Becan to invent and/or develop and diffuse a new architectural style, with innovations reaching Río Bec from the west. Nevertheless, the style diffused through some other mechanism than physical population movements into the region, for which no evidence is forthcoming. Rather, the contraction process by which minor households apparently joined larger and more powerful houses in order to build great residences, with distinct families then dwelling together under the same roof, points to a rather weak influx of non-local population into the Río Bec micro-region and its margins.
At this regional level at least, Río Bec must be considered a “provincial” development. This is all the more surprising when we realize that this settlement and its corresponding Late-Terminal Classic society was located a relatively short distance from other central lowland sites such as Calakmul and Dzibanche (Nondédéo et al. Reference Nondédéo, Patrois, Lacadena, Arnauld, Taladoire and Michelet2011). One is left with the feeling that Río Bec residents had to wait until long after the elites from those politically and socially powerful centers had ceased to dominate interregional exchange. It was only when they finally came to open themselves to new ideas about architecture that the Río Bec horizon expanded rapidly over a large area, although this late heyday did not last more than a hundred years.
RESUMEN
La región Río Bec se distingue de otras regiones de las tierras bajas por tener un patrón de asentamiento disperso, con unidades residenciales sin centro público nucleado. Los grupos monumentales son pequeños y corresponden a unidades habitacionales insertadas en medio de una red de unidades más modestas. El estudio de las residencias grandes y pequeñas permite clarificar la organización sociopolítica del área. Ante todo, la dinámica social local se debe de inferir en base a una cronología precisa de la ocupación. En el sitio cercano de Becan, Ball había establecido que el apógeo del estilo Río Bec corresponde a las fases cerámicas Bejuco (600–730 d.C.), Chintok (730–830 d.C.) y Xcocom (830–1050 d.C.). En el caso del estudio cronológico de Río Bec, un programa de sondeos fue desarrollado a dos escalas espaciales, en la “microregión” de 100 km2 y en la “zona nuclear” de 159 ha. En la primera, el reconocimiento permitió localizar 48 grupos monumentales que se añaden a los 25 grupos ya conocidos en 2002, y de este total de 73 grupos, 35 fueron sondeados (48%). En la zona nuclear, la prospección sistemática permitió definir 125 unidades habitacionales, monumentales y modestas; de éstas, 52 fueron sondeadas o excavadas (42%). El material cerámico obtenido fue clasificado según el sistema tipo-variedad por Sara Dzul, quien definió siete complejos mayores, cubriendo desde el preclásico medio hasta el clásico terminal. Para la microregión, para la zona nuclear y para el Grupo B enteramente excavado, tres seriaciones de los mejores lotes cerámicos fueron realizadas por Mélanie Forné y evaluadas por medio de un análisis factorial. Esto llevó a construir la secuencia general con una buena coherencia general y una relativamente alta resolución temporal. Esta secuencia sigue las grandes líneas de la secuencia de Becan, con diferencias de tipos y de ritmos. Cierta identidad local aparece durante el clásico temprano (complejo Iximche, 425–550 d.C.), con una transición continua y progresiva hacia el clásico tardío desde Kanlol (550–700 d.C., dividido en dos facetas 1 y 2) hasta Makan (700–850 d.C., dos facetas 1 y 2), éste último complejo con fuerte personalidad. El complejo Xpuhuk (850–1000 d.C., tres facetas 1, 2 y 3) es típico del periodo clásico terminal. Para la datación absoluta de la secuencia, además de las fechas cerámicas proporcionadas por trabajos anteriores y reevaluadas por Dzul, se dispone de algunas fechas radiocarbono y de fechas calendáricas (estelas labradas de los Grupos II, V y de Kajtun).
A las dos escalas de la microregión y de la zona nuclear, dos diagramas muestran la dinámica de construcción y ocupación de las unidades habitacionales fechadas. La microregión pertenece todavía a la tradición petenera, durante el preclásico y el clásico temprano (Grupo II y Kajtun), mientras que se fundan numerosos grupos dispersos. La fase Kanlol (550–700 d.C.) inicia el fenómeno de la arquitectura Río Bec, pero el apógeo de la ocupación corresponde a la fase Makan (700–850 d.C.). El dinamismo persigue durante Xpuhuk 1-2, mientras que en Xpuhuk 3 (950–1000 d.C.) se da el abandono de las viviendas mamposteadas. A la escala de la zona nuclear donde las dinámicas son más locales, después de una ocupación posiblemente densa en pequeñas unidades que no dejaron más huella que sencillas bases de muros y montones de piedras, el desarrollo de la ocupación con viviendas abovedadas es marcado en Kanlol, mientras que durante Makan se da cierto proceso de contracción, siendo abandonadas unas unidades modestas durante la construcción de las grandes residencias multicuartos. Es notable el desarrollo paralelo de los vecinos Grupos B y C, fundados en el clásico temprano, así como de otros grupos más tardíos.
También en base a la datación cerámica precisa de rellenos, fue posible construir una secuencia estilística precisa de la arquitectura Río Bec, poniendo en orden 39 secuencias locales. Se hace hincapié en que las cresterías aparecen en la fase Río Bec Tardío 1 (630–710 d.C.), los edificios con torres en la fase Río Bec Tardío 2 (760–810 d.C.), así como las puertas zoomorfas—escasas en la microregión—mientras que grandes edificios multicuartos se multiplican todavía en 830–850 d.C. en Río Bec Terminal, cuando se sigue construyendo residencias más pequeñas sin decoración. Después de 900 d.C., muchas residencias grandes y modestas siguen ocupadas, pero no hay construcción nueva. El apógeo de la arquitectura Río Bec corresponde a un momento breve ubicado en la transición entre clásico tardío y clásico terminal, hacia 830–850 d.C.
ACKNOWLEDGMENTS
We wish to thank all the project members, especially Antonio Benavides Castillo and Sylviane Boucher, whose work and consultations have contributed to our definition of the regional chronological frame, as presented in this article. Without their help and constant discussions, it would not have been possible. Special mention goes to Nidia Rojas Durán, who first defined the preliminary sequence and provided useful data. We also wish to acknowledge the data provided by Prentice Thomas and Janice Campbell from their previous investigations. In the course of the elaboration of the sequence, we benefited from the assistance of Antonio Benavides Castillo and Ernesto Vargas, who organized a symposium at the International Congress of Americanists in Seville (2006) and later forwarded us useful and pertinent comments. Nicolas Latsanopoulos, who greatly improved our illustrations, is to be thanked as well. It is impossible to name all the colleagues who have provided advice, comments, or criticisms in the course of our research. May they find our gratitude here.