


1. Introduction
The idea that democratic dissatisfaction fuels electoral abstentionism in less established democracies, such as those of Central and Eastern Europe (CEE), is taken for granted by many analysts.Footnote 1 The association between democratic disillusion and low voter turnout is extensively echoed in media and pundit accounts of election results across the region.Footnote 2 Yet, and quite surprisingly, this association has received little empirical scrutiny. As we review below, individual-level evidence, if any, has mostly come from post-election surveys in which the connection between turnout and democratic satisfaction may stem from a reversed relationship—that is one where participation leads to an increase in satisfaction. Such a reversed relationship is likely since the literature on established democracies finds that elections increase democratic satisfaction, especially among election winners (Singh and Mayne, Reference Singh and Mayne2023). In fact, the existing research on Western countries does not support the claim that democratic dissatisfaction yields electoral abstention (Kostelka and Blais, Reference Kostelka and Blais2018). These contrasting expectations and findings highlight the need for further research, as shifts in voter turnout hold implications inter alia for political equality, public policy, and the nature of party competition (Blais et al., Reference Blais, Dassonneville and Kostelka2020).
This article fills this important lacuna by conducting a thorough and theory-driven empirical investigation of the connection between democratic (dis)satisfaction and electoral participation in CEE. The empirical section tests four preregistered hypotheses through two empirical analyses. The first analysis employs the longest election panel ever conducted in CEE: an original five-wave survey administered around the Czech 2023 presidential election. This panel starts 2 months before the first round of the 2023 Czech election and ends 5 months after the second round. The second analysis pools together all earlier election panels from the region that measure satisfaction with democracy both before and after elections. This analysis includes data from the Czech Republic, former East Germany, Hungary, Poland, and Romania (N = 8126).
The results are consistent across the two analyses and empirically support both types of linkages between satisfaction and participation. First, they provide pioneering empirical evidence that, unlike in the West, pre-election satisfaction is related to voter turnout in CEE. This association is robust to controlling for less time-variant correlates of participation such as education or political interest. Second, like in the West, participation in elections is associated with increases in satisfaction among voters, particularly those who voted for the election winner. Interestingly, these increases begin to emerge already during the election campaign and, to a lesser degree, are observed among all citizens, including abstainers. This suggests that the observed association between participation and pre-post-election increases in satisfaction does not stem exclusively from the act of voting or its outcome. Some of this association may arise from anticipation of the election results or the broader election experience, which may be stronger for voters than for abstainers even before the former turn out to the polling station.Footnote 3
These findings hold important implications for our understanding of the relationship between satisfaction with democracy and participation in newer democracies, the mechanisms through which elections legitimize democratic regimes, and the best practices when interpreting citizen attitudes in post-election surveys.
2. Literature review
Satisfaction with democracy is best seen as an indicator of regime performance, lying between more diffuse support for political community and regime principles, and support for specific institutions and political actors (Norris, Reference Norris and Norris1999; Linde and Ekman, Reference Linde and Ekman2003; Linde, Reference Linde2012; Valgarsson and Devine, Reference Valgarsson and Devine2022; Singh and Mayne, Reference Singh and Mayne2023, 194). This factor has been found to matter for protest participation (Dalton, Reference Dalton2004, Chapter 8; Vráblíková, Reference Vráblíková2014; Reference Vráblíková2017, 57; Kostelka and Rovny, Reference Kostelka and Rovny2019), support for European integration (Anderson, Reference Anderson1998; Kritzinger, Reference Kritzinger2003; Hix and Hoyland, Reference Hix and Hoyland2022), and also democratic survival by impacting support for regime principles (Claassen and Magalhães, Reference Claassen and Magalhães2022).
Voter turnout is significantly lower in CEE than in Western Europe (Barnes, Reference Barnes2006; Bernhagen and Marsh, Reference Bernhagen and Marsh2007; Kostelka, Reference Kostelka2014; Reference Kostelka2017b), which scholars and pundits often attribute to citizen dissatisfaction with post-communist democracy (Kostadinova, Reference Kostadinova2003; Kostadinova and Power, Reference Kostadinova and Power2007; Karp and Milazzo, Reference Karp and Milazzo2015). Although this explanation seems compelling at face value, and CEE citizens are significantly less satisfied with democracy than their Western counterparts (Klingemann, Reference Klingemann, Dalton and Welzel2014),Footnote 4 its potential theoretical weakness lies in the fact that democratic dissatisfaction may be either demobilizing or mobilizing (Pacek et al., Reference Pacek, Pop-Eleches and Tucker2009, 474). While some dissatisfied citizens may withdraw from politics and stop participating, others may, on the contrary, seek to vote in order to sanction under-performing politicians and parties and/or support alternative candidates. The negative and positive effects of political dissatisfaction on turnout may thus cancel out.
Empirically, previous macro-level studies found no evidence of an association between dissatisfaction and turnout. If anything, high levels of satisfaction correlate with lower turnout (Pacek et al., Reference Pacek, Pop-Eleches and Tucker2009; Kostelka, Reference Kostelka2015; Ezrow and Xezonakis, Reference Ezrow and Xezonakis2016). At the micro-level, Kostadinova Reference Kostadinova(2009) studied corruption perception and discovered that, in line with the theoretical caveat mentioned above, it exerts both positive and negative effects on turnout that cancel out. Using survey data, Karp and Milazzo Reference Karp and Milazzo(2015) found that democratic satisfaction is negatively associated with turnout in European countries and that this could in part account for the difference in turnout levels between the East and the West. However, their research drew on post-election surveys. Using data from 24 election-related panels from five western democracies (Canada, France, Germany, Spain, and Switzerland), collected by the Making Electoral Democracy Work project (Stephenson et al., Reference Stephenson, Blais, Bol and Kostelka2017), Kostelka and Blais Reference Kostelka and Blais(2018) demonstrated that using post-election satisfaction to explain turnout may be problematic. In their analyses, elections legitimize the political system in voters’ eyes while exerting no effect on abstainers. Consequently, the association between satisfaction and turnout in post-election surveys may thus reflect the effect of elections on satisfaction rather than the effect of satisfaction on participation. Plescia et al. Reference Plescia, Daoust and Blais(2021) replicated the study in the context of European Parliament (EP) elections and, again, found that they increase satisfaction with democracy. Importantly, none of these studies covered national elections in CEE, where the negative effect of democratic satisfaction on participation is often assumed.
Abundant evidence suggests that it is not just participation in elections that boosts satisfaction with democracy, but rather that voting for a particular party or candidate increases satisfaction. Past research generally concludes that voters for election winners typically tend to report much higher satisfaction than voters for election losers, and that voting for the winner boosts satisfaction (Banducci and Karp, Reference Banducci and Karp2003; Blais and Gélineau, Reference Blais and Gélineau2007; Esaiasson, Reference Esaiasson2011; Singh et al., Reference Singh, Karakoc and Blais2012; Beaudonnet et al., Reference Beaudonnet, Blais, Bol and Foucault2014; Kostelka and Blais, Reference Kostelka and Blais2018; Plescia et al., Reference Plescia, Daoust and Blais2021; Cohen et al., Reference Cohen, Smith, Moseley and Layton2023; Higashijima and Kerr, Reference Higashijima and Kerr2023). Losing elections exerts typically a much smaller positive effect on voter satisfaction, and, in some cases, it can even reduce it (Esaiasson, Reference Esaiasson2011; Singh et al., Reference Singh, Karakoc and Blais2012; Beaudonnet et al., Reference Beaudonnet, Blais, Bol and Foucault2014; Kostelka and Blais, Reference Kostelka and Blais2018; Plescia et al., Reference Plescia, Daoust and Blais2021; Halliez and Thornton, Reference Halliez and Thornton2023). The relationship between winning and change in satisfaction may be moderated inter alia by the quality of the country’s democracy (Daoust and Nadeau, Reference Daoust and Nadeau2023; Higashijima and Kerr, Reference Higashijima and Kerr2023; Nadeau, Daoust and Dassonneville, Reference Nadeau, Daoust and Dassonneville2023) and perceived difference between competing parties (Ridge, Reference Ridge2023).
The literature differs when conceptualizing who is an electoral winner. The classical approach, which is also the most reflected in citizens’ perceptions of election outcomes (Stiers et al., Reference Stiers, Daoust and Blais2018), defines winners as parties that form the government after an election. Later approaches highlight that it is not only cabinet participation but also parliamentary seats and votes in elections that define winners. The more seats and votes a party gains, the higher the increase in satisfaction with democracy among its voters (Blais et al., Reference Blais, Morin-Chasse and Singh2017). Another study defines winners based on the comparison of the electoral support in current and previous elections: winners are those who support a party that increased its vote share from previous elections while losers vote for a party which lost support (van der Meer and Steenvoorden, Reference van der Meer, Tom and Steenvoorden2018).
The winner/loser gap in satisfaction with democracy may be mediated by policy proximity of the voter and governing parties, and the expectation on the part of voters that the government will enact favorable policies (Anderson et al., Reference Anderson, Blais, Bowler, Donovan and Listhaug2005). Accordingly, Curini et al. Reference Curini, Jou and Memoli(2012) highlight the role of policy closeness between a voter and the cabinet on the level of satisfaction with democracy. Similarly, Singh Reference Singh(2014) uses three criteria to define the proximity between a voter and the party voted for: closeness on the left-right scale, party likability, and party identification. Based on these criteria, he defines optimal winners (voted for the close party) and sub-optimal winners (voted for other than the closest party). His results show that optimal winners yield higher satisfaction with democracy than sub-optimal voters and losers.
Several studies have addressed the effect of winning beyond the parliamentary arena. Research finds that winners become more satisfied in presidential systems after presidential elections (Halliez and Thornton, Reference Halliez and Thornton2023; Whitt et al., Reference Whitt, Yanus, Setzler, McDonald, Graeber, Ballingrud and Kifer2023) and, to a lesser degree, even after regional elections (Daoust et al., Reference Daoust, Ridge and Mongrain2023) and EP elections that have no direct link to the executive (Plescia et al., Reference Plescia, Daoust and Blais2021). Although winning seems to be a multi-dimensional concept (Plescia, Reference Plescia2019), it is clearly connected to the results of elections, and the electoral structure (elected office and electoral system) exerts a specific effect on the winner/loser gap in satisfaction with democracy.
From this perspective, surprisingly little attention has been devoted to the effect of winning and losing in two-round election systems, which are used in most European presidential elections. An important exception in that respect is the study by Beaudonnet et al. Reference Beaudonnet, Blais, Bol and Foucault(2014), which found that in French lower-house elections that use the two-round system, the effect of winning is practically the same in the first and second rounds. In the context of presidential elections, this finding would be excellent news for democratic systems as the two rounds offer the opportunity for a large share of the electorate to be on the winning side at some point. Yet, we do not know whether the findings from French legislative elections, which are localized contests in 577 consistencies, generalize to nationwide and often polarized presidential elections. This study takes an important step in finding out.
3. Theory and hypotheses
Our first three hypotheses engage the nexus of democratic satisfaction and participation in CEE, drawing on the reviewed theorizing and findings from Western countries. The remainder of this section then theorizes the effects of winning and losing in two-round electoral systems used in most European presidential elections.
Based on the findings of the existing literature (Kostelka and Blais, Reference Kostelka and Blais2018; Plescia et al., Reference Plescia, Daoust and Blais2021), we expect that democratic dissatisfaction may be as demobilizing as mobilizing, and that dissatisfied citizens in CEE may be as likely to vote as abstain. For some citizens and in some contexts, dissatisfaction can spur participation, while in others, it may lead to a withdrawal. We thus hypothesize that, in the aggregate, pre-election satisfaction is unrelated to voter turnout, especially when other individual-level correlates and drivers of participation, such as education and political interest, are controlled for.
The inclusion of controls allows for a strong test of the demobilization hypothesis. Reported dissatisfaction can be used as an escape strategy by citizens who lack the resources to participate in order to legitimize their electoral abstention and lack of psychological involvement in politics. However, if dissatisfaction with the performance of the political system is truly demobilizing, we should observe that it is associated with abstention even when accounting for less time-varying correlates of participation.
Hypothesis 1. Pre-election satisfaction is unrelated to participation when sociodemographic controls and other attitudinal drivers of participation are controlled for. Footnote 5
Elections are the only opportunity for all citizens in representative democracies to formally and simultaneously participate in the country’s government and indicate their preferences. They are crucial moments for democratic regime legitimacy, likely to trigger a boost in democratic satisfaction. This boost may start by anticipation already during the election campaign, and it is likely to be stronger for voters who are more connected to the political process (e.g., they follow pre-election developments more closely) and presumably draw more satisfaction from the broader electoral experience.Footnote 6 Therefore, we hypothesize that voter turnout is more strongly associated with post-election satisfaction than pre-election satisfaction.
Hypothesis 2. Voter turnout is more strongly associated with post-election satisfaction than pre-election satisfaction.
Hypothesis 2 expects that the legitimizing effect of elections is stronger on voters than abstainers. However, there is reason to expect that, on average, abstainers’ satisfaction may be entirely unaffected by elections. Abstainers are less likely to follow the election-related media coverage and engage in political discussions, they cannot draw gratification from the act of voting and, arguably, are less emotionally invested in the election outcome and its anticipation. In short, many of them are presumably de facto excluded from the democratic process and do not benefit from the several micro-mechanisms that may account for the overall legitimizing effect of elections. We thus hypothesize that not only are pre-post election increases in satisfaction stronger among voters, which is implied by Hypothesis 2, but that they cannot be observed at all among abstainers.
Hypothesis 3. Pre-post election increases in satisfaction can be observed among voters, but not among abstainers. Footnote 7
In most existing studies, post-election increases in democratic satisfaction are strongly related to winning, which is accounted for by two types of mechanisms (Daoust et al., Reference Daoust, Plescia and Blais2023): instrumental and emotional. The instrumental mechanism refers to citizens’ expectations that their favorite candidates will deliver favorable policies and decisions when elected. The emotional mechanism pertains to positive emotions triggered by the sense of winning or being in power, which can affect one’s self-esteem or even exert positive physiological reactions (Bernhardt et al., Reference Bernhardt, Dabbs, Fielden and Lutter1998). Each mechanism presupposes that a favorable outcome of the election makes citizens more positive about the political system as a whole. Prior research finds mixed support for both mechanisms (Curini et al., Reference Curini, Jou and Memoli2012; Singh, Reference Singh2014; Daoust et al., Reference Daoust, Plescia and Blais2023) and the present study does not have the ambition to disentangle them. However, it is reasonable to assume that, in political systems with limited presidential powers such as those in CEE, the emotional mechanism prevails in presidential elections as they usually have no direct policy implications.
While losing could be in theory associated with the reversed effect of the instrumental and emotional mechanisms, this receives less empirical support in the literature. Although losers clearly became less satisfied after some elections (Anderson et al., Reference Anderson, Blais, Bowler, Donovan and Listhaug2005; Craig et al., Reference Craig, Martinez, Gainous and Kane2006), the most extensive studies using a large number of panels find that losers’ satisfaction usually mildly increases (Esaiasson, Reference Esaiasson2011; Kostelka and Blais, Reference Kostelka and Blais2018; van der Meer and Steenvoorden, Reference van der Meer, Tom and Steenvoorden2018). In most elections, the legitimizing effect of elections overcomes the disappointment from losing and the increases in the winner-loser gap in satisfaction come from winning.
Election victories probably exert the strongest effect immediately after the election. However, their effects may start to kick in earlier as voters anticipate the election outcome based on opinion polls and other cues. In line with this assumption, studies from the Netherlands (van der Meer and Steenvoorden, Reference van der Meer, Tom and Steenvoorden2018) and Africa (Higashijima and Kerr, Reference Higashijima and Kerr2023) observed the legitimizing effect of elections, affecting all voters, even before voting took place.
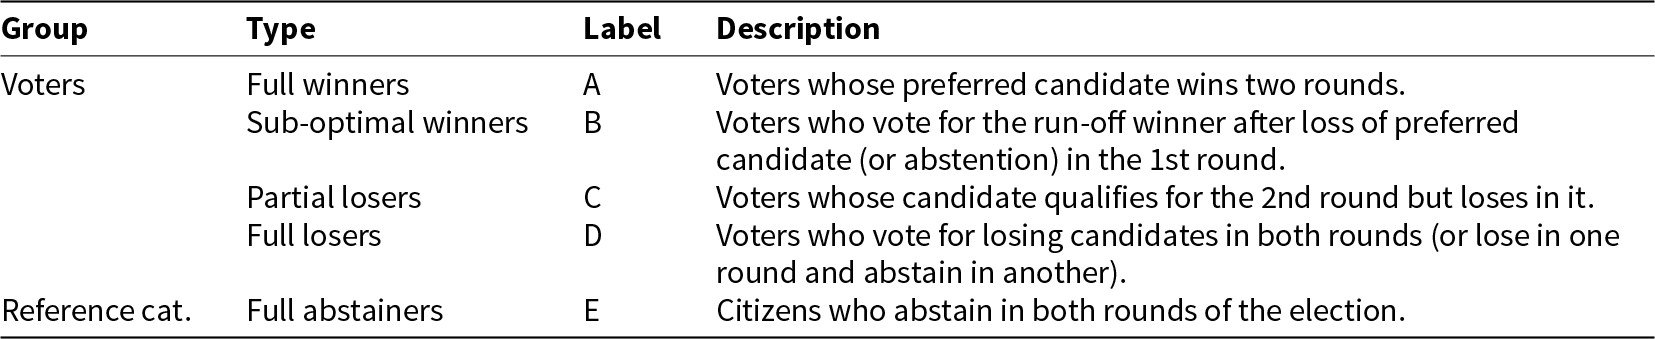
Winning in two-round presidential elections may differ from winning in, typically one-round, legislative elections on which most prior research focuses. Considering possible election outcomes and trajectories in voters’ behavior, the run-off electoral system produces the following main categories of voters (see also Table 1): full winners, whose preferred candidate wins both rounds (A), sub-optimal winners who vote for the winner of the second round after a loss of their preferred candidate in the first round (B), partial losers whose preferred candidate qualifies for the second round and loses in it (C),Footnote 8 and full losers who vote for a losing candidate in each round of the election (D). These groups can be compared to full abstainers who abstained in both rounds of the election (E). Naturally, more voting trajectories are possible especially between losing and abstention. However, in line with the existing literature, we expect that the differences in election effects on satisfaction will be minor between losers and abstainers and large between winners and losers/abstainers. For hybrid trajectories between voting and abstention (i.e., voters who voted in one round and abstained in another), our typology thus considers losing and abstaining as interchangeable. For instance, voters who abstained in round 1 and voted for the winner in round 2 belong to sub-optimal winners (B).
Main types of voters in two-round electoral systems
Our baseline hypothesis, inspired by the findings from French legislative elections (Beaudonnet et al., Reference Beaudonnet, Blais, Bol and Foucault2014), is that all types of winning, including qualifying for the second round (category C), inspire some form of gratification and lead to a similar boost in satisfaction. The underlying assumption here is that voters are satisfied when their vote choice appears to make an impact and contribute to an election success, and even if this success is short-term in the first round. The key condition here is to be on the winning side for at least some time.
Hypothesis 4. The strongest increase [in satisfaction] is among those [voters] whose preferred candidates qualify for the 2nd round (1st round of voting) or won the second round (2nd round of voting) (categories A, B & C). Footnote 9
We formulate two alternative hypotheses that are mutually exclusive with Hypothesis 4.Footnote 10 The first suggests that winning may be a cumulative concept and that wining twice (category A) is better than winning once (categories B or C). The strongest post-election boost in satisfaction should thus occur among full winners (A). It should be noted that while this hypothesis makes intuitive sense, there are empirical reasons for skepticism. First, Beaudonnet et al. Reference Beaudonnet, Blais, Bol and Foucault(2014) did not find such cumulative effect in the two-round French legislative elections. Second, (Blais and Gélineau Reference Blais and Gélineau2007) found that, in federal Canada, winning in one’s constituency and at the federal level did not yield significantly more satisfaction than winning only in the constituency or only at the federal level.
Hypothesis 4.1. The strongest increase in satisfaction is among those who voted for the winner in both rounds (category A, full winners) than those who voted for the winner only in one of the two rounds (categories B & C).
The other alternative hypothesis observes that only winning the second round results in obtaining the office. Winning the first round may have little value if it is followed by a defeat in the run-off, and a defeat in the first round matters little if one’s preferred candidate is ultimately elected. From this perspective, the effect of winning in the second round could exert a stronger effect on voters. Full and sub-optimal winners (A & B) should experience a stronger boost in satisfaction than voters who voted for a candidate that was successful only in the first round, as from the perspective of the second round these voters are losers (C).
Hypothesis 4.2. The increase in satisfaction is stronger among those who voted for the overall winner in the 2nd round (categories A & B) than among those who voted for the candidate who qualified for the second round but lost in it (category C).
4. Data and methods
To test our hypotheses, we conduct two studies. The first leverages data from a five-wave Czech Presidential Election Panel Survey (Linek and Škvrňák, Reference Linek and Škvrňák2024) conducted in the context of the 2023 Czech presidential election. Seven male and one female candidates contested the first round of the election on January 13 and 14. The run-off, held 2 weeks later (January 27–28), opposed a retired army general and former Chairman of the NATO Military Committee, Petr Pavel, and leader of the opposition and former Prime Minister, Andrej Babiš. Pavel won both rounds with 35.4% and 58.3% of votes respectively.Footnote 11
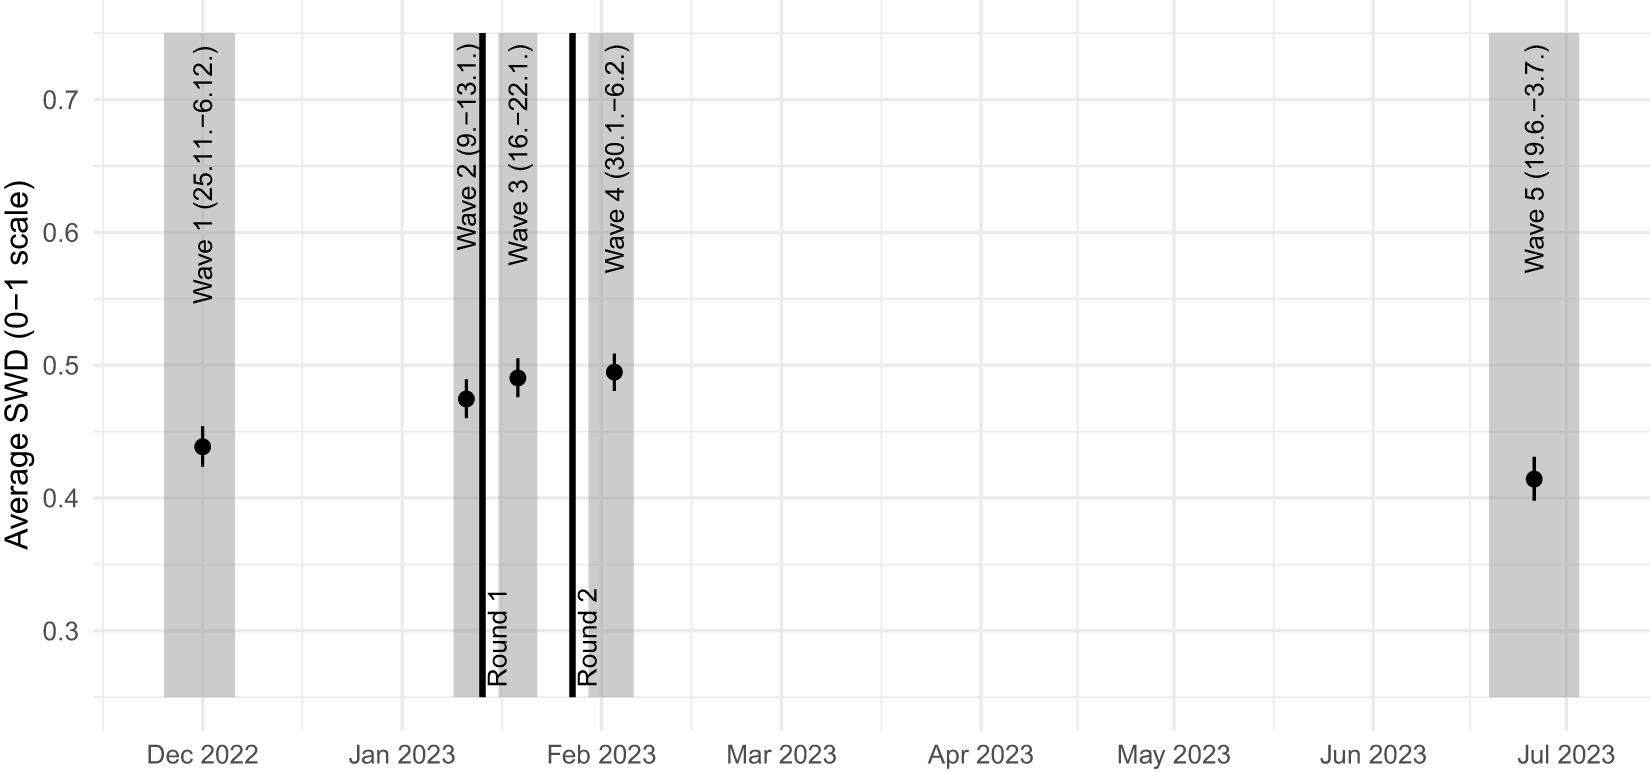
Our data were collected 2 months before the first round (Wave 1), 1 week before the first round (Wave 2), between the first and second rounds (Wave 3), 1 week after the second round (Wave 4), and 5 months after the second round (Wave 5). Figure 1 displays the panel timeline and reports the exact fieldwork dates. The survey was conducted online on a sample of Czech citizens (N = 1501) representative of basic sociodemographic quotas (gender, age, education, and region). To the best of our knowledge, this is the longest election panel measuring satisfaction with democracy that has ever been conducted in CEE. We preregistered our main hypotheses (1, 2, 3, and 4) and our analyses before accessing data from Wave 2 (i.e., before accessing any information on voting behavior or change in satisfaction).Footnote 12
Timeline of the 2023 Czech Presidential Election Panel. Notes: The black circles indicate the average level of satisfaction with democracy within the wave (all respondents participating in the given wave are included) accompanied with bootstrapped 95% confidence intervals. The gray rectangles represent the fieldwork intervals, and the black lines mark election days.
To probe the robustness of the results from Study 1, the second study tests our hypotheses on six earlier panel surveys conducted in CEE (i.e., countries with a communist past in the region).Footnote 13 We collected all panel studies that included questions on satisfaction with democracy in their pre- and post-election waves since democratization in the early 1990s. These panels come from Romania (2009 presidential election, N = 1262; 2012 parliamentary election, N = 1942), the Czech Republic (1996 parliamentary election, N = 575), former East Germany (2017 parliamentary election, N = 2430), Hungary (2019 EP election, N = 1353), and Poland (2019 EP election, N = 1265). Appendix C provides further details on these panels.
We employ two dependent variables: electoral participation, and change in satisfaction with democracy. Electoral participation is measured as a dummy variable (0 = abstention, 1 = participation). In Study 1 (the 2023 Czech presidential election), we use participation measures from both the first and second rounds of election as the dependent variable to test Hypotheses 1 and 2. In all six panels, the pre-election and post-election waves included a question asking the respondents how satisfied they were with the way democracy worked in their country. The pre-post satisfaction difference allows us to compare satisfaction with democracy before and after elections for the same respondent. The 2023 Czech presidential panel measured the satisfaction on a scale from 0 (completely unsatisfied) to 10 (completely satisfied). The German 2017 panel used a five-point scale, and all other panels employed a four-point scale. For consistency and clarity, we transformed all satisfaction variables into a 0 to 1 scale. We use change in satisfaction with democracy as the dependent variable (range from −1 to +1) to test Hypotheses 3 and 4. We provide English wording of the questions and answer categories together with the description of variable transformations in Appendix K.
Some scholars raised the question whether satisfaction with democracy is an indicator that would be comparable across countries (Canache et al., Reference Canache, Mondak and Seligson2001), which may be a particularly acute problem when the studied cases vary in terms of democratic standards. However, the most extensive recent analysis of satisfaction with democracy found that the indicator is, indeed, comparable across a large variety of contexts (Daoust and Nadeau, Reference Daoust and Nadeau2023, Section 1.2). Furthermore, all the countries and election we study met reasonable and comparable democratic standards.
The test of Hypothesis 4 requires a measure of winning. In Study 1, given the two-round electoral system used in the Czech presidential election, we define two classifications of winners. The first looks only at the overall result of presidential elections and winners are those who voted for the winning candidate in the second round (Categories A & B combined) and losers are voters of the other candidate in the second round (all other voters who did not abstain). The second classification of winners reflects the unique feature of the two-round system and distinguishes full winners (A), sub-optimal winners (B), partial losers (C), full losers (D), and full abstainers (E) as defined in the theory section (see also Table 1). For the pooled Study 2, defining winners in various types of elections is based on the logic of the lowest common denominator, that is the party or the candidate with the largest share of votes.
Following Blais and Daoust Reference Blais and Daoust(2020), most of our analyses employ several sociodemographic control variables: dummy variables for being female, having post-secondary education, and for decades of age. Female voters may participate less in EP elections (Dassonneville and Kostelka, Reference Dassonneville and Kostelka2021), while older and educated voters are more likely to vote in general (Smets and van Ham, Reference Smets and van Ham2013). In all seven panel surveys, we are able to control also for party identification (a dummy) and interest in politics (a quantitative variable scaled from 0 to 1), which are typically conducive to participation (Smets and van Ham, Reference Smets and van Ham2013). In the 2023 Czech panel, we also control for feeling that voting is a civic duty (Blais and Achen, Reference Blais and Achen2019) and for political knowledge (Smets and van Ham, Reference Smets and van Ham2013), which are both conducive to participation. The political knowledge variable, which draws on six general questions about Czech politics and the number of correct answers, is scaled from 0 to 1. In the cross-national analysis, we systematically employ election fixed effects to account for election-level differences in the dependent variables.
The preregistered test of Hypotheses 1 and 2 follows the research design in Kostelka and Blais Reference Kostelka and Blais(2018). Using a logistic regression, we regress turnout on pre-election satisfaction (Wave 1), post-election satisfaction (Wave 4), and control variables in four model specifications. The controls include sociodemographics (gender, age, education) and usual predictors of turnout (feeling that voting is a duty, interest in politics, political knowledge, and party identification).Footnote 14
The dependent variable related to Hypotheses 3 and 4 is change in satisfaction with democracy during the election (Waves 1 and 4 of the panel), which we analyze using OLS regressions.Footnote 15 The main independent variables are voter turnout (Hypothesis 3) and voting for candidates who qualified for or won the second round (Hypotheses 3 and 4). The main models include satisfaction from earlier waves to account for ceiling effects.
The Appendix presents the descriptive statistics for all variables in our studies. It also includes a variety of robustness checks that, among others, study the changes in satisfaction between all pre-election and post-election waves of the survey (Study 1) and include additional controls (both Study 1 and 2).
Before we review the results, it is important to remember that our analyses are observational and our findings thus need to be interpreted with caution. Statistically, we cannot rule out that the changes in satisfaction that we attribute to elections and winning are endogenous and driven by unobserved factors. However, we consider this unlikely as such factors would have to temporally overlap with elections and affect differently voters, winners, and losers. Previous studies also observed pre-existing differences in satisfaction between winners and losers (Anderson et al., Reference Anderson, Blais, Bowler, Donovan and Listhaug2005; Dahlberg and Linde, Reference Dahlberg and Linde2017), which may reflect prior election results or citizens sorting into different categories. The panel design of our data, controlling for pre-election levels of satisfaction, and our focus on within-individual change alleviate these concerns.
5. Empirical findings
Figure 1 displays the general timeline of the 2023 Czech presidential panel and the evolution of satisfaction with democracy around the election. Satisfaction increased from 0.44 prior to the beginning of the campaign (Wave 1) to 0.49 after round 1 (Wave 3, p of the difference < 0.001) where it remained after round 2 (Wave 4). The election’s legitimizing effect—assuming that the election was the factor driving the change—thus reached its apex after the first round. Interestingly, two thirds of the increase occurred already during the election campaign as satisfaction reached 0.47 just before the first round (Wave 2).Footnote 16 Finally, the increase was not particularly durable, as by Wave 5, fielded in June/July 2023, satisfaction dropped to 0.41, below the initial level at Wave 1. These shifts are consistent with a short-lived legitimizing effect of the election that starts during the campaign, culminates after round 1, and disappears in 5 months or less.
Table 2 presents country means (and their differences) with 95% confidence intervals for satisfaction with democracy in the pre-election and post-election waves for all country-panels. The table also reports information on the election type, country, and year of election. While the level of satisfaction with democracy varies across the countries, there seems to be a pattern in the pre-post election differences in satisfaction based on election types. Whereas parliamentary and presidential elections consistently seem to increase satisfaction with democracy (p < 0.05 in all cases), EP elections are associated with a slight (though statistically insignificant) decline. The largest increases in satisfaction occurred in the Romanian 2012 parliamentary election (+0.06 on a 0–1 scale), Czech 2023 presidential election inspected in detail above (+0.05), and Czech 1996 parliamentary election (+0.04).
Development of satisfaction with democracy across panel waves
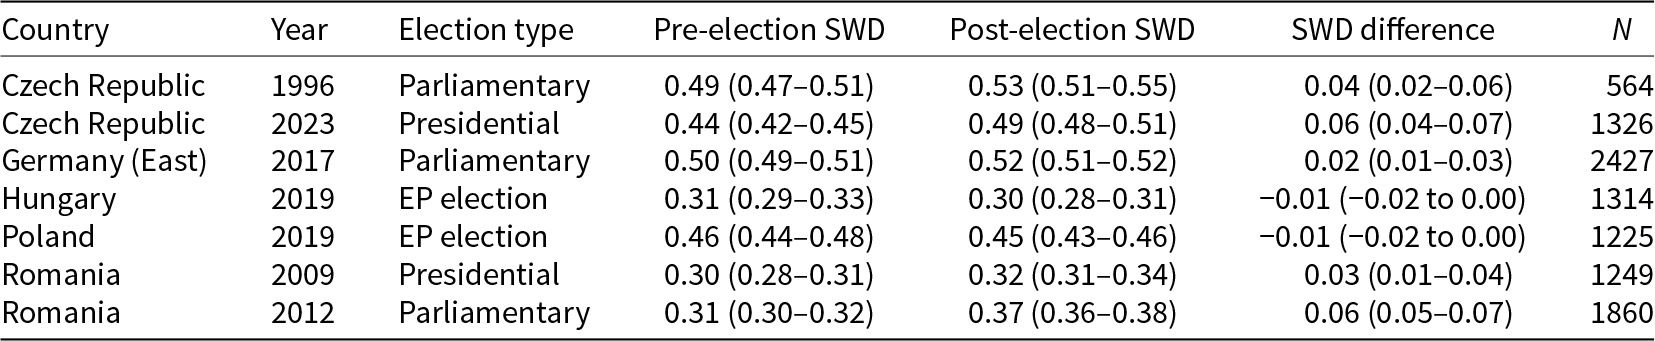
Note: 95% confidence intervals in parentheses.
On the whole, the preliminary descriptive evidence suggests that, like in the West, national elections exert a legitimizing boost on CEE democracies.
5.1. Study 1: The Czech presidential election of 2023
Table 3 probes the relationship between satisfaction with democracy and electoral participation in the 2023 Czech presidential elections. As there were two rounds of voting, and the composition of the effective electorate slightly changed from the first to the second round, we successively show the results for participation in the first round (Models 1–4) and for participation in the second round (Models 5–8). In all models, the regression coefficients of most of the control variables are in the expected direction: duty to vote, interest in politics, political knowledge, and party closeness are associated with more participation. Interestingly, women were more likely to vote in the first round of the election and not in the second. This reversed traditional gender gap in turnout may be due to the presence of a strong female contender (Danuše Nerudová) in the first round, who came third and thus did not qualify for the run-off.
Predicting turnout with satisfaction with democracy: Czech presidential election of 2023
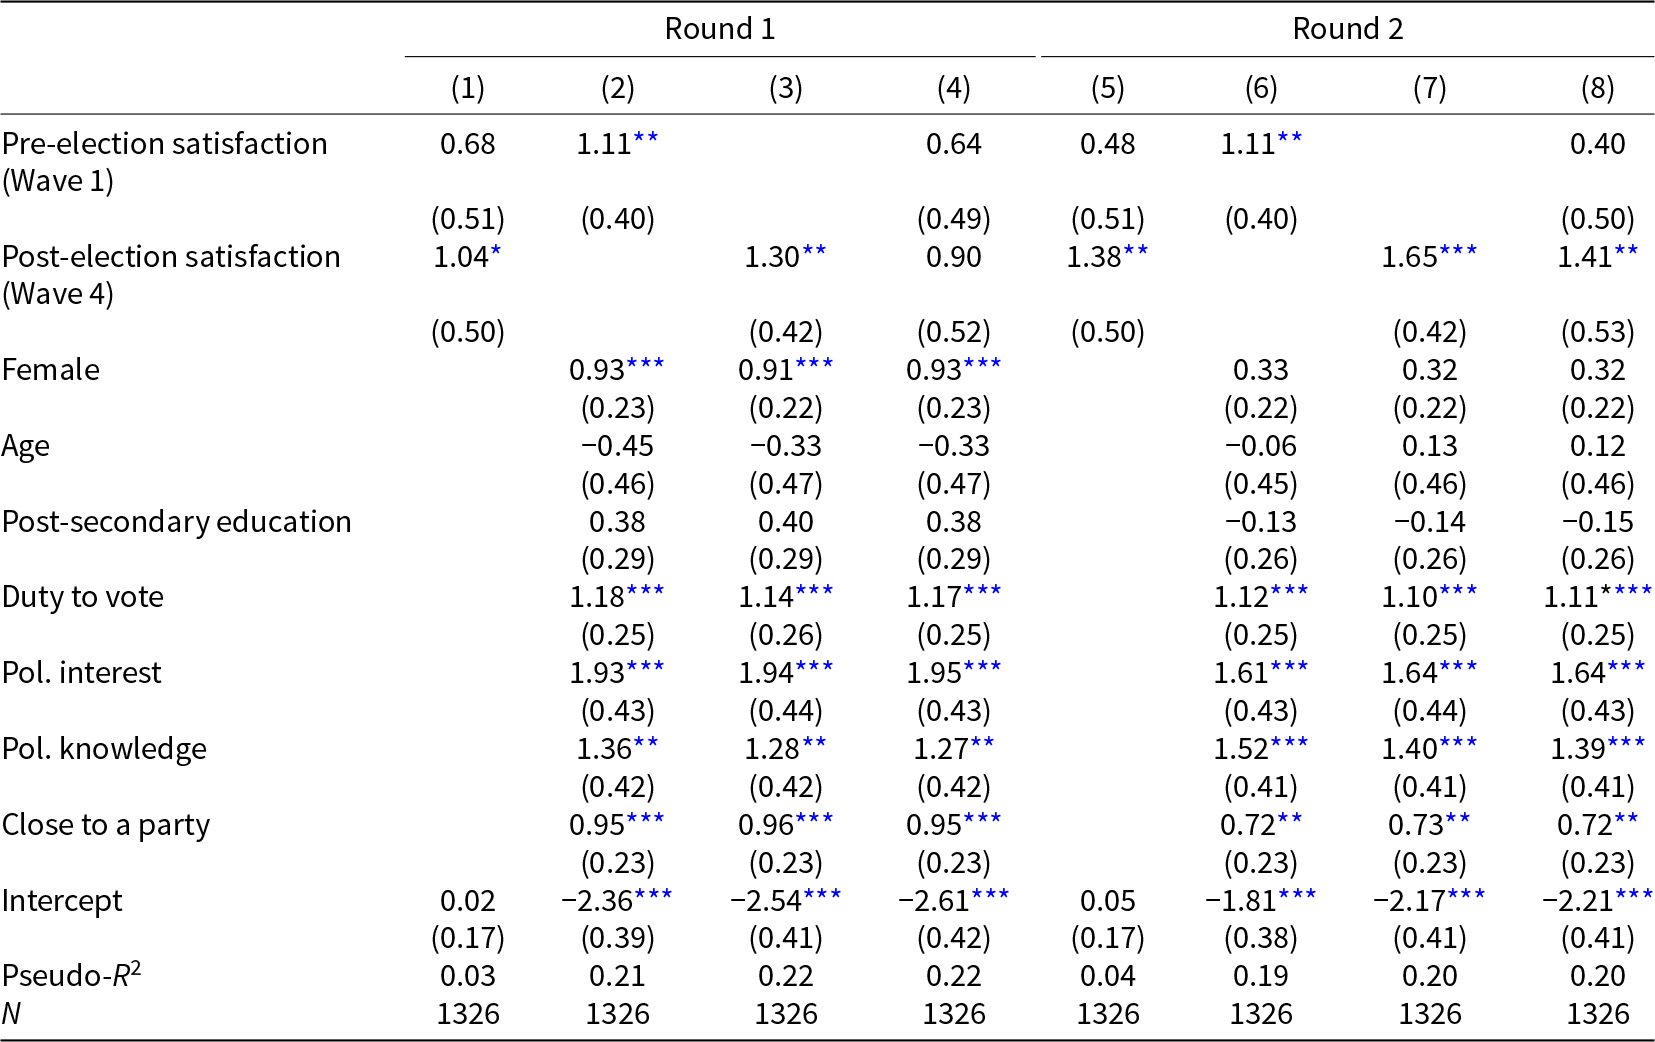
* Notes: Logit coefficients. Standard errors in parentheses. Significance levels: p < 0.05, **p < 0.01, ***p < 0.001.
The results do not support Hypothesis 1, which draws on the findings from Western democracies and states that pre-election satisfaction is unrelated to participation when controls are applied. Models 2 (1st round) and 6 (2nd round) directly test the hypothesis and yield positive and statistically significant (p < 0.05) regression coefficients. This means that more satisfied citizens are more likely to vote, suggesting that democratic dissatisfaction may have contributed to abstention in the first and second rounds of the 2023 Czech presidential election. To the best of our knowledge, this is the first empirical evidence from a panel survey showing that dissatisfaction may be negatively related to participation. To assess the substantive significance of this relationship, we calculated average marginal effects with covariates at observed values (Mood, Reference Mood2010). They indicate that a 0.1 shift on the 0–1 satisfaction scale is associated with a non-negligible increase in the probability to vote of 1.8 percentage points. A fully satisfied citizen (1 on the satisfaction scale) is 18 points more likely to vote than a fully dissatisfied citizen (0), all else being equal.
To further explore the relationship between pre-election satisfaction and turnout, and to leverage better the panel nature of the data, we conducted additional analyses, replacing the satisfaction measurement from Wave 1 in Models 2 and 6 with the change in satisfaction between Waves 1 and 2. The main independent variable in those models is thus within-individual change in satisfaction, which means that no long-term or time-invariant factors can confound the relationship. These additional results, presented in Table A12 in the Appendix, yield substantively and statistically insignificant coefficients (−0.13, p = 0.74 for participation in Round 1; 0.03, p = 0.94 for participation in Round 2), which supports Hypothesis 1.Footnote 17 The cross-sectional results in Models 2 and 6 in Table 3 thus have to be interpreted with caution.
Hypothesis 2, which expects that voter turnout is more strongly associated with post-election satisfaction than pre-election satisfaction, finds support in Table 3. In Models 1 and 5 (without controls) and Models 4 and 8 (with controls), the post-election satisfaction coefficient is always substantively stronger and, unlike that of the pre-election measure, reaches statistical significance in three cases out of four models (Models 1, 5, and 8). These results should be interpreted with caution as none of the differences between the two types of coefficients is statistically significant. Yet, the point estimates indicate that elections may exert powerful effects on voters, which we study more directly in the following analyses.
Before formally testing the remaining hypotheses, Figure 2 plots satisfaction by wave for the five main groups of voter types as conceptualized in Table 1. It is based on marginal effects from a regression of satisfaction with democracy on the voter type variable, post-election wave dummy, their interaction, and election fixed effects. The figure provides several important insights. First, it reveals a persistent large gap in satisfaction, which was present before the 2023 presidential contest, between winners on the one hand, and losers and abstainers on the other. This implies that the election itself cannot account for all the potential differences between these groups and that, when studying how elections affect satisfaction, it is essential to account for its pre-election levels. Second, the figure shows that the election is associated with an increase in satisfaction in all groups of respondents, including abstainers. This means that, in some contexts, elections may exert a legitimizing effect even on those who do not participate in them, contrary to what was found in studies on established democracies. At the same time, in the 2023 Czech presidential election, this potential legitimizing effect was equally short-lived for all groups of respondents: the satisfaction of winners, losers, and abstainers alike dropped by Wave 5. Fourth, as noted above, satisfaction started to increase even before the first round took place and, for abstainers and losers, it remained stable from Wave 2 to Wave 4. This implies that the finding in the literature that elections do not affect abstainers may be due to the timing of earlier panel studies. They often measured pre-election satisfaction shortly before the election, when some of the legitimizing effects may have already kicked in.Footnote 18 Finally, in line with our expectations, it appears that the effect of the election was the strongest among election winners whose satisfaction increased in each of the four first waves of the panel. However, to properly assess the magnitude of this relationship, it is important to factor in ceiling effects, which we do below.
Satisfaction with democracy by respondent subgroup and wave: Czech presidential election of 2023. Notes: 95% confidence intervals. Predicted values based on a linear regression of satisfaction with democracy on the respondent subgroup, wave dummies, and their interactions.
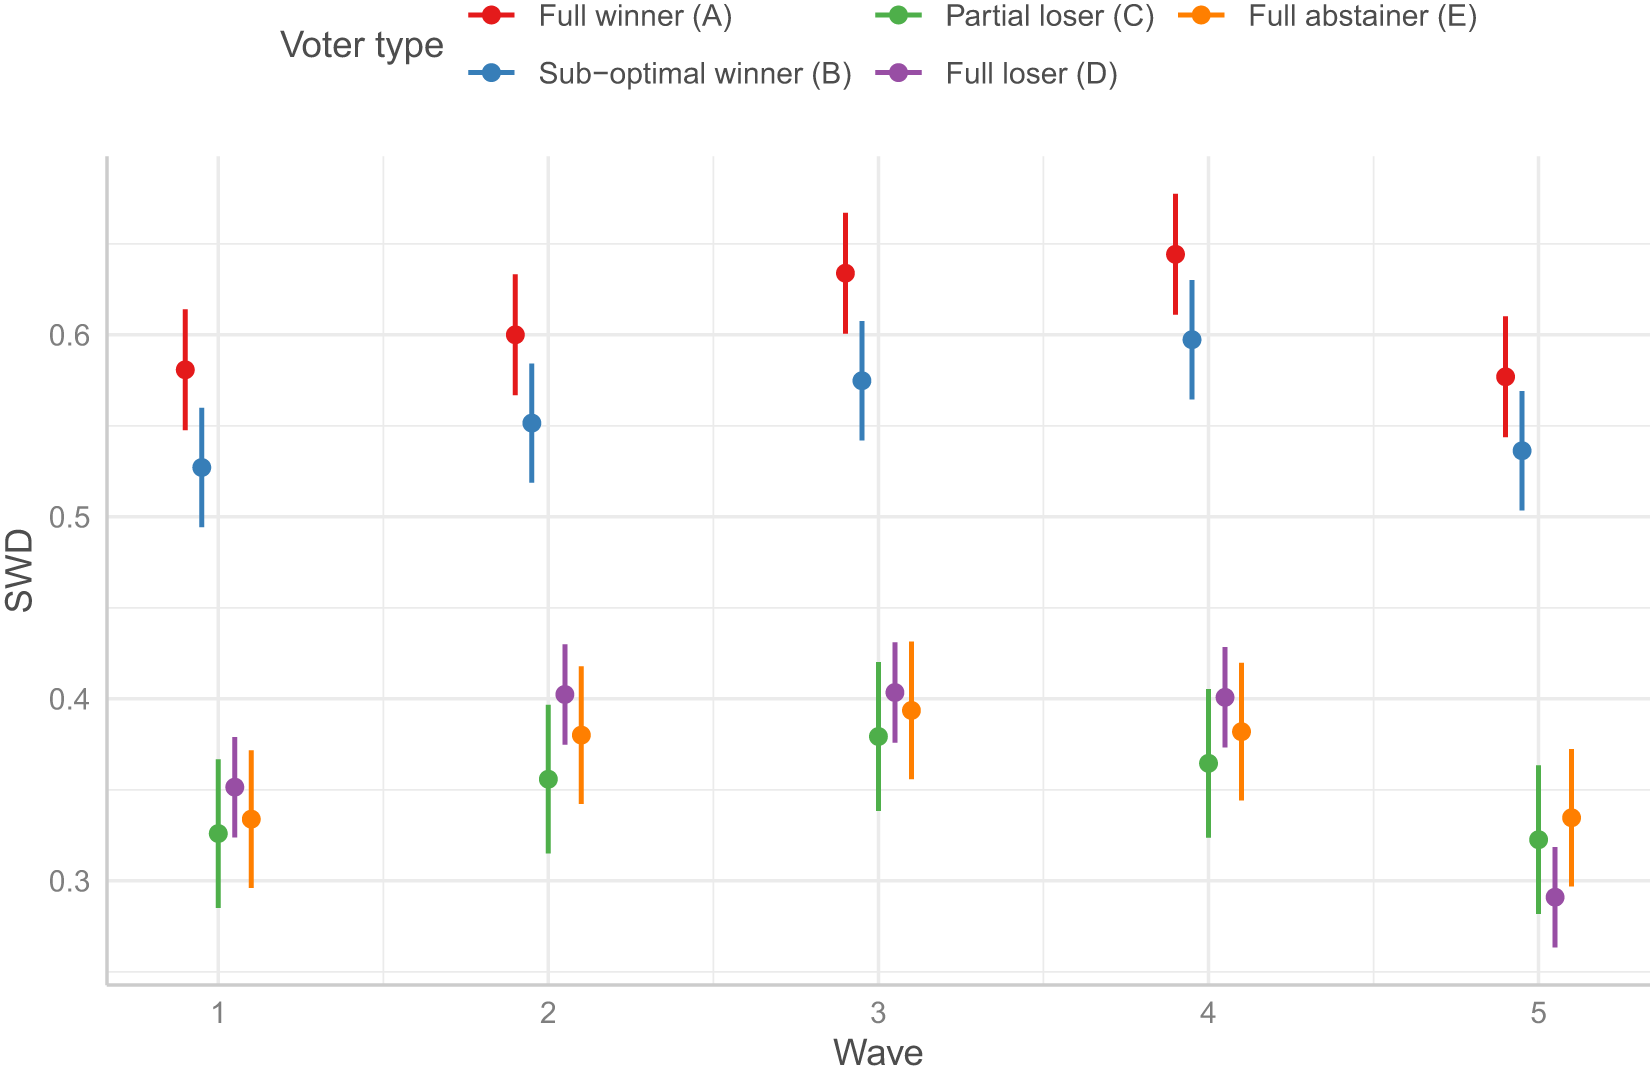
Table 4 tests Hypotheses 3 to 4.2. The dependent variable is the difference between the post-election (Wave 4) and the pre-election (Wave 1) measurements of satisfaction with democracy. As hypothesized, the pre-post difference in satisfaction is higher by 0.05 (p < 0.05) for those who voted in the second round of the election compared to abstainers (Model 1). However, the difference between voting in the first round and abstaining lacks statistical significance (Model 1). These results indicate that voting as such may not always be more conducive to satisfaction than abstaining, and that the effect of participation on satisfaction may be linked to the overall election outcome.
Predicting change in satisfaction with democracy: Czech presidential election of 2023
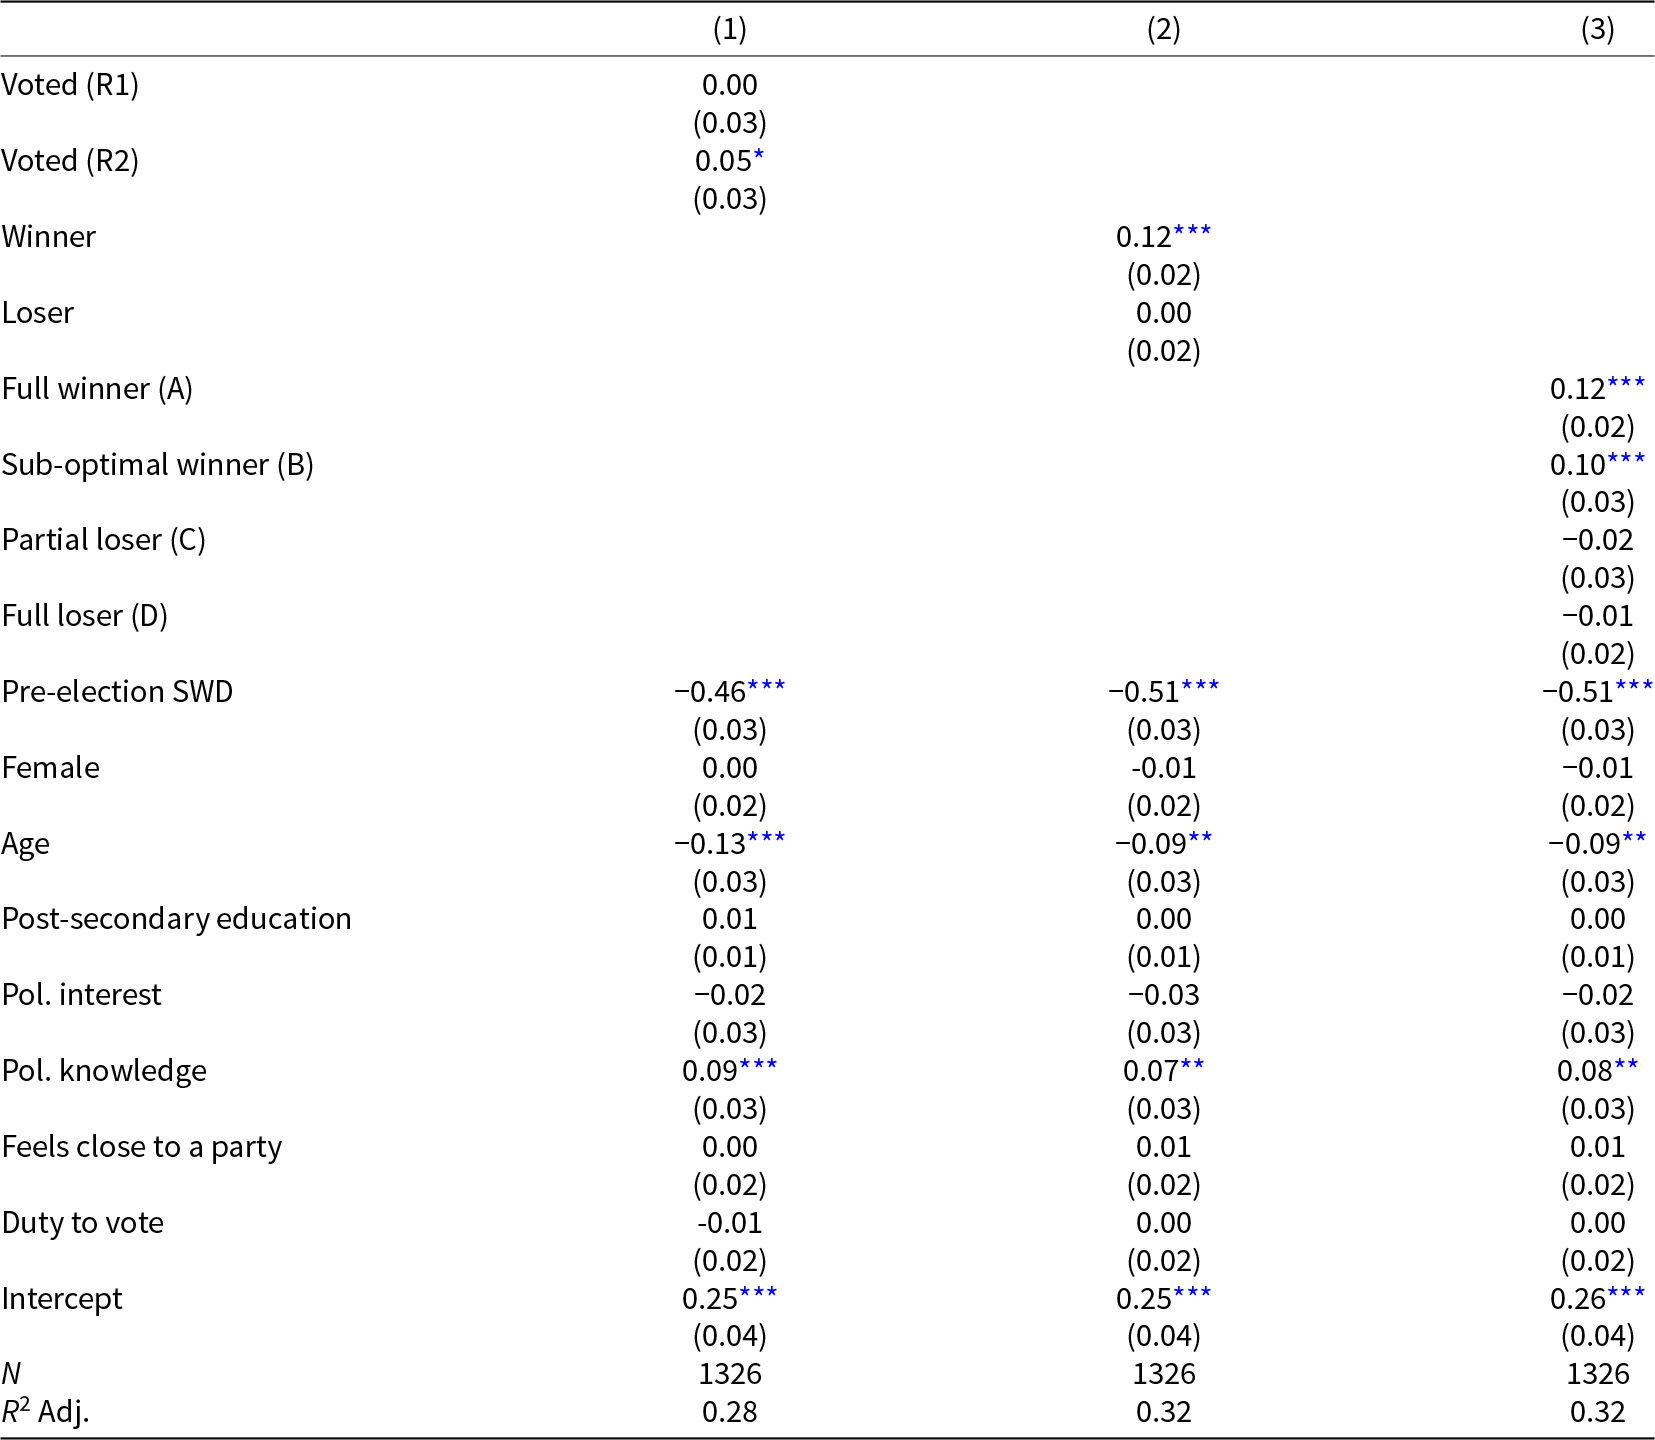
* Notes: OLS coefficients. Standard errors in parentheses. Significance levels: p < 0.05, **p < 0.01, ***p < 0.001.
The remaining models in Table 4 further corroborate the importance of the election outcome for shifts in satisfaction.Footnote 19 They suggest that supporting the overall election winner is key. According to Model 2, voting for the victorious candidate in the second round (categories A and B) is associated with an increase in satisfaction of 0.12 (p < 0.001), whereas losing (C, D) does not differ from abstaining (E—baseline category). Hypothesis 4 states that pre-election change in satisfaction does not differ between election winners (A, B) and partial losers (C), whose candidate qualified for the second round. The negative and statistically insignificant regression coefficient of Partial Loser in Model 3 rejects this hypothesis. It rather validates the competing Hypothesis 4.2, which expects a significantly stronger increase in satisfaction for winners (A, B). Hypothesis 4.1 states that the effect would be even more nuanced, with full winners (A) getting more satisfied than sub-optimal winners (B). Although the increase in satisfaction is stronger for full winners (A) than sub-optimal winners (B), the difference (0.03) lacks statistical significance and thus does not fully support the hypothesis.Footnote 20
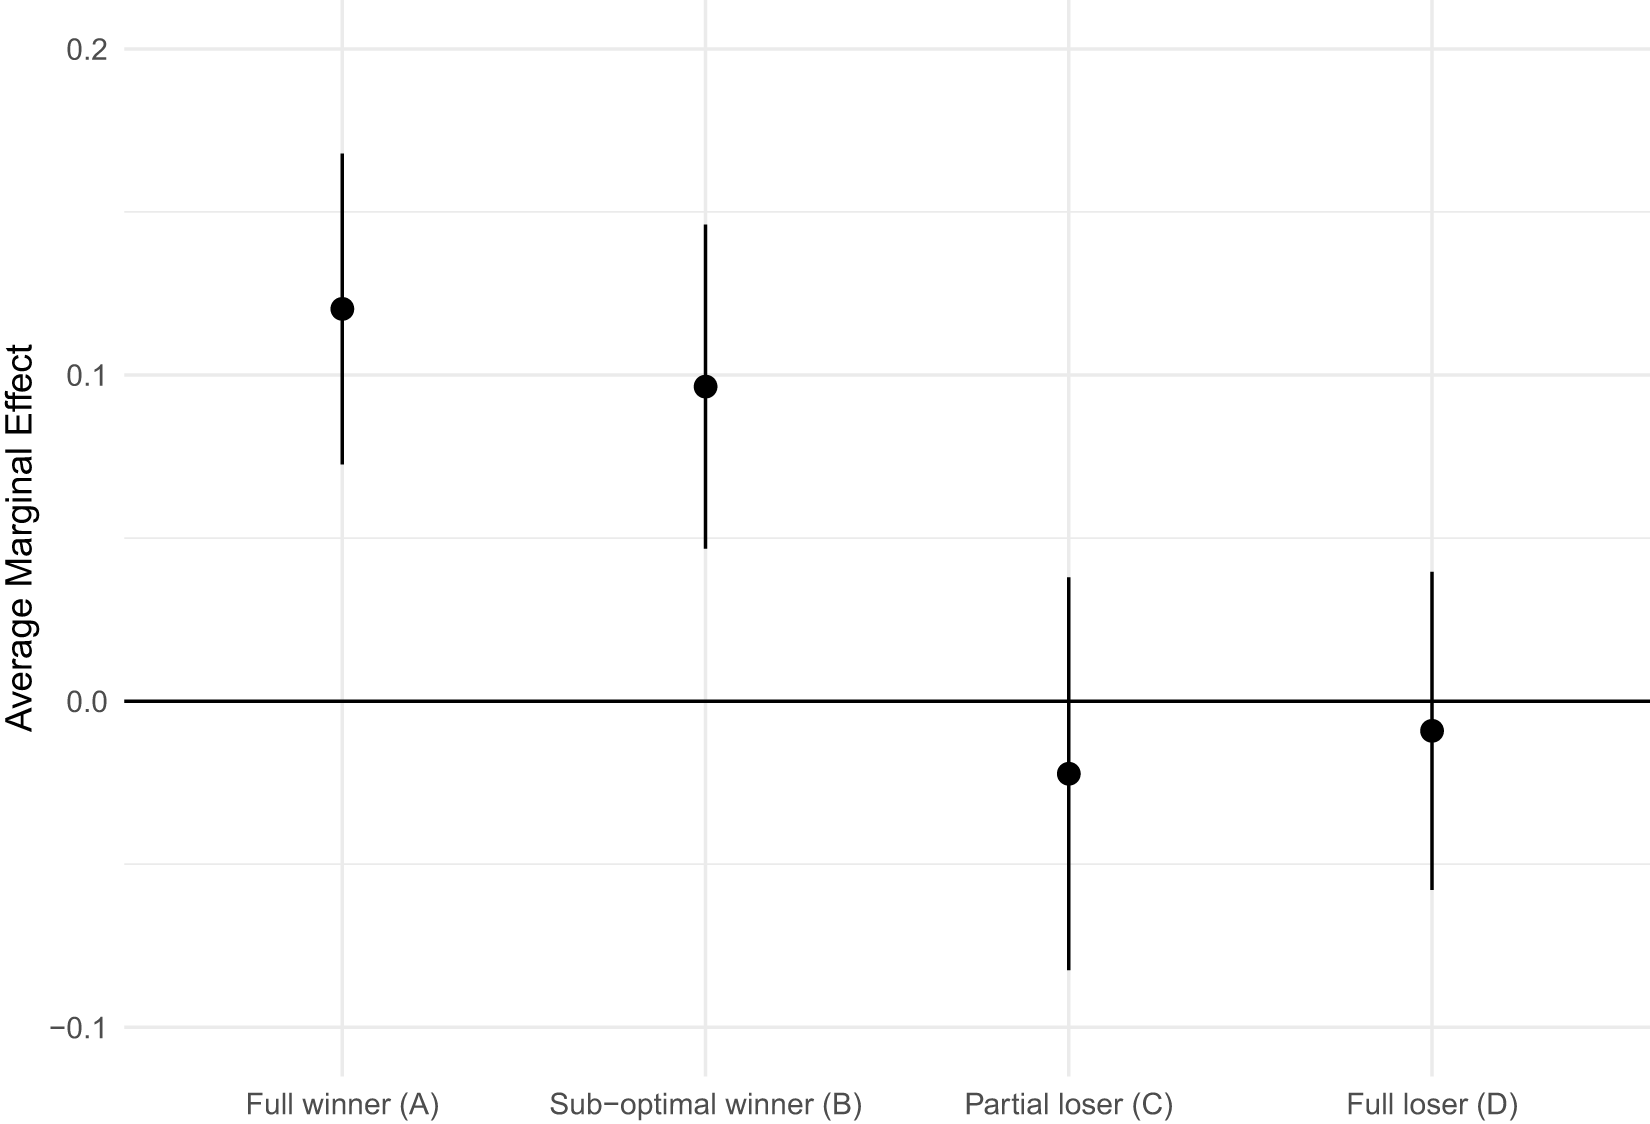
Figure 3 displays average marginal effects for the main independent variable based on Model 3 from Table 4. The figure graphically visualizes the gap that exists between winning and losing, which exceeds 0.1 points on a −1 to +1 scale.
Change in satisfaction with democracy by respondent subgroup: Czech presidential election of 2023. Notes: 95% confidence intervals. Change in satisfaction between Waves 1 and 4. Marginal effects based on Model 3 from Table 4.
In the Appendix, we present a series of additional analyses that demonstrate the robustness of these results. The findings from Tables 3 and 4 hold when we use satisfaction measured in different pre-election and post-election waves or when we include additional control variables (social class and economic precariousness).
5.2. Study 2: Cross-national evidence
To assess the validity of our findings in broader electoral contexts, we now turn to test our hypotheses on previously collected data from five CEE countries. Table 5 replicates the analysis from Table 3, testing Hypotheses 1 and 2 on the pooled dataset of six election panels from CEE. The results fully align with those from Study 1. First, pre-election satisfaction is positively associated with participation in Model 2 (p < 0.01), which invalidates Hypothesis 1. Second, participation is more strongly associated with post-election satisfaction than pre-election satisfaction in Models 1 and 4, which supports Hypothesis 2.
Predicting turnout with satisfaction with democracy: pooled dataset
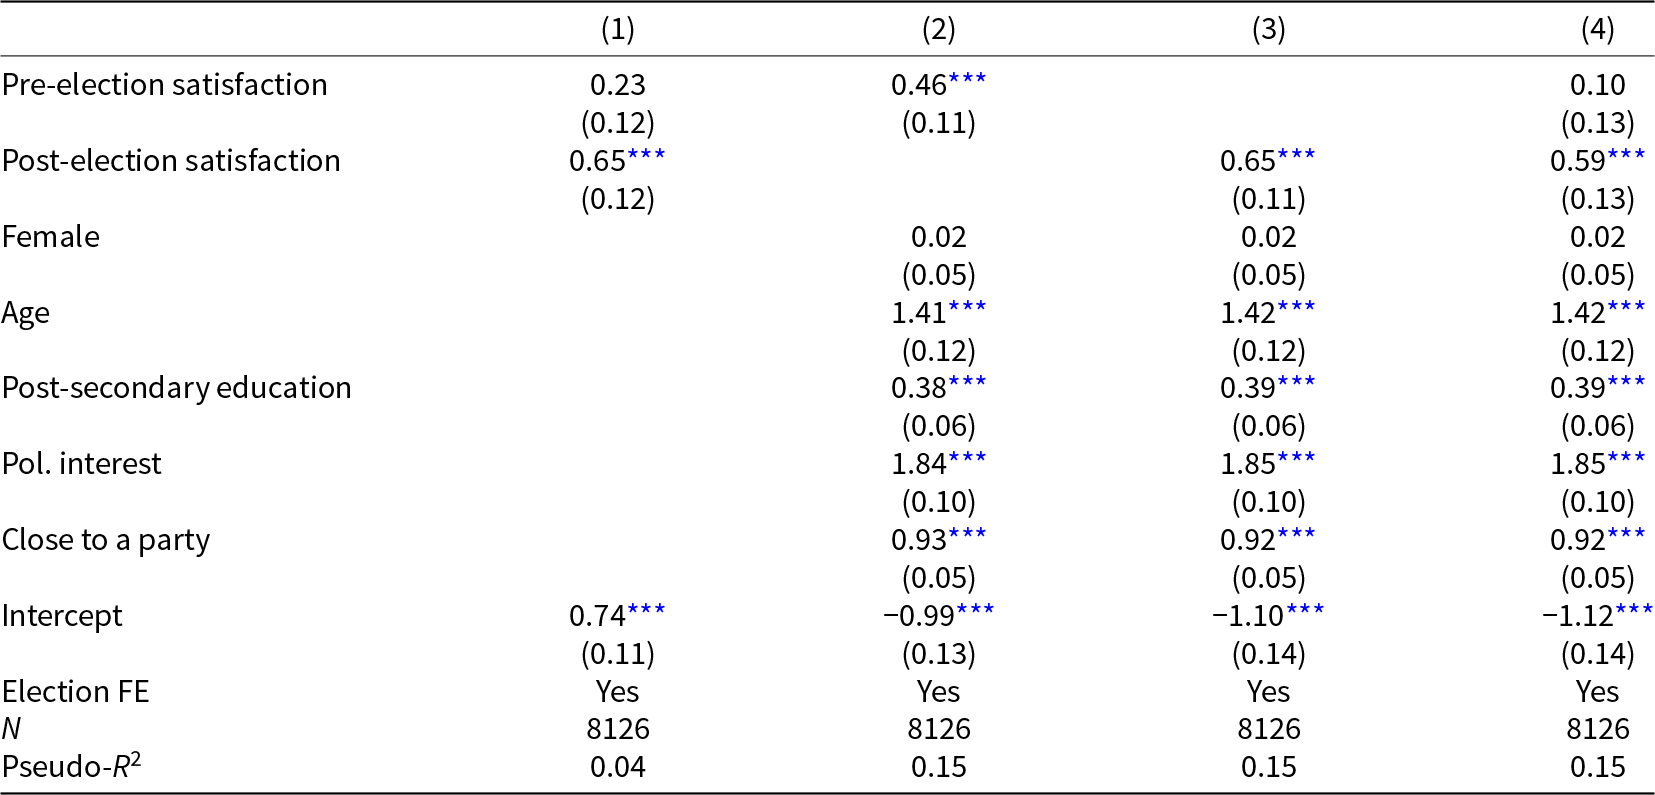
* Notes: Logit coefficients. Standard errors in parentheses. Significance levels: p < 0.05, **p < 0.01, ***p < 0.001.
Figure 4 displays pre- and post-election satisfaction levels for winners, losers, and abstainers.Footnote 21 The picture it paints is strikingly similar to that from the 2023 Czech presidential election. The gap in satisfaction between winners on the one hand, and losers and abstainers on the other existed prior to the election. Subsequently, during the election, satisfaction increased in all three groups. However, the increase was clearly the strongest among election winners, even without accounting for ceiling effects.
Satisfaction with democracy by respondent subgroup and wave: pooled dataset. Notes: 95% confidence intervals. Predicted values based on a linear regression of satisfaction with democracy on the respondent subgroup, wave dummies, their interactions, and election fixed effects. The Online Appendix also presents the results of separate analyses for each election.
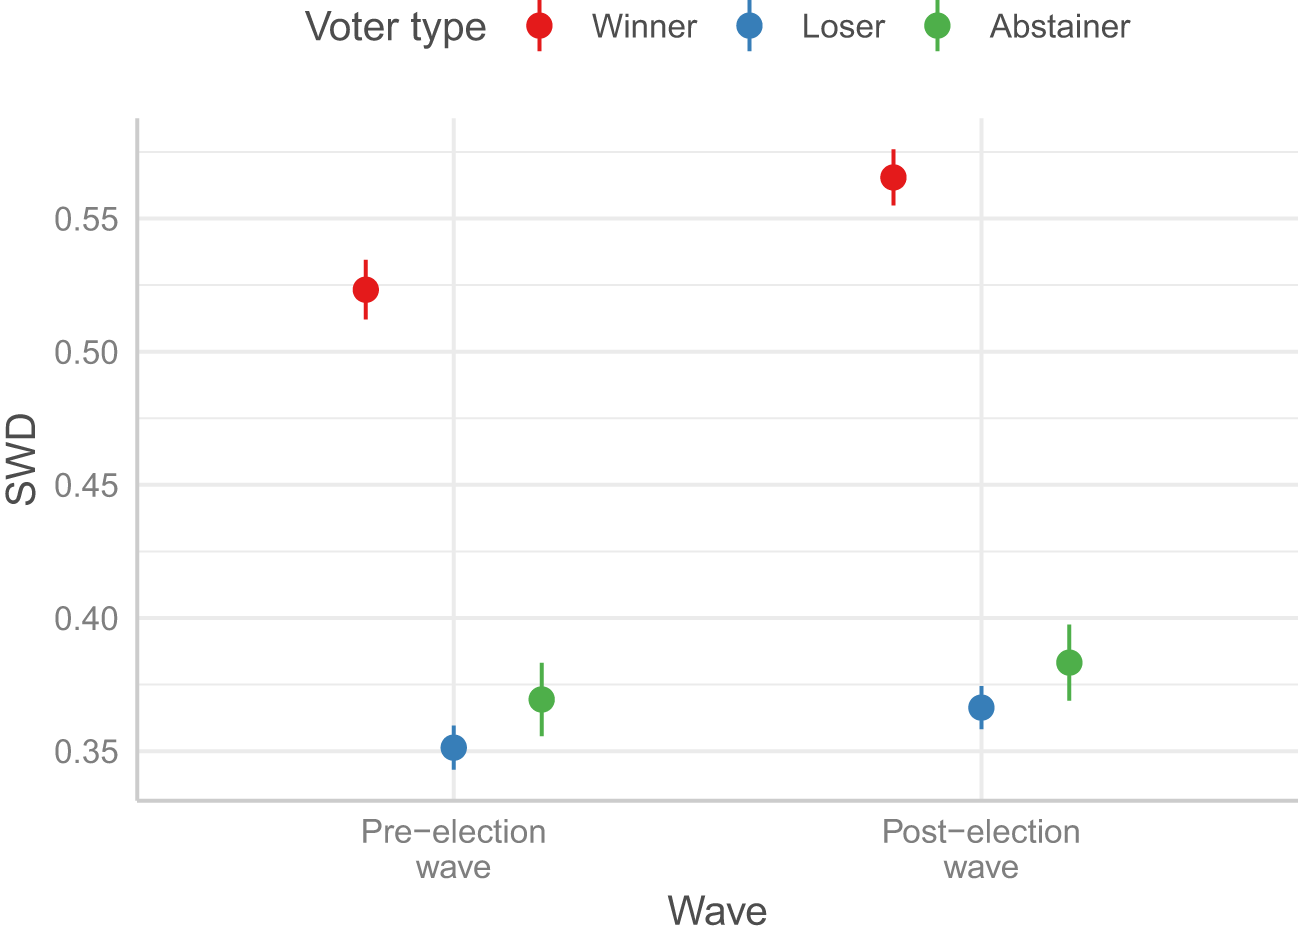
Table 6 conducts a replication of the analysis from Table 4. It focuses on Hypothesis 3 and the general effect of winning. All the elections in the cross-national sample were single-round, except the 2009 Romanian presidential election. While in the former case, the party with the largest share of votes is considered the winner, it is the candidate with the largest share of votes in the second round in the latter case. Model 1 corroborates Hypothesis 3 in that, like in the 2023 Czech presidential election, turning out is associated with a positive change in satisfaction (0.02, p < 0.001). Model 2 breaks down voters into winners and losers. In line with conventional expectations, winners’ regression coefficient is strongly positive (0.09) and statistically significant (p < 0.001). By contrast, losers’ change in satisfaction does not substantively differ from that of abstainers, the difference being −0.01 (p = 0.18).
Predicting change in satisfaction with democracy: pooled dataset
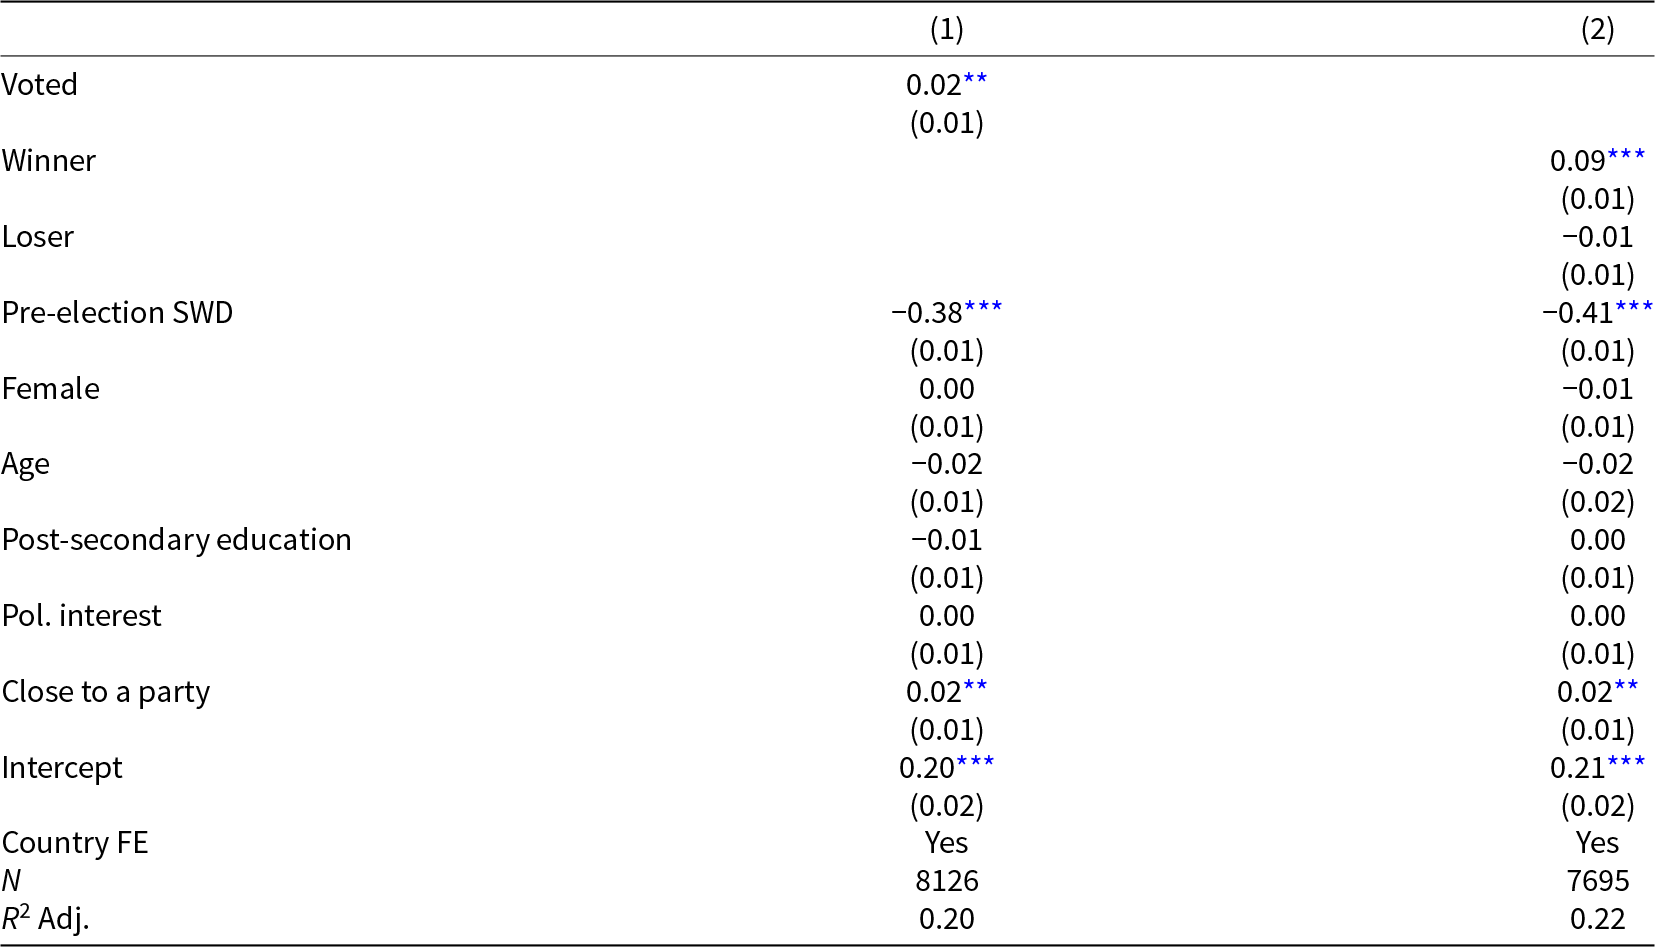
* Notes: OLS coefficients. Standard errors in parentheses. Significance levels: p < 0.05, **p < 0.01, ***p < 0.001.
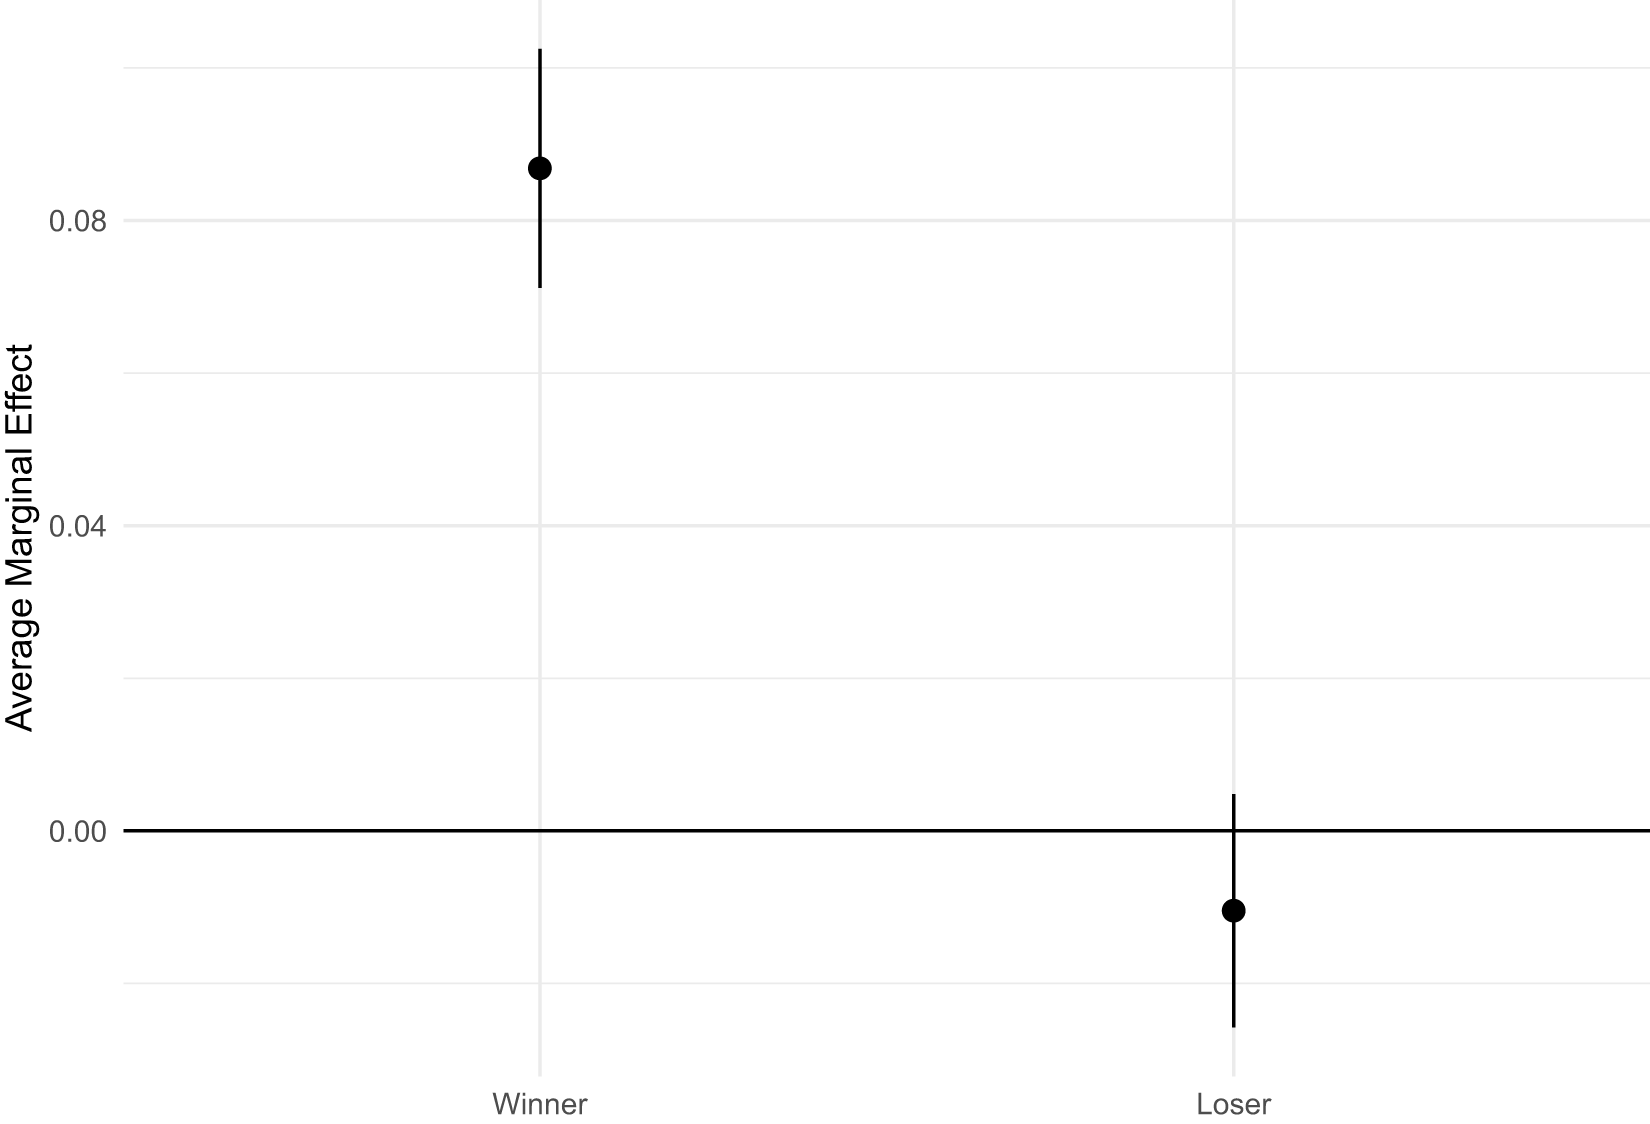
Figure 5 displays the results from Model 2 via average marginal effects. It visually illustrates the gap between winners and losers, and how the change associated with losing does not significantly differ from that associated with abstaining (baseline).
Change in satisfaction with democracy by respondent subgroup: pooled dataset. Notes: 95% confidence intervals. Pre-post-election change in satisfaction. Average marginal effects based on Model 2 from Table 6.
6. Discussion
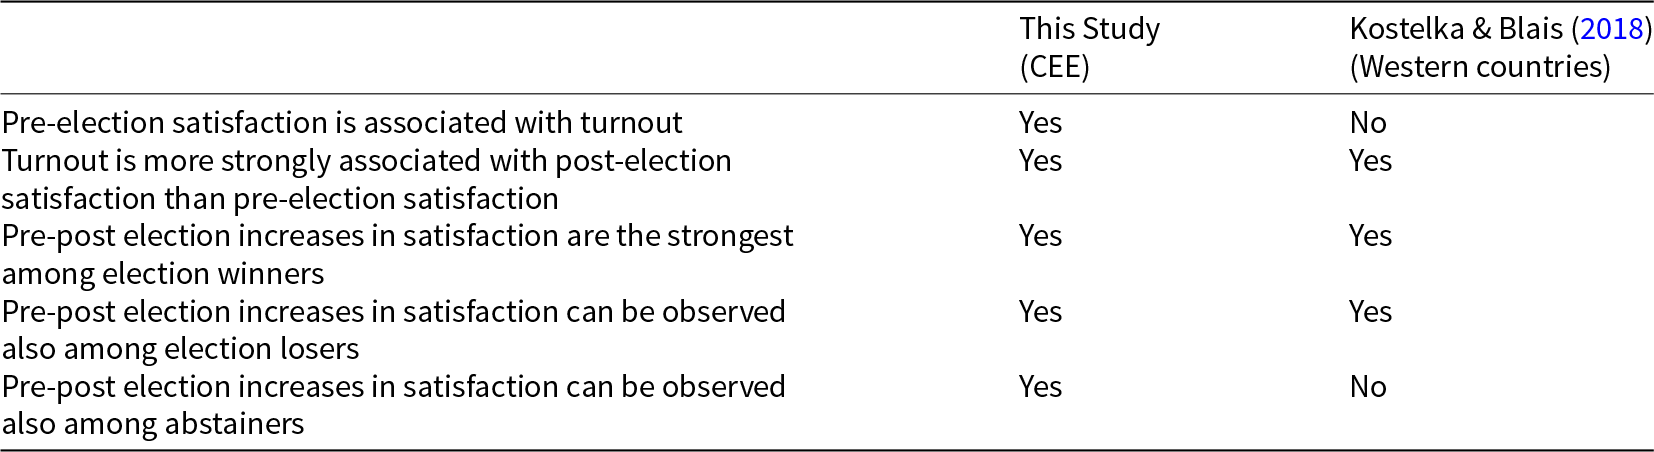
This paper investigated the relationship between satisfaction with democracy and electoral participation in CEE. Besides probing the universality of earlier findings from Western democracies, it formulated original hypotheses concerning winning and losing in two-round electoral systems, widely used in European presidential contests. It tested the whole set of four preregistered and two additional hypotheses on a collection of panel surveys, including the longest panel study ever conducted in CEE. The results yield novel insights into the participation-satisfaction nexus outside Western democracies and in presidential elections. Table 7 summarizes the main findings comparing them with those from the most similar study conducted in Western countries by Kostelka and Blais Reference Kostelka and Blais(2018).
Comparison with the findings from Kostelka and Blais (Reference Kostelka and Blais2018)
To the best of our knowledge, the present study is the first to empirically demonstrate a link between pre-election satisfaction and voter turnout. This relationship, which received support in both our studies, means that in CEE and perhaps other more recent democracies, democratic dissatisfaction may be associated with electoral abstention, unlike in established democracies. However, this finding has to be interpreted with prudence. First, it draws on a result that is cross-sectional in nature. When we used within-individual change in satisfaction in Study 1, the relationship disappeared. Second, most studies report an increase in democratic satisfaction in CEE from the late 1990s onward (Vlachová, Reference Vlachová2019; Foa et al., Reference Foa, Klassen, Slade, Rand and Collins2020), which clashes with the region’s overall declining dynamic in voter turnout (Kostadinova, Reference Kostadinova2003; Pacek et al., Reference Pacek, Pop-Eleches and Tucker2009). Furthermore, alternative explanations of the decline—such as strong initial democratization-driven mobilization, emigration, and rising election frequency—receive strong empirical support (Kostelka, Reference Kostelka2017a; Reference Kostelka2017b; Kostelka et al., Reference Kostelka, Krejcova, Sauger and Wuttke2023).
The results support the view that elections legitimize democratic political systems. Elections in CEE are consistently associated with increases in satisfaction with democracy, and participation correlates more strongly with post-election than pre-election satisfaction like in Western Europe. Scholars should thus never use post-election measurements of satisfaction to account for participation in the given election. Similarly, they should be careful when attributing differences in post-election measurements to the outcome of the last election. In both our studies, the gap between winners and losers appeared already in the pre-election survey and the election only magnified it.
The election-related increases in satisfaction are the strongest among those citizens whose preferred party or candidate won the election. However, unlike earlier studies, we find that elections may also positively affect all other groups of citizens. In both our analyses, abstainers’ satisfaction increased as much as losers’ satisfaction. Interestingly, our first analysis suggests that some of the election’s legitimizing effect had materialized even before voting took place, which squares with similar findings from the Netherlands (van der Meer and Steenvoorden, Reference van der Meer, Tom and Steenvoorden2018) and Africa (Higashijima and Kerr, Reference Higashijima and Kerr2023). This potential early activation of the legitimizing mechanism means that the failure of many earlier studies to detect changes in abstainers’ satisfaction, including Kostelka and Blais Reference Kostelka and Blais(2018), may stem from these studies’ measurement of pre-election satisfaction too shortly before the election.
Finally, our additional findings show that what appears to matter the most for election-related satisfaction in two-round systems is winning the second round. Voting for the candidate who came second in the first round and qualified for the run-off does not seem to yield more satisfaction than abstaining and voting for candidates who came third or worse. And this is true both before and after the run-offs. The hope that two-round systems lead to more citizen satisfaction by producing more types of winners is thus likely misplaced. This said, we were not able to directly compare winning in the first and second rounds as, in the 2023 Czech presidential contest, the winner was the same in both rounds. Furthermore, given that two-round systems typically require a relative majority (and not plurality) of votes for victory, they are ceteris paribus still likely to produce more satisfied citizens than one-round systems.
The limitations of our findings open avenues for future research. In particular, our study cannot determine which micro-mechanisms drive the observed relationship between winning and increases in satisfaction and when exactly these increases begin.Footnote 22 Besides probing the general validity of our findings, future research should also investigate the legitimizing role of elections under a variety of outcome scenarios and socioeconomic contexts as, for instance, the state of the economy and economic inequality may condition the winner-loser gap (Han and Chang, Reference Han and Chang2016; Krishnarajan, Reference Krishnarajan2023). While existing research has investigated the durability of this gap (Anderson et al., Reference Anderson, Blais, Bowler, Donovan and Listhaug2005, Chapter 4; Dahlberg and Linde, Reference Dahlberg and Linde2017; Nemčok and Wass, Reference Nemčok and Wass2021), future studies should further examine the timing of the legitimizing effects of elections. This would help assess which part of the observed election-related satisfaction increases is driven by the mere conduct of the election, the anticipation of victory, or the election result. This research will require panel studies with several pre-election measurements of satisfaction with democracy.
Supplementary material
The supplementary material for this article can be found at https://doi.org/10.1017/psrm.2025.10028. To obtain replication material for this article, https://doi.org/10.7910/DVN/GTHIBR.
Funding
The work of Lukáš Linek and Michael Škvrňák was supported by the NPO “Systemic Risk Institute” no. LX22NPO5101, funded by European Union—Next Generation EU (Ministry of Education, Youth and Sports, NPO: EXCELES). This publication used data acquired through the data services of the Czech Social Science Data Archive/European Social Survey—Czech Republic (CSDA/ESS-CZ). The CSDA/ESS-CZ research infrastructure project is supported by the Ministry of Education, Youth and Sports within the framework of grant LM2023046.
Competing interests
The author(s) declare none


 Open access