


1. Introduction
Electron beam-plasma interaction is a fundamental nonlinear plasma process that is frequently taking place in space environments and laboratory plasmas. Such an interaction is found to generate electromagnetic waves observed in space plasmas. Gurnett et al. [Reference Gurnett, Hospodarsky, Kurth, Williams and Bolton1] reported the observations of highly structured bursts of Langmuir waves produced by energetic electrons ejected from a solar flare using wideband plasma wave measurements on the Galileo spacecraft. Stasiewicz et al. [Reference Stasiewicz, Holback, Krasnoselskikh, Boehm, Boström and Kintner2] analyzed the complete spectrum of waves (0–4 MHz) and electron distributions during events of modulated Langmuir waves observed by Freja in the topside polar ionosphere. The intense high-frequency electrostatic waves observed in the terrestrial foreshock often have a form of a superposition of two monochromatic waves close to the plasma frequency. Soucek et al. [Reference Soucek, Krasnoselskikh, Dudok deWit, Pickett and Kletzing3] suggested an interpretation of these spectra as signatures of nonlinear decay of Langmuir waves to electron-sound and ion-sound secondary waves. The results of the Geotail waveform observation on the electrostatic plasma waves with their frequency close to the local electron plasma frequency in the tail lobe were presented by Kojima et al. [Reference Kojima, Furuya, Usus and Matsumoto4]. There are some other studies that discussed other aspects of the beam-plasma interaction such as beam heating and characteristics of Langmuir electric field waveforms [Reference Brown, Karlicky, MacKinnon and Van den Oord5–Reference Lacombe, Harvey, Hoang, Mangeney, Steinberg and Burgess7]. Solar type II and type III radio bursts are also attributed to the electron beam-plasma instabilities [Reference Li, Willes, Robinson and Cairns8, Reference Willes, Robinson and Melsrose9].
So far, a large number of analytical (quasilinear/weak turbulence), simulational (PIC/Vlasov), experimental, and observational studies have investigated various aspects of this problem such as the effect of weak/strong equilibrium magnetic field, relativistic/warm/cold beam, and background nonuniform/modulated density.
Yi et al. [Reference Yi, Rhee, Ryu and Yoon10] presented a comparative study of the dynamics of the electron beam-plasma system in two spatial dimensions by means of particle-in-cell (PIC) simulation and quasilinear theory, and it is found that the quasilinear theory quite adequately accounts for most important features associated with the simulation result. In another theoretical study, Baumgartel [Reference Baumgartel11] described a simple linear approach to the phenomenon of amplitude modulation of Langmuir waves in weak beam-plasma interaction and found out that the resulting waveforms in temporal representation are quite similar to those observed by the spacecraft. Gurnett et al. [Reference Gurnett, Maggs, Gallagher, Kuhrt and Scarf12] presented observations of the parametric decay and spatial collapse of Langmuir waves driven by an electron beam streaming into the solar wind from the Jovian bow shock. High-resolution frequency-time spectrograms from Voyager 1 and Voyager 2 show that long-wavelength Langmuir waves upstream of the bow shock are very effectively converted into short-wavelength Langmuir waves which are no longer in resonance with the beam.
As an important observational study, in [Reference Hospodarsky, Gurnett, Kurth, Kivelson, Strangeway and Bolton13], highly structured Langmuir waves, also known as electron plasma oscillations, have been observed in the foreshock of Venus using the plasma wave experiment on the Galileo spacecraft during the gravity assist flyby on February 10, 1990. Moreover, Umeda and Silin et al. [Reference Umeda14, Reference Silin, Sydora and Sauer15], using Vlasov simulations, discussed the amplitude modulation and packet formation of Langmuir waves and the linear dispersion theory of the electron-beam interaction with plasma.
Additionally, computer experiments of electrostatic solitary waves (ESWs) observed by Geotail in the magnetotail were investigated in [Reference Omura, Matsumoto, Miyake and Kojima16]. ESWs correspond to broadband electrostatic noise, and they are excited through two-electron stream instabilities along a static magnetic field. In this study, a necessary condition for ESW formation through the bump-on-tail instability is derived theoretically, and its significance to Geotail observations is discussed.
Also, Muschietti et al. and Pritchett and Dawson [Reference Muschietti, Roth and Ergun17, Reference Pritchett and Dawson18] discussed the formation of wave packets in planetary foreshocks and the electromagnetic radiation from beam-plasma instabilities, respectively.
The most important consequence of the beam-plasma interaction is the excitation and emission of electromagnetic waves in different frequencies. In fact, the emission of electromagnetic waves occurs at integer multiples of local electron plasma frequency n ω pe with ω pe = (n 0e 2/m eε 0)1/2. The exact mechanism for the generation of the second harmonic (n = 2) is yet under investigation, but the most probable and discussed one is thought to be a two-step process [Reference Cairns and Melrose19, Reference Melrose20]: first, the excitation of backscattered Langmuir waves accompanied with ion-acoustic waves through a parametric decay of large-amplitude Langmuir waves; second, the excitation of 2ω pe electromagnetic waves following the wave-wave coupling of forward and backward propagating Langmuir waves.
Therefore, the role of the ion component of plasma is important regarding the generation of the second harmonic. It is expected that the decay of long-lived solitons being formed by amplitude modulation of Langmuir waves is significantly affected by ion-related waves, in particular, ion-acoustic waves. This parametric decay is necessary for the second harmonic generation. The decay pattern and its duration are of special interest.
Therefore, it is of interest to investigate the evolution of electron beam-plasma instability in the presence of ion species and look at the effect of ion-to-electron mass ratio, m i/m e. In the presence of physical heavy ions, the excitation of ion-acoustic waves would indeed take place at very late times on the order of a few thousand times of ω pe. It is thought that the intensity of emission in the second harmonic depends on the ion-to-electron mass ratio since strong ion-acoustic waves result in the effective backscattering of Langmuir waves. Due to the computational cost limitations, most of relevant simulational studies have considered nonphysical values for ion mass. Since, in our study, the main aim is to see the effect of mass ratio, we have considered four cases: A: m i/m e = 0 (two-electron stream instability); B: m i/m e = 1 (electron-positron stream instability, pair plasma); C: m i/m e = 100; and D: m i/m e = 1000. Inclusion of case A (without the ion component) enables us to compare the results properly. The results presented below verify that even these nonphysical mass ratios can clarify some aspects of the effect of mass ratio on the evolution of beam-plasma instability.
Most of electron beam-plasma interaction studies have assumed an equilibrium magnetic field in a specific direction. However, we omitted the equilibrium magnetic field as the main purpose here is to better understand the role of the ion component on the generation of the second harmonic and to verify the theoretical two-step process mechanism proposed for the electromagnetic emission in the second harmonic. Since the ions are magnetized in relatively strong magnetic fields compared to the electrons, our results might be applicable to the cases of weak magnetic field.
To perform this study, we have used 2D electromagnetic particle-in-cell simulations. In the absence of strong equilibrium magnetic field, one-dimensional approximation for the beam-plasma interaction is not satisfactory, and at least 2D simulation is necessary to properly resolve instabilities. This paper is structured as follows: the next section describes the model and simulation setup, while the results and discussion are presented in the third section which is followed by a brief summary.
2. Simulation Setup
Two-dimensional (2D3V) electromagnetic particle-in-cell simulations are carried out by using the EPOCH (Extendable PIC Open Collaboration) code, developed at the University of Warwick. It is a general-purpose PIC code for modelling kinetic plasmas in one, two, or three spatial dimensions. The full set of Maxwell’s equations and the equation of motion for charged particles are solved in a self-consistent manner with the standard, leapfrog algorithms, while the current density is computed with the charge conservation method for solving the continuity equation for charge.
The simulation box size in the xy plane is Lx = Ly = 538 λ D, with grid numbers Nx = Ny = 800, so the grid sizes are Δx = Δy = 0.67 λ D, where λ D = (ε 0K BT e/n 0e 2)1/2 is the electron Debye length. Time step is determined by the CFL condition as Δt = 1.5 × 10−11 = 2.7 × 10⁻³ω pe−1, which is sufficiently small to precisely detect the excited waves in the system.
Three kinds of species constitute the system: (1) background plasma electrons with physical mass m e, Maxwellian temperature T e = 20 eV corresponding to the electron thermal velocity V th,e = 2.65 × 10⁶ m/s, and initially uniform number density n 0 = 1013 m−3; (2) plasma ions with mass, m i = α m e, where α is 0, 1, 100, and 1000. Ion temperature is T i = 5 eV = 0.25T e, and its number density is the same as the electron number density n 0. Note that, in the case of m i/m e = 1, we set T i = T e to establish an equilibrium state; (3) beam electrons with mass m e. The Maxwellian beam temperature is T b = T e, and the nonrelativistic drift velocity of the beam along the y-direction is V d,b = 0.2 C = 22.6 V th,e with beam number density n b = 0.01 n 0. In order to preserve the initial zero-current condition, the drift velocity of background electrons is V d,e = n bV d,b/(n 0 − n b). Moreover, the number of macroparticles is 150 per grid per species. Due to the computational limitations, it was not possible to run the simulations with a larger number of particles or even with mass ratios much larger than those employed here. The plasma is initially free from any externally imposed magnetic or electric fields. Finally, for both fields and particles, the periodic boundary condition is imposed in the x- and y-directions.
3. Results and Discussion
Now, we present and discuss the effect of ion-to-electron mass ratio (m i/m e) on the evolution of electron beam-driven instability in plasma. As mentioned above, four cases are considered: A: m i/m e = 0; B: m i/m e = 1; C: m i/m e = 100; and D: m i/m e = 1000.
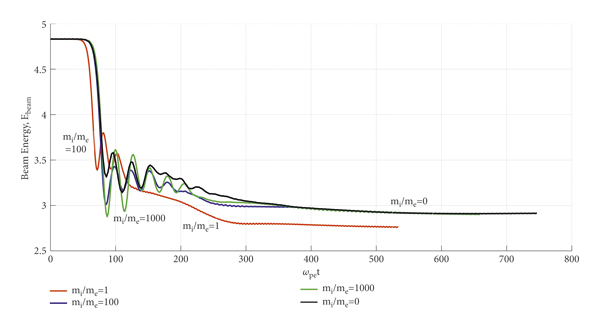
The free energy provided by the kinetic energy of the warm beam triggers the instability in the plasma, and consequently, its energy decreases as seen from Figure 1. All energies are normalized to the initial kinetic energy of plasma electrons,
 with
with
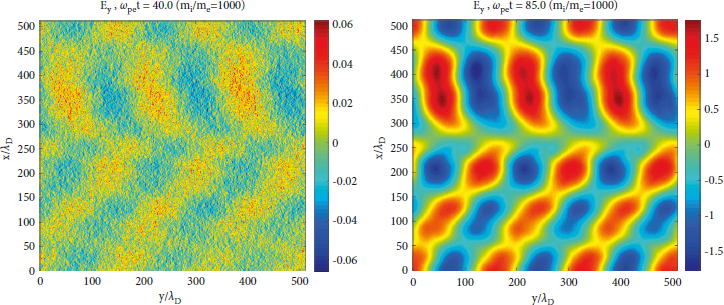
 as the mean kinetic energy of each electron at position (ix, iy). The early time charge separation is totally determined by the background electrons (especially in the case of heavy ions), and as a result, electric field is generated with an amplitude which grows exponentially in the quasilinear regime. In other words, the electrostatic Langmuir waves are excited which propagate mainly along the beam drift velocity with a phase speed greater than the thermal velocity of electrons. Figure 2 plots the Ey component of the electric field in the xy plane, for example, with m i/m e = 1000 at times ω pet = 40 (quasilinear phase) and ω pet = 85 (saturation phase), which is normalized to
 . As seen, nonuniform dipolar electric structures are developed in both x- and y-directions. The Ey amplitude increases 30 times during 40 < ω pet < 85. According to Figure 2, the wavelength of quasilinear perturbations along the y-direction at ω pet∼40 is λ/λ D∼150 which is in good agreement with that predicted by theory [Reference Baumgartel11] as λ/λ D∼2π V d,b/V th,e∼2π × 6 × 107/2.65 × 106 = 142. This is almost the wavelength of the fastest growing mode. Using the temporal variation of electric energy, the growth rate at the quasilinear regime is found to be γ∼0.14 ω pe as predicted by the theory. As time goes on, instability develops to smaller wavenumbers (larger wavelengths). As these electrical structures develop, most of the low-energy population of beam electrons is trapped within the electric potential structures in a nonlinear process of wave-particle interaction. These structures are called electron holes (or phase-space holes). These nonuniform electric structures exist for longer time scales, while their nonuniformity increases in both directions in a way that the significant component of Ex grows due to the transverse instability in electron holes. Figure 3 demonstrates the temporal variation of Ey at three different locations for the case m i/m e = 1000 from which the formation and propagation of long-lived Langmuir wave packets (envelopes or solitons) are evident.
Temporal evolution of beam kinetic energy.
Plot of Ey in the xy plane for ω pet = 40 (a) and ω pet = 85 (b) with m i/m e = 1000.
The temporal variation of Ey at three different locations for the case m i/m e = 1000.
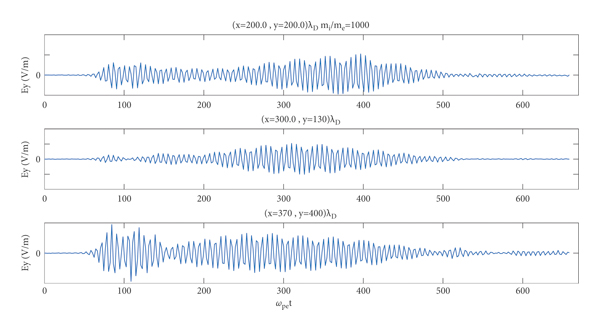
These envelopes are due to the amplitude modulation of Langmuir waves which itself is presumably caused by the nonlinear trapping of beam electrons. They are in the form of a chain of wave packets. Eventually, as seen, these wave packets decay in accordance with the electric energy decrease.
As the beam electrons lose their initial kinetic energy, the distribution function of the beam drifts toward lower mean velocities and flattens the beam velocity distribution to a plateau (not shown here). According to Figure 1, an almost abrupt decrease of beam energy is observed at ω pet∼50 for all cases except the pair plasma case (B: m i/m e = 1), which is due to the satisfaction of the resonance condition by which the phase velocity of excited Langmuir waves is comparable to the beam drift velocity. Therefore, almost 30% of its energy is converted to the electric and kinetic energies of plasma during a short time scale. Since the temporal variation of beam energy at these early times of quasilinear evolution is similar for cases C (m i/m e = 100) and D (m i/m e = 1000), therefore, the ion dynamics does not play any major role at the early time scales as we expected.
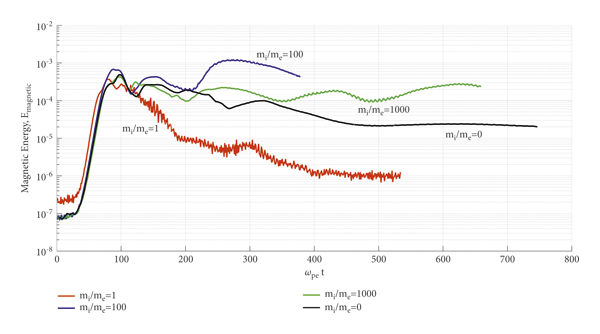
As seen from Figures 4–7, the decrease in kinetic energy of the beam is associated with the increase of kinetic (electron and ion), electric, and, up to a small extent, magnetic energies in the system. To be sure about the conservation of energy, total energy has been monitored continuously, which we found it a constant.
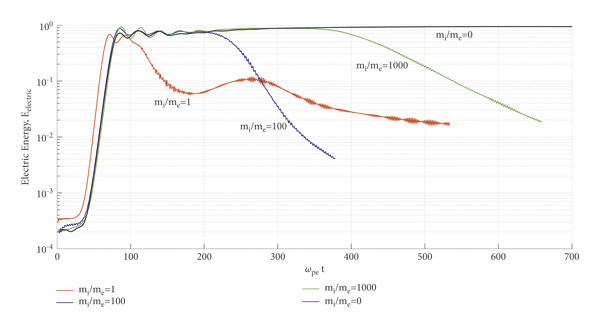
Temporal variation of electric energy for different mass ratios.
Temporal variation of magnetic energy for different mass ratios.
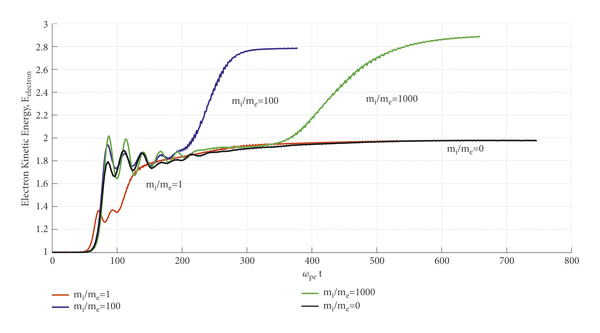
Temporal variation of electron kinetic energy for different mass ratios.
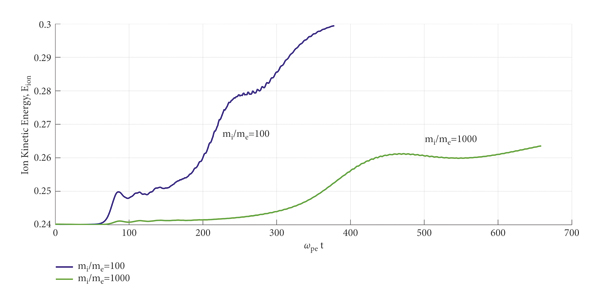
Temporal variation of ion kinetic energy for two mass ratios C and D.
Since the equilibrium magnetic field is zero, the transverse component of the electric field is not generated, so Ez = 0, for all cases. On the contrary, only the transverse component of the perturbed magnetic field is generated, and Bx = By = 0. The excitation of Bz along with Ex and Ey can confirm the possibility of electromagnetic wave emission.
For all cases except m i/m e = 0, the amplitude of the electric field increases quasilinearly up to ω pet∼85. However, in the case of pair plasma, the respective saturation occurs relatively earlier at ω pet∼72. The decrease of beam energy is associated with flattening of the low-energy side of the initially Maxwellian distribution of beam electrons. Following the complementation of the flattening process and the significant decrease of beam kinetic energy, the condition for Landau damping is satisfied in the system, and as a result, strong interaction between beam electrons and Langmuir waves takes place. Figure 4 shows that the electric energy is minimum when the beam kinetic energy is maximum. As time elapses, the evolution transits into the nonlinear regime where intermittent Landau and inverse Landau damping processes take place between the beam electrons and Langmuir waves. During this interaction, intermittent conversion of beam energy to the electric and kinetic energy of plasma (inverse Landau damping) and vice versa (Landau damping) takes place.
Figures 1 and 4 indicate that, as the ion-to-electron mass ratio increases, the interaction is relatively stronger, and as a result, the amplitude of the electric field of Langmuir waves is larger. An interesting point to mention here is that the time interval between each two Landau (or inverse Landau) damping processes is independent of mass ratio and is on the order of the bouncing (trapping) period, T b = 2π (m e/k 0e E 0)1/2∼1.3 × 10−7 where k 0 = 2π/λ 0 = 2π/1.78 and E 0∼4000 (V/m).
As the beam loses its sufficient energy, the interaction between beam electrons and plasma waves almost stops, and beam’s energy becomes almost constant. Figure 1 shows that the final kinetic energy of the beam is independent of mass ratio. It is noteworthy that, for the pair plasma case, the loss of energy is faster compared to other cases, and the final energy is lower than other cases.
As the instability develops further, for three cases of m i/m e = 1, 100, and 1000, the electric energy decreases slowly. The pattern and rate of electric energy decrease are considerably determined by the ion-to-electron mass ratio (see Figure 4). As seen, the rate of energy decrease is slower for larger m i/m e. This means that the potential (or electric field) structures are stable for longer time scales as m i/m e increases. Since, in the case of m i/m e = 0 (no ion component), there is no sign of electric energy decrease and, also, the beam energy is almost constant, one might conclude that the electric energy decrease is inevitably related to the ion dynamics. Looking at Ey structures at these time scales shows that the structures are modified due to the modulation instability. By sufficient weakening of wave-particle interaction, when the amplitude of Langmuir waves is large enough, the ion-acoustic waves are excited in the system with a growing amplitude. This is the phase in which the ion component of plasma plays an important role in the dynamics of the system. Figure 8 presents the temporal variation of ion density for m i/m e = 1000 at three locations. The time scale of the significant variation of ion density corresponds to the time scale of electric energy decrease.
Temporal variation of different kinds of energies for m i/m e = 1000.
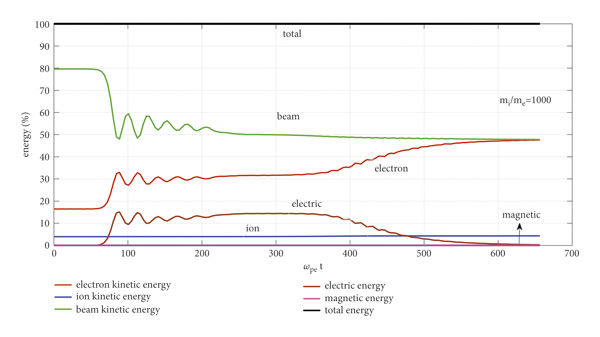
Furthermore, as the electric energy decreases, the kinetic energy of electrons and ions increases and finally saturates (Figures 6 and 7). The final saturation value of electron kinetic energy for m i/m e = 1000 is relatively larger than that for the case of m i/m e = 100. It seems that the destruction of long-lived Ey structures is totally due to the excitation and growth of ion-acoustic waves. Figure 7 plots the temporal variation of ion kinetic energy (normalized to initial electron kinetic energy) which shows that the rate of kinetic energy increase is faster for m i/m e = 100 compared with the case m i/m e = 1000. For m i/m e = 100 curve, the first increase of energy triggers at ω pet∼60. This increase is mainly due to acceleration by the significant electric field growth at early times. Figure 8 shows the temporal variation of different kinds of energies which are normalized to the initial total energy and shown in percentage. As seen, the total energy is conserved very well, and the decrease of beam energy is associated with the increase of the electron kinetic and electric field energies. After the decay phase, the kinetic energy of beam electrons and the plasma electrons becomes almost the same. Additionally, the magnetic (pink curve) and ion kinetic (blue curve) energies are almost zero and four percent of the total energy, respectively.
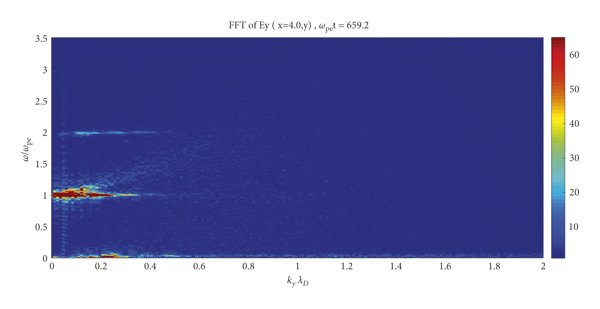
Let us now discuss the generation of fundamental and the second harmonic modes following the interaction of the electron beam with plasma. Figures 9–11 show the dispersion diagram (ω/ω pe, k yλ D) for three cases using the 2D spatial (x, y) and temporal fast Fourier transform (FFT technique) of Ey (x = 4.0, y). Figure 9 shows a strong excitation of Langmuir waves in the fundamental frequency, ω pe, for k yλ D < 0.4 during 0 < ω pet < 659. Moreover, relatively weak second harmonic, 2ω pe, of Langmuir waves has been excited at 0.1 < k yλ D < 0.4. Also, strong excitation of ion-acoustic waves is observed at ω = ω pi = 0.03 ω pe at 0.1 < k yλ D < 0.3.
The dispersion diagram of Ey (x = 4.0, y) for m i/m e = 1000.
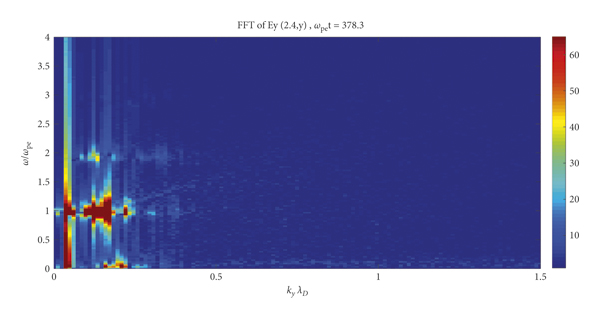
The dispersion diagram of Ey (x = 2.4, y) for m i/m e = 100.
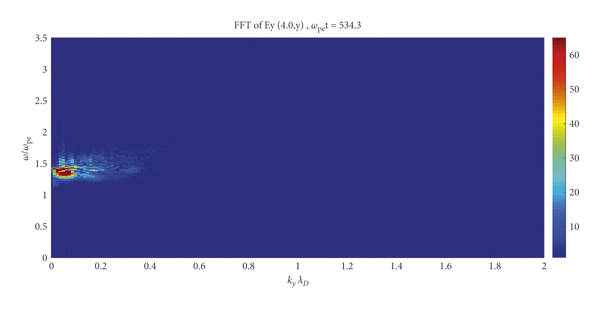
The dispersion diagram of Ey (x = 4.0, y) for m i/m e = 1.
A similar pattern of the dispersion diagram is observed for the case m i/m e = 100 by doing FFT of Ey (x = 2.4, y) at 0 < ω pet < 378.3.
Interestingly, the dispersion diagram of Ey (x = 4.0, y) with m i/m e = 1 at 0 < ω pet < 534 shows that only the fundamental mode is excited, ω∼1.4 ω pe = 1.4 ω pi, at k yλ D < 0.1, and there is no sign of the second harmonic generation. One can conclude that the generation of the second harmonic is basically caused by the presence of heavy ions, and therefore, in the absence of the ion component, the second harmonic cannot be observed. This is the confirmation of the fact that the main mechanism for the generation of the second harmonic is the scattering of Langmuir waves by ion-acoustic waves.
4. Conclusions
We have performed 2D electromagnetic particle-in-cell simulations to investigate the effect of ion-to-electron mass ratio on the evolution of warm electron beam-plasma instability. Four cases have been considered: A: m i/m e = 0 (two-electron stream instability); B: m i/m e = 1 (pair plasma stream instability); C: m i/m e = 100; and D: m i/m e = 1000. Temporal evolution of kinetic energy of the beam and electric energy for these cases shows that Langmuir waves in the electron plasma frequency are excited shortly. The amplitude of waves grows in the expense of beam energy decrement, while the wavenumber moves toward smaller values. In other words, potential structures (or electron holes), being nonuniform in both directions, gradually merge to each other and form larger ones. In the quasilinear stage, the amplitude grows exponentially. Results show that the parallel (with respect to the beam direction) cut of Ey is a bipolar structure. As the beam injects almost all of its free energy into the plasma, the electric energy saturates, and large-amplitude solitons are stable for longer time durations. The time duration is longer as m i/m e is larger, inferring that the excitation of IAW requires more pumping energy. Generally speaking, all stages of the instability are almost determined solely by the electron species as long as the IAW are not excited.
As the amplitude of Langmuir wave solitons becomes sufficiently large, the IAW are excited which in turn affects the effective scattering of Langmuir waves. Thus, the first step of the second harmonic generation is done, and the coupling of forward and backward propagating Langmuir waves can produce the second harmonic. By performing spatial and temporal FFT of Ey, dispersion diagrams showed that, in the cases of m i/m e = 0 and 1, the second harmonic, 2ω pe, is not excited. We conclude that the Langmuir waves have not been backscattered effectively. Contrary to this, in the cases of m i/m e = 100 and 1000, the excitation of the second harmonic is obvious with the highest intensity for m i/m e = 1000. Therefore, one can conclude that the presence of heavy ions results in the significant backscattering of the Langmuir waves although very late. Consequently, the rate of the second step of wave-wave coupling is large enough to produce electromagnetic emission in the second harmonic. The radiation of electromagnetic emission in the second harmonic is an important problem in the radio astronomy, especially in the solar corona environment. So far, some different theories have been proposed for the mechanism of this radiation in which the most popular one is the nonlinear wave-wave interaction of Langmuir and ion-acoustic waves. The presented results in our study clearly confirm the proposed two-step wave-wave coupling mechanism for the generation of the second harmonic in the electron beam-plasma interaction by clarifying the role of the ion component.
Data Availability
The data used to support the findings of this study are available from the corresponding author upon request.
Conflicts of Interest
The authors declare no conflicts of interest.
Acknowledgments
The authors are very thankful to the EPOCH code developing team for making the code accessible for their simulations.


 Open access