

1. Introduction
Many ice sheets past and present have or had a marine component where the ice sheet was grounded on a bed below sea level; for example, the West Antarctic ice sheet (WAIS; Reference DrewryDrewry, 1983), parts of the Laurentide and Fennoscandian ice sheets (Reference Denton and HughesDenton and Hughes, 1981) and the Barents Sea ice sheet (Reference Siegert and DowdeswellSiegert and Dowdeswell, 1996). In all these cases, the ice sheets were or are large enough to induce significant displacement of the lithosphere, so changing the relative sea level. Since grounding-line position is directly affected by relative sea level, there is a potentially significant coupling between ice sheet and lithosphere. The significance of this coupling has been recognized for many years and there have been suggestions that the dynamics is sufficiently complicated that, for example, oscillations could be established, partly by analogy with the land-margin case (see, e.g., Reference Hyde and PeltierHyde and Peltier, 1987).
Curiously, there have been relatively few studies of this coupling, and most of them have been carried out in the context of specific studies of the WAIS (Reference Lingle and ClarkLingle and Clark, 1985; Reference Van der VeenVan der Veen, 1985; Reference HuybrechtsHuybrechts, 1992; Reference Le Meur and HuybrechtsLe Meur and Huybrechts, 1996), of which only the latter used a self-gravitating viscoelastic (SGVE) Earth model. This paper seeks to study marine-ice-sheet/lithosphere dynamics using a SGVE model with a particular type of marine ice-sheet model, which respects the fact that in cases where there is limited coupling between shelf and sheet, marine ice sheets have anomalous dynamics (Reference Hindmarsh and PeltierHindmarsh, 1993, Reference Hindmarsh1996). This limited coupling implies that shelves do not exert back pressure on sheets, and in consequence marine ice sheets have dynamics characterized by neutral equilibrium (Reference Hindmarsh and PeltierHindmarsh, 1993, Reference Hindmarsh1996). The practical significance of this is that in one horizontal dimension, any span has a corresponding equilibrium configuration, unlike land-based ice sheets, where only a few spans have a corresponding equilibrium configuration. Grounding-line motion is computed using a kinematic condition.
This paper continues the investigations of Hindmarsh (Reference Hindmarsh and Peltier1993, Reference Hindmarsh1996) into marine ice-sheet dynamics by coupling to the ice-sheet model an Earth response model due to Reference Le MeurLe Meur (1996a) which is based on unit SGVE models (Reference LongmanLongman, 1962; Reference FarrellFarrell, 1972;Reference Wu and PeltierWu and Peltier, 1982; Reference Spada, Sabadini, Yuen and RicardSpada and others, 1992). The aim of this paper is to carry out basic investigations of the dynamics of marine ice sheets coupled with lithosphere, and look at such questions as how the isostatic depression caused by marine ice sheets affects the migration of the grounding line. There have been relatively few attempts to focus on this aspect of marine ice-sheet dynamics, and none with a kinematically based grounding-line migration model and an Earth model which models lithosphere and mantle mechanics by solving the full Stokes equations in a spherical domain.
In Reference Le Meur and HuybrechtsLe Meur and Huybrechts (1996), a review of the different bedrock parameterizations usually used in ice-sheet models was presented and compared to the same SGVE bedrock model used in the present study. The different results produced by each of these bedrock models, coupled to a three-dimensional thermomechanical ice-sheet model due to Reference HuybrechtsHuybrechts (1992), were compared by simulating the Antarctic ice sheet during the last glacial cycle. In particular, this study showed the inadequacy of the diffusive approach (Reference Oerlemans and van der VeenOerlemans and Van der Veen, 1984) and the necessity for incorporating a proper representation of lithospheric rigidity. In fact, the bedrock elevation not only affects the ice-sheet elevation, which, as a consequence of the atmospheric vertical temperature gradient can change the surface mass balance, but also controls the overall ice-sheet geometry.
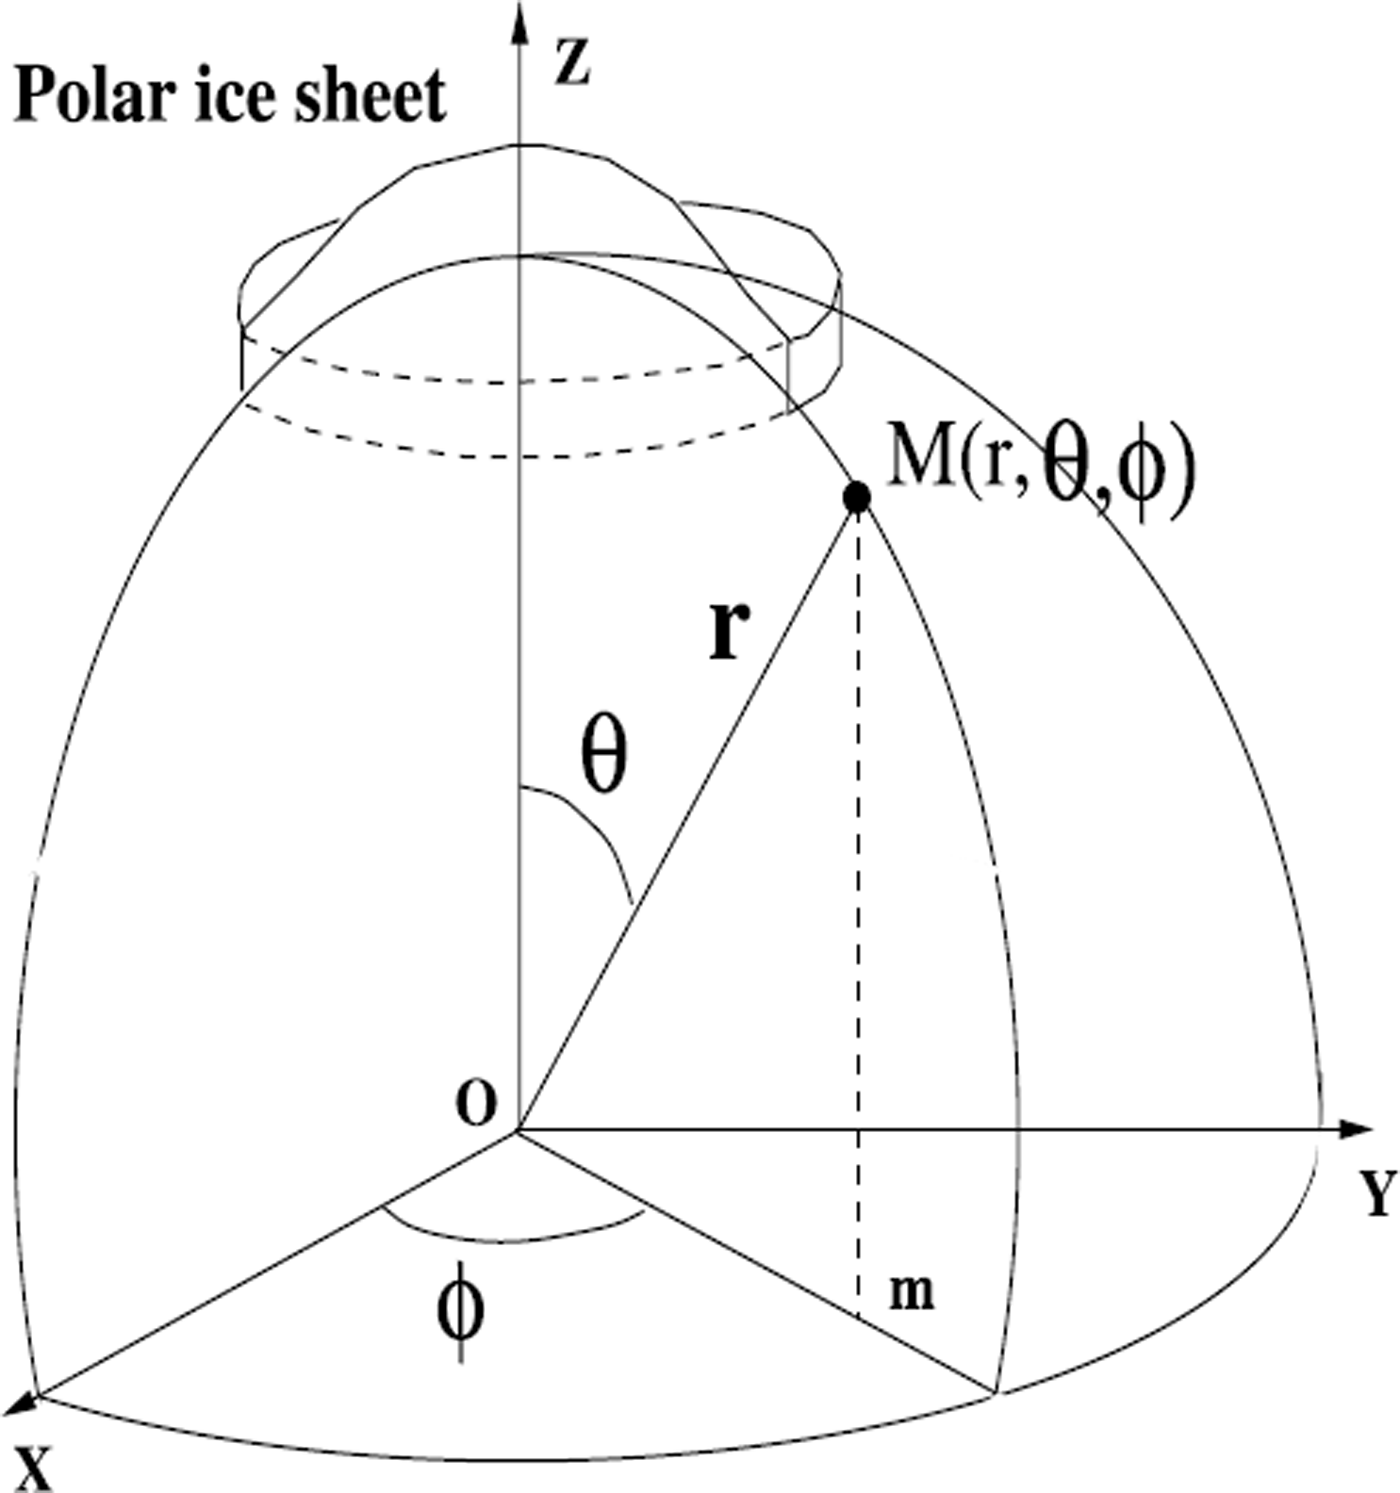
The ice-sheet model used here extends the plane-flow approach of Reference HindmarshHindmarsh (1996) to a zonally symmetric marine ice sheet situated on a sphere and centred on the pole (Fig. 1). Modelling an ice sheet on a sphere does not seem to affect its dynamics significantly, but is a more natural way of incorporating circular symmetry.
Spherical coordinate system (r, θ, φ). The corresponding Cartesian system (x, y, z) is also shown, and M is a scalar function of the coordinate system.
The paper plan is as follows. The marine ice-sheet evolution equations using the shallow-ice approximation are presented in spherical coordinates, and the numerical methods used to compute steady and transient profiles are given. A parameter study of steady profiles is carried out, and the response to sea-level rise with a flat, immobile bed and immobile beds of increasingly complicated geometry is considered. These studies are used to understand the results from a coupled ice-sheet/Earth model where the bedrock is now mobile.
The novel feature of the studies in this paper is the attention paid to accurate modelling, which is used to demonstrate the main results. These are that relative sea-level change and lithosphere dynamics predict very small grounding-line retreats and are unlikely to explain large retreats (>100 km) of marine ice sheets. This is in accordance with recent observations (Reference Conway, Hall, Denton, Gades and WaddingtonConway and others, 1999; Reference Anderson, Shipp, Alley and BindschadlerAnderson and Shipp, 2001) which suggest that the Siple Coast retreated well after the postglacial sea-level rise. In other words, theory and observation suggest that the retreat of the WAIS is due to other processes. Some of these, related primarily to thermomechanical coupling, are considered in the companion paper (Reference Hindmarsh and MeurHindmarsh and Le Meur, 2001).
2. The Ice-Sheet Model
2.1. Mechanical model: no back pressure
Recent years have seen a reappraisal of the “back-pressure” concept of marine ice-sheet dynamics (Reference PatersonPaterson, 1994; Reference BentleyBentley, 1997, Reference Bentley1998). A number of observations (Reference VaughanVaughan, 1993; Reference Whillans and van der VeenWhillans and Van der Veen, 1993; Reference MacAyeal, Rignot and HulbeMacAyeal and others, 1998) indicate very limited coupling between grounded ice and shelves in a number of cases. These observations are consistent with theoretical considerations discussed by Hindmarsh (Reference Hindmarsh and Peltier1993, Reference Hindmarsh1996), who pointed out that grounded ice masses with sufficiently high basal traction have their mechanics described by the shallow-ice approximation (Reference HutterHutter, 1983), and that significant longitudinal and other non-shallow stress effects were in consequence confined to a narrow boundary layer close to the grounding line. A large number of theoretical studies of the grounding-line area (Reference Herterich, Van der Veen and OerlemansHerterich, 1987; Reference Barcilon and MacAyealBarcilon and MacAyeal, 1993; Reference LestringantLestringant, 1994) support this idea. This means that in modelling marine ice sheets, there are large areas of grounded ice where the modelling of back pressure is not important; this could include all grounded areas excepting the ice aprons at the mouths of ice streams. This means that the sheet model does not need a coupled shelf model to compute the grounded-ice dynamics. A consequence of this is that rather than a limited number of steady solutions for ice-sheet geometry existing, which is true for non-marine ice sheets, an infinite number of steady geometries are possible (Reference Hindmarsh and PeltierHindmarsh, 1993, Reference Hindmarsh1996); in other words, the system is in neutral equilibrium. This has significant implications for modellers, as ensuring dynamical consistency between physical and numerical models of marine ice sheets is somewhat delicate (Reference HindmarshHindmarsh, 1996).
The fact that the back-pressure concept has been reappraised means that there are now two distinct schools of marine ice-sheet numerical modelling: (i) models where shelf and sheet are coupled across the grounding line with a computation of longitudinal stresses in this area (Reference Lingle and ClarkLingle and Clark, 1985; Reference Van der VeenVan der Veen, 1985; Reference HuybrechtsHuybrechts, 1992; Reference PattynPattyn, 1996), and (ii) uncoupled models where grounding-line advance is computed from the kinematics (Reference Hindmarsh and PeltierHindmarsh, 1993, Reference Hindmarsh1996). Models following method (i) can be criticized because they have not yet attempted to demonstrate that the numerical models are not adding spurious elements to the dynamics of the marine ice-sheet system; method (ii) can be criticized because it ignores the subtlety of grounding-line dynamics.
We follow method (ii) and reply to the latter criticism by saying that so far as the large-scale dynamics of marine ice sheets are concerned, complex stress fields in the grounding line are just a subtlety; there is no evidence or theoretical argument that they affect the flow of sheet/inland ice where basal traction is high. While these stress fields may affect streams, they are only of significance for areas of streams with slopes similar to those of ice shelves (Reference Hindmarsh and PeltierHindmarsh, 1993); such areas are of limited areal extent. In any case, the dynamical complexities of ice rises or marine ice sheets without streams are sufficiently complicated that they warrant separate investigation. We do represent sliding in this paper such that a very high proportion of the total velocity is due to slip, and check that the shallow-ice approximation is still valid. This is done by computing the “traction number” (Reference Hindmarsh and PeltierHindmarsh, 1993), which is the ratio of the surface longitudinal stress to the basal shear stress. If this number is around unity, non-shallow-ice approximation effects are unimportant (see Table 3, shown later). The computed traction numbers are never significantly greater than unity.
We do not represent lateral variation in flux (“streaming”), and it is possible that in streams where longitudinal stress gradients play a significant role, the neutral equilibrium concept on which the numerical schemes used in this paper are based does not hold. This issue remains open; thus we assert that the analysis is valid for slow-flowing inland ice, ice streams with mechanics described by the shallow-ice approximation and possibly for all grounded ice. Since we do not model a shelf, the model cannot represent shelf grounding caused by sea-level drop.
2.2. The ice-sheet equation in a spherical system
The continuity equation is
where H is the ice thickness, a is the mass balance and q is the mass flux. Assuming an axi-symmetric ice sheet resting at the surface (r = R) of the planet, functions are a position of latitude θ, and no dependence on longitude (φ) exists. Figure 1 illustrates the spherical coordinate system (r, θ, φ) in terms of a Cartesian coordinate system (x, y, z) for an arbitrary scalar field M. The divergence of the horizontal flux q in the coordinate system (θ, φ) on a sphere becomes
where qθ is obtained from the vertically integrated ice horizontal-velocity profile. Figure 2 illustrates the dependence of thickness field H, surface elevation s and basal elevation b on latitude. Free water depth is denoted f, and the thickness and free water depth at the grounding line are denoted H m, f m, respectively. The velocity v has two components (v r, vθ). For the moment, we assume ice motion to be exclusively due to internal deformation (no basal sliding), with a non-linearly viscous flow law, meaning that the meridional (outward) flux component qθ can be written as a function of local ice-sheet thickness H and upper surface radial gradient ∂s/∂θ (Reference MarshallMarshall, 1996),
Ice sheet resting upon a spherical Earth. Owing to axial symmetry, and the fact that on the Earth’s surface r is equal to the earth radius R, the spatial variables reduce to the co-latitude θ. The span θ m determines the ice thickness at the grounding line H m as a function of the local free water depth f m via the flotation criterion. The ice flow qθ(θ) is computed using the shallow-ice approximation.


where C = 2A(T)(ρig) n /(n + 2), with A(T) a rate factor for the ice, g the gravitational acceleration, ρ i the ice density and n the exponent for the creep power law (Reference GlenGlen, 1955)
Here, eij is the deformation-rate tensor, and τij is the deviator stress tensor which has second invariant
By construction, the surface s(θ) and bedrock elevations b(θ) are related by
(Fig. 2).
Sliding can also be incorporated into the description as follows. By allowing sliding at the bedrock contact, the velocity component at the base of the ice column (V h(r, θ); see Fig. 2) is no longer zero and is given by an appropriate sliding law. We chose a Weertman-type sliding which relates basal velocity to the basal shear stress σ b according to
Integrating this velocity term all along the ice-column thickness H gives
![]() , the extra flux due to the basal sliding. By expressing the basal shear stress as
, the extra flux due to the basal sliding. By expressing the basal shear stress as
this extra flux due to basal sliding
![]() can be written in a form similar to that resulting from internal deformation in Equation (3)
can be written in a form similar to that resulting from internal deformation in Equation (3)

Taking ℓ equal to n (3 in the computations), the total flux now becomes

In our experiments, the value for A s has been tuned so that the flux due to basal sliding is a multiple α of that due to internal deformation at the grounding line and in the initial steady state. Given Equation (10) and the value for C in the previous paragraph, this finally gives for A s

with A(T)the rate factor for the ice. Basal sliding is omitted in this study except where it is specifically mentioned as being included.
2.3. Computation of steady profiles
All of the dynamic computations reported in this paper have steady initial conditions, and examining the steady profile itself is also instructive. The steady profile is obtained from Equation (1) by setting ∂H/∂t = 0. Then, from Equation (2) and the zero-flux condition at the divide, we obtain
which can be integrated to give
We discretize over latitude θ by constructing N + 1 nodes with index k ∊ (0, N). By expressing the flux in terms of a finite-difference formula as a function of the ice thickness H and upper surface elevation s at the two successive nodes (k and k + 1) of the grid, we obtain from Equation (3)

where the subscript k + 1/2 stands for the flux at the grid centre between the nodes k and k + 1, and Δ θ represents the difference in co-latitude between two gridpoints. Computation of the steady profile consists of a backward integration from the grounding line up to the ice divide.
The ice thickness at the grounding line H m obeys the flotation criterion (Reference Van der VeenVan der Veen, 1985; Reference HindmarshHindmarsh, 1996)
where ρ w is the sea-water density (1028 kg m−3), θ m is the prescribed span in degrees of latitude and f m is the free water depth at the grounding line (see Fig. 2). Equation (15) is solved for Sk which, using the flux expression (14), gives

where θk +1/2 represents the position (k + 1/2)Δ θ . In Equation (17), (Hk + H k+ 1)/2 is first approximated by Hk +1, leading to a first estimate of Sk which is then used to yield an estimate of Hk . This latter value is then used for a more accurate estimate of (Hk + Hk +1)/2 in Equation (17) which is solved again. The iteration is repeated until convergence is obtained. The convergence is extremely fast since a relative variation in the solution less than 10 is reached after two or three iterations. The particular design of this scheme ensures consistency with the numerical schemes used for the time-dependent equations (Reference HindmarshHindmarsh, 1996). When sliding is incorporated, Equation (17) is modified by use of Equations (10) and (11) so that the term [(Hk + Hk +1)/2 n +2 in the denominator is replaced by [(Hk + Hk +1)/2] n +1 {[(Hk + Hk +1)/2] + αH m}.
Throughout this study, we only consider isothermal ice with a uniform flow law coefficient A(T) varying between 1.5 × 10⁻¹⁸ and 1.5 × 10⁻¹⁷ Pa−3 a−1, which, according to Reference PatersonPaterson (1994), corresponds to ice temperatures between about −30° and −10°C, respectively (without accounting for any enhancement factor resulting from fabric). The exponent for the flow law n has been set to 3, and the ice density is supposed to be uniform and equal to 917 kg m−3 Different steady-state profiles are described in section 3.
2.4. Computing the response to forcing
2.4.1. Grounding-line migration and moving grid
Following Reference HindmarshHindmarsh (1996), the time-dependent evolution for the ice sheet is solved approximately using finite differences to discretize the continuity equation on a normalized horizontal domain. Thus, we transform the spatial variable by constructing a normalized co-latitude ξ = θ/θ
m such that the ice divide and the grounding line correspond to ξ = θ and ξ = 1, respectively, implying solution over the domain ξ ∊ [0, 1]. It is known that such a transform permits (but does not ensure) consistency of the stability properties of the discretized equations with those of the associated differential equation. The grounding-line (angular) velocity
![]() is computed from a total differentiation of the flotation criterion (16) at the grounding line with respect to time; such a form is equivalent to a statement of mass conservation (Reference SalamatinSalamatin, 1989; Reference HindmarshHindmarsh, 1996). Then, by replacing ∂H
m/∂t by its expression in the continuity equation (1), and ∂/∂θ by (1/θ
m) (∂/∂ξ), we can follow the procedure in Reference HindmarshHindmarsh (1996), but now in the different ξ-coordinate system used in this paper, to obtain
is computed from a total differentiation of the flotation criterion (16) at the grounding line with respect to time; such a form is equivalent to a statement of mass conservation (Reference SalamatinSalamatin, 1989; Reference HindmarshHindmarsh, 1996). Then, by replacing ∂H
m/∂t by its expression in the continuity equation (1), and ∂/∂θ by (1/θ
m) (∂/∂ξ), we can follow the procedure in Reference HindmarshHindmarsh (1996), but now in the different ξ-coordinate system used in this paper, to obtain

where ∂f
m/∂t is the time derivative of the free-water depth at the grounding line. Since we neglect local variations in sea level arising from variations in the elevation of the geoid, the sea surface is assumed to be uniformly flat throughout time so that (∂f/∂ξ)|
ξ
=1 = (−∂b/∂ξ)|
ξ
=1. The quantity ∂f
m/∂t is the difference between the eustatic rate of sea-level change and the rate of change of bedrock elevation. Owing to grid motion consequent upon changes in the ice-sheet span
![]() , the transformation to the normalized domain introduces an advection term
, the transformation to the normalized domain introduces an advection term
![]() into the continuity equation, leading to the expression
into the continuity equation, leading to the expression

The discretization using an explicit time-stepping scheme for Equation (19) as well as that for Equation (18) are given in detail in the Appendix.
In the numerical experiments reported below, the forcing consists mainly of sea-level changes which influence the dynamic behaviour via the grounding-line migration (see Equation (18)). Temperature changes also exert a strong control on the rheological properties of ice through the temperature-dependent rate factor A(T) (see, e.g., Reference PatersonPaterson, 1994). However, temperature changes within the ice sheet in response to climatic forcing are neither uniform nor instantaneous, and these complex thermomechanical coupling effects are considered in the companion paper (Reference Hindmarsh and MeurHindmarsh and Le Meur, 2001). Our main concern in this paper is understanding the coupling between ice flow and bedrock deflection.
3. Results with a Uniform Bedrock Elevation
3.1. Steady profiles
Steady profiles were computed using the iteration (17) for different combinations of the parameters defining ice-sheet and bedrock geometry and the accumulation rate. We first tried to reproduce two major typical sizes with initial ice-sheet semi-spans of 500 and 1000 km, representative of the modern West and East Antarctic ice sheets, respectively. The rate factor A was also adjusted depending on the size of the ice sheet. The larger ice sheet is assumed to consist of relatively cold ice (≃ −30°C with a corresponding rate factor A = 1.5 × 10⁻¹⁸ Pa−3 a−1), while the smaller ice sheet had a rate factor of 1.5 × 10⁻¹⁷ Pa−3 a−1 roughly corresponding to −10°C. Basal sliding was also included in some of the calculations for the warmer ice sheet. This requires a slightly modified computation as described in section 2.3. The effects of the depth of the base (in particular the depth at the grounding line) were also investigated for the smaller ice sheet with values of both 500 and 1000 m below sea level used.
In addition, the consequences of different accumulation distributions were considered. We first considered uniform accumulation rates all over the ice-sheet surface, choosing 0. 03 and 0.05 m a−1 as accumulation rates for the larger and smaller configurations, respectively. We also introduced spatial variation into the patterns by constructing them to increase exponentially from the ice divide to the coast. Galling a 0 the accumulation at the divide, and assuming the accumulation rate to be a 0 k a at the margin (grounding line, θ = θ m), the general expression for accumulation rate as a function of co-latitude becomes

In that case, the steady continuity equation (12) becomes

Integrating by parts twice yields

and application of the zero-flux condition at θ = 0 yields

We then obtain

This new expression is used in Equation (17) in exactly the same way as previously described.
The different parameter combinations used here are summarized in Table 1. All the different accumulation parameterizations are labelled with the corresponding (a 0, k a) combination (note that k a = 1 gives a uniform accumulation rate). Where sliding is specified, the ratio α = 1. Corresponding computed profiles are shown in Figure 3.
Parameter sets used in Figure 3

Initial steady-state ice-sheet profiles corresponding to parameter sets defined in Table 1 and computed according to Equation (17).

All the profiles exhibit the characteristic parabolic shape for steady-state ice sheets. Since the marginal accumulation is greater, the configuration where the accumulation rate varies in space leads to an increased total ice input and therefore a thicker ice sheet (compare runs 1 and 2 as well as runs 4 and 6), despite the fact that the same accumulation rate obtains at θ = 0. Allowing for basal sliding for ξ ∊ [2/3, 1] increases the overall ice velocity which, under the same accumulation pattern, gives a thinner steady ice sheet (compare runs 2 and 3). Run 5 uses a rate factor A = 1.5 × 10⁻¹⁸ Pa−3 a−1 one order of magnitude smaller than run 4. It indicates that the resulting colder ice, by being more viscous, deforms less readily and leads to a thicker ice sheet. Finally, run 7 shows the effect of a shallower depth for the bedrock. In comparison with run 6, we see that the effect of increasing the bedrock elevation by 500 m increases the ice surface elevation by almost the same amount close to the divide. Since the two systems are in steady state, the necessity of maintaining the same flux through the decreased thickness required by the flotation condition implies that the margin slope is much greater for the shallower sea (as already shown in Reference HindmarshHindmarsh, 1996). This can in principle have an influence on the evolving ice sheet, since rate of expansion depends on the ice surface gradient (see the term (∂H/∂ξ)| ξ= 1 in Equation (18).
3.2. Time-dependent response
3.2.1. Validation of the marching scheme
In all experiments we computed a steady state with a certain parameter set, and then integrated it through time, in general changing the parameter set at t = 0+. A necessary condition for the numerical method to be valid consists of integrating the marching scheme (Equation (A1) in the Appendix) with exactly the same parameter set as that used to define the steady state and ensuring that the resulting configuration lay sufficiently close to the steady-state one. For runs 2 and 6 (the most realistic parameter sets for East and West Antarctica, respectively) we obtained almost exactly the same profiles after 10 kyr of integration: the grounding line retreated by only 0.52 and 1.40 m, respectively, while the thickness at the ice divide changed by about 60 and 40 mm, respectively.
3.2.2. Sea-levelforcing
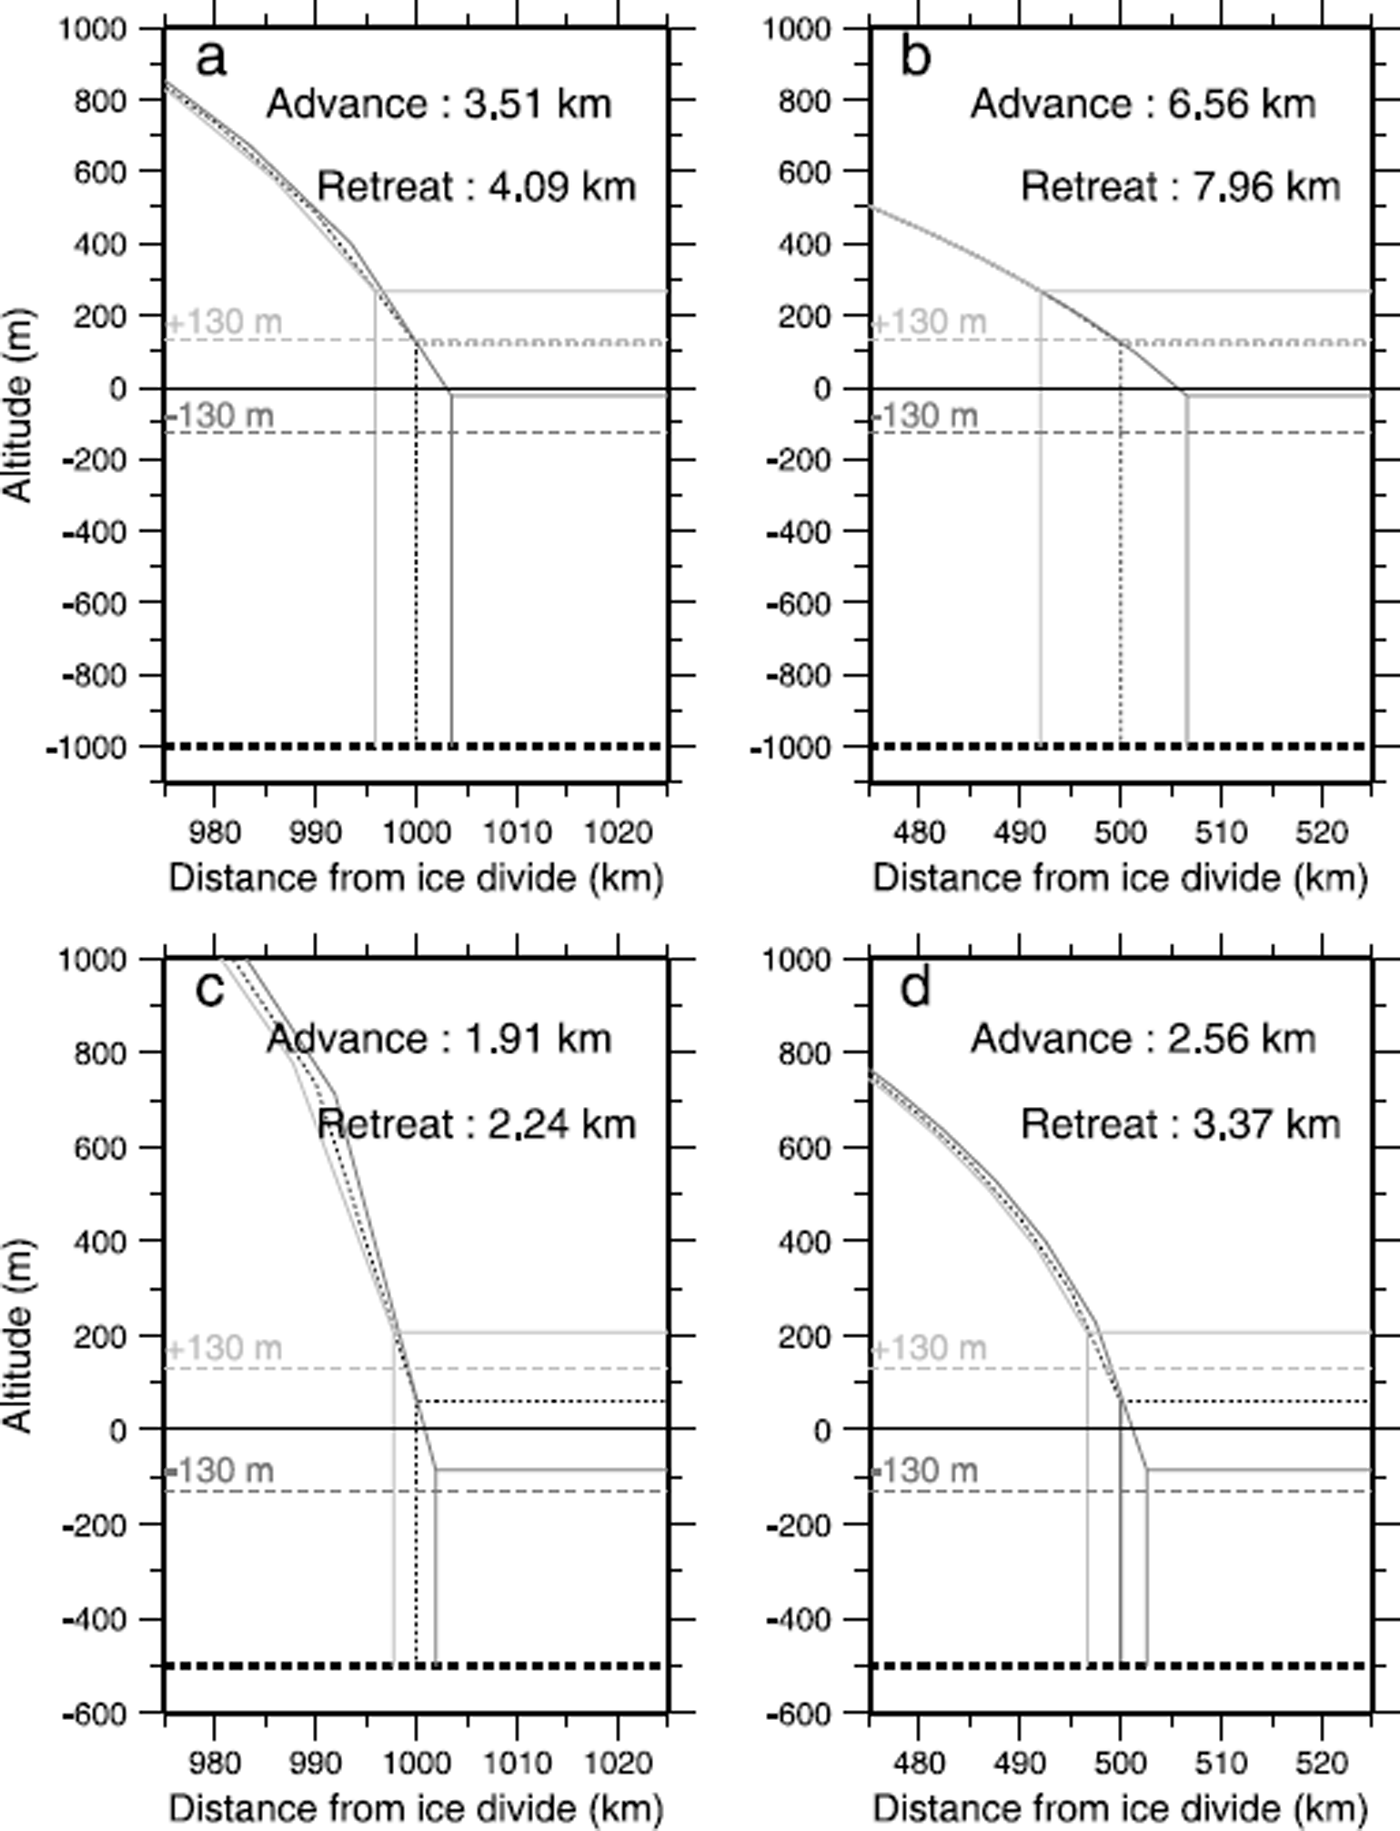
We now consider transient effects induced by sea-level changes. Sea-level fall and rise at a constant rate of 13 mm a−1 are considered over a period of 10 kyr. This replicates the 130 m sea-level change between glacial and interglacial epochs; the rate of rise is comparable with the average rate during deglaciation. The computed profiles as well as the initial steady profile for the two ice-sheet sizes and bed configurations are shown in Figure 4. For the larger ice sheet, the other parameters are as for run 2 (Table 1), whereas the configuration for the smaller ice sheet is as for run 6, but basal sliding is not permitted. When sea level increases, the outermost part of the ice sheet is floated off, thereby leading to a grounding-line retreat. Conversely, a sea-level drop permits a grounding-line advance.
Grounding-line advance or retreat after 10 kyr in response to sea-level fall or rise for both the small (500 km; b, d) and the large (1000 km; a, c) ice sheet with the two different bedrock depths (−1000 m (a, b) and −500 m (c, d)). The initial steady profile is plotted with a dashed line, as are the final sea-level stands at the end of the simulation (±130 m). No bedrock deflection is permitted in these calculations.
At this stage, it is worth pointing out the difference induced by uniform and spatially varying accumulation parameterizations on the ice-sheet evolutions driven by sea-level change. Owing to the local character of the flux equations (3) and the ice-thickness change at a given point in space (Equation (19) without the advection correction term
![]() , changes in the grounding-line position cannot modify the inland ice-sheet profile, provided the accumulation is spatially uniform. On the other hand, the exponential dependence of the accumulation term on normalized position leads to a time-varying accumulation term at a given location as the span changes, which in turn will perturb the ice-sheet profile (Fig. 4). In other words, the accumulation rate varies as a function of normalized position, which means the accumulation rate at a given position in physical space changes as the grounding line moves. Ultimately, this causes the ice-sheet elevation to change in the grounded area. Owing to the relatively small change of the ice-sheet span, this change in thickness is not very pronounced in Figure 4.
, changes in the grounding-line position cannot modify the inland ice-sheet profile, provided the accumulation is spatially uniform. On the other hand, the exponential dependence of the accumulation term on normalized position leads to a time-varying accumulation term at a given location as the span changes, which in turn will perturb the ice-sheet profile (Fig. 4). In other words, the accumulation rate varies as a function of normalized position, which means the accumulation rate at a given position in physical space changes as the grounding line moves. Ultimately, this causes the ice-sheet elevation to change in the grounded area. Owing to the relatively small change of the ice-sheet span, this change in thickness is not very pronounced in Figure 4.
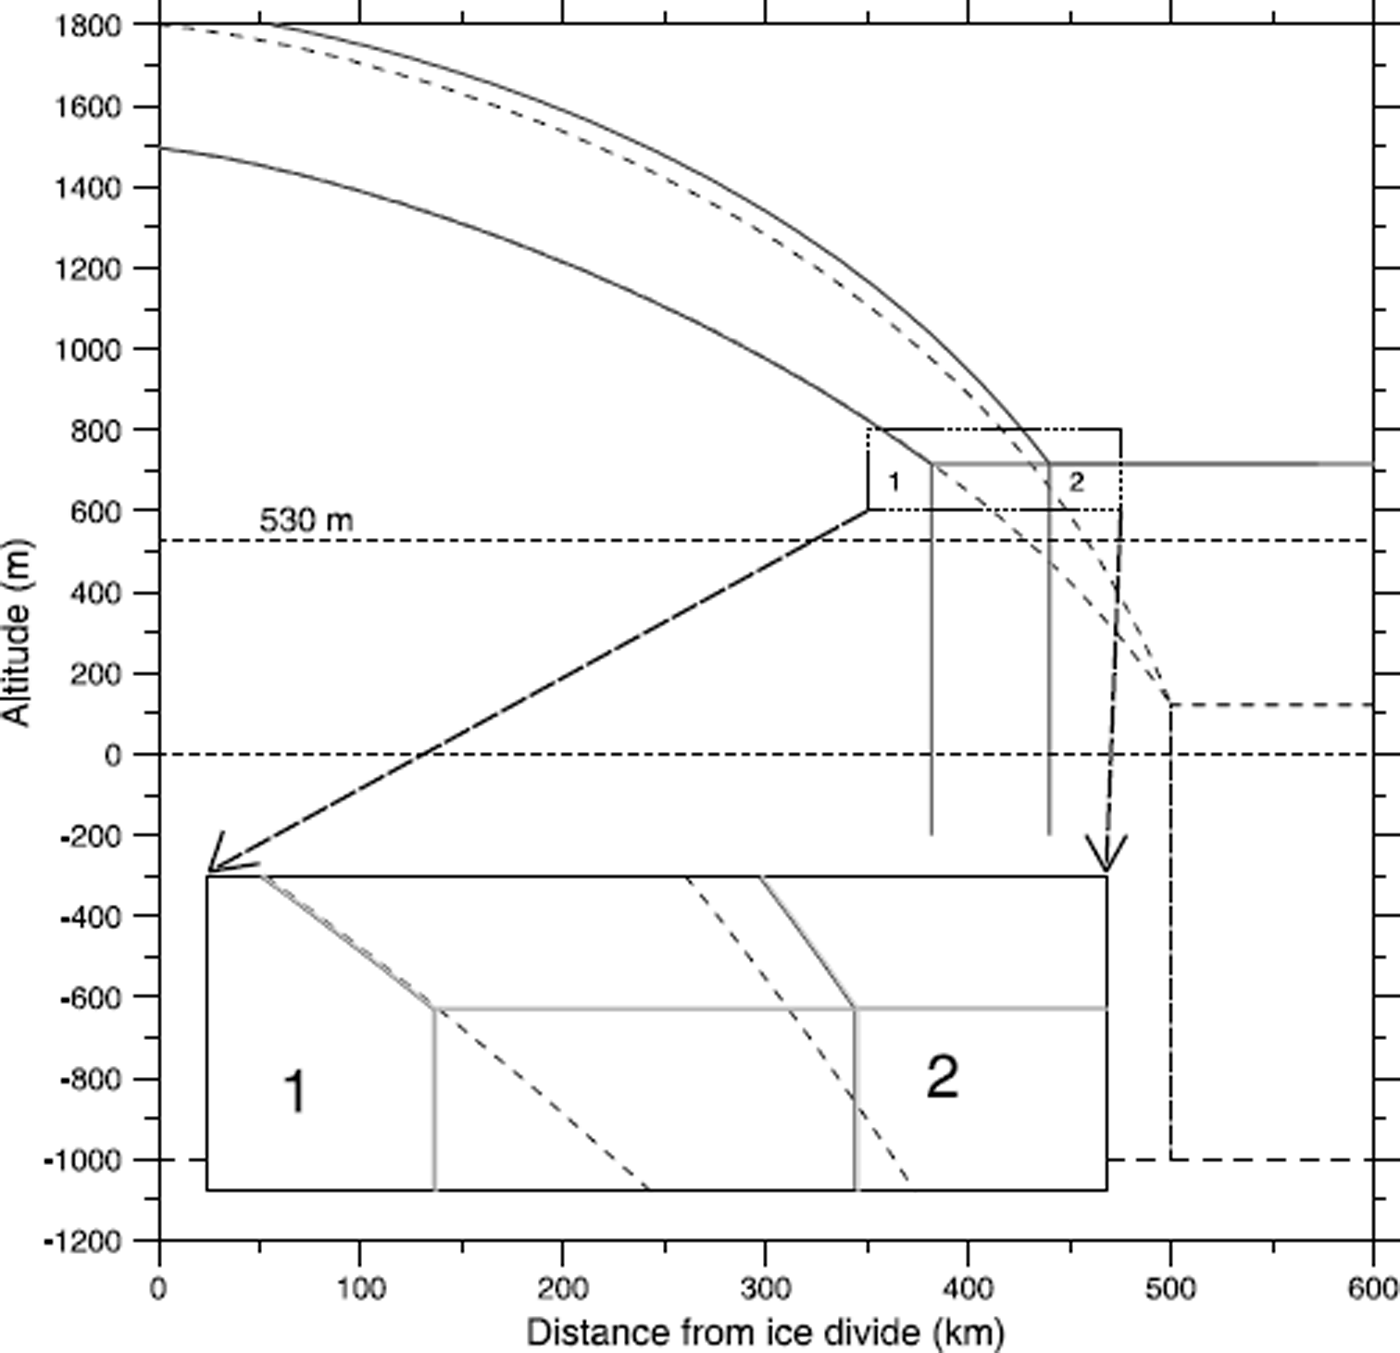
Some cases where this effect is more obvious are shown in Figure 5, which shows the effect of spatially uniform and non-uniform accumulation rates upon ice-sheet retreat in response to sea-level rise (the configuration here corresponds to Figures 4b and 6b). Accumulation rates are the same (50 mm a) at the divide, but are 10 times larger at the margin for the non-uniform case. This means that the margin flux for this case is larger, meaning that the slope is larger and the whole ice sheet is thicker. The larger slope also means a lesser retreat. In the uniform-accumulation-rate case (case 1, Fig. 5), ice-sheet elevation does not change in grounded areas owing to the local form of the flux expression arising from the local form of the driving stress given by the shallow-ice approximation. In the non-uniform case (case 2, Fig. 5), as a result of the construction of the accumulation distribution, changes in the grounding-line position cause changes in the accumulation distribution within the ice sheet, which means that the ice-sheet elevation in the grounded area changes as well. In order to produce a substantial retreat, a very high sea-level change was specified (total rise of 530 m). The fact that the uniform-case profile does not change shows that the numerical method is working successfully. These experiments were repeated with twice as many gridpoints (200), and very similar results were obtained (see the corresponding grey curves, which superpose almost exactly on the 100 gridpoint black curves in the zoom box).
Effect of spatially uniform (case 1) and non-uniform accumulation rates (case 2) on ice-sheet retreat in response to sea-level rise (the parameter set here corresponds to Figures 4b and 6b). These experiments were repeated with twice as many gridpoints (200) (corresponding grey curves, which superpose almost exactly on the 100-gridpoint black curves in the zoom box).
Reference HindmarshHindmarsh (1996) observed a significant change of ice thickness at the ice divide by exclusively forcing his model by sea level, even though a uniform accumulation rate was specified, which is an erroneous result. This problem was solved by using higher-order finite-difference methods (see Appendix) which can be shown to produce dynamically consistent numerical schemes using a suitable modification of the techniques described by Reference HindmarshHindmarsh (1996, appendices 1 and 2).
Figure 4 also shows the strong effect of the free water depth at the grounding line where a shallower bedrock induces a greater ice-surface gradient. This effect tends to reduce the grounding-line migration arising from sea-level forcing. To see why, we note that since the flux is locally determined and its gradient is approximately in equilibrium with the local accumulation rate, if forcing is due to sea-level change only, the grounding-line formula (Equation (18)) reduces to

when the bedrock is flat. (In fact, for display purposes, the accumulation rate in Figure 4 is exponentially varying in space in order to prevent the different profiles from being coincident, but the flux gradient continues to more or less balance the accumulation rate, and the profiles are very close to steady-state profiles.) It is therefore clear from Equation (25) that for a given rate of sea-level change ∂f m/∂t (recall there is no bedrock change being considered at the moment), the grounding-line motion will be inversely proportional to the marginal ice-thickness gradient (1/θ m) (∂H/∂ξ)| ξ= 1. The computed grounding-line migration rates are extremely small; they can also be shown to be consistent with the initial margin-thickness gradient in Table 2 and Equation (25). The small retreats are a consequence of the fact that the thickness gradients are quite high owing to the ice being cold and therefore stiff. However, the range of slopes we compute for both steady-state and time-dependent results (see Tables 2 and 3) are consistent with observations of slope, which show a range of 0.1% to several per cent (Reference McIntyreMcIntyre, 1983; Reference Jackson and KambJackson and Kamb, 1997). For some context, notice that a thickness gradient of only 0.1% will produce a retreat of 112 km for a 100 m sea-level rise; such a retreat is still small compared with that observed for the Siple Coast (Reference Licht, Jennings, Andrews and WilliamsLicht and others, 1996; Reference Conway, Hall, Denton, Gades and WaddingtonConway and others, 1999).
Steady ice-sheet thickness gradient at the margin and corresponding grounding-line retreat computed from Equation (19) integrated over the 10 kyr
We now consider cases with the same free water depth, but for the two different ice-sheet spans (compare Fig. 4a with Fig. 4b, or Fig. 4c with Fig. 4d). When the span is larger, the grounding-line flux is also larger, leading to a greater slope at the grounding line. This effect is compounded by the fact that we have specified the experiment such that the larger ice sheet also has a smaller rate factor. This slope difference has predictable effects on the total displacement of the grounding line, as well as the respective grounding-line velocity and ice-sheet span for the same cases (shown in Fig. 6).
Same experiments as in Figure 4, showing grounding-line velocity (solid line) and ice-sheet span (dashed line) during the 10 kyr of simulation. Retreats (negative velocities) and advance (positive velocities) computations are shown for each case.

Table 3 shows the effects of including basal sliding for the configuration corresponding to Figure 4b. One can see that basal sliding increases the total retreat after 10 kyr, and it also reduces the slope such that the geometrical considerations described above still apply. Although sliding makes the ice sheet more sensitive to sea-level rise, the total retreat after a sea-level rise of 130 m over 10 kyr still remains limited.
Also noticeable from the total displacement after 10 kyr in Figure 4 is the asymmetric grounding-line motion in response to sea-level rise and fall, respectively. The ice sheet shrinks slightly more easily than it expands. This is readily interpretable once one realizes that the ice-sheet expansion is limited by the necessity of providing the extra ice volume through accumulation, whereas nothing similar can prevent the ice sheet from retreating as fast as sea level dictates. The features are demonstrated in Figure 6, where the grounding-line velocity and the ice-sheet span are plotted against time. When considering retreat, the grounding-line speed steadily increases, whereas with grounding-line advance, the velocity reaches a maximum generally after about 1 kyr and subsequently decreases. This asymmetric behaviour appears to depend upon the relative rates of accumulation and sea-level change. For example, in case A, the discrepancy between the retreat and advance magnitudes which is 13.5% with a sea-level rate of change of 13 mm a−1, is only 6.8% when the rate of sea-level change is halved.
A final point is that given that the speed of retreat increases in all cases, it may be of interest to address the longer-term evolution of the ice sheet. However, if one wants to reproduce a realistic deglaciation forced by sea level, either a non-zero rate of change of sea level has to be specified for the first 10 kyr only (at the same rate of 13 mm a−1), or it needs be specified to last for longer but at a lower rate. In the first case, after 10 kyr of sea-level rise (13 mm a−1), the speed of retreat rapidly falls to zero within < 200 years, leading to the same total retreat after 50 kyr as after 10 kyr (in fact there is a slight decrease in the total retreat of 40 m which is due to a slight readvance during the last 40 kyr of constant sea level). In the second case, a halved rate of sea-level change over twice as long a period (20 kyr) leads to the same final retreat with rates which are exactly halved. Similar results were also obtained in case of ice-sheet advance in response to sea-level fall.
4. Sensitivity to Uniform Bedrock Slope at the Grounding Line
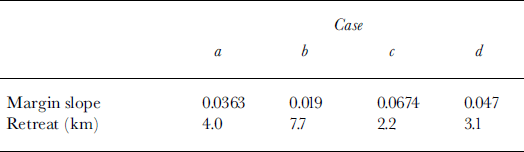
It has been suggested by several authors (Reference HughesHughes, 1973; Reference WeertmanWeertman, 1974; Reference Lingle and ClarkLingle and Clark, 1985) that grounding-line motion is sensitive to the local bedrock slope (recall a positive slope in our coordinate system means decreasing depths with θ or ξ). The dependence upon the local sea-floor slope is in fact discernible from the term (∂f/∂ξ)| ξ =1 = −(∂b/∂ξ)| ξ =1 in the grounding-line velocity expression (18). We investigate this dependence through a series of numerical experiments, testing a range of slopes (Fig. 7). In the first instance, the effects solely arising from slope variations were investigated by keeping the depth at the steady-state grounding-line position the same (−1000 m) for all the cases. We restricted consideration to the smaller ice sheet (initial span 500 km, A(T) = 1.5 × 10⁻¹⁷ Pa−3 a−1, with a uniform accumulation rate of 50 mm a and with no basal sliding. Again, the simulation lasts 10 kyr with a constant sea-level change (rise or fall) of 13 mm a−1. The results displayed in Figure 7 show an increasing total retreat as the slope gets more positive (12.68, 14.44 and 16.75 km for slopes of −0.5% (case 3), 0% (case 1) and +0.5% (case 2), respectively). Note the almost constant value for the advance (11.39, 11.77 and 12.26 km for the same slopes, which suggests that grounding-line advance rate is being restricted by the accumulation rate.
Ice-sheet profiles after 10 kyr sea-level change for different bedrock slopes (−0.5%, 0% andO.5%) at the grounding line. Three insets labelled 1–3 (for grounding-line bedrock slopes 0%, 0.5% and −0.5%, respectively) are shown, as well as the corresponding ice-sheet profiles (labelled accordingly). Inset 1 represents advance and retreat for the flat case (dashed black profiles). Also visible in this box are the two geometries at the grounding line corresponding to the 0.5% and −0.5% slopes. Insets 2 and 3 represent the positive and negative slope cases, respectively, at the grounding line. The steady-state ice profiles are in black, whereas both retreats and advances are gray dashed lines. Corresponding ice profiles all over the ice sheet appear in the main frame (labelled 1–3) and one can see that owing to the uniform accumulation pattern, steady-state, retreat and advance profiles coincide in all cases. The differences in steady profiles arise as a consequence of a different bedrock depth for the ice-sheet interior, with −1350 m for case 2, −1000 m for case 1 and −650 m for case 3. There is no sliding or isostatic deflection.

The range of slopes is deliberately kept small since guaranteeing a uniform slope in the zone where the grounding line migrates has a strong influence on the bedrock depth in the interior of the ice sheet (−650 m (case 3) and −1350 m (case 2) for slopes of −0.5% and +0.5%, respectively). Such changes in the bedrock configuration modify the ice-sheet initial profile (see profiles 2 and 3 in Fig. 7) and, in consequence, make the effects of grounding-line slope difficult to isolate.
5. Sensitivity to Uniform Bedrock Slope and the Depth at the Grounding Line
The first results in section 3.2.2, where two sea-floor depths were used, also showed an influence of the free water depth on the grounding-line dynamics. The preceding sensitivity study was generalized to assess the combined effects of both the bedrock depth and slope at the grounding line. The same simulation as the preceding one has been carried out where the two parameters were varied between −0.5% and +0.5% for the slope and between −1000 and −200 m for the water depth at the grounding line. The contours in pale grey in Figure 8 represent the corresponding total grounding-line retreat after the 10 kyr of simulation. The main result is the predominant dependence on the free water depth (note how the contours are shifted primarily along the depth axis). This effect presumably arises as a consequence of the effect of the free water depth on the thickness gradient at the grounding line.
Total ice-sheet retreat in km after10 kyr with a sea-level rate of change of 1.3 cm a−1 shown as a function of both the bedrock slope and the free water depth at the grounding line. Cases with and without isostatic deflection are shown. Initial conditions are shown in Figure 7, which in particular shows the areas where the bedrock slope is non-zero. In the case where isostatic deflection was incorporated, this bed profile was taken to be in isostatic equilibrium at the start.

6. Incorporating Bedrock Dynamics
6.1. Bedrock model
The results above have made it clear that any process modifying depth and slope at the grounding line through isostatic Earth accommodation under surface-varying loads will play a role in the grounding-line dynamics.
The bedrock model used here (Reference Le MeurLe Meur 1996a, b) is based upon previous approaches (Reference LongmanLongman, 1962; Reference FarrellFarrell, 1972; Reference Wu and PeltierWu and Peltier, 1982) which led to a new generation of SGVE spherical Earth models. Self-gravitation is a fundamental aspect, and the perturbation in the gravity field induced by deformation is not only explicitly computed but also fully included as an extra driving force in the stress-balance equations. The spherical approach is effected by a spectral decomposition onto a basis comprising the spherical harmonic system of orthonormal functions. The spherical approach allows proper account to be taken of the radial distribution of the Earth’s mechanical properties, especially when computing the far-field response. The model incorporates the entire mechanical structure of the planet from the outer elastic lithosphere down to the core with a three-layer mantle lying in between, where most of the isostatic accommodation takes place. The Earth’s structure is summarized in Table 4. A significant feature is the use of a Maxwell body model to represent the viscoelastic response of the mantle; this introduces the characteristic time-scales which are mainly responsible for the Earth dynamics. The viscoelastic approach is formulated using the conceptual framework of the “correspondence” principle (Reference BiotBiot, 1954; Reference PeltierPeltier, 1974). The Green’s functions cause the solution to have an instantaneous elastic response and several relaxing viscous modes. The response to any loading history can be obtained by a double space- and time convolution of these Green’s functions with the space and time distribution of both ice and water overburdens.
Earth parameters used in the unit bedrock model
For the sake of more accurate results as well as a faster computation, the model has been coded with the symbolic manipulator Mathematica (Reference Spada, Yuen, Sabadini, Morin and GasperiniSpada and others, 1990, Reference Spada, Sabadini, Yuen and Ricard1992). By replacing approximate numerical calculations with exact symbolic operations, many of the propagating round-off errors can be avoided in the numerous matrix products involved. Given an Earth structure, the corresponding set of Love numbers (amplitudes in the spectral domain from which Green functions are summed later) represents the actual output for the unit model. This only needs to be computed once.
6.2. Asynchronous coupling between the two models
Following Reference Le Meur and HuybrechtsLe Meur and Huybrechts (1998) it was found that computing the bedrock evolution every 100 years was a sufficiently fine temporal resolution to reproduce correctly the ice-sheet/Earth dynamics (the time-step for the ice model being about 0.2 year). This time-scale emerges as a consequence of the characteristic time-scales for the viscous mantle response and is a trade-off between computational effort and accuracy.
Following summation in a Legendre series of the elastic and viscous Love numbers computed by the unit bedrock model (see, e.g., Reference Le Meur and HindmarshLe Meur and Hindmarsh, 2000), the impulse Green function response reads

where G
E(θ) represents the elastic instantaneous Green’s function, and
![]() each of the jth viscous-mode Green’s functions. From there the bedrock response at time t for any of the kth gridpoint along the flowline (and also at sea) can be expressed as
each of the jth viscous-mode Green’s functions. From there the bedrock response at time t for any of the kth gridpoint along the flowline (and also at sea) can be expressed as

where the summation represents the spatial convolution. This consists of integrating the contribution to deformation of all the neighbouring points lying within a circle of radius 1000 km. The circle (symbolized as Dk
) is discretized along a local latitude (index jα
) and a local longitude (index jβ
), and
![]() is the angular distance between the gridpoint k and the point whose contribution is considered. The element area is Δ∑ = R sin is θΔ
θ
Δ
φ
where Δ
θ
,Δ
φ
are the grid dimensions on the surface of the sphere. It should be noted that lithospheric rigidity causes the steady bedrock response to deviate from local compensation, being now partly driven by the neighbouring loads.
is the angular distance between the gridpoint k and the point whose contribution is considered. The element area is Δ∑ = R sin is θΔ
θ
Δ
φ
where Δ
θ
,Δ
φ
are the grid dimensions on the surface of the sphere. It should be noted that lithospheric rigidity causes the steady bedrock response to deviate from local compensation, being now partly driven by the neighbouring loads.
The time integration expresses the fact that the current response does not exclusively depend upon the current state of loading, but also includes the contribution from past loads (see H(iα, j β , t′) in Equation (27)) because of the delayed viscous response. A memory period (Δmem) therefore has to be chosen according to the particular viscosity structure of the model, so that the viscous response is completely accounted for. In our case, with the viscosity values adopted (see Table 3), it appears enough to convolve 15 kyr back in time in order to retain > 98% of the viscous response.
Every 100 years, the loading function H(i α , j β , t) is updated from the current ice distribution and sea level, and is used to compute the new bedrock profile according to Equation (27). Bedrock response at sea is computed up to an appreciable distance (1.5 × the ice-sheet span) from the ice-sheet edge, since change of the depth of the seabed induces a loading variation by modifying the water column. In this respect, local sea-level changes induced by geoidal undulations should theoretically also be taken into account. The need for such a level of sophistication is, however, questionable since it would require a global approach for solving the sea-level equation (e.g. Peltier, 1994), with limited gains compared with the accuracy of both the ice-sheet and the bedrock models. Finally, the newly computed deflection rate is used during the succeeding bedrock interval (100 years).
7. Results from the Coupled Ice-Sheet/Earth Model
7.1. Specification of initial conditions for the bedrock deflection
The uncoupled SGVE model has the dynamics of a linear system; in other words, it relaxes exponentially towards that isostatic equilibrium corresponding to the current loading. The fact that linear systems admit superposition of solutions gives us some flexibility in formulating initial conditions. One possibility (method a) is to choose an ice-sheet span, compute the profile on a flat bed, determine from this the loading, and compute the steady bedrock deflection induced by this load. With this deflection and with the same span, one computes the new ice-sheet profile, and proceeds iteratively until convergence is obtained. In practice, around 20 iterations are needed for the same level of accuracy as in the computation of the steady profile in section 3. This approach has the merit of conceptual simplicity, as we simply compute the steady deflection of an initially flat bed, and the approach shows clearly what the equilibrated Earth response to an ice sheet means in terms of bedrock displacement. This aspect is considered in section 7.3 where the bedrock response computed according to method a reveals some interesting geometrical features.
In fact, as a consequence of superposability, a flat bed is not a unique choice for a bed in isostatic equilibrium with a spatially uniform load. Superposability means that we can choose any bed profile and define it to be in isostatic equilibrium with the initial ice-sheet profile. Lithospheric deflections due to subsequent loading changes are readily computable using superposition principles. We can justify the approach by pointing out that in general the bedrock profile corresponding to ice-free conditions will not be a flat bed. We term this method b. We shall carry out investigations using these two methods.
7.2. Time-dependent response
The same sensitivity tests on the depth and the slope at the grounding line as for a rigid bed (see section 5) were carried out, but with the bedrock deflection included using method b. The results (darker contours) are displayed along with those computed for the rigid Earth (pale grey) in Figure 8. For the parameter set considered, the inclusion of iso-statically induced bedrock deflection results in an increase in the total computed grounding-line retreat. This increase becomes more pronounced for larger depths and, to a lesser extent in this range of parameters, for greater slopes.
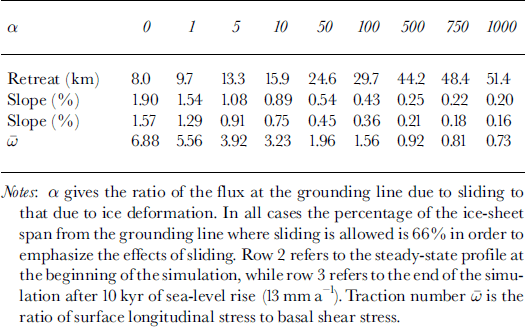
Figure 9 shows some ice-sheet and bedrock profiles arising from these coupled evolutions. The 13 mm a sea-level rate of increase over the simulation leads to a total rise of 130 m which significantly depresses the bedrock beyond the grounding line. Underneath the ice sheet, the bedrock deflection hardly changes. As shown in the lower zoom box and in the upper inset, the bedrock response noticeably increases the final water depth at the grounding line (from 1213 m to 1245 m, i.e. by about 15%), whereas it has almost no effect on the slope (change is less than one-fiftieth). Note that since there are no physical mechanisms represented in the ice-sheet model which allow substantial change of the inland ice sheet, no isostatic recovery is expected and the consequence of deglaciation of distal areas (e.g. in the Northern Hemisphere) is increased bedrock deflection at the grounding line via sea-water loading.
Simulations of coupled ice sheet and bedrock carried out with the initial state corresponding to case 1 in Figure 7 using method b. This figure shows final geometry after 10 kyr of simulation when the bedrock response is either accounted for (black) or disregarded (grey).
Owing to the fact that changes in the total loading around the grounding line are relatively small (the ice which has been floated off is replaced by a water column of similar weight), the bedrock response there is mainly the result of the regional bending of the lithosphere in response to the sea-level change and to changes in the loading beyond the grounding line (Fig. 9). A consequence of this is that the local slope is hardly modified, whereas the free water depth at the grounding line increases rather more (see the enlargement and the time-dependent evolution of these two fields for both cases in the upper part of Figure 9). The effect of the change in bedrock deflection is to increase the rate of change of free water depth, which has a similar effect to the sea-level forcing. This effect is directly detectable by inspection of the grounding-line migration-rate formula (Equation (18)) where the rate of change of bedrock elevation ∂b/∂t associated with the rate of sea-level change contributes to the rate of change of the free water depth ∂f m/∂t.
7.3. The steady-state bedrock response
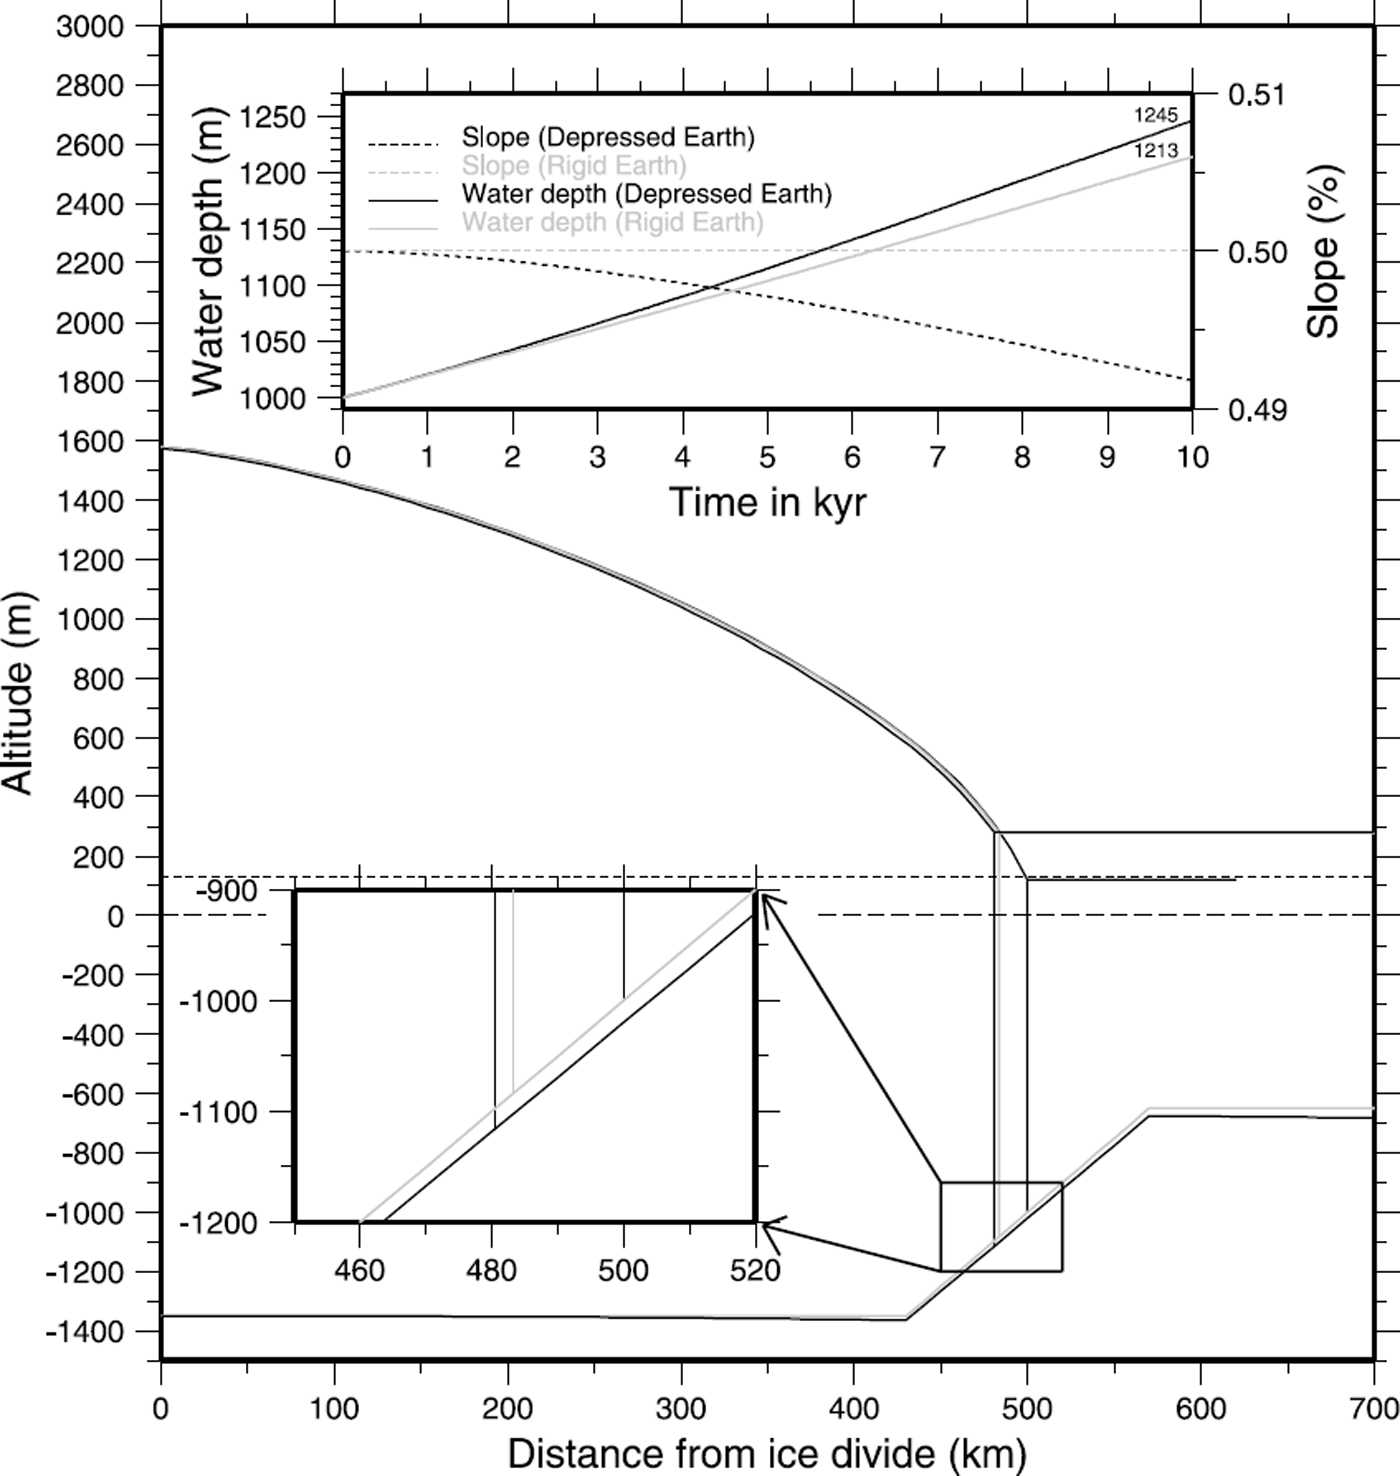
Finally we investigate the coupled response of ice sheet and the Earth using method a, iteratively computing a steady deflection corresponding to the ice-sheet loading; we now assume that the ice-free bedrock profile is a flat bed (Fig. 10a) or with pre-existing topography as in Figure 9 (see Fig. 10b). Note that ice-free conditions imply that the bedrock is now submerged, meaning that the additional load we actually consider is that due to the ice freeboard. Both panels in Figure 10 show the resulting steady configuration when bedrock accommodation is either neglected (grey) or accounted for (black) according to method a as previously described. In particular, they show the effects of the rigidity of the lithosphere on the overall geometry of the bedrock response under an ice sheet.
Computed steady bedrock deflections according to method a. This figure shows the regional nature of the deflection, which occurs as a consequence of lithospheric rigidity. Rigid Earth (no isostatic response) and corresponding ice-sheet profiles (with or without isostasy) are also shown. (a) Ice-free equilibrated flat bed; (b) Ice-free bedrock with the same relief as in Figure 9.
The response is regional in the sense that it not only depends on the local load but also includes the contribution from all neighbouring points lying within a certain distance. In other words, since the sea level is kept constant, the bedrock deflection due to the presence of inland ice extends beyond the ice-sheet margin. A corollary is that the rigidity of the lithosphere reduces the maximum deflection compared with local compensation according to Archimedes’ principle. For example, with an ice/asthenosphere density ratio of 917/3350, local compensation would give a maximum depression below the ice divide of about 515 m instead of the 368 m we obtained (see Fig. 10a).
The more rigid the plate (generally the thicker), the smoother the overall profile (less pronounced amplitude and more widely spread features). In particular, this means that the slope at the grounding line is strongly controlled by the lithospheric thickness, a parameter which is unfortunately poorly constrained and which probably undergoes strong lateral variations.
8. Conclusion
This paper contains the results of some accurate calculations of the coupled behaviour of marine-ice-sheet and lithospheric evolution. We use a self-gravitating viscoelastic model for the
Earth, and use a marine ice-sheet model which ensures consistency between the dynamics of the governing equations and the corresponding discretized (finite-difference) approximation.
Our main conclusion is that sea-level change and lithospheric coupling are unlikely to play significant roles in the retreat of marine ice sheets. The postglacial rise in sea level would have caused no more than around 100 km of grounding-line retreat for the WAIS, and figures of a few tens of kilometres are more likely. These results are broadly consistent with the retreat of East Antarctica, but we must look to different mechanisms to explain the retreat of the Siple Coast. There is no evidence that reverse slopes lead to instability but they do increase sensitivity.
Incorporating coupling with lithospheric dynamics does not produce markedly different effects, and we did not discover any change in the qualitative dynamics; the dynamics remain dominated by the neutral equilibrium properties of a marine ice sheet. A major physical reason for this is the fact that a retreating marine ice sheet is replaced by a water column which exerts a similar load to the ice load near the margin. When sea level rises, the increased loading leads to a lowering of the bedrock, which increases free water depth and thus total grounding-line retreat.
Including sliding does have a significant effect on total retreat, but even with large amounts of sliding the total retreat is an order of magnitude smaller than that required to explain the postglacial retreat of the Ross Sea ice sheet. This small retreat seems to arise from the fact that for a given flux the margin slope is proportional to the inverse cube root of the rate factor. The range of feasible margin slopes is thus relatively small. Since retreat is inversely proportional to margin slope, the range of possible retreats is also rather restricted.
Clearly the presence of ice streams should be expected to affect these results. However, (i) ice streams, being flatter, should not be expected to have strong lithospheric coupling; (ii) many of the sea-level rise effects discussed in this paper are simply geometrical; and (iii) highly enhanced sliding does not affect results very much. We have carried out calculations with enhanced sliding, inducing slopes comparable to those found in the flatter parts of Ice Stream B, and have not found sufficiently large retreats to explain the postglacial retreat of the WAIS (Table 3). The implication of these studies is that marine ice-sheet retreat is caused by other processes, which might include ice-stream processes. Some of these are considered in the companion paper (Reference Hindmarsh and MeurHindmarsh and Le Meur, 2001).
Acknowledgements
The authors would like to thank R. Greve for his thorough editing and his determination to make these papers readable.
Appendix: Spatial Discretization and the Explicit Time-Stepping Scheme
By using normalized coordinates ξ the spatial discretization with an evolving span can still be dealt with similarly to the steady state as described in section 3. The elementary difference in co-latitude between two successive gridpoints now reads Δ θ = Δ ξθ m with Δ ξ = 1/N, N being the total number of gridcells. From Equation (19), and from the discrete expression for the flux at any intermediate point (k + 1/2) as in Equation (15), the explicit time-stepping iteration scheme for the ice thickness becomes:

where k is the position index such that kΔ
ξ
= ξ, i is the time index and Δt the time-step. For
![]() , the grounding-line angular velocity at time-step i, we get from Equation (18):
, the grounding-line angular velocity at time-step i, we get from Equation (18):

Note that due to the discretization, [∂(qθ
sin θ)/∂ξ] cannot be evaluated rigorously at ξ = 1. When no bedrock deflection is accounted for (as in sections 3–5), the bedrock evolution
![]() is zero and the sea-floor slope at the grounding line
is zero and the sea-floor slope at the grounding line
![]() is given by the initial steady-state topography for the simulation. Where isostatic deflection is included, these two terms are explicitly computed by the bedrock model but less often than for the ice-sheet model (the reason for a different time index j, and time-step Δ
τ
).
is given by the initial steady-state topography for the simulation. Where isostatic deflection is included, these two terms are explicitly computed by the bedrock model but less often than for the ice-sheet model (the reason for a different time index j, and time-step Δ
τ
).
Here, Dℓ
is the ℓth-order finite-difference expression for the slope at the margin. For example,
![]() , and higher-order formulas may be readily computed using Taylor expansions. It was found that higher-order formulae substantially increased the accuracy compared with the first-order formula used by Reference HindmarshHindmarsh (1996) and that in all the computations here we used a fifth-order formula. In practice, we used the numerical algorithm for finite-difference weights due to Reference FornbergFornberg (1996) which for fifth order gives
, and higher-order formulas may be readily computed using Taylor expansions. It was found that higher-order formulae substantially increased the accuracy compared with the first-order formula used by Reference HindmarshHindmarsh (1996) and that in all the computations here we used a fifth-order formula. In practice, we used the numerical algorithm for finite-difference weights due to Reference FornbergFornberg (1996) which for fifth order gives


