


1 Introduction
1.1 Lotteries and heuristics
Lotteries, like all games of chance, rely on randomness. Random events occur without method or conscious choice (Oxford Dictionaries, 2015), meaning that all numbers have an equal chance of emerging as winning numbers in an independent, fair drawing. Players aim to maximize their earnings by choosing as many winning numbers as possible, however the randomness of the lottery leaves the player with no rational decision making process to increase the likelihood of winning a prize. Players often resort to irrational strategies to try to ‘outsmart’ randomness. In the present lotteries, most of these “irrational” strategies are harmless, but they may be harmful elsehwere.
Throughout history, people have used heuristics to assist in the decision-making processes. Often these heuristics are the result of a rational thought process, boiled down to an easily accessible shortcut. Other times, heuristics are based on irrational strategies, often a result of decision traps (Tversky & Kahnemann, 1974). Lottery players frequently rely on the latter category of heuristic to choose what they hope will be winning numbers. However, not all lottery players are the same, and not all lotteries are structured in the same manner. In this paper we demonstrate that the geometric design of the lottery ticket affects number preferences, and that players have biases when selecting numbers, making some numbers “popular” and other “unpopular”. We also demonstrate that observed biases change as the prize grows, and as the number of participants increases accordingly.
Due to the difficulty involved in obtaining sufficient data to conduct a direct analysis of these number selection strategies and the resulting heuristics, many earlier studies relied upon indirect or aggregated data, or an analysis of the number of winners given particular draw results, as reported by Wang et al. (2016). Reference Farrell, Hartley, Lanot and WalkerFarrell, Hartley, Lanot and Walker (2000) based their study on several months of aggregation of weekly ticket sales for the online game. At the time of publication, they claimed that only one lottery in Switzerland and one in Canada provide more data than just level of sales, winning numbers and the number of winners in each prize pool. Later researchers, as also reported by Wang et al. (2016) examined the overall popularity of individual numbers or combinations. For example, Reference Lien and YuanLien and Yuan (2015) gathered data directly from the Taobao (China) Lottery website over 15 rounds, observing the volume of tickets sold on online under each number combination over a period of six weeks. The data consists of over 1.6 million lottery tickets and their corresponding number combinations purchased by over 28,000 players. Ding (2011) collected data from the Chinese Online Lottery Game that includes the five winning numbers, the final bet frequency of each number, the total bet in each draw and so forth. Our research is based upon 800 million manually selected numbers by lottery participants in Israel.
1.2 The rationale for participation
The chances of winning a typical ‘6/49’ lotto game are approximately one in fourteen million. Why, given the huge odds against winning, do people risk their hard earned money to pursue the elusive jackpot? Part of the popularity of lotteries is attributable to the low cost opportunity they offer of winning a very large reward (Reference Griffiths and WoodGriffiths & Wood, 2001). Without the huge jackpot, very few people would play (Reference Shapira and VeneziaShapira & Venezia, 1992). In fact, both a large number of winning opportunities and a large grand prize are generally accepted as the optimum lottery prize format (Reference Shapira and VeneziaShapira & Venezia 1992; Reference DouglasDouglas 1995).
Stewart (1996), a UK mathematician, calls lottery-type games a “tribute to public innumeracy”. Probabilities of winning something in the National Lottery are fairly high in comparison with other gambling activities, although the chances of winning the jackpot are very small (Reference Griffiths and WoodGriffiths & Wood, 2001). It is therefore likely that the ordinary ‘social gambler’ does not think about the actual probability of winning but relies on heuristic strategies for handling the available information (Reference GriffithsGriffiths, 1995, p. 204).
For those choosing to play, the amount that could be won is a stronger attractor than the small probability of winning a large prize is a repellant. The general finding is that the greater the jackpot, the more people will gamble. More lottery tickets are sold in the UK on ‘rollover’ weeks because the potential jackpot is very large (Reference GriffithsGriffiths, 1997).
1.3 Examples of heuristics for choosing numbers
Much research attention has been devoted to the use of the “gambler’s fallacy” and “hot hand fallacy” heuristics in the selection of lottery numbers. In the former, players consciously avoid choosing the numbers selected as winning numbers in previous draws. In the latter, players intentionally select previous winning numbers. In both cases, players are under the mistaken assumption that subsequent draws are statistical events dependent upon prior ones (Reference Clotfelter and CookClotfelter & Cook, 1991, 1993; Reference TerrellTerrel, 1994; Reference PapachristouPapachristou, 2004; Reference Jørgensen, Suetens and TyranJørgensen et al., 2011).
According to the representativeness heuristic, sequences of numbers with repeating digits (4, 14, 24…) or sequences with consecutive numbers are perceived to be less random and hence tend to be avoided. Based on the representativeness heuristic, the sequence 4, 5, 6, 7, 8, 9 would be played less frequently because these numbers appear to be less random. Holtgraves and Skeel’s (1992) results suggest that people will tend to overplay numbers without repeating digits and underplay some (but not all) numbers with repeating digits. When presented with a choice of two lottery tickets, one with a random-looking number sequence and another with a patterned sequence, Reference Krawczyk and RachubikKrawczyk and Rachubik (2019) demonstrated that 70% prefer the random-looking sequence. Moreover, they showed that even in the face of a small cash incentive to exchange one ticket for the other, 85% preferred to retain their random-looking ticket.
The preference for specific numbers has been demonstrated in lotteries throughout the world, including Austria (Hauser-Rethaller & König, 2002), Germany (Reference HenzeHenze, 1997), France (Reference Roger and BroihanneRoger & Broihanne, 2007), Great Britain (Reference WalkerWalker, 1998; Reference Ayton and ReimersAyton et al., 2015) and The Netherlands (Reference Wang, Potter van Loon, van den Assem and van DolderWang et al., 2016). Players often choose “lucky numbers”, such as dates of birth, favorite numbers (e.g., 3, 7 or their multiples), zip codes or prime numbers (Reference Wang, Potter van Loon, van den Assem and van DolderWang et al., 2016). Geometric patterns also often play a role in the applied strategies of choice. A preference for numbers located in the middle of the lottery ticket has also been demonstrated, while those on the edge or close to each other are avoided (i.e., “edge aversion” and “proximity aversion”, respectively). In their choices, players also tend to choose symmetric and “aesthetic” forms and patterns, often looking at the whole range of available numbers. Based on a misperception of “chance”, in the 6/45 game, the six numbers are usually spread across the entire 1 to 45 range (Reference Wang, Potter van Loon, van den Assem and van DolderWang et al., 2016; Reference Ayton and ReimersAyton et al., 2015).
Wang et al. (2016) mapped a variety of determinants in the context of two different lottery games: The Dutch Lotto in which people chose six numbers between 1 and 45; and a lottery game organized by a large casino company in the Netherlands, where people chose four numbers between 0 and 36. They noted that “their results are surprisingly similar across the two games” and similar to the preferences expressed above. The most popular number in both lottery games is 7, chosen 4.19% of the time, closely followed by 8 (4.05%).
Cultural and social backgrounds influence preference for, or avoidance of, specific numbers, and even influence market prices. In Chinese culture, as noted Wang et al. (2016), the number eight is considered lucky, while the number four is considered unlucky. This set of preferences manifests itself in the pricing of vehicle license plate numbers at public auctions in Hong Kong, with numbers ending with the digit four being sold at relatively low prices, and numbers ending with the digit eight being sold at relatively high prices (Reference Woo and KwokWoo & Kwok, 1994; Reference Woo, Horowitz, Luk and LaiWoo et al., 2008; Reference Chong and DuChong & Du, 2008; Reference Ng, Chong and DuNg, Chong & Du, 2010). These Chinese cultural preferences also manifest themselves in the housing market, where the final digit of the address influences the sale price of the home. This phenomenon is observed in China (Reference Shum, Sun and YeShum, Sun & Ye, 2014), Hong Kong (Reference Chau, Ma and HoChau,Ma & Ho, 2001) and Singapore (Reference Agarwal, He, Liu, Png, Sing and WongAgarwal et al., 2014), where Chinese culture is predominant. Perhaps more surprisingly, this phenomenon was also observed in farther flung Chinese diasporas in New Zealand (Reference Bourassa and PengBourassa & Peng, 1999) and western Canada (Reference Fortin, Hill and HuangFortin, Hill & Huang, 2014).
1.4 Conscious selection
Among many gamblers, the number selection process is a source of anxiety.
One of the advantages lotteries have over other forms of gambling is that players may pick exactly the same numbers each week, thereby saving themselves the discomfort associated with number selection. In the UK, a newspaper survey reported that 67% of people choose the same numbers each week (Reference CrosbieCrosbie, 1996). Of this figure, the survey reported that 30% chose their regular numbers after an initial random selection and 37% chose the same numbers each week based on birthday dates, house numbers, favorite numbers, etc.
Research has repeatedly shown, however, that even when presented with the opportunity to have the lottery’s random number generating algorithm select the numbers, people prefer numbers they pick themselves — a finding termed the “illusion of control” (Reference Langer and RothLanger, 1975; Reference Langer and RothLanger & Roth, 1975; Reference WortmanWortman, 1975; Reference Bar-Hillel and NeterBar-Hillel & Neter, 1996).
1.5 Paper structure
The next section begins with a description of the lotto game and its rules, and continues with a detailed inventory of the data that served as the foundation for this research. Next, we present the methodology and findings. Some of these findings corroborate extant research; others are novel. The third and final section summarizes the findings, provides conclusions and offers directions for further research.
2 Israel’s Lotto
2.1 The game and the data
Mifal haPayis (MhP), Israel’s national lottery, offers a number of state sanctioned gambling opportunities including various scratch card and drawing games. According to their annual report, 64% of the lottery’s revenue is awarded as prizes in the various games, 14% covers overhead and sales incentives to agents, while the remaining 22% is earmarked for public benefit (Pais, 2018). With two nationally televised weekly drawings, Tuesday and Saturday nights, “Lotto” is the flagship MhP game. Participants choose six numbers from a table consisting of numbers 1–37 (the larger tables on the left side of the form), along with an additional power number 1–7 (the smaller of the tables to the right of the vertical red line on the form). Lotto forms consist of 14 tables. Each completed table is a “guess”. See sample form in Figure 1. The checkbox in the bottom right corner of the form, “lottomat”, allows the player to select 10 or 12 or 14 computer-generated guesses. Players preferring to complete the form manually, partially or fully, have more flexibility regarding the number of guesses submitted.
Sample MhP lotto form.
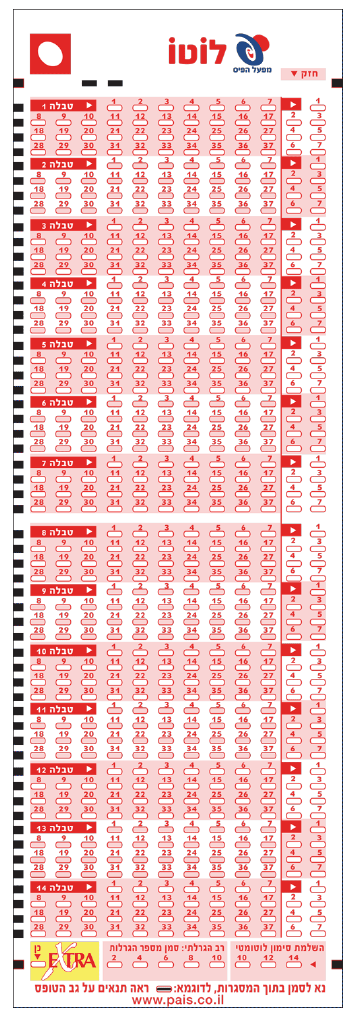
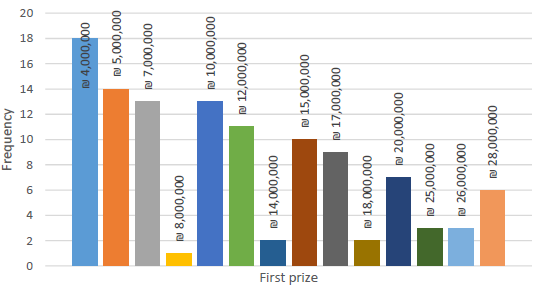
Every submitted form must contain a minimum of two completed tables or guesses. After selecting their numbers, or checking the “lottomat” option, players submit their forms to the lottery booth attendant, who in turn scans them on a designated machine and collects payments. Upon scanning, guesses are uploaded to the MhP computers. It is during the scanning process that the random numbers are generated and printed on the form, if the player chooses the “lottomat” option. Each guess costs 3 NIS (1 NIS ∼ $0.30 US). A fully completed form contains 14 guesses costs 42 NIS. The grand prize, awarded for correctly guessing all six numbers and the additional power number, ranges from a minimum of 4 million NIS to a maximum of 28 million NIS. With “rollover”, the grand prize continues to increase until the maximum award is reached. Figure 2 details the distribution of the advertised grand prize. Based on the publicly available data on the MhP web site, rollover is very common. Out of the 118 drawings held in 2018, the grand prize was awarded a mere 16 times. More than 85% of all drawings resulted in a rollover. Of the 16 times the grand prize was awarded, 11 times there was a sole winner, four times the prize was split by two winners and one time the prize was split by three winners. Farrell et al. (2000) found a great range in grand prize payouts versus rollovers, with a mere 19 rollovers out of 119 draws in the UK and 17 consecutive rollovers in a US powerball game.
Distribution of sums of advertised grand prizes in 118 drawings held in 2018.
MhP also offers a “double lotto” option, where participants pay double the price per guess and prize awards are doubled accordingly. Lesser prizes are awarded for correctly guessing three or more of the six winning numbers. As this research addresses human preferences in number selection, computer-generated “lottomat” data, assumed to be uniformly distributed, was excluded from the analysis.
The data set consisted of the manual guesses from the 118 drawings held in 2018. In addition to the two regularly scheduled weekly drawings, additional drawings are held for special occasions, such as national holidays. According to MhP, manual guesses constitute about 50% of all guesses. The figure reported for the Multi-State Lottery Association in the US is 30% (MUSL, 2003). Over the course of 2018, the minimum number of manual guesses in a drawing was roughly 500,000, while the maximum numbers was nearly 2 million. The data set consists of nearly 115 million guesses, or manually chosen number sequences — the aggregate number of guesses from all 118 drawings. As each guess consists of seven individual numbers, our data set is comprised of 805 million manual selections.
It should be noted that six non-repeating numbers for each guess are chosen from the 1–37 table, while the guess’s seventh number is selected from the smaller 1–7 power table. Unfortunately, the data set lacked unique lotto form numbers, so it is unclear how many forms or unique participants these guesses represent. This precluded us from analyzing lotto participant behavior on a person-by-person basis.Footnote 1
2.2 Number preferences
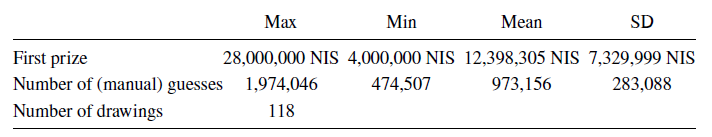
Consistent with prior lottery number selection research, the distribution of the frequency of the manually selected numbers in our data was far from uniform. Reference Cook and ClotfelterCook and Clotfelter (1993) called this phenomenon “conscious selection”. In order to sidestep further distinctions between conscious and subconscious selection, we use the more inclusive term manual selection in this paper. The non-uniform distribution of the manually selected numbers held true for numbers 1–37 and power numbers 1–7. Under fully random conditions, each number 1–37 would be chosen (1/37=) 2.7% of the time, while each power 1–7 number would be chosen (1/7=) 14.3% of the time. Without exception, 7 was the most frequently chosen number in every one of the 118 drawings we analyzed. Similarly, 37 was the most infrequently chosen number in all of the drawings. Among power numbers, 4 and 5 were the most frequently chosen numbers, while 1 was consistently the least frequently chosen number. See Figures 3 and 4.
Maximum and minimum frequencies of numbers manually selected by Lotto participants over 118 draws
Maximum and minimum frequencies of manually selected power numbers over 118 draws

2.3 Participation rates
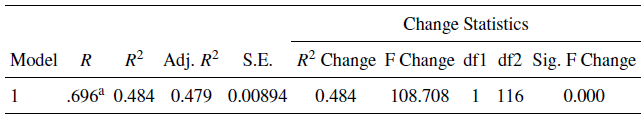
Not surprisingly, the number of guesses was significantly correlated with the size of the grand prize. See Figure 5 and Table 2. These empirical findings are consistent with those of Garrett and Sobel’s (2004) analysis of 135 lotto games in the US, Beenstock and Haitovsky’s (2001) Israeli study, and the theoretical models of Peel (2010) and Reference Clotfelter and CookClotfelter and Cook (1993). Although MhP provided us with no record of unique individual participants, it may be assumed that this increase in the number of guesses is attributable to both more guesses on the part of regular participants and the participation of additional periodic participants due to the attractiveness of the larger prize. In their study of the Nigerian lottery, Otekunrin et al. (2021) were able to distinguish between guesses and unique players by positioning data collectors at each of the booths to proposition the players to reveal their number selections. Lotto guesses in Israel may be submitted at any one of 2400 officially sanctioned points of sale throughout the country, but the Nigerian data collection model was not an option. As information regarding unique players was not made available to us, it is also unclear if the ratio of manual to automatic guesses changes as prize size increases. It seems reasonable that the periodic players attracted by the large prize are more aware of the concept of “expected returns”, even if they are unfamiliar with its formal statistical definition. Similarly, we would assume that these periodic players are less likely to have superstitions about a particular set of numbers than the “hardcore” players, and would be more likely to choose the “lottomat” option on the form. The decision to manually select numbers, however, stems not only from a personal preference for certain meaningful numbers, or the “illusion of control”, but also because of the flexibility it affords the participant in terms of the number of guesses submitted. Differences between regular and periodic players will be addressed later in the paper.
Number of manual lotto guesses submitted as a function of advertised size of grand prize.
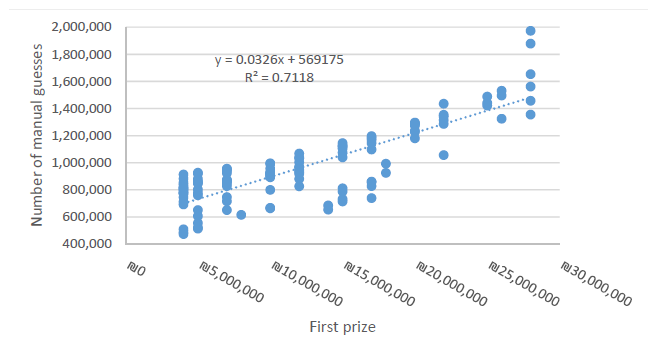
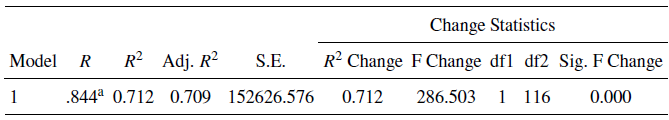
a. Predictors: (Constant), First prize
2.4 Explaining the preferences
Wang et al. (2016) and others have shown that number preferences of lottery participants are not uniformly distributed. Numerous explanations have been offered for deviations from uniformity. Baker and McHale (2011) suggest a hierarchy. “Lucky” numbers, such as the number 7 in many cultures, are generally selected first. These are followed by “easy to remember” numbers, which are often numbers of personal significance, like birthdays and anniversaries. Husemann-Kopetzky and Kocher (2016) identify number preferences among supporters of sports’ teams with numbers in club name, such as the San Francisco 49ers of US football and Schalke04 and BVB09, both of the German national soccer league. Another principle guiding number selection identified by Baker and McHale is number combinations. This is supported by Simon (1999), who suggests that number selection is governed by the pattern created on the form by the aggregate of the numbers selected. (An analysis of the geometric patterns formed by blackened numbers on the lotto form is beyond the scope of the current research.) In their analysis of the UK lottery, Farrell et al. (2000) used the personally significant date concept to explain the unpopularity of numbers over 31. They found notable exceptions among numbers 1, 21, 26 (less popular than would be expected) and 33 (more popular than would be expected, as it cannot represent a date or month. In a study of the French lotto, Reference Roger and BroihanneRoger and Broihanne (2007) identified 7, 12 and 13 as consistently popular numbers, while 32, 39, 40 and 41 were found to be consistently unpopular.
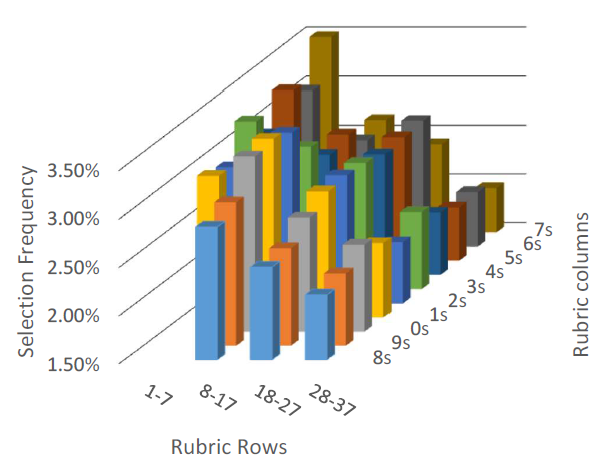
Another explanation for the non-uniformity of the number choices is the attractiveness of the location of the number within the form. In his research on “choices from identical options”, Christenfeld (1995) uses location, or position, to explain the preferences for items from supermarket shelves and particular stalls in public toilets. Bar-Hillel (2015) elaborates and identifies different position effects in different situations, with beginning and ending items preferred on restaurant menus, while centrally located items are preferred from supermarket shelves. Certain regions of the rubric are more or less attractive, as is clearly demonstrated in Figure 6, with numbers 1–7 (the first row of the lotto form) being chosen frequently, and the numbers on the last row of the form (28–37) being chosen infrequently. Out of 118 drawings, no number in the first row ever drops below expected ”average” frequency (1/37=2.7%), and no number in the last row ever exceeds the average. The unpopularity of the last row in the table may also be attributable to the yes/no selection method. Rather than preselecting a set of 6 numbers and filling them in on the form, lotto participants may visually scan the numbers on the form and make a yes or no decision beginning at number 1, progressing to 2, and so on. As the player advances to the right and downward on the table, more of the 6 required numbers have already been selected. By the time the bottom row is reached, a full set of 6 numbers may already have been selected. The notion of the yes/no selection method is supported by the decreasing average frequency of numbers based on their vertical position in the table. The average frequency of selection of a number in the first row is 3.13%, 2.95% in the second row; 2.68% in the third; and 2.17% in the fourth and bottom row. This finding, of decreasing number popularity as a function of row’s position on the lotto form, is consistent with Wang et al’s (2016) finding in an empirical analysis of the Dutch lotto. However, in Nigerian lotteries, both the online and paper form varieties, the highest number, 90, is the most frequently selected number, despite its location in the right most position of the form’s bottom line (Reference Otekunrin, Folorunso and AlawodeOtekunrin et al., 2021). Regardless of the cause of the lack of uniformity in the frequency of number selection, the evidence of (common) personal preference is robust. Among power numbers as well, numbers located in the bottom row of the table, 6 and 7, are consistently unpopular. Comparisons of “hot” and “cold” regions in the regular (1–37) and power tables are made difficult though by their different layouts. Sequential numbers are adjacent horizontally in the full 1–37 table and vertically in the 1–7 power number table.
Topological representation of number selection frequency.
2.5 Exploring expected return and rational behavior
Given the expected negative returns of lotteries, Se´vigny and Ladoucer (2003) suggest that gamblers seem to switch off their rational belief during gambling and switch it on again after gambling. To the best of our knowledge though, no research to date has addressed how the distribution of selected numbers might change as a result of the rationality or irrationality of the act of participation in the lottery. Although larger prizes are nearly always associated with a higher expected return on the lotto investment, Reference Matheson and GroteMatheson and Grote (2004) have shown that this is not universally the case. We demonstrated earlier that the number of guesses, and likely the number of unique individual participants, increases as the size of the grand prize increases. Might it be that once the grand prize has reached a critical size, some threshold of rationality might be reached that propels “skeptics” to participate? And if “skeptics” decide to play the lottery when the expected value reaches a critical sum, do they exhibit less superstitions in their number selection? If so, it might be expected that the frequency of selection of “popular” numbers would decrease, while the frequency of selection of “unpopular” numbers would increase.
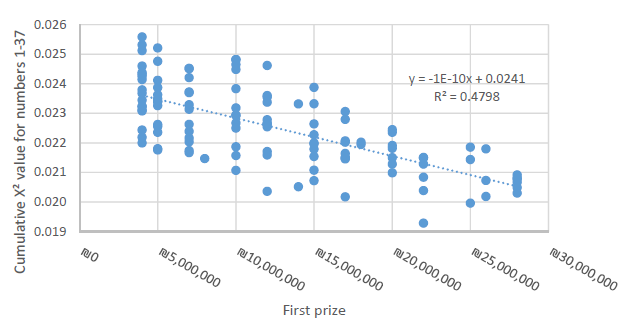
Figure 7 depicts the cumulative chi-squared value for numbers 1–37 as a function of the size of the grand prize. As the size of the grand prize increases, the frequency of numbers 1–37 are drawn toward the expected mean of 2.7%, with unpopular numbers becoming more frequently selected and popular numbers becoming less frequently selected. Table 3 illustrates the significance of the relationship.
Increasing uniformity of number selection “goodness of fit” as a function of prize size.
a. Predictors: (Constant), First prize
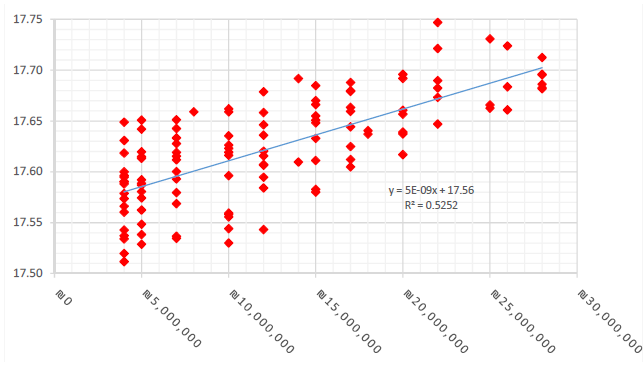
An analysis of the mean value of all manually selected numbers also yields interesting results. Under conditions of uniformly distributed numbers, the mean value would be 19, as MhP forms consist of numbers ranging from 1 to 37. A mean value below 19 suggests an aggregate preference for low numbers. Figure 8 depict overall means for manual guesses for each draw ranging from 17.5 to 17.75, indicating a universal preference for low numbers. “Universal” in this sense means that this phenomenon is present in every one of the 118 drawings, without exception. These means also significantly correlate with total number manual guesses and size of grand prize, lending further support to the notion that number selection is different and more uniform, as the number of lotto participants increases.
Mean of selected lotto numbers as a function of grand prize size.
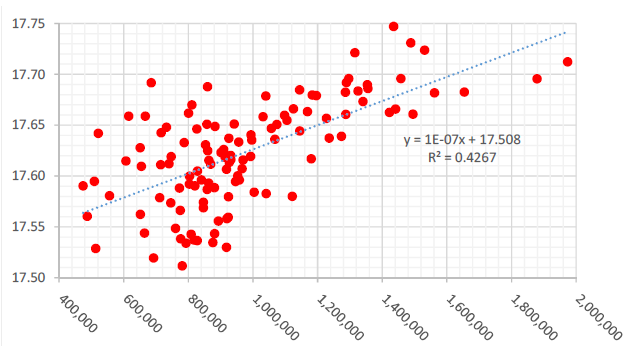
In section 2.4 we addressed number popularity by row. While the numbers in the top row of the lotto form are consistently most popular, on average, followed by the second, third and fourth rows sequentially, their popularity correlates with the total number of entered guesses. As the number of lotto guesses increases, numbers selected in the first row become significantly less popular. Numbers in the third and fourth rows become significantly more popular. Numbers in the second row of the form demonstrate consistency, and their popularity does not vary significantly as the number of guesses increases. Row popularity as a function of lotto guesses is depicted in Figure 9. Table 4 shows the significance of the correlations.
Mean of selected lotto numbers as a function of total guesses.
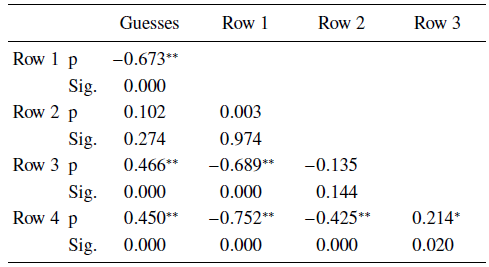
** Correlation is significant at the 0.01 level (2 tailed).
* Correlation is significant at the 0.05 level (2 tailed).
2.6 Anomalies and exceptions
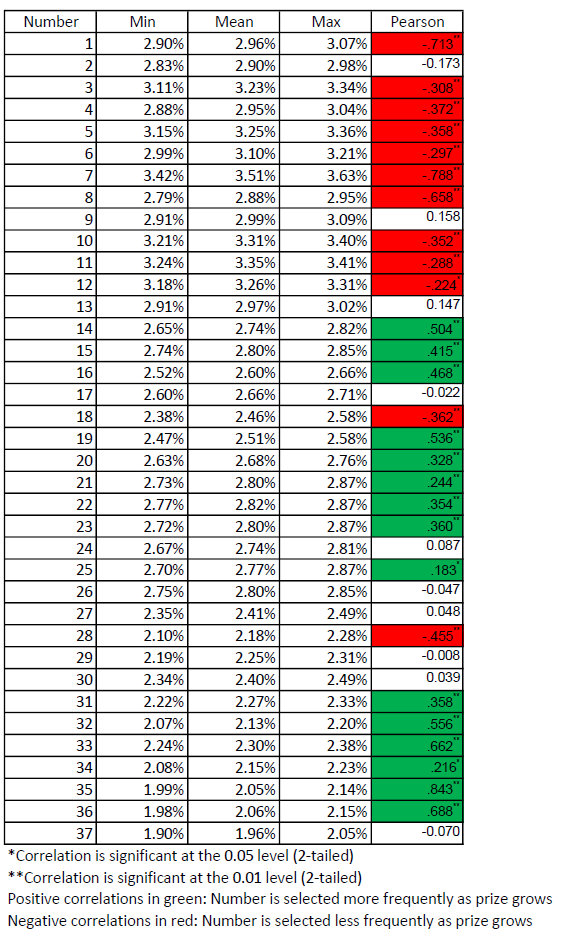
It has been demonstrated that the aggregate standard deviation of numbers 1–37 decreases as the size of the grand prize increases, thus indicating that the frequency of the numbers selected, collectively, are drawn toward the mean of 2.7%. A similar finding was shown on a row-by-row basis. May the same be said of each and every number on the lotto form? Do superstitions regarding all of the numbers diminish as the size of the prize and number of lotto participants increases, or do some deeply-seated superstitions persist?
The frequency of the selection of 27 out of 37 numbers on the lotto form correlate significantly with the size of the grand prize. As seen in table 5, the number 7 is universally popular. With its lowest frequency of selection at 3.42%, its popularity exceeds what would be expected under random conditions in every one of the 118 drawings. Consistent with the idea proposed earlier of the occasional lotto participant demonstrating fewer superstitions, number 7 correlates negatively, and significantly, with the size of the grand prize. The opposite effect, unpopular numbers becoming increasing popular, may be seen in the number 36.Footnote 2 Even at the height of its popularity, the number 36 is selected only 2.06%. Similar to number 7, but from below rather than above, the frequency of selection of 36 is significantly drawn toward the expected average of 2.7% as the grand prize grows.
Numbers 18 and 28, both located in the leftmost positions in their respective rows, demonstrate the opposite behavior. Both are consistently “unpopular” numbers, and become significantly less popular as the grand prize grows. What causes these numbers to exhibit this strange behavior? Is it their position on the left edge, or “edge aversion”, as identified by Attali and Bar-Hillel (2003)? Even so, edge aversion does not explain how seemingly more rational players (those participating in the lotto in increasing numbers as the expected returns increase) might be more edge averse.
3 Conclusions
In this research, we have both replicated findings in the extant literature and some new discoveries. The significance of the research rests largely on the enormous volume of empirical data upon which it is based. MhP provided us with 115 million manual guesses, each consisting of a string of six numbers plus an additional “power” number, for a total of 805 million manual selections(!), from 118 consecutive lottery draws. Subtle phenomena that might not be observable with smaller data sets become pronounced in a data set of this magnitude.
The non-uniformity of the distribution of numbers manually selected by lottery participants has been well documented. Our research confirms these earlier findings. Our research, though, goes beyond prior research by documenting the robustness of preferences for, or avoidance of, particular numbers. In every one of the 118 draws, the number 7 was universally the most popular.
Another phenomenon known to lottery researches is the correlation between prize size and participation rates. Our data set afforded us the opportunity to test this correlation for significance. Indeed, the number of lotto participants correlates positively and significantly with the size of the first prize. With each addition million NIS in grand prize award, 33,000 additional manual guesses are submitted. As the number of lottomat guesses was not made available to us, we were unable to determine the total number of additional guesses associated with each additional million NIS in prize money. If, however, this increase represents only 50% of total guesses, and the grand prize is awarded under 15% of the drawings, each additional 1 NIS in the advertised (though rarely awarded) grand prize generates a positive revenue flow for the state lottery!
Along with the identification of non-uniform number selection, we identified strong preferences based on the design of the lotto form. The MhP form contains four horizontal rows of numbers. The numbers in the top row are selected most frequently. This is followed, sequentially, by the second, third and fourth rows. The gap in “popularity” between the third and fourth rows is the largest of all of the popularity gaps. Lottery participants consistently “dislike” the numbers in the bottom row of the form.
Perhaps the most unique finding in the research is the consistency in the changes in the distribution of the selected numbers. As the size of the grand prize grows, the frequency of the numbers selected becomes more uniform. In general, unpopular numbers are drawn closer to their expected frequency- the frequency that would be expected were there no selection bias. Similarly, popular numbers become less popular as the prize grows. This finding was confirmed through a series of statistical tests. Although we were able to identify this phenomenon, our methods and the data available to us were unable to offer an explanation for it.
The literature has extensively addressed the question of why one would participate in a lottery if the expected returns are always negative. We have already demonstrated that the number of participant increases as the size of the prize grows, but might the very nature of these participants choosing to participate only when the prize reaches some critical size be different from the “hard-core” regulars regardless of the size of the prize? Our findings suggest that the periodic players, those participating only when large prizes are available, have fewer biases when selecting numbers. This indicates a need for a more nuanced approach for researching the rationality of the decision to participate in lottery drawings.
For decades decision-making literature has addressed “rational” and “irrational” as two discrete alternatives. Our findings, based on aggregate analysis rather than the observed behavior of individuals, indicate that the degree of rationality of human behavior might be measured on a continuous spectrum. In the case of lotto participation, as the size of the prize grows, it becomes less irrational to play, and in their number selection, the players participating when larger prizes are offered demonstrate increasingly rational behavior.


 Open access