

Chapter 5 examined how politicians’ control over bureaucrats influences which firms win public contracts and how this, in turn, affects the cost and quality of infrastructure. Chapter 6, I shift focus from who builds infrastructure to where infrastructure is placed. Specifically, I investigate how career control can shape the within-district allocation of new public infrastructure across communities.
As discussed in previous chapters, a key distinction in how public resources are distributed lies between programmatic and non-programmatic approaches. Programmatic distribution occurs when public resources are allocated according to pre-defined, public criteria.Footnote 1 In contrast, non-programmatic distribution is discretionary, with resources awarded to individuals or communities based on non-transparent, and often political, criteria.
A large literature has examined how politicians attempt to politicize the placement of public infrastructure, including roads, water wells, and electricity.Footnote 2 More recently, scholars have turned to explaining variation in the degree to which politicians can successfully target public goods to selected voters. One important constraint is local demography: specifically, the extent to which co-partisan (or opposition) voters live in distinct (segregated) versus mixed (non-segregated) communities. Low levels of partisan segregation (i.e. high levels of partisan heterogeneity) make it impossible for politicians to use local public goods to reward their electoral supporters, due to the non-exclusive nature of such goods.Footnote 3
Another, less studied factor that may constrain politicians is bureaucratic insulation. High levels of bureaucratic autonomy can result in bureaucrats constraining politicians’ attempts to target public resources to particular communities.Footnote 4 When bureaucrats have the autonomy to implement policies programmatically, they may be unwilling to engage in partisan favoritism on politicians’ behalf. Instead, they can apply objective criteria to allocate projects based on factors such as current infrastructure levels, local demand, and communities’ relative level of deprivation.
Chapter 6 assesses the degree to which infrastructure allocation within districts is politicized and whether bureaucrats can effectively resist political interference in Ghana. It is organized into three sections. Section 6.1 provides a comprehensive overview of the formal process through which local governments plan new infrastructure within districts. I then discuss prior research that explains why the actual allocation of projects can deviate from local governments’ plans. One important reason, consistent with the larger body of research highlighted above, is that politicians seek to direct resources to particular communities. Comments I received from bureaucrats during interviews support this conclusion, with many bureaucrats claiming that mayors frequently attempt to interfere with the allocation of projects to communities.
Section 6.2 presents observational data on project placement across districts in Ghana’s Central Region. Working in collaboration with local bureaucrats, I identify the precise locations of projects constructed between 2013 and 2016 and link these locations to historical election results. The regression analysis I conduct reveals a positive association between the incumbent party’s vote share in a community in the prior election and the number of projects they receive. Importantly, the results also highlight the role of community needs in allocation, with poorer communities more likely to receive projects than wealthier ones. This pattern suggests a potential tug-of-war: politicians try to reward co-partisan communities, while bureaucrats push for allocations based on need.
In Section 6.3, I complement this observational analysis with experimental evidence. Specifically, I conduct a survey experiment with local bureaucrats across eighty local governments, which pits community needs directly against community partisanship and randomizes the levels of each to assess the extent to which local bureaucrats perceive these factors as important in determining project allocation. The experimental results support the observational analysis from the Central region and suggest that villages that voted for the ruling party are more likely to receive projects than non-aligned communities. This remains true even when co-partisan communities are not among the most needy.
Taken together, these findings suggest that political criteria play a significant role in shaping the allocation of infrastructure within districts. Despite some responsiveness to community need, both interview and empirical evidence indicate that local bureaucrats often lack the autonomy to fully insulate project allocation from political interference. In summary, the career control tools that politicians can exert on bureaucrats can influence both which companies construct new infrastructure, and where this infrastructure gets placed.
6.1 Planning Local Public Goods Projects in Ghana
The primary task of local governments in Ghana is to construct new public infrastructure. Local governments present their plans for new infrastructure projects in reports called MTDP, which cover five-year periods. Local governments also write Annual Action Plans (AAPs) to aid the implementation of these medium-term plans. A final primary document that local governments produce is an annual budget. The projects and activities in these budgets are supposed to adhere to the AAP. To facilitate transparency in project planning and budget allocation, local governments must submit their plans to a national development planning body (the National Development Planning Commission) and their annual budgets to the Ministry of Finance.
Local governments are also evaluated each year using a tool known as the District Performance Assessment Tool (DPAT). An essential requirement within this evaluation is to check that local governments are implementing projects in line with their AAP. Indeed, one criterion within DPAT is that all projects in local governments’ annual budgets are from their AAP. Financial punishments can come as a result of low scores on the DPAT. As discussed in Chapter 3, the DACF is the primary funding source for local governments. In 2020, 10 percent of the DACF funds were based on DPAT performance.Footnote 5 In part, these rules have evolved to minimize mayors’ ability to interfere ex-post in formalized plans.
Despite these arrangements, one long-standing concern of observers of local politics is that the projects that local governments undertake are not guided by published plans.Footnote 6 At least three key reasons have been identified to explain why local governments fail to follow their multi-year plans: (i) low levels of citizen participation, (ii) land and chieftaincy disputes, and (iii) politicization.Footnote 7
The first reason for a mismatch between local governments’ written plans and their actions is low levels of citizen participation. Limited citizen participation results in low local knowledge of what projects are in the final plans, which grants local governments discretion in what to provide. Limited participation results partly from the fact that consultations are costly and local governments have limited funds to solicit the views of a wide cross-section of citizens across their districts. Local bureaucrats I interviewed complained that they did not have adequate funds to fuel cars or vans to travel to communities to discuss new projects. Transport problems are replicated at the level of local councilors, whose task it is to speak with citizens and communities and report their problems back during local government Assembly meetings.Footnote 8 Many councilors do not have the financial resources to solicit views from their constituents.Footnote 9 Limited public involvement and, consequently, lack of public knowledge gives local governments flexibility in what they eventually implement.
Land issues and chieftaincy disputes are the second reason for deviations from published plans. Traditional authorities serve as trustees to all customary land in Ghana – about 78 percent of total lands.Footnote 10 Accordingly, local governments must get the permission of chiefs to provide them with land to build new public infrastructure. In some cases, and particularly when there is a poor relationship between mayors and local chiefs, chiefs are unwilling to permit local governments to build.
Finally, the politicization of plans involves politicians rewarding some communities and punishing others depending on the community’s vote choice in the last election. Observers have noted that “political considerations were paramount in development decision making.”Footnote 11 Political considerations can lead to projects being implemented that are outside of the original plans or changing the locations of the planned projects to fulfill political aims. Political considerations can also lead to local governments starting projects but never completing them.Footnote 12
While there is a perception that local governments distribute projects according to partisan criteria, this has received limited empirical attention.Footnote 13 One recent study investigates the within-district distribution of capital projects across three local governments.Footnote 14 This study finds evidence that the NDC government was less likely to allocate projects to communities with a high share of Akans.Footnote 15 These results lend initial support to claims that communities that provide electoral support to the incumbent party are more likely to receive projects.Footnote 16
6.1.1 How to Manipulate Project Placements in Ghana
Bureaucrats I interviewed confirmed that local governments sometimes allocate projects to communities based on political criteria – typically, voting for the incumbent party. Interviewees asserted that this was predominantly the result of lobbying by mayors. Indeed, bureaucrats identified interference by mayors in the placement of local projects as a constant and significant problem to their work, and sometimes even the most significant challenge they encounter. One DCD said:
The biggest challenge we face is adherence to the AAP [Annual Action Plan]. Before the beginning of the year, we draw up the AAP, but during the year, the political head [mayor] visits a village, and they [the villagers] say, “We want this.”  our AAP is thrown off with new projects and new costs. (Interview with author, February 19, 2016)
An Internal Auditor made a similar comment, linking the actions of mayors to political considerations:
Every day there is pressure [on bureaucrats] because of the politician. You have to amend the plan [Annual Action Plan]. You wasted your time and energy; you bounded it [the plan], but when the chief [mayor] makes utterances, they will take away the project. At the end of the day, it’s politics. The politician will divert it to a different community. (Interview with author, February 4, 2016)
Through these candid conversations with bureaucrats, I also learned how mayors can tilt projects toward certain, typically co-partisan, communities. Bureaucrats noted three main processes.
First, the allocation of projects to co-partisan communities can be built into development plans from the start. For example, local governments can hold more community meetings in co-partisan communities within the district. Lists of projects will then be steered toward these communities. Potential projects are also brought to the attention of the mayor and district planning unit via local councilors. The success of councilors’ lobbying attempts can vary by their perceived partisanship. Although local councilors are elected in non-partisan elections, their partisanship is typically common knowledge because councilors are often active party members within local party branches. Mayors may be more inclined to listen to councilors who represent co-partisan EA within their district.
A second approach to favoring specific communities is to change the site of a project after the medium-term and annual plans have been published. This is a subtler way of favoring co-partisan communities compared to planning a disproportionate number of projects in co-partisan communities. Residents of EA who lose projects may not be told of the change in plans. Many bureaucrats said that it was common for project locations to change between project planning and implementation. One planning officer noted:
The DCE [mayor] can change the location. First, we decide on community A, and he can take it to community B. FOAT [annual compliance monitoring]Footnote 17 doesn’t have a problem with that  We review the plan every quarter, and we will provide some documentary evidence for why we had to change locations. We put it in the minutes, and definitely, we wouldn’t say it was the chief executive [mayor]. We give justification. The motivation for changing location is political: in the last elections these people didn’t vote for us. (Interview with author, February 19, 2016)
Third, new infrastructure can be built in co-partisan communities even when this project is not part of the published plans. In general, bureaucrats stated that this is quite rare because local governments are required to stick to their plans. As noted above, not doing so can have financial repercussions because the DPAT assessment requires that “at least 90% of activities implemented [during a year] are from the approved Annual Action Plan.”Footnote 18 Bureaucrats said that this formal requirement helped them to limit the extent to which new, generally political, projects gained traction. However, one planning officer I interviewed asserted that if a project outside the plan was what the mayor wanted, there was little bureaucrats could do to push back. He said:
When the political head [mayor] wants something to be done, and it’s not in the plan, by all means it will be done. We just have to make sure when we do a review of the plan that we include it. It’s not fine. Once we have drawn a plan we should be able to follow through the plan. (Interview with author, March 2, 2016)
While the data I collected from interviews are very informative and suggest that mayors have significant discretion in determining where new projects are located within districts, it remains challenging to ascertain whether politicization is widespread or rare. To determine how common it is, I next turn to quantitative data on project placements from across districts in the Central region.
6.2 Evidence of Favoritism in the Awarding of Projects
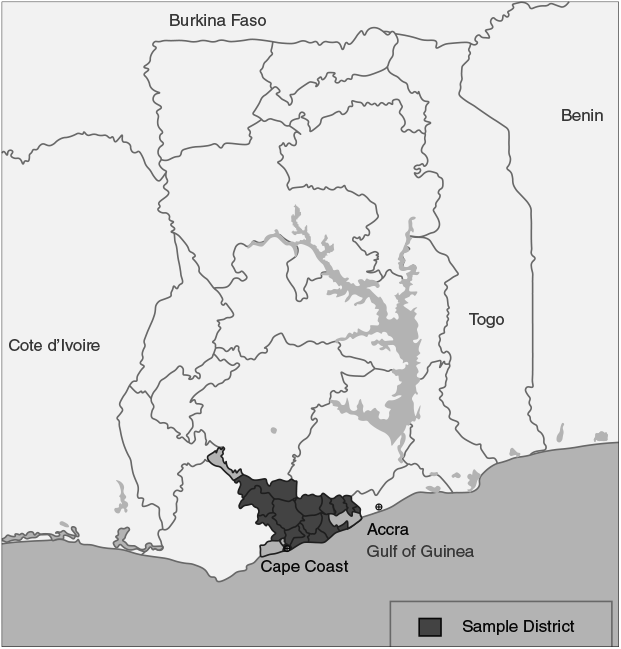
As discussed in Chapter 5, I compiled an original dataset of infrastructure projects undertaken by sampled local governments. In Chapter 6, I only analyze projects conducted by the fifteen local governments within the Central region that are in the sample (see Figure 6.1). I restrict the sample in this way because of the difficulty in obtaining reliable information on the exact placement of public goods projects within a district. The analysis also relies on obtaining localized census information and election results at the polling station level.
Map of sampled local governments in the Central region
Note: The map displays the boundaries of the country’s sixteen regions. I display the boundaries of each district in the Central region. Sampled districts are shaded.
Working closely with local bureaucrats, primarily planning officers, I assigned projects to specific communities. This process was particularly important in cases where party supporters and non-supporters lived in separate communities within the same town or village. In most cases, published documents would include the name of the town or village, but not the exact location.
The units that I link projects to are EAs which are sub-district political units.Footnote 19 Each EA elects a (non-partisan) local councilor who serves on the local government’s political body. On average, districts in the Central region have twenty-nine EAs.Footnote 20 Electoral areas have an average population of roughly 2,000 adults.Footnote 21
An advantage of focusing the analysis on the Central region is that the region provides a hard test of the theory that incumbent mayors will favor co-partisan communities. Ghana’s Central region lies on the southern coast. At the time of the study, there were twenty-two districts in the region, nine of which are coastal (see Figure 6.1).Footnote 22 The region is ethnically relatively homogenous: 82 percent of residents are Akans, most of whom are Fantes – an Akan sub-group. Unlike other Akan sub-groups, the Fante population is not politically aligned. Instead, they switch their allegiance between the two major parties.Footnote 23 Since the 1992 elections, the NDC has obtained the majority of Presidential votes in the Central region five times (in 1992, 1996, 2008, 2012, and 2024), and the NPP has also obtained a majority four times (in 2000, 2004, 2016, and 2020). High levels of competition are also seen in parliamentary races.
High levels of electoral competition in the Central region make it a hard case to test the hypothesis of co-partisan favoritism because in a highly competitive context, politicians may target swing voters with public goods, rather than reward incumbent party supporters. This suggests that if evidence of co-partisan favoritism is found in the Central region, it is likely to also occur in other regions of Ghana.
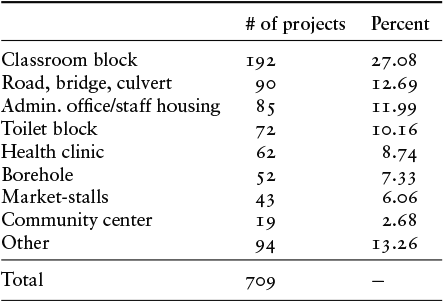
Within the fifteen districts I study, 709 projects were started during the term that I consider (see Table 6.1). The most common project was the construction of a school classroom block/s (27%). The next most common category of projects was the construction roads, bridges, and culverts (13%), followed by administrative office buildings or accommodation for local bureaucrats (12%). Other projects include toilet blocks (11.2 %), health clinics (7.7%), market stalls (4.3%), and community centers (2.7%).
| # of projects | Percent | |
|---|---|---|
| Classroom block | 192 | 27.08 |
| Road, bridge, culvert | 90 | 12.69 |
| Admin. office/staff housing | 85 | 11.99 |
| Toilet block | 72 | 10.16 |
| Health clinic | 62 | 8.74 |
| Borehole | 52 | 7.33 |
| Market-stalls | 43 | 6.06 |
| Community center | 19 | 2.68 |
| Other | 94 | 13.26 |
| Total | 709 |  |
Note: Projects in the “Other” category include the construction of abattoirs, police stations, libraries, school dining rooms, as well as electricity and sanitation projects. Individually these project categories account for less than two percent of total projects. Project dates correspond to when the project commenced.
6.2.1 Public Goods Projects per Electoral Area
Using these data, I construct two dependent variables. The first is a binary variable that equals 1 when an EA received a positive number of projects. Half of the EAs received one or more projects, while the remaining did not receive any. The second variable considers the total number of projects allocated to an EA. Here, there is significant variation, ranging from 0 to 16. On average, most EAs received 1.1 projects (with a standard deviation of 1.73). Because this is a count variable, I model the outcome using a negative binomial distribution.Footnote 24 The regressions include district fixed effects because my focus is on how projects are distributed within districts. The unit of analysis is the EA.
In calculating both outcomes, I exclude projects related to refurbishing local government offices and accommodation for local government bureaucrats or the mayor. I do so for two reasons. First, politicians and bureaucrats have no discretion over where to place these projects. Instead, they are located next to local government offices. Second, these projects do not benefit citizens.
6.2.2 Explanatory Variables
The primary explanatory variable in the analysis is the ruling party’s vote share in the EA. During the term I consider (2013–16), the NDC was the ruling party. If mayors did reward party supporters with projects, we expect that communities in EAs that voted strongly for the NDC in the last election will receive more projects compared to communities that supported the opposition party. To measure NDC support, I aggregate the presidential election results for polling stations from the December 2012 election. Within the study EAs, this variable ranged from 10% to 94%, with an average of 53%. Electoral results are first announced across individual polling stations. It is typical for politicians and local party officials to know which polling stations voted in favor of the party.
A second key explanatory variable is whether the Member of Parliament or the mayor hails from or has a house in the EA. This follows from empirical research that politicians disproportionately reward towns and districts they hail from.Footnote 25 The dummy variables Mayor home and MP home take the value of one when these political figureheads come from the EA.
An important rival hypothesis is that projects are allocated on the basis of need. Need may relate to the number of people who stand to gain from a project. I use the population of the EA to measure this factor. There is significant variation in EA population, with a maximum of 16,801 people and a minimum of 134 people. I log transform this variable as it is right-skewed.
Need may also relate to the relative wealth of the community. I measure relative deprivation using national census data (collected in 2010) and calculate the share of homes made from mud or earth within an EA. Earth walls are a visible measure of deprivation. The visibility of low incomes is important because local politicians and bureaucrats typically do not have access to detailed, within-district poverty statistics. They must, therefore, rely on visible proxies of deprivation, which they obtain during visits to communities. Because politicians do not operate with fine-grained information, I dichotomize this variable. Electoral areas are coded as deprived when over 70 percent of homes are made from mud, which corresponds to the 3rd quartile of the distribution.Footnote 26
6.2.3 Results
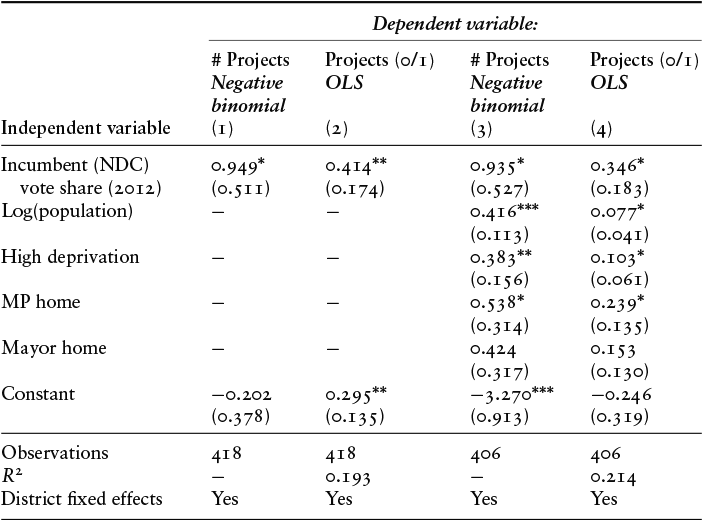
Table 6.2 displays the results. Columns (1) and (2) present the bivariate relationship between incumbent party vote share (NDC) and the number of projects and prediction of whether an EA receives a project, respectively. The coefficient on NDC vote share is positive and significant in both columns. The models in columns (3) and (4) introduce the control variables. The positive and significant relationship persists between NDC vote share and the two dependent variables in these analyses. The coefficients on NDC vote share in columns (3) and (4) are also substantively large. Considering the number of projects (column 3), moving from one standard deviation below to one standard deviation above the mean NDC vote share increases the number of projects an EA receives by roughly one-third of a project. Alternatively, the results in column 4 show that going from one standard deviation below to above the mean for NDC vote share moves the dependent variable from 0.45 to 0.55 (a 22 percent increase).

Table 6.2 Long description
Table presenting results from four regression models analysing how political and demographic factors influence development project allocation. The main variable, incumbent vote share, shows a positive and statistically significant effect across all models. Additional variables include population, deprivation, and whether political representatives are from the area. Population and deprivation have positive significant effects, while MP home shows a positive effect and mayor home is not significant.
Note:
* p < 0.1; **p < 0.05; ***p < 0.01.
The coefficients on many of the control variables are also positive and significant. Importantly, the results show a positive association between both need measures and the dependent variables. For example, moving from a non-deprived to a deprived EA increases the number of projects by 0.46. The results also display a positive association between the EAs that include the MP’s home community and the number of projects. This suggests that MPs can interfere in the allocation of projects and can direct projects to their home communities. Conversely, I do not find a positive association between mayors’ home communities and the number of projects, which suggests that mayors do not push projects to their home communities.
The positive correlation between incumbent party vote share and projects indicates that local governments allocate projects to communities based, at least in part, on political criteria. This finding underscores the influence of political factors in the decision-making process of local governments. The results also demonstrate the significance of community need, indicating that political criteria are only one of the factors considered by politicians and bureaucrats when selecting communities to receive new local public goods.
While this analysis is informative as it is based on the actual allocation of real (rather than hypothetical) projects, it is not without limitations. One concern – shared with all observational analyses – is that a confounding variable may be missing from the regression equation. If this is the case, the positive relationship between NDC vote share and project allocations may be biased or spurious. Additionally, these data only provide evidence from one region of the country. This makes it unclear whether a similar pattern would be found in different regions. Finally, these data do not allow me to assess the effect of electoral competition on political targeting because there is little variation across districts in levels of competition: I classify eleven of the fifteen districts as electorally competitive. To overcome these challenges, I conducted a survey experiment in the full sample of districts, asking bureaucrats where they expect projects to be located and varying different attributes of potential locations.
6.3 Evidence from a Survey Experiment with Bureaucrats
I conducted a survey experiment with bureaucrats who hold senior positions in local governments to further investigate the influence of electoral partisanship on project allocation and assess the potential causal effect of this variable on project allocation. On average, respondents had worked in local government administration for sixteen years. I describe the sample of local bureaucrats who took part in the survey in detail in Chapter 1.
6.3.1 Experimental Design
The survey randomly assigned bureaucrats to one of four treatment conditions (see Table 6.3). The treatments consisted of audio vignettes. Each vignette entailed a conversation between two (hypothetical) bureaucrats discussing where to locate a new project. The project under consideration is constant across all treatment conditions, namely, constructing a three-unit classroom block for a primary school. In the conversation, I randomly varied the partisanship and poverty level of the village being described (see Table 6.3).
| Deprived | Not deprived | |
|---|---|---|
| Pro-incumbent (NDC) | Treatment 1 | Treatment 2 |
| Pro-opposition (NPP) | Treatment 3 | Treatment 4 |
To proxy for partisanship, the vignette noted whether the community “voted strongly in favor” of either the incumbent party (NDC – treatments 1 and 2) or opposition party (NPP – treatments 3 and 4) in the last election. To proxy for poverty, bureaucrats were told whether the village was among the “most deprived” in the local area.Footnote 27
The enumerators were blind to the treatment, and the respondents listened to the conversation with headphones. After hearing the conversation, the respondents were asked to rate the likelihood of the community receiving a project on a seven-point scale. They inputted their responses on a cell phone without disclosing them to the survey enumerator. These steps ensured the confidentiality of the treatment and responses, thereby reducing concerns of survey response bias and enhancing the credibility of the findings.
Results of the Survey Experiment with Bureaucrats
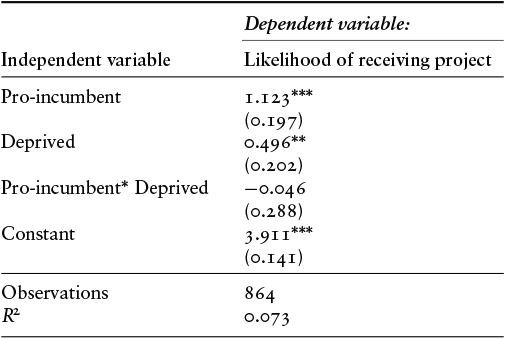
The results from the survey experiment show that bureaucrats perceive that communities that are aligned with the ruling party are more likely to receive projects than communities aligned with the major opposition party. First, I regress the outcome variable pooling the partisanship and deprivation treatments. Given the factorial design, I run the long regression, which includes the interaction term for the two treatments.Footnote 28 Table 6.4 presents the results.

Table 6.4 Long description
Table presenting regression results for a statistical model estimating the likelihood of receiving a project. The table reports coefficient estimates with standard errors shown in parentheses below each coefficient. Statistical significance is indicated using asterisks.
The dependent variable is labeled likelihood of receiving project. The model is based on 864 observations and reports an R squared value of 0.073.
The variable Pro incumbent has a positive coefficient of 1.123 with a standard error of 0.197 and is statistically significant at a high level, indicated by three asterisks.
The variable Deprived also has a positive coefficient of 0.496 with a standard error of 0.202 and is statistically significant, indicated by two asterisks.
An interaction term labeled Pro incumbent multiplied by Deprived has a coefficient of negative 0.046 with a standard error of 0.288. This coefficient is not statistically significant.
The constant term has a coefficient of 3.911 with a standard error of 0.141 and is statistically significant, indicated by three asterisks.
Note:
* p < 0.1; **p < 0.05; ***p < 0.01.
Table 6.4 shows that the treatment effects for the pro-incumbent and deprivation treatments are both positive and statistically significant. The average treatment effect for pro-incumbent communities is 1.1 on a 7-point scale.Footnote 29 The average treatment effect of deprivation is 0.50 on a 7-point scale. These results are consistent with the observational analysis and show that bureaucrats expect a community’s level of need and partisan status to influence the likelihood that it receives a local public goods project. Moreover, these results suggest that the relationship I identify in the observational analysis above is causal. Finally, comparing the size of the two treatment effects suggests that partisanship is more important than deprivation in explaining which communities receive new projects.
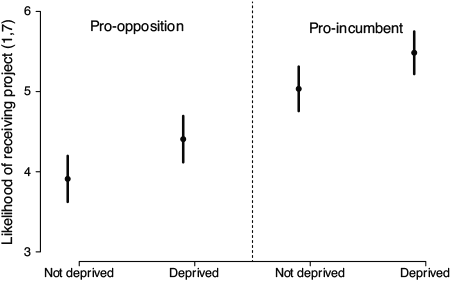
Figure 6.2 displays the mean of the outcome variable disaggregating across the four treatment conditions. Figure 6.2 again makes it clear that bureaucrats perceive partisanship to be more important than deprivation in determining projects. This is shown by the higher mean for villages that are pro-incumbent and not deprived (mean = 4.41) compared to communities that are pro-opposition and deprived (mean = 5.03).Footnote 30 Figure 6.2 also shows that the effect of deprivation is constant across a community’s partisan status: communities that are either pro-incumbent or pro-opposition are more likely to receive projects if the community is deprived than if they are not deprived.Footnote 31
The mean outcome response in each treatment condition
I next focus on the pro-incumbent treatment and consider whether bureaucrats who work in highly competitive districts or districts where the mayor is politically ambitious are more likely to expect partisan targeting. In this analysis, I again run the long regression and subset the data across four types of districts. I proxy for political ambition using a variable that indicates whether the mayor ran for the parliamentary primary in 2015. Figure 6.3 presents the ATE of the pro-incumbent treatment across the four types of districts.
The ATE for pro-incumbent communities in different types of districts
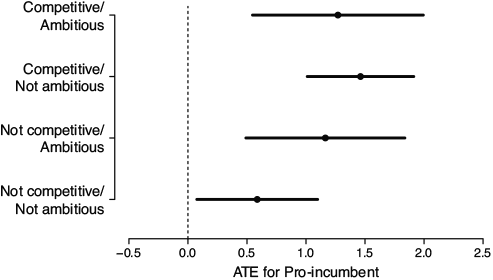
Figure 6.3 shows the ATE for pro-incumbent communities is positive and significant in every type of district. The results suggest that bureaucrats expect some level of partisan targeting in all kinds of districts. However, the results display important heterogeneity. Bureaucrats perceive targeting as less likely to occur in districts that are neither competitive nor where the mayor is not politically ambitious. Figure 6.3 shows that targeting is more likely when either of these conditions is true. These results also suggest no interactive effect: I do not find evidence that targeting is more likely in competitive districts and where the mayor has political ambition.
Overall, the results suggest that local bureaucrats believe that both need and partisanship affect where local public goods projects get placed. The communities that are most likely to receive projects are those that are relatively poorer and voted strongly for the incumbent party. Wealthier communities that voted for the opposition party are the least likely to receive new projects. The critical difference is between the two middle categories: bureaucrats perceive that political factors are more important than deprivation in determining allocation. Finally, contextual factors of the district matter. Bureaucrats working in electorally competitive districts are more likely to expect partisan targeting. The same is true when bureaucrats work under mayors who are politically ambitious.
6.4 Conclusion
The main task of local government in Ghana is to construct local public infrastructure for communities. In Chapter 6, I investigate the within-district allocation of these projects. Overall, the evidence suggests that while community needs influence where new projects get located – with more projects in more populous and poorer communities – so do political factors. The observational data from the Central region show that within districts, there is a positive correlation between the ruling party’s vote share and the number of projects allocated to communities. The results from a survey experiment with local bureaucrats across multiple regions also show that bureaucrats perceive community partisanship to influence the likelihood that a community receives a project strongly. The experiment also establishes a causal link between these two variables and demonstrates that bureaucrats expect partisanship to trump deprivation in determining project allocation. Importantly, this analysis also shows that electoral competition makes partisan targeting more, rather than less, likely.
The interviews I conducted with bureaucrats highlight how projects get allocated to co-partisan communities. These discussions make it clear that mayors are the main actors who drive partisan targeting. The methods I describe also show that bureaucrats must engage in deliberate actions for targeting to occur. For example, bureaucrats may have to justify why the location of a planned project changes between the planning and implementation stage or why a new project is built that was not part of the original budget. Bureaucrats express frustration in doing these activities – most want to allocate projects based on community need and follow the local government’s published plans. As with public procurement decisions, bureaucrats typically help mayors engage in partisan targeting because they know the leverage they can have over their careers. The results of Chapter 6 support the idea that mayors engage in non-programmatic distribution and confirm the theoretical prediction laid out in Chapter 2 that politicians are more likely to engage in such distribution in electorally competitive districts.


 Open access