


Introduction
The recent history of established democracies has been marked by intense political divides. Many countries have seen the rise of populism, which erupted onto the world stage with the election of Donald Trump and the Brexit referendum. This is commonly interpreted as the electoral expression of a new political conflict line, involving questions around cultural identity and the governance of the polity. Popular accounts suggest that the contours of the conflict – in both electoral and attitudinal terms – coincide with citizens’ level of education (Runciman Reference Runciman2016; Harris Reference Harris2018). On one side of the divide, Trump is widely mocked for saying he ‘love[s] the poorly educated’ (Runciman Reference Runciman2016). On the other side, pundits argue that, ‘what explains the idiocy of the liberal elite [is] their education’ (Bartholomew Reference Bartholomew2017).
Such commentaries tie in with an active line of research on the role of education in social and political life. Though education has long been a predictor of various political beliefs and behaviours (e.g., Converse Reference Converse, Converse and Campbell1972: 323–326), it has arguably become more relevant than ever before, especially in Western Europe. Some scholars have identified it as the source of a new societal cleavage (Bovens & Wille Reference Bovens and Wille2017: 40–61), as evidenced by its powerful role in explaining voting behaviour and political attitudes (Van de Werfhorst & De Graaf, Reference Van de Werfhorst and De Graaf2004; Hainmueller & Hiscox Reference Hainmueller and Hiscox2007; Hakhverdian et al. Reference Hakhverdian, Van Elsas, Van der Brug and Kuhn2013). Beyond this, education increasingly stratifies people's social networks (Blossfeld Reference Blossfeld2009; Huang et al. Reference Huang, Maassen van den Brink and Groot2009) and economic prospects (Wilkinson & Pickett Reference Wilkinson and Pickett2009: 103–117; Bol Reference Bol2013: 14).
Despite the many analyses of education and its political consequences, however, we do not know whether citizens’ level of education determines their influence on government policy. That is, is government policy more responsive to the preferences of higher educated citizens than to the preferences of low educated citizens? The hitherto lack of an answer to this question is a serious deficit in our understanding of contemporary politics, in large part because it forms an important part of the (new) political divides as described above. For one thing, the unequal influence of educational groups would be a major consequence of differences in political views and behaviours between low and highly educated citizens. This consequence is particularly important as it violates the norm of political equality, which is fundamental to democracy (Dahl Reference Dahl1989). Furthermore, unequal policy responsiveness could cement and deepen the divisions between educational groups, for example by causing increased resentment among those whose voice is silenced in the policy process. As such, it would be a cause of further divides. For both reasons, it is pertinent to consider the policy implications of education.
In this study, we address this deficit by analysing policy responsiveness in the Netherlands. The Netherlands is a fairly representative case for Western Europe more broadly, as judged by the conditions that likely determine the level of educational inequality in policy responsiveness. We hypothesize that highly educated citizens are represented better in terms of policy outcomes than low educated citizens, because the former participate in electoral politics more often (Lijphart Reference Lijphart1997; Gallego Reference Gallego2007; Marien et al. Reference Marien, Hooghe and Quintelier2010), hold political office more frequently (Bovens & Wille Reference Bovens and Wille2017: 114) and engage with interest groups more strongly than the latter (Jordan & Maloney Reference Jordan and Maloney2006; Schlozman et al. Reference Schlozman, Verba and Brady2012). Furthermore, we expect that unequal responsiveness is more pronounced on cultural issues (such as immigration) than on economic issues (such as taxation). This is based on the assumption that preference gaps between low and highly educated citizens are largest on the cultural dimension of political conflict (alluded to above).
To test these hypotheses, we apply the research design pioneered by Martin Gilens in his work on the United States (Gilens Reference Gilens2012), which provides direct measurements of public opinion and policy on a large number of salient issues. To this end, we have compiled an original dataset of public preferences and national government policy on 291 potential policy changes in the Netherlands, using questions from pre‐existing surveys that were conducted between 1979 and 2012. This dataset has several major advantages for our purposes, including the fact that it addresses the opinion‐policy link, which is ‘arguably the ultimate metric of representation’ (Caughey & Warshaw Reference Caughey and Warshaw2018: 250). As such, it provides unique leverage to explore educational inequalities in representation.
The analyses reveal that policy responsiveness is starkly unequal in the Netherlands. When educational groups disagree, the low and middle educated have no independent influence on policy. Contrary to our expectations, we find that education stratifies preferences and influence on both the cultural and economic dimensions of political competition. Based on these results, we conclude that policy making in the Netherlands is dominated by a highly educated minority. Our findings have major implications for the debates that dominate contemporary politics, as they help us understand both the direction of government policy and the backlash against it in Western Europe. They also raise normative issues, centred around the question of who should influence government policy, which will have to be confronted by all involved.
Framework
It is well established that education strongly influences a wide variety of social and economic outcomes. To give a few examples: on average, citizens with a master's degree earn more than twice as much as do those with the lowest level of education in OECD countries (Organization for Economic Cooperation and Development 2019). The average life expectancy among the former is 6 years higher than it is among the latter (Ross & Wu Reference Ross and Wu1995; Organization for Economic Cooperation and Development 2017). And educational qualifications strongly affect the composition of one's social network, including the education level of one's partner (Blossfeld Reference Blossfeld2009; Huang et al. Reference Huang, Maassen van den Brink and Groot2009). These examples make it clear that education lies at the root of an important societal cleavage in industrialised societies (Van de Werfhorst Reference Van de Werfhorst2015; Easterbrook et al. Reference Easterbrook, Kuppens and Manstead2016).
In their recent book Diploma Democracy, Bovens and Wille (Reference Bovens and Wille2017) argue that this educational divide also affects the political realm. In other words, education is a currency that not only buys many social goods but political goods as well. This is manifested in numerous political outcomes, including political knowledge, evaluations of government and descriptive representation, which are positively correlated with education.
Such political inequalities seem to extend to the important area of substantive representation (Pitkin Reference Pitkin1967: 112–143). Studies in various European countries show that party positions are more congruent with the views of higher educated citizens than the views of those with lower levels of education (Lesschaeve Reference Lesschaeve2016; Aaldering Reference Aaldering2017; Rosset & Stecker Reference Rosset and Stecker2019). However, despite the disproportionate presence of the higher educated throughout the political process, there is no direct evidence that highly educated citizens have a larger influence on government policy. This is the gap we aim to fill in this study.
Our main expectation is that policy responsiveness is biased in favour of higher education groups.Footnote 1 This is based on well‐documented skews in political participation. Here, it is helpful to think of various forms of political participation as being arranged in a pyramid, with less demanding activities placed at the bottom and more demanding activities at the top. As Bovens and Wille (Reference Bovens and Wille2017: 66–67) point out, the further we ascend the pyramid, the more participation is limited to highly educated citizens. The explanation for this is that, in general terms, ‘[e]ducation fosters activity through its effect on information, skills, values, resources, networks, and more’ (Verba Reference Verba2003: 668). As participation becomes more demanding, all of these factors become more vital. Below, we discuss three prominent forms of political participation at different levels of the pyramid, though this is not to say that other activities are unimportant for explaining policy representation.
Near the bottom of the participation pyramid is electoral participation. Perhaps the most obvious reason that policy representation might be biased in favour of highly educated citizens is that they vote more often during elections (Gallego Reference Gallego2007; Persson Reference Persson2015). As indicated above, voting is more weakly correlated with education than other political acts, but even here we find clear educational inequalities (Lijphart Reference Lijphart1997: 2–3; Armingeon & Schädel Reference Armingeon and Schädel2015; Bovens & Wille Reference Bovens and Wille2017: 71). Differences in turnout are relevant to the extent that voters have a larger say in the policy process than non‐voters. Research by Griffin and Newman (Reference Griffin and Newman2005) on the United States indicates that this is indeed the case. Americans voters are better represented in Congressional roll‐call votes than non‐voters, for several reasons: voters have more influence over who ends up in office, they communicate their preferences to politicians more clearly and they provide more incentives for politicians to act upon these preferences (Griffin & Newman Reference Griffin and Newman2005). Beyond voting, being a member of – or being active for – a political party is also much more common for highly educated than for lower educated citizens (Gallego Reference Gallego2007). In sum, then, education is positively correlated with electoral participation, and there are good reasons to expect this to affect policy representation.
Going further up the participation pyramid, a second reason why highly educated citizens might have a louder voice in the policy process than lower educated citizens is centred around interest groups.Footnote 2 Interest groups have long been viewed as a key institution in democratic societies, aggregating and mobilising citizen demands within the policy process (Truman Reference Truman1951; Schattschneider Reference Schattschneider1960). For that reason, biases in the membership and organisation of interest groups are likely to matter for policy representation. When it comes to educational groups, we can see clear manifestations of such biases. The most obvious manifestation is that higher educated citizens are more likely to be members of an interest group compared to middle‐ and low‐educated citizens (Jordan & Maloney Reference Jordan and Maloney2006). Furthermore, even within the pool of members, it is the higher educated who are the most active in interest groups (Bovens & Wille Reference Bovens and Wille2017: 97–103). Beyond membership, the trend of increasing professionalisation of civil society associations, including interest groups, is also relevant. This professionalisation has meant that the actions of interest groups are guided less by a broad group of members and more by a small group of full‐time employees. These employees are usually highly educated (Skocpol Reference Skocpol2003).
Third, at the very top of the pyramid, policy may be more responsive to high educational groups due to who holds political office, or what is often labelled descriptive representation. Descriptive representation refers to the personal identities and backgrounds of politicians in relation to the broader population (Pitkin Reference Pitkin1967: 60–91). A common hypothesis is that politicians’ backgrounds matter for their views and actions in the political system, above and beyond the party platforms on which they were elected. In previous years, this hypothesis has been tested – and supported – in studies that focus on politicians’ gender (Wängnerud Reference Wängnerud2009), race (Griffin Reference Griffin2014), previous occupation (Carnes & Lupu Reference Carnes and Lupu2015) and personal wealth (Griffin & Anewalt‐Remsburg Reference Griffin and Anewalt‐Remsburg2013).
The question here is whether descriptive representation can also account for educational gaps in policy representation. A working paper by Hakhverdian et al. (Reference Hakhverdian, Van Ditmars, De Lange and Schakel2019) suggests that it can. Using survey data among Dutch citizens and local representatives, the authors show that the preferences of highly educated citizens are best represented by highly educated politicians, and the preferences of low educated citizens are best represented by low educated politicians. An additional and crucial fact is that governments across advanced democracies are dominated by the higher educated (Best Reference Best2007; Bovens & Wille Reference Bovens and Wille2017: 111–121). In other words, lower educated citizens are descriptively underrepresented, which likely causes them to also be substantively underrepresented.
While all three forms of participation provide reasons to expect educational inequality in policy responsiveness, questions remain around all of them. When it comes to voting, there is little direct evidence that the preferences of voters align more closely with policy changes than the preferences of non‐voters in Western Europe. In addition, some studies suggest that more widespread voting by lower educated citizens would not substantially affect election outcomes, as their votes may not align with their policy views (Selb & Lachat Reference Selb and Lachat2009).Footnote 3 Interest groups are only relevant insofar as the composition of interest group membership influences their policy stances, and insofar interest groups are, on the whole, actually successful in changing the direction of government policies (Lowery Reference Lowery2013). And one uncertainty around descriptive representation is whether the attitudinal differences of low‐ and high‐educated politicians actually translate into differences in parliamentary behaviour.
Notwithstanding these caveats and question marks, we expect to see unequal policy responsiveness in the Netherlands. In other words, based on the aggregate evidence regarding political participation in the form of voting, interest group membership and holding political office, we expect that highly educated citizens have a clear advantage in the policy process over citizens with less formal education. Hence, our first and main hypothesis is as follows:
H1: Policy is more responsive to the preferences of highly educated citizens than to the preferences of lower educated citizens.
An implicit assumption behind this hypothesis is that different educational categories have different political preferences. If this is not the case, political actors could theoretically still be more responsive to one group than to another, but the same policies would be adopted either way. As a result, unequal responsiveness would lose much of its practical significance.Footnote 4
As mentioned at the outset of this paper, there is a well‐established literature which finds that education is robustly correlated with political attitudes on a range of issues (Scheepers et al. Reference Scheepers, Te Grotenhuis and Van der Slik2002; Van de Werfhorst & De Graaf Reference Van de Werfhorst and De Graaf2004; Hainmueller & Hiscox Reference Hainmueller and Hiscox2007; Hakhverdian et al. Reference Hakhverdian, Van Elsas, Van der Brug and Kuhn2013; Easterbrook et al. Reference Easterbrook, Kuppens and Manstead2016). Within this literature, there is disagreement over the nature of this association. Different authors point to different causal mechanisms, including the values that education imbues and the social network it provides, and some question whether education has a causal effect on political attitudes at all (Stubager Reference Stubager2008; Kuhn et al. Reference Kuhn, Lancee and Sarrasin2019). For our purposes, these discussions are not particularly important. The only thing we assume is that education is associated with political preferences in one way or another, and this association is uncontroversial.
One further nuance should be added, however. There are reasons to believe that the correlation between education and political attitudes is not constant across all political issues. Here, it is useful to bring in the oft‐made distinction between the economic and cultural dimensions of political competition in Western Europe (Kriesi et al. Reference Kriesi, Grande, Lachat, Dolezal, Bornschier and Frey2008; Van der Brug & Van Spanje Reference Van der Brug and Van Spanje2009). Roughly speaking, the economic dimension encompasses material issues such as redistribution, taxation and social policy, while the cultural dimension involves less‐material issues like immigration, international integration and crime.Footnote 5 A common argument is that education is mostly associated with cultural issues, with economic issues being anchored more by income and social class (Van de Werfhorst & De Graaf Reference Van de Werfhorst and De Graaf2004). In this view, what separates low‐ and high‐educated citizens is not so much a difference in material interests but a difference in values, which largely revolves around the governance of the polity and who one considers to be its legitimate members (Stubager Reference Stubager2008).Footnote 6 One might say that the growing political relevance of education is directly tied to the growing relevance of the cultural dimension (Kriesi et al. Reference Kriesi, Grande, Lachat, Dolezal, Bornschier and Frey2008: 237–266). Inglehart's post‐materialism thesis is just one version of this argument, albeit a very influential one (Inglehart Reference Inglehart1977).
Based on this line of reasoning, we expect that education mainly predicts attitudes on cultural issues, while there is a weaker correlation between education and attitudes on economic issues. In turn, this translates into larger inequalities in responsiveness on the cultural dimension than on the economic dimension. Our second hypothesis is therefore the following:
H2: Gaps in policy responsiveness between educational categories are larger on the cultural dimension than on the economic dimension of political attitudes.
Data
To explore the above‐mentioned hypotheses, we analyse public opinion and policy in the Netherlands. Below, we discuss how the Netherlands compares with the rest of Western Europe, to give an indication whether the results might generalise to this wider region.Footnote 7 Generalisation beyond this is potentially problematic since the dimensionality of political competition features prominently in our argument, and this dimensionality looks very different in many other regions.
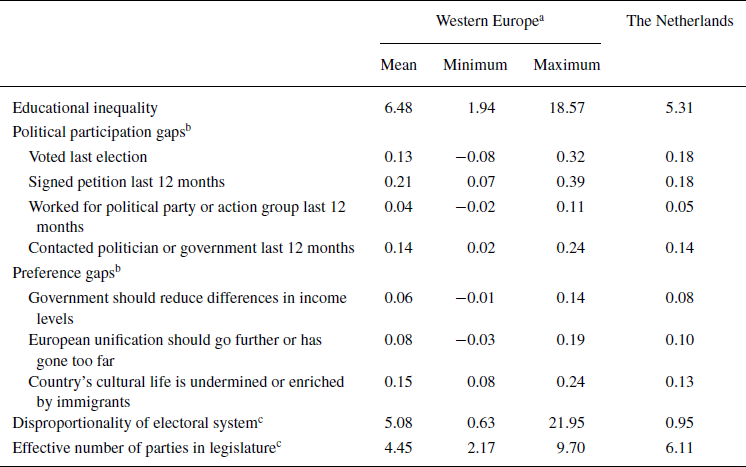
What kind of case is the Netherlands relative to the broader group of Western European countries? Table 1 displays how the former compares to latter on a number of relevant aspects. First, the overall level of educational inequality matters, under the assumption that a higher level of educational inequality provides more potential for political inequality. Data from the United Nations Development Programme (2016: 206) on inequality in years of schooling shows that the Netherlands is roughly average among Western European countries in this regard. Second, representation is likely to be less equal when gaps in political participation between educational categories are bigger, following the discussion in the previous section. Table 1 shows data on various forms of participation in Western European countries, and here, too, the Netherlands is near the middle of the pack. Third, representation is less equal when low and high educated strongly differ in their policy preferences; at least, there is less ‘coincidental’ representation when preferences sharply diverge (Enns Reference Enns2015). Again, the Netherlands does not stand out from the rest of Western Europe in this regard. Finally, more proportional electoral systems and more political parties could facilitate the representation of underprivileged groups. In this respect, the Netherlands is a bit of an outlier, with a large number of parties and high proportionality between votes and seats.
The Netherlands compared to Western Europe

a For the list of countries, see note 7. Means, minimum and maximum are calculated over all available country‐years.
b European Social Survey (rounds 1–8). Participation and preference variables were available in all rounds, except preferences on European unification (not available in round 1 and 5). Gap is the difference between low educated (‘Less than lower secondary education’ and ‘Lower secondary education completed’) and high educated (‘Tertiary education completed’).
c Gallagher least squares index and effective number of parties at the parliamentary or legislative level (Eff Ns), all elections from 2000 to 2019 (Gallagher and Mitchell, Reference Gallagher and Mitchell2005).
In sum, we consider the Netherlands neither a least‐likely nor a most‐likely case to find educational inequality in policy responsiveness, though, if anything, it slightly leans towards the former. For the most part, however, the Netherlands is a fairly typical case within Western Europe, such that findings in the former might be representative of the latter.
Having selected our case, we construct an original data set of public opinion and policy changes. To this end, we follow the approach used by Martin Gilens in his study of unequal policy representation of rich and poor citizens in the United States (Gilens Reference Gilens2012; Gilens & Page Reference Gilens and Page2014). We first searched through pre‐existing public opinion surveys that were conducted in the Netherlands within the past several decades. From these surveys, we selected questions that asked respondents for their preferences towards specific policy changes. The criteria for selecting the questions were as follows: (1) the policy change in question could be implemented on the national level; (2) the policy change should not involve a change in the constitutionFootnote 8; (3) the policy change should not yet be enacted when the survey was conducted, so as to reduce the risk of endogeneity; (4) the policy change should be specific enough to be able to code whether it was implemented in subsequent years; (5) the survey question should not address a policy change that was the subject of a different survey question asked in the previous 2 years, so as to avoid duplicate observations; and (6) the survey should include measures of respondents’ education and income, the latter serving as a control variable in our analysis.
Our final dataset comprises 291 observations; that is, 291 survey questions on potential policy changes. These were taken from surveys conducted between 1979 and 2012, with the median survey containing around 2000 respondents. The questions cover all kinds of issues, from increases in the pension age and tax reductions to immigration reforms and the construction of nuclear power plants. Further information on the survey questions and their sources can be found in the supplementary appendix (SA).
We follow the conceptualisation of Kriesi et al. (Reference Kriesi, Grande, Lachat, Dolezal, Bornschier and Frey2008) to group questions into the economic dimension, the cultural dimension or neither. Questions about welfare policy, the budget and economic liberalism are considered economic issues. Questions about the European Union, immigration, the army, security and culture are grouped under cultural issues. Questions about the environment, institutional reform and infrastructure are classed as neither. About 40 per cent of the questions fall on the economic dimension, with another 44 per cent belonging to the cultural dimension. The remaining 16 per cent concern issues that do not clearly belong to either of the two.
Our main independent variables are the level of support for each potential policy change among different educational groups. This is the percentage of, for instance, low educated respondents in favour of policy change among all those who expressed an opinion on either side of the issue. More refined measures are precluded by the wide variation in answer categories between different surveys. Hence, we do not take gradations in support or opposition into account at the individual level, nor do we consider the share of respondents who are neither for nor against policy change or have no opinion at all.Footnote 9
To harmonise the different education categories which are used in different surveys, we calculate support by education quintiles.Footnote 10 In our analyses, we focus on the preferences of the lowest, middle and highest education quintiles. This means that, unless explicitly stated otherwise, we measure education in relative terms within each survey, hence the labels of low, middle and high education do not refer to specific degrees.
The dependent variable is, quite simply, whether the policy change in question was enacted or not following the survey. Like Gilens, we consider a 4‐year period after the survey was conducted. If the measure was not adopted in this period, this is considered a lack of policy change. Coding the policy change or lack thereof for all 291 observations was a time‐consuming process, given the absence of a one‐size‐fits‐all data source. Two coders completed this task by examining legislative changes, government budgets and news articles. An intercoder reliability test which was conducted for a random sample of 40 observations produced a Krippendorff's alpha of 0.74, indicating a sufficient level of reliability.
Combining the independent and dependent variables gives us a data set which directly connects public opinion to policy changes on a wide range of issues. This has several major advantages for our purposes. First and foremost, the link between public opinion and policy is arguably the most important measure of representation, since policy affects the lives of citizens in myriad ways (Hacker & Pierson Reference Hacker and Pierson2014). As V. O. Key famously wrote: ‘Unless mass views have some place in the shaping of policy, all the talk about democracy is nonsense’ (Key Reference Key1961: 7). Second, the wide coverage of the data means we can be reasonably confident that the findings will not be driven by a particular time period or policy area. Third, the current approach avoids the use of broad ideological scales to measure opinion and policy, which are widespread in the study of representation but which have major downsides (e.g., De Vries et al. Reference De Vries, Hakhverdian and Lancee2013; Broockman Reference Broockman2016). A particularly relevant limitation is that there is evidence which suggests that low and highly educated citizens interpret such scales in systematically different ways (Bauer et al. Reference Bauer, Barberá, Ackermann and Venetz2017). This makes it very hard to know whether any findings using, for instance, the left‐right scale should be interpreted as a substantive result or as an artefact of this methodological issue.
Findings
We will present our findings in the order of the hypotheses by first exploring overall inequalities in responsiveness and then introducing the distinction between the economic and cultural dimensions. For reasons of brevity, we only present our main results in the text, relegating many additional analyses to the supplementary appendix.
Unequal policy representation
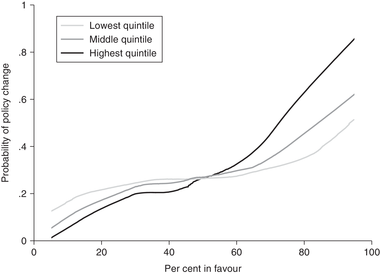
Figure 1 provides a first impression of the association between the preferences of different educational groups and policy changes. The figure displays loess curves of the probability of policy change as a product of support for policy change among low, middle and highly educated citizens. To be clear, the curves are the result of three separate local regressions and hence do not say anything yet about the relative influence of one group while controlling for the others. Even so, the differences between the three groups are quite clear. While there is a positive association in all three cases, such that policy change becomes more likely when there is support for this change, this association is much stronger for citizens with higher education levels. In other words, the first impression of the data is that policy is generally responsive to public opinion in the Netherlands, but this responsiveness is skewed towards highly educated citizens.
Local regression curves of policy change and support among low, middle and highly educated citizens.

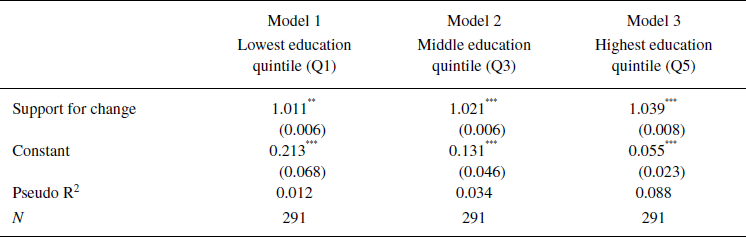
The same pattern can be shown with three separate logistic regression models which predict policy change based on preferences among low, middle and highly educated citizens, as is done in Table 2. As Model 1 shows, on average, a 1 per cent increase in support among the lowest education quintile multiplies the odds of a policy change being implemented by 1.011. This is a meaningful number in terms of both statistical and substantive significance, but it is much lower than the odds ratio of 1.039 achieved by the highest education quintile (Model 3).Footnote 11 To illustrate these coefficients, a 10 percentage point increase in support among the lowest quintile raises the odds of policy change from 50 per cent to 53 per cent, while the same increase among the highest quintile raises the odds from 50 per cent to 59 per cent.
Models predicting policy change with support from education groups

Odds ratios from logistic regressions.
* p < 0.10.
** p < 0.05.
*** p < 0.01 (two‐tailed).
Of course, the bivariate models do not account for the possibility that the effect for one educational group is a by‐product of agreement with another group. In other words, they do not gauge the independent effects of the different preference variables. The most straightforward way to explore this is to combine the preferences of low, middle and highly educated citizens into one model. If we do so, we find a strong, positive effect for the highest education quintile and non‐significant effects for both the middle and lowest quintiles (SA, Table A4). However, these estimates are not very stable as a result of the substantial collinearity between the preferences of different educational groups.Footnote 12
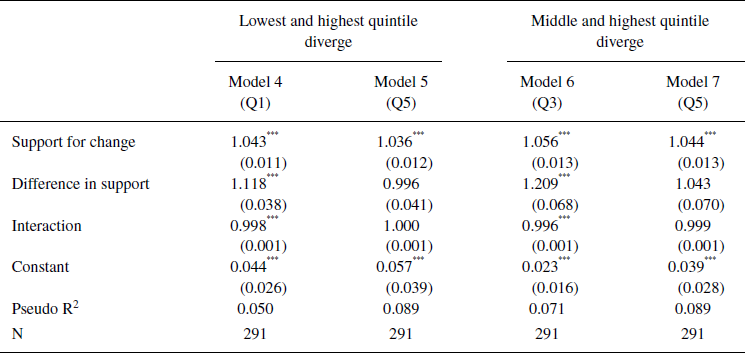
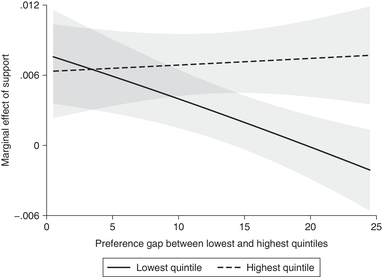
Fortunately, there are other ways to estimate the independent influence of educational groups. One approach is to interact the preferences of, for instance, the lowest quintile with the absolute gap in preferences with the highest quintile. The interaction term indicates how the effect of low‐educated preferences changes as the differences with high‐educated preferences grows. The results of this specification are presented in Table 3. The interaction term is significantly negative for the lowest educational category (Model 4), indicating that the more their preferences diverge from those of the highly educated, the less impact they have. Conversely, the interaction is not distinguishable from zero for the highest educational category (Model 5), showing that their preferences are equally impactful regardless of whether they conflict with preferences of the low educated. The marginal effects of the interaction terms in Models 4 and 5 are visualised in Figure 2 to further illustrate this pattern. The table and figure show that the effect of low‐educated preferences declines as it starts to differ from high‐educated preferences, while the effect of high‐educated preferences is not affected by the difference with low‐educated preferences. In other words, the lowest educational group exerts no independent influence on policy, while the highest educational group does exert such influence. Moreover, and importantly, the same pattern emerges when comparing the middle and top education quintiles (Models 6 and 7). That is to say, even citizens with intermediate levels of education – whose attitudes are likely to be very close to those of the median voter – do not receive any representation unless they agree with the higher educated. This is strong evidence for unequal policy representation in the Netherlands.Footnote 13
Models predicting policy change when preferences diverge

Odds ratios from logistic regressions.
* p < 0.10.
** p < 0.05.
*** p < 0.01 (two‐tailed).
Marginal effects of support among low and highly educated citizens when preferences diverge.

Following up on this, the apparent non‐linearity of the education effect deserves emphasis. For the most part, this is already clear from the above‐mentioned findings, where both low and middle educated citizens lose out against the highly educated. To delve deeper into this, we separate the preferences of graduates from the two highest education levels in the Netherlands – university and higher vocational education – which is possible for 205 of our 291 observations. When these two groups are compared, we find some evidence of unequal influence even within the broader category of highly educated citizens. In separate regressions of policy change on support for change, the effect for university graduates is stronger than it is for higher vocational graduates (SA, Table A7). And when we repeat the analyses of Table 3, we find that support among the latter has a weaker effect as the preference gap with the former increases, though the interaction effect falls short of conventional levels of statistical significance (SA, Table A8). In sum, then, education is not only associated with increased policy responsiveness, its effect is highly non‐linear.
To contextualise these findings, we note that there are large preference gaps between educational groups. The average absolute difference in support between the lowest and highest education quintiles is 14.3 percentage points; between the middle and highest quintiles, the average difference is 9.6 percentage points. As an example of a policy change with average preference gaps, 59 per cent of the highest quintile supported raising taxes for the highest incomes in 1980, while 69 per cent of the middle quintile and 73 per cent of the lowest quintile favoured the measure. Generally, in over a quarter of all cases, a majority of low educated citizens supports policy change while a majority of highly educated citizens opposes it, or vice versa. For the middle and highly educated, this occurs in one in five cases. Hence, unequal representation has clear consequences for the kinds of policies that are enacted.
Robustness checks
The basic pattern of unequal responsiveness holds up to a range of robustness checks. One important robustness check is to separate the effect of education from that of income, given the importance of the latter in the literature on unequal representation (Gilens Reference Gilens2012; Bartels Reference Bartels2016; Elsässer et al. Reference Elsässer, Hense and Schäfer2017).Footnote 14 Controlling for income is not as easy as adding the preferences of different income groups to the models in Table 2, since this again leads to multicollinearity. We can work around this, however, by constructing income quintiles in the same way we constructed education quintiles and calculating preferences for each of the 25 resulting combinations of education and income. This allows us to regress policy change on support among different educational groups while holding income constant. Such analysis suggests that education continues to have a sizable effect on policy responsiveness, even when controlling for income (SA, Table A9). More precisely, the remaining effect is about two thirds of the responsiveness gap in the baseline models of Table 2. This is all the more significant because the effect of education could be partly mediated by income, and mediation would remove the effect of education. An additional and intriguing finding is that education seems to affect responsiveness more strongly than income does, which we will come back to in the discussion.
Another potential source of omitted variable bias is that ‘[t]hose with high education and income may simply understand the constraints on government policies better than others (…) and this will show up as congruence between preferences for change and actual change’ (Iversen & Soskice Reference Iversen and Soskice2019: 25). We acknowledge this possibility and cannot rule it out with any certainty. However, we also note that controlling for the macro‐economic conditions that are the likeliest to induce common attitude shifts among highly educated citizens and policymakers – growth, unemployment and government debt – has little impact on the effect of education (SA, Tables A10 and A11). Even including fixed effects for years, which is an aggressive way of addressing omitted variable bias, leaves the main findings intact (SA, Tables A12 and A13).
Other relevant sensitivity tests include adding dummy variables and performing a jackknife analysis for survey organisations, to make sure our results are not driven by the peculiarities of one or several of these organisations (SA, Table A14–A17). We also excluded observations where education was measured as years of schooling, since this is a fairly coarse measure of one's level of education (SA, Tables A18 and A19), and we excluded observations with very large preference gaps as a way to remove outliers (SA, Tables A20 and A21). In addition, we tested whether the findings are driven by government composition, the electoral cycle or a specific survey method (SA, Tables A22–A29). To address sampling error in our estimates of policy preferences, we weighed these preferences by the inverse of the standard error of their point estimates (SA, Tables A30 and A31). In all cases, clear inequalities in policy responsiveness remain.
Political dimensions
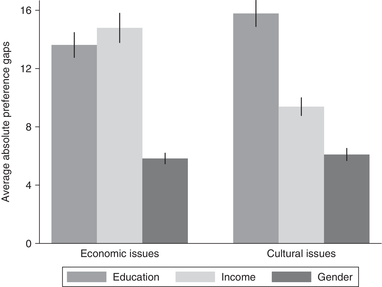
We now turn to our second hypothesis by analysing how unequal representation plays out on the economic and cultural dimensions of political attitudes. Our expectation was that opinions between low and highly educated citizens are more divergent on cultural issues than on economic issues, and that the gap in policy responsiveness is therefore largest for the former. Figure 3 shows the average absolute preference gaps between the lowest and highest education quintiles on both dimensions, that is, the absolute difference in support for specific policies among the low and highly educated (in percentage points). As a comparison, Figure 3 also displays the preference gaps between the lowest and highest income quintiles and between women and men. The resulting pattern is quite striking. Contrary to our expectation, large differences in opinions between educational groups are found on both dimensions. In contrast, income does perform in line with our earlier discussion, with low and high incomes diverging much more clearly on the economic dimension than on the cultural dimension. Finally, men and women do not disagree strongly on either dimension.
Preference gaps between low and highly educated citizens, low and high incomes, and women and men (error bars indicate one standard error above and below the mean).

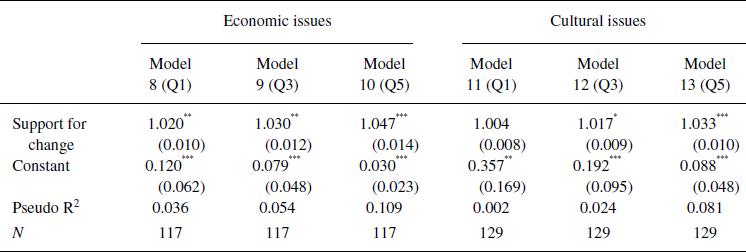
In Table 4, we consider the effect of the preferences of education groups on policy change, split out for the two issue dimensions. This shows that policy responsiveness is generally stronger for economic issues than for cultural issues, as indicated by the higher coefficients for all groups on the former. Given the scope limitations of this study, we will not speculate on the reasons behind this difference. For our purposes, the more important findings relate to inequality in policy representation. In line with Figure 3 but contrary to our second hypothesis, there is unequal responsiveness on both dimensions, as the effect of high‐educated preferences clearly trumps the effect of low‐educated preferences in both cases. Equally important is the fact that, on both dimensions, support among the lower educated does not affect policy change when they disagree with the higher educated. Again, the same goes for the middle education quintile (SA, Tables A32 and A33). In effect, education is a more comprehensive source of unequal representation than we anticipated, extending to both the cultural and economic dimensions of political conflict.
Models predicting policy change per issue dimension

Odds ratios from logistic regressions.
* p < 0.10.
** p < 0.05.
*** p < 0.01 (two‐tailed).
While a full explanation of this result lies beyond the scope of this paper, we do want to mention one factor. It is likely that education not only imparts – or selects for – certain (non‐material) values, but also affects political attitudes through its powerful effects on one's labour market position. The latter is a likely mechanism from education to differences in political preferences and policy influence on economic issues. However, supplemental analysis shows that the unequal responsiveness to educational categories is robust to controlling for income on both the cultural and the economic dimensions (SA, Tables A34 and A35). This is surprising, since we would expect income to act as a mediating variable on the latter. At the same time, income is only a partial measure of labour market positions, and better measures might account for a larger share of the education effect. This, too, is something we leave to future research.
Conclusion
Education increasingly divides citizens in Western Europe. The educational divide can be seen in social life, as low and highly educated citizens have separate social networks, live in different neighbourhoods and in some cases feel resentment towards one another (Kuppens et al. Reference Kuppens, Spears, Manstead, Spruyt and Easterbrook2018). These social phenomena are intricately connected to the political divisions between educational groups, which are reflected in voting behaviour, policy preferences and evaluations of government (Easterbrook et al. Reference Easterbrook, Kuppens and Manstead2016). To some observers, the rise of populism – which erupted onto the world stage with the election of Donald Trump and the Brexit referendum – represents the culmination of the educational cleavage (Runciman Reference Runciman2016).
This is the backdrop against which we analysed the responsiveness of government policy to citizens with different levels of education. In many public debates surrounding populism, one hears the charge that politics is dominated by a highly educated, out‐of‐touch elite or, conversely, that politicians pander too much to low educated, uninformed voters. However, given the prominence and importance of such debates, there is surprisingly little research on the topic, making it hard to distil the truth from all of the rhetoric.
In this paper, we aimed to provide some clarity through a large‐scale analysis of public opinion and policy change in the Netherlands. We expected to find that policy is more responsive to the demands of higher educated citizens than to the demands of lower educated citizens, based on numerous biases in political participation. Our first and main finding is that this is indeed the case. The association between policy change and public support for such change becomes much stronger as education increases. Furthermore, the views of the lower and even the middle educational groups are not associated with policy change at all when they diverge from the most highly educated. In effect, it seems that policy influence is only afforded to the latter. Second, we expected education to stratify attitudes – and indirectly, responsiveness – mostly on the cultural dimension of political competition and less so on the economic dimension. This hypothesis was not supported, as we found large preference gaps between low and highly educated citizens on both dimensions. As a result, policy representation is starkly unequal on both sets of issues. Essentially, education is an even larger source of political inequality than we anticipated.
Based on these findings, our main conclusion is quite straightforward: policymaking in the Netherlands is dominated by a minority of highly educated citizens. This conclusion is important in understanding the educational divide, as it is both a consequence and cause of this divide. It is a consequence in the sense that it shows that differences in political views and behaviours between educational groups actually matter for the content of policy. In this way, political inequality has tangible consequences for citizens’ everyday lives. And our findings represent a likely cause of further educational divides, in several ways. Highly educated citizens are likely to use their outsized influence to promote policies that benefit themselves and hence increase the social and material distance with lower educated citizens. An obvious example of this is the introduction of a loan system in Dutch tertiary education, which has hampered the access of students from lower socio‐economic strata to higher vocational education (Van den Berg & Van Gaalen Reference Van den Berg and Van Gaalen2018), but which was largely supported by the highest education quintile. Furthermore, unequal policy responsiveness could foster cynicism and resentment among lower and middle educated citizens. This may even result in lower political participation by these citizens, raising the specter of a vicious cycle of educational and political inequalities (Jacobs et al. Reference Jacobs, Barber, Bartels, Dawson, Fiorina, Hero, Heclo, Kim, Mettler, Page, Pinderhughes, Schlozman, Skocpol and Verba2004: 655).
Of course, our analysis raises many new questions. Some of the most pertinent questions concern the mediating factors that translate education into political influence and the moderating factors that determine how well education can be translated into political influence in different contexts. When it comes to mediators – that is, causal mechanisms – future research could estimate the relative importance of various forms of political participation. In addition, future studies could test whether the nature of policy preferences differs between educational groups, such that the highly educated send a clearer signal to policymakers than do the lower educated. As for moderators, we have argued that the Netherlands is a representative case for Western Europe, but the generalisability of our results is still an empirical question. Future research can extend the current study by investigating whether educational inequality in policy representation is found cross‐nationally, perhaps beyond Western Europe, and which factors can explain potential variation in unequal responsiveness.
One of the hypotheses that might be explored within a broader analysis of mediators and moderators is that populist parties, and particularly right‐wing populist parties, enhance the representation of lower educated citizens (Aaldering Reference Aaldering2017). This is commonly suggested to be the case; many sympathetic commentators describe populism as a ‘self‐correction of representative democracy' (Thomassen et al. Reference Thomassen, Andeweg and Van Ham2014: 64). We do not know whether right‐wing populist parties bring about more equality in representation until this is put to the test, but for the moment we remain sceptical. For one thing, the Netherlands has long had major right‐wing populist parties, particularly in the new millennium (from which most of our data stems). One of these parties, Geert Wilders’ Freedom Party, was even part of the governing coalition as a junior partner between 2010 and 2012. This naturally raises the question why there is still such stark inequality in responsiveness.
A further consideration is that right‐wing populist parties typically combine conservative stances on the cultural dimension with right‐wing (or, at most, centrist) stances on the economic dimension. The Netherlands forms no exception to this pattern (Pellikaan et al. Reference Pellikaan, De Lange and Van der Meer2018). Lower educated citizens, on the other hand, usually combine conservative cultural attitudes with left‐wing economic attitudes (Bovens & Wille Reference Bovens and Wille2017: 50–52). Hence, even if right‐wing populist parties represent these citizens well on one dimension, this comes at the expense of representation on the other dimension. This is a broader point, which is true for most Western European countries: the left‐conservative quadrant is quite empty on the level of political parties, while many citizens – and particularly low educated citizens – reside here (Van der Brug & Van Spanje Reference Van der Brug and Van Spanje2009). It is very likely that this contributes to unequal policy responsiveness.
Beyond this, an important avenue for further study is the comparison of different sources of political inequality. As hinted at above, our analysis suggests that education has a bigger effect on responsiveness than income does in the Netherlands, though both factors matter. Strikingly, Gilens (Reference Gilens2012: 93–95) finds the opposite pattern in the United States, where income is dominant. One possible explanation of this difference is that various mechanisms that convert income into political influence in the American context, such as political donations, may be less applicable to other established democracies. In contrast, the mechanisms behind educational inequality in representation – including political participation – are potentially less limited to the United States. We offer these thoughts as mere suggestions, with the larger point being that future research should consider which sources of unequal representation are most influential in different contexts.
Finally, our findings bring us back to an age‐old normative question: Which citizens should be able to influence the direction of government policies? The idea that all adult citizens should have equal voting rights is widely embraced, but more demanding forms of political equality are likely to be more contentious, with equality of policy representation being the most demanding of all. Hence, some may consider our findings to be good news, following from the belief that lower educated citizens have ill‐informed or even immoral views. We cannot engage with these arguments here and only note that these issues should be carefully considered by everyone involved, since there are no easy answers on either side. We do want to add a word of caution to our highly educated readers: while there are surely cases where policy cannot or should not follow majority opinion, there is a high burden of proof that must be met before any group of citizens can be systematically excluded from influencing policy.
Acknowledgements
A previous version of this paper was presented at Leiden University. For their helpful criticisms and suggestions, we thank meeting participants, as well as Mark Bovens, Brian Burgoon, Armen Hakhverdian, Theresa Kuhn, and the reviewers and editors of the European Journal of Political Research. Tessa van Houtrijve provided excellent research assistance.
Online Appendix
Additional supporting information may be found in the Online Appendix section at the end of the article.
Supplementary material


 Open access