
Introduction
Integrated Assessment Models (henceforth IAMs) have emerged as critical tools at the intersection of climate science and policy, evolving significantly since their inception around three decades ago. The origins of IAMs can be traced back to the need for comprehensive frameworks that integrate knowledge from various disciplines – such as economics, environmental science and energy systems – to assess the multifaceted impacts of climate change and the effectiveness of potential policy responses. Early models primarily focused on the interactions between economic growth, resource use and environmental degradation, providing a foundational understanding of how human activities affect climate systems and vice versa. The Climate Impact Assessment Program (CIAP), despite not constituting an IAM per se, focused on assessing the potential atmospheric impacts of supersonic transport aircraft, marking a significant early attempt to formalize integrated assessments through mathematical modelling, although it lacked the multi-sectoral integration characteristic of contemporary IAMs. As IAMs evolved, they began to incorporate more complex interactions between energy systems and economic growth, with models such as RAINS (Regional Acidification Information and Simulation) developed in the late 1980s playing a crucial role in addressing acid rain issues in Europe (Alcamo et al. Reference Alcamo, Hordijk, Kamari, Kauppi, Posch and Runca1985). RAINS later evolved into the GAINS (Greenhouse Gas and Air Pollution Interactions and Synergies) model, which is actively used in EU policy analysis today to quantify emissions, assess mitigation potential and integrate with agricultural models such as CAPRI, thus creating a direct lineage from early integrated assessment tools to current EU modelling frameworks.
IAMs play a crucial role in the science–policy interface by bridging complex scientific data with actionable climate policy decisions. By synthesizing knowledge from multiple disciplines, IAMs enable policymakers to simulate various scenarios and assess the impacts of different strategies on greenhouse gas emissions, economic growth and social equity. They help evaluate trade-offs between approaches, thereby guiding effective and equitable policy formulation. Beyond scientific analysis, IAMs serve as educational tools that enhance public and policymakers’ understanding of climate issues, fostering informed dialogue and consensus-building. Accessibility varies from open-source programs to ‘black box’ interfaces and customizable Excel formats. Inputs are drawn from diverse datasets, such as economic and agricultural metrics, while outputs span a range of fields, presented through tables, graphs or maps. Synergies among IAMs are crucial for holistic sustainability analysis, achieved through cooperative, complementary or independent integration of models. IAMs focused on food systems and agriculture (henceforth agri-food IAMs) integrate data and insights from various disciplines, including agronomy, economics, ecology and climate science and use advanced mathematical and computational techniques to simulate different scenarios and project long-term trends to support decision-making and long-term planning in the food–agriculture domain. These models offer a systemic approach to analysing the interactions between agricultural production, food consumption, land use and environmental impacts (predominantly GHG emissions and biodiversity indicators). They enable researchers and policymakers to explore how changes in factors such as population growth, technological progress and climate change might affect food security, agricultural land use and environmental outcomes.
The direct policy relevance of food IAMs is evidenced by their operational use in EU impact assessments. CAPRI is the core model used to evaluate CAP eco-schemes and agri-environmental measures, translating policy instruments into changes in production, farm income, nutrient balances and greenhouse gas emissions. It integrates data from national CAP strategic plans to map eco-schemes to regions, activities and units, simulating their impacts alongside good agricultural and environmental conditions and other interventions. GLOBIOM, linked with G4M, provides the analytical backbone for assessing compliance with EU LULUCF targets, capturing land use competition between agriculture, forestry and bioenergy, as well as the resulting carbon stock changes. In parallel, GAINS, coupled with CAPRI activity data, quantifies non-CO2 agricultural emissions and mitigation potential, ensuring consistency between economic agricultural projections and EU climate policy design. Specifically, GAINS uses CAPRI’s agricultural activity projections (e.g., animal numbers by farm size, fertilizer/manure application) as inputs, combined with country-specific emission factors derived from IPCC guidelines and expert adjustments to calculate CH4 (enteric/manure) and N2O emissions for the agricultural sector.
Having said that, Pindyck (Reference Pindyck2013) criticizes IAMs on the basis that many inputs to these models are arbitrary, significantly influencing the resulting estimates of the social cost of carbon. Additionally, the models may rely on ad hoc descriptions of climate change impacts, lacking a solid theoretical or empirical foundation. Crucially, they fail to address the potential for catastrophic climate outcomes, which is a key driver of the social cost of carbon. Nonetheless, IAMs provide robust analytical tools in our science-based approach to tackle climate change. Climate change is arguably the greatest challenge of our time, and, to that end, all stakeholders need to mobilize as many resources as possible to address it. Recent advances in integrated assessment stress the need to embed robust economic valuation of ecosystem services under uncertainty directly into policy-relevant modelling frameworks, strengthening the credibility of IAM outputs in real-world decision making (Koundouri and Davila Reference Koundouri and Dávila2015). Advances in long-run cost–benefit analysis, including the use of declining discount rates, improve the theoretical consistency of IAM-based assessments of climate and agri-food transitions (Groom et al. Reference Groom, Hepburn, Koundouri and Pearce2005).
An initial reporting on existing IAMs has been carried out by Koundouri et al. (Reference Koundouri, Keles, Leong, Bremstoft, Chatzigiannakou, Dellis, Kountouris, Landis, Madsen, Papayiannis, Platts, Woo and Yannakopoulos2023), compiling and evaluating widely used IAMs by examining their scope, output potential, accessibility, inputs, outputs and potential for synergies. IAMs are classified according to their sector of focus, mainly, energy, climate, the economy and Agriculture, Forestry and Other Land Use (AFOLU)-water-demographic trends. Building on that foundation, this article extends this line of work by focusing on outlining and evaluating IAMs related to agriculture and food systems. Specifically, we narrow our focus by examining 12 agri-food IAMs to explore their strengths, weaknesses and potential contributions to data-driven policymaking in the field of agri-food system transformation in the European Union. Having said that, the most potent IAMs span different sectors and address a range of issues spanning climate, the economy and society. We cast our focus on the models that predominantly examine the agri-food systems but nonetheless touch upon diverse topics through their scientific output. This article adds to the review of agri-food IAMs by succinctly evaluating the potential of 12 impactful models using a systematic set of criteria. We undertake a high-level assessment considering (i) the degree to which they deploy cost minimization techniques; (ii) whether they address the interdependence of water, food, energy, the economy, land use and climate; (iii) the degree of integration with other models; (iv) their sectoral coverage; and (v) the granularity of their spatial and temporal resolution. This provides initial guidance beyond the description of the main model attributes to assist researchers and policymakers by looking not only at the individual model attributes but at the integration potential in a cross-disciplinary modelling suite. Moreover, it elevates the monitoring of synergies from technical linkages to a central organizing principle for agri-food governance, explicitly positioning agri-food IAMs within integrated modelling suites for EU Green Deal, Farm to Fork, Biodiversity and CAP implementation.
The selection of the 12 agri-food IAMs was based on their demonstrated (and potential) capacity to directly inform EU policymaking, their degree of interoperability and integration with other models and tools, their breadth in sectoral coverage and their documented openness. On top of the documented contribution of CAPRI, GAINS and GLOBIOM/G4M in EU agricultural and food system policymaking, all IAMs in our list provide fruitful policy insights by integrating data and output for more than one sector. Each model demonstrates significant policy uptake in EU contexts, having been operationally embedded in European Commission assessments for initiatives such as the Green Deal, Farm-to-Fork Strategy and the Common Agricultural Policy (CAP). For example, FABLE demonstrates a potential for rapid, transparent policy uptake at the country level, coupled with advanced stakeholder engagement methods supported by the FABLE secretariat. These models possess strong coupling capacity, enabling integration within established modelling suites (e.g., MESSAGE-GLOBIOM, REMIND-MAgPIE) enabling integration with complementary frameworks in energy, climate, economic or hydrological domains within established modelling suites. Furthermore, G4M converts EU forestry measures into spatial LULUCF outcomes and couples cleanly with land/energy frameworks. GCAM offers proven EU stress testing with integrated energy–water–land–climate coupling. Their sectoral coverage spans the critical nexus of agriculture, land use, water, forestry and bioenergy, allowing for holistic sustainability analysis. Furthermore, they are supported by a robust validation and record, evidenced by peer-reviewed applications, contributions to IPCC assessments and transparent documentation. While varying in their degree of openness, all provide sufficient public documentation and data to support reproducible, stakeholder-informed policy dialogue. Specifically, IMAGE, GLOBIOM, CAPRI, MAGNE and WEAP provide extensive public documentation and datasets.
The 11 additional models outlined in Appendix A were reviewed as valuable, specialized tools for deepening biophysical understanding, particularly in hydrology, crop growth and basin-scale management. However, they were not selected as core models for this synthesis because they generally lack the integrated, economy-wide representation, established policy linkages and direct institutional use for EU-level policy assessment that characterize the primary 12. Instead, they are best utilized as complementary components that can inform and enhance the core IAMs by providing detailed, localized data for downscaling or refining specific sector assumptions within broader integrated frameworks.
The remainder of the article is structured as follows: the next section meticulously describes the functioning and outputs of relative IAMs, highlighting the synergies with other models; the subsequent section describes the evaluation methodology and results; the penultimate section discusses the implications for EU policy formulation while the final section concludes.
Review of Agri-food IAMs
The report by Koundouri et al. (Reference Koundouri, Keles, Leong, Bremstoft, Chatzigiannakou, Dellis, Kountouris, Landis, Madsen, Papayiannis, Platts, Woo and Yannakopoulos2023) categorizes IAMs based on their primary application domains, including agriculture, climate, economics, water and demographics. It provides an overview of 12 agriculture-focused IAMs, classified by their specialization within the food systems domain. Additionally, 11 supplementary agri-food IAMs are described in Appendix A. As illustrated in Figure 1, the classification of 24 models includes an array of IAMs relevant to agri-food systems. Specifically, we classify the agri-food IAMs along four broad categories: (i) Food Security, Land-use and Socio-economic models; (ii) Food–Energy–Water nexus models; (iii) Land, Crop and Food Production models; and (iv) Hydrological and Water Resources models.
Agri-food IAMs categorized according to their focus and specialization within the food category

Agriculture IAMs Description
Food Security, Land Use and Socio-economic Models
The FABLE Calculator as described in Mosnier et al. (Reference Mosnier, Penescu, Pérez Guzmán, Steinhauser, Thomson, Douzal and Poncet2020) is an Excel accounting tool used to study the potential evolution of food and land-use systems over the period 2000–2050 (Figure 2). It is the main modelling tool for the FABLE Consortium under the aegis of UN SDSN and IIASA. Its primary field is agriculture, while it includes land use, food systems, energy and biodiversity categories. Through a demand-based approach, it acknowledges agriculture as the main driver of land-use change and tests the impact of different policies and changes in the drivers of these systems through the combination of many scenarios. It includes data for 88 raw and processed agricultural products from the crop and livestock sectors and relies extensively on the FAOSTAT database for input data. The FABLE calculator combines scenarios for economic, environmental, energy and policy variables to compute pathways for the 2020–2050 horizon. Scenarios are the suite of possible actions that set a pathway on a certain trajectory, whereas a pathway represents the coherent development of a system along a certain trajectory. Assumptions are the conditions that a modeller establishes before the model is run to make predictions on, for example, causality chains and changes in specific parameters of the model according to the selected scenarios.
FABLE calculator methodology (Mosnier et al. Reference Mosnier, Penescu, Pérez Guzmán, Steinhauser, Thomson, Douzal and Poncet2020)

The calculator computes the level of agricultural activity, land use change, food consumption, trade, GHG emissions, water use and biodiversity conservation according to selected scenarios for every 5-year time step over the period 2000–2050, using agricultural products data from the FAOSTAT database. Users can replace data from global databases with national or subnational data. The calculator is linked to other models such as GLOBIOM, BALMOREL, BayesPop and MAGE in a synergistic way. This cross-model integration allows it to produce more robust, comprehensive and accurate projections across a range of agricultural, land use, emissions and environmental metrics.
MAgPIE (Model of Agricultural Production and its Impact on the Environment), as Dietrich et al. (Reference Dietrich, Bodirsky, Weindl, Humpenöder, Stevanovic, Kreidenweis, Wang, Karstens, Mishra, Beier, Molina Bacca, Klein, Ambrósio, Araujo, Biewald, Lotze-Campen and Popp2020) mention, is a global land-use allocation model, which is connected to the grid-based dynamic vegetation model LPJmL, with a spatial resolution of 0.5 × 0.5 (Figure 3). Developed by the Potsdam Institute for Climate Impact Research, MAgPIE assesses land and water competition and sustainable development implications under scenarios of rising demands for food, energy and materials, climate change impacts, GHG mitigation and land-use policies. It uses regional economic data, including demand elasticity, technological advances and production costs, alongside spatial data on crop yields and environmental constraints. The model aims to minimize production costs for meeting regional food and bioenergy demands, generating outputs on land-use patterns, yields, production costs and land-based GHG flows. MAgPIE’s results support analyses of climate change impacts on land-use and are further enriched through links with other models, such as REMIND and MAGICC, to provide a comprehensive understanding of global land and environmental systems.
MAgPIE framework (Dietrich et al. Reference Dietrich, Bodirsky, Humpenöder, Weindl, Stevanović, Karstens, Kreidenweis, Wang, Mishra, Klein, Ambrósio, Araujo, Yalew, Baumstark, Wirth, Giannousakis, Beier, Chen, Lotze-Campen and Popp2019: 1299)

The Global Forest Model (G4M), reported in Gusti (Reference Gusti2015), is a climate model that evaluates the profitability of forests versus alternative land uses, such as agricultural crops or biofuels, helping to determine optimal land use based on potential income. It can be integrated with other models to enhance land-use insights and helps assess land management options by comparing afforestation, deforestation and forest maintenance impacts. G4M computes optimal forest rotation times, biomass stocking and harvesting rates, supporting efficient forest management decisions. Key inputs include forest characteristics, economic factors such as wood demand and land rents and environmental data. Outputs from G4M include afforestation and deforestation rates, forest biomass, CO2 emissions and forest management impacts under different climate policy scenarios, such as carbon taxes or incentives (Figure 4). This model is also closely linked with GLOBIOM, providing a comprehensive tool for evaluating land-use and climate strategies.
Causal diagram of the decision on deforestation in a grid cell (Gusti Reference Gusti2015)

Global Change Analysis Model (GCAM), discussed in Calvin et al. (Reference Calvin, Patel, Clarke, Asrar, Bond-Lamberty, Cui, Di Vittorio, Dorheim, Edmonds, Hartin, Hejazi, Horowitz, Iyer, Kyle, Kim, Link, McJeon, Smith and Snyder2019) and GCAM Community (2024), is a market equilibrium model with a global reach that projects trends from 1990 to 2100 in five-year increments (Figure 5). It examines how factors such as population growth, income changes and technology costs impact crop production, energy demand and water use, while also assessing how shifts in one region’s energy demand influence other regions. As a dynamic-recursive model, it includes detailed representations of the economy, energy sector, land use and water, and is connected to a climate model, making it useful for evaluating climate policies such as carbon taxes, trading, regulations and accelerated energy technology adoption. The model uses historical data on production, pricing and emissions, along with projected technology and emissions data, to reach market equilibrium solutions. Its output spans energy production and consumption, agricultural and forestry outcomes, greenhouse gas pricing and land use projections. GCAM is also part of the Net Zero Worlds Initiative (NZWI), collaborating with models such as TIMES, PLEXOS and MESSAGE.

Global Biosphere Management Model (GLOBIOM) detailed in Havlík et al. (Reference Havlík, Valin, Herrero, Obersteiner, Schmid, Rufino, Mosnier, Thornton, Böttcher, Conant, Frank, Fritz, Fuss, Kraxner and Notenbaert2014) is a global recursive dynamic partial equilibrium model that integrates the agricultural, bioenergy and forestry sectors to analyse land-use competition). It captures the interrelationships between population dynamics, socio-economic changes, technology, ecosystems and climate, which affect land use and resource allocation. Initially developed to assess climate change mitigation policies in land-based sectors such as biofuels, GLOBIOM is now used for agricultural and timber market projections, economic impacts of climate change, adaptation strategies and various sustainable development goals. The model runs recursively and provides projections up to 2100, focusing on greenhouse gas emissions from the AFOLU sector, including N2O, CH4 and CO2. As shown in Figure 6, input includes regional data on population, GDP, bioenergy, diets, trade and land productivity, while outputs cover prices, demand, trade flows, land use, production and emissions. GLOBIOM is also compatible with models such as WHICH, MAGICC and G4M, GEM-E3, POLES, PRIMES, CAPRI and GAINS, offering comprehensive insights into land-based systems.
GLOBIOM schematic (Havlík et al. Reference Havlík, Valin, Herrero, Obersteiner, Schmid, Rufino, Mosnier, Thornton, Böttcher, Conant, Frank, Fritz, Fuss, Kraxner and Notenbaert2014)

CAPRI, discussed in CAPRI Modelling Consortium (2023), is an economic partial equilibrium model developed by European Commission research funds (Figure 7). It supports decision-making related to the EU Common Agricultural Policy (CAP) and environmental policy based on quantitative analysis. CAPRI has spatial coverage for all countries globally and a single-year, comparative static approach. The results are stored in GDX format, and a Java GUI allows model setup and scenario runs. CAPRI’s input includes prices, agricultural land allocation, supply and use balances of agri-food commodities, productivity indicators, macroeconomic data and policy information. Its consistent database combines global, national and regional data from sources such as EUROSTAT, FAOSTAT and FADN. The model’s outputs cover agricultural production, yields, trade, farmer income, prices, subsidies, greenhouse gas emissions, nutrient and carbon balances, as well as water use. CAPRI provides consistent agricultural activity projections for EU scenarios, with short-term, medium-term and long-term analysis up to 2030 or 2050. CAPRI has synergies with other models such as EDGAR, IMPACT, GLOBIOM and EBB, which provide inputs to complete its database. It is used for EU-focused agricultural and environmental policy analysis.
Concept of the CAPRI model (Britz et al. Reference Britz, M’barek, Burrell and Delincé2012)

TOA-MD – Tradeoff Analysis Model for Multi-dimensional Impact Assessment, as referred to in Britz et al. (Reference Britz, M’barek, Burrell and Delincé2012) – is a simulation tool developed by Oregon State University to analyse agricultural production systems and land use, focusing on economic and environmental outcomes. TOA-MD simulates the adoption and impacts of new technologies or changes in environmental conditions on a heterogeneous population of farms. It utilizes available data to approximate the results of a controlled experiment. The latest TOA-MD7.0 model presented on the Oregon State University webpage can simulate economic, environmental and social impacts of agricultural systems for diverse households with crops, livestock and aquaculture. It calculates impact indicators such as mean farm income, poverty and threshold-based environmental/social outcomes for adopters, non-adopters and the overall population. TOA-MD is used to assess the viability and impact of new agricultural technologies, evaluate farming system resilience to climate change, develop policies for sustainable agriculture and poverty reduction and inform resource allocation decisions. Input includes crop/livestock yields, soil/climate data, farm characteristics, household demographics, input costs, output prices, technology adoption information and risk/uncertainty parameters. Output covers socio-economic and environmental outcomes, poverty/food security indicators, technology adoption assessments and visualizations of trade-offs. TOA-MD has synergies with other models such as GCAM, IMAGE, REMIND, MAGNET, IMPACT, DSSAT, MESSAGE-GLOBIOM and EPPA.
IMPACT – International Model for Policy Analysis of Agricultural Commodities and Trade, presented in Robinson et al. (Reference Robinson, Mason-D’Croz, Islam, Sulser, Robertson, Zhu, Gueneau, Pitois and Rosegrant2015) and the International Food Policy Research Institute – was developed by the International Food Policy Research Institute (IFPRI) in the early 1990s (Figure 8). It is a dynamic model designed to address the long-term challenges of reducing hunger and poverty in a sustainable manner. Over the years, the model has evolved to tackle increasingly complex policy questions, expanding its focus to integrate food supply, demand, trade and agricultural water use. IMPACT is a network of interconnected economic, water and crop models, with a core partial equilibrium multi-market economic model that simulates both national and international agricultural markets. It incorporates environmental, biophysical and socio-economic trends, enabling detailed analysis of critical issues that affect food security and agricultural systems at national, regional and global levels.
Schematic of the IMPACT model (Robinson Reference Robinson2014)

The model utilizes a wide range of inputs, including climate change scenarios, crop yield data, renewable water resources, agricultural costs and historical data on crop production. It also considers population growth, income levels, urbanization, technology adoption and policy interventions such as subsidies and taxes. The output includes projections of agricultural production, prices, trade, food consumption patterns and water demand, alongside estimates of food insecurity and malnutrition risks. The model’s results support decision-making by providing insights into trade-offs and policy pacts, and exchanging data with other models such as GCAM, IMAGE, GLOBIOM, MESSAGE-GLOBIOM, WaterGAP, REMIND, EPPA, MUSE, AIM and AIM/CGE.
MAGNET – Modular Applied General Equilibrium Tool, as outlined by the European Commission, Joint Research Centre, and the MAGNET Consortium (Reference MAGNET2023) – is a global general equilibrium model designed with a modular structure, allowing it to be tailored to specific research questions, regions and sectors of interest (Figure 9). It analyses the impacts of agricultural, trade, land and bioenergy policies on the global economy, particularly focusing on land use, agricultural prices, nutrition and household food security. Covering 141 regions and 113 sectors, including agriculture, manufacturing and services, MAGNET provides detailed insights into the socio-economic impacts of policies, such as GDP, welfare, production, consumption and food security indicators. The model also generates projections on macroeconomic variables, production factors and environmental impacts such as greenhouse gas emissions. MAGNET utilizes data from sources such as the GTAP database, EU agricultural outlooks and FAOSTAT, and is synergistic with the models GCAM, GLOBIOM, IMAGE, MESSAGE-GLOBIOM, WaterGAP, AIM, EPPA, DSSAT, AIM/CGE and IMPACT for comprehensive assessments across various sectors.
Graphic representation of the MAGNET model. In this specific version two household types in Ghana are distinguished, and a nutritional module is added as post analysis. Source: Brinkman et al. (Reference Brinkman, Levin-Koopman, Wicke, Shutes, Kuiper, Faaij and Van Der Hilst2020)

Hydrological and Water Resources Models Relevant to Agriculture
Water Evaluation and Planning (WEAP) is a software tool developed by the Stockholm Environment Institute’s US centre, designed to support integrated water resources planning (Figure 10). It considers water supply, demand, quality and ecological factors to allocate water across agricultural, municipal and environmental uses. The tool features a water balance database, scenario generation tools and policy analysis functions to evaluate various water management options and their implications on water sufficiency, costs, environmental targets and uncertainties. WEAP models water demand, supply, runoff, stream flows, pollution and treatment under different policy, climate and cost scenarios. Its user-friendly interface presents results through maps, charts and tables, and it integrates with other models such as QUAL2K, MODFLOW, MODPATH, PEST, Excel and GAMS for comprehensive analysis.
WEAP schematic view (left side) and WEAP data view (right side) (Stockholm Environment Institute 2023)

Land, Crop and Food Production
IMAGE – Integrated Model to Assess the Global Environment is described on the Integrated Assessment Modeling Consortium webpage (n.d.) – was developed by PBL Netherlands Environmental Assessment Agency and launched in 1990. It is a comprehensive tool designed to assess the interactions between human activities and natural systems globally, with a focus on long-term sustainability. The model evaluates how socio-economic pathways – such as population growth, economic development and technological advancements – affect critical resources such as energy, land, water and biodiversity. IMAGE is particularly focused on addressing global challenges such as climate change, resource depletion and ecosystem service sustainability, projecting future scenarios up to 2100. By integrating a broad range of socio-economic and environmental factors, IMAGE provides insights into energy use, agricultural production, land use changes, emissions and carbon stocks. It also projects climate impacts, including greenhouse gas emissions, temperature and precipitation changes and sea level rise. The model’s output helps stakeholders assess resource limitations, climate impacts and sustainability challenges, providing a solid foundation for policy development and adaptive strategies (Figure 11). IMAGE can also be combined with the models MESSAGE, REMIND, WITCH, GCAM, TIAM and AIM, enabling holistic analyses of the food–water–energy nexus and contributing to informed decision-making in global sustainability.
Famework of IMAGE 3.0 version, taken from the PBL Netherlands Environmental Assessment Agency webpage

Food–Energy–Water Nexus Models
SIM4NEXUS is described on the Potsdam Institute for Climate Impact Research and the SIM4NEXUS project webpages. It is primarily focused on European systems. This model examines the interdependencies of water, energy, food and land, emphasizing policy interventions and climate adaptation. SIM4NEXUS aims to foster a transition to a resource-efficient, low-carbon economy by developing innovative methodologies and policy-design tools to close knowledge gaps related to the water–land–food–energy–climate Nexus, especially under climate change. It predicts the societal impacts of resource use and relevant policies on agriculture, biodiversity and ecosystem services using model-based analyses. Central to SIM4NEXUS is a cloud-based ‘serious game’, which allows users to simulate and evaluate policy decisions across scales from regional to global and over various time horizons. This game, validated through ten regional and national case studies as well as European and global scenarios, aims to support decision making and explore potential applications, with a business plan ensuring the long-term viability of the project’s insights and tools.
Agri-food Models in Modelling Suites
At this point, it is essential to emphasize the pivotal role of agriculture-focused IAMs in comprehensive modelling frameworks, where cross-disciplinary synergies – spanning economics, energy and climate – yield robust insights for sustainable policy design. These models link agricultural practices with emissions trajectories, guiding policymakers on achieving climate targets, as for example in the case of the EU Green Deal. Embedding them in integrated modelling suites enhances their credibility and solidifies their output as it decreases the level of arbitrariness in the choice of climate scenarios, trajectories of variables measuring economic activity (e.g., GDP growth and trade balance) and land availability considering geological developments. Furthermore, linking agriculture-specific models with economic, climate and energy models increases policy coherence across different sectors and fosters the development of holistic socio-economic pathways.
The European Commission employs model-based scenario quantification to support impact assessments and the evaluation of policy options. Scenario modelling generates updated greenhouse gas (GHG) emission reference scenarios for the EU and its Member States, reflecting current trends and policies, and is developed in consultation with Member State experts. The outcomes of policy scenarios provide critical analytical insights for assessing environmental, economic and social impacts, including cost-effectiveness and other multifaceted analyses addressing multiple objectives. The current suite of models, illustrated in Figure 12, has contributed to key initiatives such as the EU Reference Scenario 2020, policy scenarios for Delivering the European Green Deal, the impact assessment for the EU Climate Target Plan and the in-depth analysis of the EU Long-Term Strategy. This modelling framework spans the period from 1990 to 2050 in five-year intervals, encompassing all EU Member States and relevant neighbouring countries. The calculated impacts extend across various sectors, including energy, transport, industry, agriculture, forestry, land use, atmospheric dispersion, health, ecosystems (acidification and eutrophication), macroeconomics (multi-sectoral), employment and social welfare.
The modelling tools for EU analysis. Figure reproduced from the European Commission webpage regarding the modelling tools for EU analysis

Key agri-food IAMs, such as GLOBIOM and CAPRI, are integral to the European Commission Modelling tools for EU analysis (Figure 12). These models (GLOBIOM managing agriculture and land use sector for both global and EU forestry and land use, and CAPRI managing EU agriculture) interface with others, including GEM-E3 (economics), POLES-JRC and PRIMES (energy) and GAINS (non-CO2 emissions), to address sectors such as agriculture, land use and transport. For greenhouse gas emissions, CO2 is managed by PRIMES (energy) and GLOBIOM/G4M (land use), while GAINS covers non-CO2 gases (CH4, N2O, fluorinated gases and air pollutants). As presented in Figure 12, this modelling framework leverages developments across many aspects. Furthermore, the coupling of REMIND (energy–economy) with MAgPIE (land use–agriculture) further enables analysis of food security, water demands and land use under climate scenarios.
Finally, a key attribute of relevance for researchers and policymakers is the level of accessibility (or openness) of the agri-food IAMs, as it underpins the degree to which they can be broadly used to inform policymaking. Table 1 briefly summarizes the accessibility features of each of the 12 models.
IAMs accessibility

Agri-food IAMs High-level Assessment
Assessment Criteria
We established five key criteria for evaluating the 12 models focused on food security, land use and socio-economic systems and water management: (i) cost minimization; (ii) addressing nexus (the interdependence of water, food, energy, the economy, land use and climate); (iii) integration with other models; (iv) sectoral coverage, in the sense of diversity in economic sectors included; and (v) spatial and temporal resolution. We briefly elaborate on the rationale, operationalization, evidence base and scoring procedures for each criterion in this section.
Cost Minimization
We distinguish between models that explicitly use cost, welfare or utility optimization from the models that make simulations based on rules or priorities without endogenous cost minimization. Models that use intertemporal optimization or consider market clearing in their operations can be regarded as obtaining a high score level in this criterion, whereas models presenting a simulation model based on rules and priorities are considered as receiving a low score.
Other models with a medium level present partial/within-module optimization (optimizing one single sector or area or a period or a technical process/stage) or static linear programming (solved for a single time slice, or independently for each period) with no intertemporal linkages. We use model manuals and relevant scientific papers to specify the optimization method applied in the model (if any) to complete our assessment.
As an example, for high score levelled models REMIND or MAgPIE can be considered, due to their capability in intertemporal optimization, whereas GCAM presents market clearing. Similarly, G4M and TOA-MD present a medium level, owing to partial/within-module optimization. With the same approach, WEAP can be considered as a low level (regarding the cost minimization capability), due to its simulation characteristics.
Addressing the Interdependence Among Water Food Energy Land Use and Climate
This criterion evaluates the extent to which each agri-food IAM explicitly represents and analytically links multiple core system domains – namely water, food and agriculture, energy, land use and climate – within a single modelling framework or through structurally embedded modules. Models score highly under this criterion when they endogenously represent interactions across more than three of these domains, allowing feedback in one system (e.g., climate or energy prices) to influence outcomes in others (e.g., land allocation, crop production or water demand). Medium scores are assigned to models that consistently integrate two to three domains – such as agriculture–land use–climate or agriculture–water–economy – while treating remaining systems exogenously or through scenario assumptions.
Models that focus primarily on a single domain, or that include other domains only as fixed inputs or boundary conditions, receive a low score. Evidence for scoring is drawn from model documentation and peer-reviewed applications demonstrating multi-sectoral representation within a unified analytical structure. Importantly, this criterion does not require formal bidirectional coupling with external models; rather, it captures whether nexus interactions are explicitly represented in the model logic and outputs. Under this framework, MAgPIE, GLOBIOM and IMAGE achieve a high score, as they explicitly integrate land use, agricultural production, climate drivers, greenhouse gas emissions and – to varying degrees – water and bioenergy dynamics within a coherent modelling structure. Finally, G4M and TOA-MD are assigned a low score under this criterion. While G4M incorporates climate-sensitive forest growth and land-use profitability, its primary analytical focus remains forestry, with limited representation of food, water or energy systems. TOA-MD, in turn, excels at micro-level economic and environmental trade-off analysis but does not explicitly model broader system interdependencies across water–energy–land–climate.
Integration with Other Models
This criterion assesses the extent to which an agri-food IAM is structurally integrated with other models through established coupling frameworks, enabling consistent data exchange and feedback across sectors such as energy, climate, water, land use and the economy. The focus here is not on conceptual nexus coverage (addressed in the subsection on the interdependence among water food energy land use and climate), but on the technical depth, formality and reproducibility of inter-model linkages. A high score is assigned to models that employ formal, documented and bidirectional coupling with other IAMs or biophysical models, integrating gridded/remote-sensing-derived data via hard links, where outputs from one model directly influence the solution of another, often within iterative or shared-solver frameworks. Such integrations are typically maintained across multiple peer-reviewed applications and regions. Examples include the MAgPIE–LPJmL linkage, where grid-level crop yields, water constraints and carbon dynamics are endogenously resolved and feed back into land-use optimization, as well as the GLOBIOM–G4M pipeline, which links forest growth and carbon stock dynamics at grid-cell level with market equilibrium outcomes.
Appendix B briefly summarizes the degree of ‘hard’ integration of the 12 models covered. Similarly, REMIND–MAgPIE and SIM4NEXUS linkages exemplify structured multi-model integration across energy, land and food systems. A medium score is assigned to models that rely on soft links or modular integration, where data exchange occurs through harmonized inputs and outputs, calibration alignment or repeated scenario iteration, but without a shared solver or endogenous feedback loops. Models such as GCAM, CAPRI, IMPACT, FABLE and WEAP fall into this category. These models are frequently embedded in broader modelling suites (e.g., CAPRI–GAINS, GCAM with water and land modules) and make extensive use of outputs from other IAMs, yet retain independent solution structures. A low score reflects case-specific or ad hoc integration, where linkages are implemented manually, for a single application or without standardized documentation – such as one-off spreadsheet transfers or region-specific parameter copying. While useful for exploratory analysis, these approaches limit scalability, transparency and reproducibility. Overall, this criterion distinguishes models that function as interoperable components of integrated modelling ecosystems from those that primarily serve as standalone analytical tools, a distinction that is critical for robust science–policy applications and EU-level impact assessments.
Sectoral Coverage
This criterion evaluates the breadth of economic and biophysical sectors explicitly represented within each agri-food IAM, as well as the range of policy instruments and market mechanisms that can be analysed endogenously. Sectoral coverage is a key determinant of a model’s suitability for integrated policy assessment, as it conditions the ability to capture cross-sectoral spillovers, price feedback loops and distributional effects. Models receive a high score when they represent multiple interacting sectors – such as agriculture, forestry, energy, industry, services, households and factor markets – within a unified equilibrium or optimization framework, and when they can explicitly simulate a wide array of policy instruments. These instruments may include taxes and subsidies, carbon pricing, emissions trading systems, land-use regulations, trade policies and income transfers. MAGNET exemplifies this category, as its computable general equilibrium structure simultaneously clears goods and factor markets across regions, enabling endogenous feedback between agricultural policy, trade, income, consumption and environmental outcomes.
A medium score is assigned to models that cover a limited but coherent subset of sectors, typically centred on agriculture, land use, forestry and related markets, while treating the rest of the economy exogenously or through partial equilibrium assumptions. Models such as GLOBIOM, CAPRI and IMPACT fall into this category. These models provide rich detail on agri-food systems, land-use competition, trade flows and emissions, and they are well suited for sector-specific policy analysis. However, interactions with non-agricultural sectors – such as manufacturing, services or labour markets – are either simplified or imposed through external assumptions. A low score applies to models with a narrow sectoral focus or a primarily biophysical or farm-level orientation, where broader economic interactions are absent. Examples include hydrological or crop-growth models, as well as tools such as TOA-MD and G4M, which concentrate on specific production systems or land-use decisions without representing economy-wide feedback or policy-induced price adjustments. In summary, this criterion highlights the trade-off between sectoral depth and economy-wide scope.
Spatial and Temporal Resolution
This criterion assesses the spatial and temporal granularity at which each agri-food IAM represents system dynamics, as well as its ability to capture long-term processes and heterogeneity relevant for policy analysis. Spatial and temporal resolution jointly determine a model’s capacity to reflect local variation, represent biophysical processes and link global or regional scenarios to policy-relevant administrative units. Specifically, we account for the grid spatial unit used in a model (marked with a pixel in the screen and representing equal-angle tiles (e.g., 0.5° × 0.5°) or equal-area tiles (e.g., 10 × 10 km), or a basin, or a NUTS-2, or a country area) and if the time steps are on a monthly, annual, 5- or 10- (etc.) year basis. The explicit treatment of discounting and long-run welfare in applied resource assessments highlights how intertemporal choices can materially affect policy conclusions, a consideration that remains central for the evaluation of agri-food IAM scenarios (Birol et al. Reference Birol, Koundouri and Kountouris2010).
A high score is assigned to models that combine fine spatial resolution – such as grid-based representations, river basins or sub-national administrative units (e.g., NUTS-2) – with long-term time horizons extending to mid- or late-century, and with explicit intertemporal dynamics. These models can represent processes such as land-use change, forest growth, soil carbon dynamics, water storage and technology diffusion, and they allow aggregation or disaggregation across spatial scales. Examples include MAgPIE, which operates on a global grid and links to biophysical vegetation models; IMAGE, which combines grid-based land and environmental modules with regional economic and energy representations; and GLOBIOM/G4M, which resolve land-use and forestry dynamics at high spatial detail while projecting outcomes to 2050 or beyond.
A medium score is assigned to models operating at national or regional levels with annual or multi-annual time steps and medium- to long-term horizons. FABLE, for instance, applies country-level accounting with five-year steps from 2000 to 2050, enabling consistent long-term pathway analysis but limiting sub-national differentiation. CAPRI, with its NUTS-2 resolution for the EU, and IMPACT, with national to regional coverage and multi-decadal projections, also fall into this category.
A low score reflects models with coarse spatial units (e.g., large world regions or continents), short time horizons (typically up to 2030) or limited intertemporal structure. Such models may struggle to capture spatial heterogeneity, seasonal dynamics or slow-moving processes critical for climate and land-use policy, including forest age structure, reservoir dynamics or cumulative emissions. Overall, this criterion emphasizes that higher spatial and temporal resolution enhances policy relevance, particularly for evaluating region-specific impacts and long-term transitions, while acknowledging that coarser models may still be valuable for strategic, high-level scenario analysis when used in complementary modelling frameworks.
Assessment Summary
The assessment procedure consisted of thoroughly evaluating each model’s description to extract important information, analysing how each model addressed each criterion and assigning a strength level – high, medium or low; strong, moderate, normal or weak – to each characteristic. Assessing the score for these qualities in terms of strength enabled us to determine each model’s respective strengths and limitations, resulting in a clear comparison study. A traffic light scoring system was used to assign an ordinal performance level of high, medium or low performance across five criteria. The agri-food IAM Scoreboard is presented as a heatmap using a traffic light system (Figure 13) to provide a compact and systematic overview of how the reviewed agri-food IAMs perform across the five evaluation criteria. Each cell represents an ordinal classification of high, medium or low, reflecting the strength with which a given model addresses a specific criterion. These classifications are based on documented model structures, solution methods and evidence drawn from technical documentation and peer-reviewed applications discussed above.
Agri-food IAM Scoreboard heatmap

The heatmap is intended to support comparative interpretation rather than precise measurement. The colour coding conveys qualitative differences in model capabilities without implying cardinal distances between categories or aggregate performance rankings. Read horizontally, the heatmap highlights the relative strengths and limitations of individual models across dimensions relevant for agri-food policy analysis; read vertically, it illustrates how different models collectively address each evaluation criterion. In this way, the IAM Scoreboard serves as a structured visual synthesis of model heterogeneity, supporting informed model selection and combination in science–policy applications.
The distinct characteristics of each model provide specific capacities for addressing distinct research needs, as summarized in the IAM Scoreboard heatmap (Figure 13). This differentiation allows researchers to select models based on the features most relevant to their objectives. For example, FABLE excels in addressing the nexus between food, water and climate, as it directly handles input and produces output regarding agricultural production by product, GHG emissions, water use and biodiversity indicators. For this it receives a high score on the ‘Addressing Nexus’ field. This capability is particularly valuable for understanding how the intensity of resource use changes over time while tracking transformations in products – both in terms of innovations and the processes involved. For instance, plant-based meat can satisfy human dietary calorie needs differently compared with conventional lamb meat. As these two products vary in price and nutritional efficiency, the value added (calculated as price multiplied by quantity) between them changes, especially if conventional meat demand is replaced by plant-based alternatives. By contrast, being a scenario-based simulation accounting tool, it does not entail optimization techniques, justifying the low score in the ‘Cost Minimization’ category.
The lack of formal optimization strategies in the model render integration with other IAMs challenging. However, the rich set of outputs for the agri-food sector provides ample fodder for other models’ use as valuable inputs. For example, the detailed production trajectory for 88 agricultural products allows energy models to integrate them and calculate the economy’s potential for biofuel production (using data on corn, sugar and soybeans production inter alia). This attribute leads to the assignment of a medium score for ‘Integration with other Models’. As discussed, FABLE closely integrates the food and agricultural sectors and closely monitors the environmental assumptions and implications of its pathways. Nonetheless, there is no formal representation of the economic and energy sector that would augment its ‘Sectoral Coverage’, thus leading to a medium score in this aspect. Its spatial coverage is moderate as it applies to the national level; however, it describes the evolution of its projection along 5-year steps from 2020 to 2050. Therefore, it is assigned with a medium score for ‘Spatial and Temporal Resolution’.
MAgPIE stands out with its spatial resolution capabilities and satellite imaging integration, providing insights into crop yields and resource constraints that models such as FABLE, G4M and WEAP lack. Its production cost minimization through land-use modelling makes it particularly effective for food–water nexus analyses. G4M assesses profitability across forestry, agriculture and bioenergy sectors, achieving medium-scale sectoral coverage. It offers feasibility analysis for land use practices and supports forest management through carbon pricing mechanisms. When combined with GLOBIOM, G4M provides valuable data on afforestation and deforestation rates under climate policy scenarios, although GLOBIOM demonstrates stronger integration capabilities.
GCAM functions as a global framework analysing interactions between climate, land, energy, water and demographics. While effective for evaluating how global changes affect resource availability, it cannot capture satellite or real-time data, earning a moderate score for spatial data capabilities. Nevertheless, it excels in understanding cross-sector interactions and supporting policy analysis.
CAPRI offers model integration features but provides less extensive capabilities compared with other evaluated models. IMPACT and TOA-MD combine FABLE’s advantages with MAgPIE’s spatial data capabilities. IMPACT uses spatial data to simulate climate processes, while TOA-MD supports both explicit and implicit spatial analysis. However, MAGNET lacks the spatial data integration present in these models.
WEAP demonstrates strength in water resource accounting but lacks explicit cost optimization functionality. While it includes scenario, economic and sensitivity analyses that inform cost-related decisions indirectly, it requires expert interpretation to develop actionable management plans. Water allocation is often modelled with platforms such as WEAP and similar tools. These systems take predefined constraints, priorities and demands, and distribute water primarily according to the specified priorities. They typically need relatively few inputs and have low computational cost, so users can tweak parameters and see results quickly. However, to move from priority-based simulation to true optimization, the setup must include additional elements – such as explicit operating policies, decision variables and steps and objective functions – so the model can search for best-performing allocations rather than simply follow rules (Veintimilla-Reyes et al. Reference Veintimilla-Reyes, Meyer, Cattrysse and Orshoven2018). Therefore, it is evident that WEAP does not undertake cost optimization. If the user needs a cost optimization alongside WEAP, the common pattern is a soft link to an external optimizer, then iterate scenarios while WEAP provides physically consistent water allocations and reliability metrics.
In summary, models such as FABLE effectively describe projections related to resource intensity variability, while models such as MAgPIE, IMPACT and TOA-MD leverage satellite data to enhance their numerical analysis of climate and environmental interactions. GCAM and WEAP excel in representing water balance conditions at a regional level, with GCAM providing a more comprehensive exploration of the energy–water–land–socio-economic nexus.
Discussion
Agri-food IAMs are uniquely valuable tools for understanding the complex interactions between agricultural production, land use, water resources, energy demands and climate impacts. Food-focused IAMs should be seen as complementary, not competitive, as each model provides insights into distinct aspects of food system dynamics. By combining various IAMs, each with sectoral expertise, one can achieve more precise and nuanced predictions relevant to agriculture, forestry and land use (AFOLU) as well as their interactions with energy, emissions and water resources models. Leveraging these synergies allows IAMs to address multifaceted food security and sustainability challenges, such as climate adaptation, resource constraints and dietary changes, through integrated scenarios.
Downscaling agri-food IAMs to local contexts or specific sectors enhances spatial and temporal resolution of climate variables, enabling more context-specific analysis and reducing reliance on generalized assumptions, thereby improving the robustness and applicability of model outcomes for policy and planning. For instance, downscaling an IAM to analyse a country’s agricultural and food sector could provide insights into climate impacts on regional crop yields, irrigation requirements and land use shifts, as demonstrated on crop yields in Norway (Mohammadi et al. Reference Mohammadi, Rydgren, Bakkestuen and Gillespie2023). Additionally, IAMs focused on agriculture should integrate economic, energy and climate data, with a preference for indices that span multiple sectors, such as the Water–Energy–Food Index, ensuring that food system interactions with energy and environmental variables are accurately captured (Simpson et al. Reference Simpson, Jewitt, Becker, Badenhorst, Masia, Neves, Rovira and Pascual2022). By adopting system innovation frameworks, co-design platforms can be structured to iteratively integrate scientific projections with stakeholder priorities under uncertainty, improving both robustness and policy uptake of IAM scenarios (Alamanos et al. Reference Alamanos, Koundouri, Papadaki and Pliakou2022).
To maximize the effectiveness of agri-food IAMs, it is crucial to establish a structured approach for their use and integration. This involves defining the specific tools, data requirements and monitoring systems necessary for accurate assessments. Such integration would benefit from a certain degree of flexibility, allowing for cross-checks on common input parameters, alignment of calculation methods and consistency in calibration processes to ensure accuracy across models. A shared query tool that gathers individual data sets from original data sources data sets, including population trends, food demand, agricultural land prices and energy spot prices, could further enhance agri-food IAMs by adding critical inputs not readily available across all models. This would allow for the integration of data that goes beyond macroeconomic indicators, capturing real-time trends in food markets and welfare impacts on agricultural stakeholders.
Having said that, the development of a shared tool will contribute to addressing the shortcoming of arbitrary inputs in different IAMs, as highlighted inter alia by Pindyck (Reference Pindyck2013), by ensuring consistency, transparency, accuracy and structured comparison across models. Rather than relying on ad hoc parameter choices or opaque assumptions, our framework emphasizes clearly documented model structures, explicit evaluation criteria and traceable evidence drawn from manuals and peer-reviewed applications. By systematically comparing agri-food IAMs along well-defined dimensions, such as cost minimization, sectoral coverage, integration capacity and spatial and temporal resolution, the approach reduces discretionary interpretation and makes underlying assumptions more visible to users and policymakers. The explicit mapping of model linkages (e.g., CAPRI–GAINS, GLOBIOM–G4M) further limits hidden parameter assumptions by enforcing coherence between economic activity levels, land-use dynamics and emissions accounting. In addition, our proposal for a shared query tool that draws directly from original and frequently updated data sources (including population trends, food demand, agricultural land prices and energy spot prices) directly addresses Pindyck’s concern regarding arbitrary or weakly justified inputs, by strengthening empirical grounding, input traceability and cross-model consistency, while also enabling systematic sensitivity testing around key structural drivers.
At the same time, important limitations remain. While enhanced openness, documentation and model interoperability can mitigate concerns related to arbitrary inputs and improve reproducibility, agri-food IAMs still face challenges in representing deep uncertainty, non-linear dynamics and low-probability catastrophic outcomes emphasized by Pindyck (Reference Pindyck2013). These limitations underscore the need to interpret model outputs as scenario-based insights rather than precise forecasts, and to complement IAM analyses with sensitivity analysis, uncertainty assessment and plural modelling approaches when informing policy decisions. The Agricultural Model Intercomparison and Improvement Project (AgMIP) has provided a unified framework for improved representation in IAMs using a multi-model approach and data standardization for downscaling or upscaling climate impacts on agriculture (Ruane et al. Reference Ruane, Rosenzweig, Asseng, Boote, Elliott, Ewert, Jones, Martre, McDermid, Müller, Snyder and Thorburn2017).
Agri-food IAMs can be adapted for project-oriented applications, allowing for analysis of smaller, localized agricultural systems or facilities. For instance, models could be downscaled to study complex farm operations, multi-purpose energy platforms for food production or multi-agent agricultural facilities. IAMs adapted for such specific projects could provide granular insights using remote sensing data, assessing how individual farms or regional agricultural zones are affected by water scarcity, changing climate conditions or shifts in local energy markets. Another valuable adaptation could be the use of input-support tools for regression analysis as used in the Integrated Future Estimator for Emissions and Diets (iFEED), identifying how factors such as rainfall, fertilizer use or crop selection correlate with yield or carbon sequestration, which would enhance model calibration and accuracy for food system (Pasquel et al. Reference Pasquel, Cammarano, Roux, Castrignano, Tisseyre, Rinaldi, Troccoli and Taylor2023).
Scientific output and impact assessments used by researchers lack organization within a comprehensive framework that could systematically document and share outcomes across the research community. While traditional academic metrics such as Impact Factor (IF) and citation counts measure research influence, a structured framework would allow IAMs to demonstrate their specific contributions by tracking their application across research papers and projects. Hence, creating a library of publications would showcase their role in advancing scientific knowledge, catalysing new research directions and informing policy decisions related to food security. An archive of these studies would enable stakeholders to review practical applications in areas such as emissions mitigation, sustainable land use and climate adaptation, promoting the collaborative development of agri-food IAMs across different research domains.
Scientific knowledge derived from agri-food IAMs can significantly influence policy formulation by providing evidence-based insights and a comprehensive framework for assessing trade-offs, synergies and long-term implications of policies. Barreiro-Hurle et al. (Reference Barreiro-Hurle, Bogonos, Himics, Hristov, Pérez Domínguez, Sahoo, Salputra, Weiss, Baldoni and Elleby2021) illustrate how the European Commission utilized the capacities of the CAPRI model to assess key policies underpinning its Common Agricultural Policy. Encompassing data and inputs across sectors and through the integration with economic, energy and climate models, agri-food IAMs directly map agricultural practices and food system attributes to variables that constitute policy targets for all national authorities, such as GHG emissions, energy demand, health outcomes and economic growth. Finally, agri-food IAMs can highlight synergies and trade-offs for policymakers catering to a portfolio of targets across economic and societal sectors.
Conclusions
The research community has made significant advancements in developing and optimizing Integrated Assessment Models related to agriculture and food systems, enhancing their efficiency and relevance for policymaking in the field of sustainable food systems. Agri-food IAMs serve as indispensable tools for analysing the intricate dynamics of agricultural production, land- and water use, biodiversity, energy demand and climate interactions. Their potential to inform evidence-based policymaking in the realm of sustainable food systems is particularly vital as the European Union and other global stakeholders seek innovative solutions to balance food security, climate action and resource sustainability.
Agri-food IAMs are not standalone solutions but complementary tools, each offering unique insights into specific facets of agricultural dynamics. By leveraging synergies across models – integrating expertise from AFOLU, energy and water domain researchers can deliver more precise and nuanced projections. In addition, integrating agri-food IAMs in intricate modelling suites such as the ones described in this article reduces the degree of arbitrariness in assumptions and provides a holistic framework for scientific projections and policymaking. These integrated approaches enable the development of scenarios that address critical challenges, such as climate adaptation, resource constraints and shifting dietary patterns, fostering comprehensive strategies for food system resilience.
We provide an overview of 12 widely applied agriculture and agri-food IAMs, categorized based on their primary focus and specialization within the food system domain. This classification consists of four sub-groups: the Food Security, Land Use and Socio-economic Models group encompasses nine IAMs (FABLE, MAgPIE, G4M, GCAM, GLOBIOM, CAPRI, TOA-MD, IMPACT and MAGNET) and the Hydrological and Water Resources Models Relevant to Agriculture set is illustrated with the presentation of the WEAP model. The Land, Crop and Food Production set is represented by IMAGE and the group of Food–Energy–Water Nexus Models are exemplified by SIM4NEXUS. For each model, we provide a concise description of its primary functions, computational features, required inputs, outputs and potential synergies with other IAMs. Where available, schematic representations are included to enhance the understanding of the conceptual framework of each model. Additionally, we briefly discuss the integration of food system models with IAMs from other domains, such as energy and economic systems, supported by relevant examples.
We contribute to policy formulation and the functioning of the science–policy interface by primarily assessing the 12 IAMS with respect to their attributes related to cost minimization, addressing the water, food, energy and climate nexus, their integration with other models, the breadth of coverage of economic sectors and their degree of spatial and temporal resolution. The approach of model assessment enabled a comparative analysis of the most influential model’s capabilities and limits. FABLE demonstrates great efficiency in the description of the resource intensity capability while the product changes itself (it is differentiated with an innovative form along with a new process), as long as its Value Added (VA) and its capacity to cover specific needs change also. Other models such as MAgPIE, IMPACT and TOA-MD deploy data retrieval from maps, offering numerical analysis options with regards to climate and environmental conditions. Another important category is the models which are efficient in resource accounting, such as water management and the balance between physical availability and consumption, and this is a powerful feature for GCAM and WEAP. Especially for the latter, an additional significant feature is the way to look through the nexus between energy–land use, water resources and socio-economics key assumptions.
The models that were described and explored under thorough screening enable researchers to produce deliverables capable of achieving a bigger impact on policymaking. These deliverables can be adopted by the national, international or multinational entities (i.e., EU, UN) institutions and foundations. These models enable researchers to have interactive actions with communities and society since they offer capacity building potential in research methodologies and policy deliverables per sector, use and population target group, while they present the availability for downscaling policies in EU Member States.
The implications for EU agricultural and food policy are profound. With tailored IAM projections, policymakers can craft informed strategies that align with the Green Deal’s sustainability goals, optimize land and resource use and support climate-resilient food systems. Scientific evidence that builds alternative trajectories for food systems in the EU and beyond are material in informing the EU Common Agricultural Policy (CAP) and the national commitments enshrined in climate mitigation and adaptation plans. By prioritizing IAM development and collaboration, the EU can lead global efforts to transition toward sustainable and equitable food systems, addressing the interconnected challenges of food security, climate change and environmental stewardship.
AI-assisted Writing Disclosure
The authors used an artificial intelligence-based language model to assist with improving the clarity and readability of the manuscript. The AI tool was used exclusively for language editing and stylistic refinement. All scientific content, interpretations, and conclusions are the sole responsibility of the authors.
Appendix A: Additional Agri-food IAMs
SWIM – Soil and Water Integrated Model – is an eco-hydrological, process-based, semi-distributed model developed by the Potsdam Institute for Climate Impact Research, as introduced in the Institute’s report (Krysanova et al. Reference Krysanova, Wechsung, Arnold, Srinivasan and Williams2000). It simulates hydrology, water management and agriculture, often applied to river basins in Europe. SWIM has a 3-level structure (basin, subbasins and hydrotopes) and GIS support, offering balanced complexity by integrating hydrological, vegetation and nutrient processes more effectively than simpler models. Inputs include daily weather data, vegetation cover, crop types, land management practices, soil properties, elevation and slope information, hydrological data and agricultural management details. Outputs include river discharge, crop yield and nutrient levels, presented as time series and maps. SWIM has synergies with models such as MAgPIE, GCAM, LPJmL, REMIND, IMAGE and AIM.
WaterGAP, initially developed as a water resources model, has evolved to include agricultural demand modules, allowing it to project irrigation water use and assess its impacts on food security (Müller Schmied et al. Reference Müller Schmied, Cáceres, Eisner, Flörke, Herbert, Niemann, Peiris, Popat, Portmann, Reinecke, Schumacher, Shadkam, Telteu, Trautmann and Döll2021). In its latest version, WaterGAP v2.2d integrates data on water availability, demand and usage across sectors such as agriculture, domestic and industry, at both global and regional levels. It calculates annual water withdrawals for livestock, households and small businesses, while also estimating water needs for irrigated crops, considering factors such as climate, soil moisture, crop types and irrigation efficiency. The model helps assess water stress in agricultural regions, highlighting how water shortages may affect crop yields and food security. It also evaluates the impact of agricultural water withdrawals on river flows, groundwater and ecosystem health, distinguishing between blue water (surface and groundwater) and green water (rainwater stored in soil), which helps understand the reliance on different water sources in agriculture.
H08 is a global hydrological model designed to simulate the relationship between food production, water requirements and water availability, making it a valuable tool for understanding the food–water nexus (Ai and Hanasaki Reference Ai and Hanasaki2023). The model incorporates six sub-models, including land surface hydrology, crop growth, river routing, reservoir operation, environmental flow and water abstraction. Recent improvements, such as country-specific calibration and enhanced algorithms, allow H08 to more accurately simulate crop yields for key crops such as maize, rice and soybean, although it still has limitations in capturing interannual yield variability. It provides crucial insights into the role of irrigation in global food production, helping to assess how climate change and water scarcity may impact agricultural outputs.
H08 integrates diverse input data, including climate variables, atmospheric datasets, land use data and river routing information to simulate water loss, soil moisture, irrigation needs and crop yields. The model produces valuable outputs that inform water management strategies by analysing water availability, demand and the impact of agricultural water use on crop yields and ecosystem health. H08’s ability to integrate with the models REMIND, LPJmL, MAgPIE, GCAM, DICE, IMAGE and AIM enhances its capacity for comprehensive assessments of the food–water–energy nexus, aiding policymakers in addressing challenges related to food security, water management and climate change.
WBM – Water Balance Model, as discussed in Grogan Reference Grogan, Zuidema, Prusevich, Wollheim, Glidden and Lammers(2022), and developed by the University of New Hampshire – is a global hydrologic model used in various global assessments, simulating the land surface components of the global water cycle and including water extraction for use in agriculture and domestic sectors. The new version, WBM v.1.0.0, introduces water source tracking modules that analyse flow-path histories in water supply. What is more, the model can partition sources for each stock or flux. It includes three tracking categories: (a) primary water inputs to the terrestrial hydrologic cycle (liquid precipitation, snowmelt, glacier melt and unsustainable groundwater); (b) extracted water for human use that is returned to the hydrologic system; and (c) runoff from user-defined land units. This tracking enhances transparency, allowing users to understand the mechanisms behind simulated behaviours. WBM v.1.0.0 effectively simulates global river discharge and irrigation withdrawals, demonstrating how these fluxes are generated using the new tracking functions. Datasets of river networks, daily precipitation, daily average temperature, dams and reservoirs, soil available water capacity, root depth, glacier runoff, volume and area, crop maps and calendars, SW:GW ratio, irrigation efficiency and rice paddy percolation rate are used. Outputs include daily river discharge, monthly river discharge, annual discharge comparison, irrigation water withdrawals, levels of moisture content in the soil, total water loss from soil and plants, detailed accounts of water inputs and outputs for specific regions, insights on how precipitation translates to runoff. This model links to SWIM, GCAM, REMIND, LPJmL, IMAGE, AIM and MAgPIE.
SWAT – Soil and Water Assessment Tool, introduced on the SWAT Project Website (Texas A&M University n.d.), the USDA Climate Hubs Page (US Department of Agriculture n.d.) and the FAO Toolbox Entry (Food and Agriculture Organization of the United Nations n.d.) – is a comprehensive modelling tool designed to evaluate the impacts of land use and water management on both water quality and quantity, particularly in agricultural settings. It is highly effective for assessing issues such as agricultural runoff, soil erosion and crop yields at watershed scales. SWAT operates across a wide range of spatial scales, from small watersheds to large river basins, making it ideal for evaluating soil erosion control, managing nonpoint source pollution and supporting watershed management efforts. The model simulates daily water flow cycles, nutrient loading, crop growth and agricultural practices such as irrigation and fertilizer use. SWAT divides watersheds into subbasins and Hydrologic Response Units (HRUs), which allows for detailed, spatially explicit assessments of water resources. To function, SWAT requires a variety of input data, including weather variables (precipitation, temperature, solar radiation), land use, soil properties and digital elevation data (DEM) to define watershed boundaries and slopes. Agricultural practices, such as crop rotation, irrigation and fertilization, further enhance the model’s accuracy in simulating land management effects on water and soil. Outputs from SWAT include estimates of surface runoff, groundwater recharge, soil erosion, nutrient concentrations in water bodies and crop yield predictions. It also provides data on water quality indicators such as dissolved oxygen and suspended solids. SWAT is compatible with other tools, enhancing its functionality and ease of use. For instance, it integrates with ArcSWAT, QSWAT and MWSWAT, which enable users to visualize model inputs and outputs within geographic information systems (GIS). These synergies facilitate the practical application of SWAT for environmental management practices and policy evaluations, making it a valuable resource for stakeholders involved in land and water resource planning.
LPJmL – Lund–Potsdam–Jena managed Land – is a dynamic global model that integrates vegetation, hydrology and crop growth to assess the interactions between water, agriculture and carbon under changing climatic conditions. Developed by the RD1 and RD2 working groups at PIK, it simulates carbon and water cycles for both natural and agricultural ecosystems, incorporating processes such as photosynthesis, plant growth, soil moisture and hydrology. LPJmL is unique for its detailed representation of carbon, nitrogen and water flows, including bioenergy production and land use dynamics. The model uses spatially explicit data on climate, land use, soil and river flow, providing simulations at a global scale, from daily to annual outputs for both natural and managed landscapes. Its results include carbon storage, carbon exchange, soil moisture, evapotranspiration, runoff, river flow and crop yields, offering insights into how land use and climate change impact both ecosystems and agriculture. Additionally, LPJmL is linked to other models such as MAgPIE and IMAGE and is integral to the POEM and PIAM frameworks (Potsdam Institute for Climate Impact Research n.d.a).
CLM – Community Land Model, presented in University Corporation for Atmospheric Research (n.d.) and Lawrence et al. (Reference Lawrence, Fisher, Koven, Oleson, Swenson, Bonan and Zeng2019) – is the land part of the CESM (Community Earth System Model) and the Community Atmosphere Model (CAM), used in both global and regional modelling systems to simulate the interactions between land, climate and ecosystems. CLM integrates key processes such as hydrology, biogeochemistry, dynamic vegetation and human influences, focusing on how ecosystems – both natural and managed – affect climate through energy, water and gas cycles. It models processes such as vegetation structure, photosynthesis, carbon–nitrogen cycling, land cover changes and hydrological dynamics, providing insights into how ecosystems influence climate and respond to climate change. With recent updates improving accuracy, CLM now offers better representation of hydrological and ecological processes, including a more detailed depiction of land management practices. The model is rigorously evaluated and linked to other models, such as MESSAGE, IMAGE, GCAM, AIM, LandSHIFT and COMET-AB, making it an essential tool for understanding land–atmosphere interactions and climate dynamics. Its inputs include climate data (temperature, precipitation, solar radiation, wind speed), vegetation type, soil properties, agricultural practices and land management. Outputs include carbon storage, emissions, water fluxes (evapotranspiration, runoff, soil moisture), plant growth, energy balance and nutrient cycling.
EPIC – Environmental Policy Integrated Climate (European Commission. Joint Research Centre n.d.b), developed by the USDA – is a model used to assess the environmental and economic impacts of agricultural practices on soil, water and nutrient management. It simulates around 80 crops and evaluates their effects on soil erosion, water quality and crop yields, integrating field-scale agricultural activities such as crop rotation, irrigation and nutrient application. EPIC is particularly valuable for monitoring greenhouse gas fluxes, hydrology, erosion and nutrient cycling, providing insights into sustainable land management and the impacts of climate change on agriculture. The model’s accuracy in simulating historical agricultural conditions makes it a reliable tool for forecasting future global agricultural trends. EPIC is used worldwide by institutions such as IIASA and offers a user-friendly interface (WinEPIC) for practical application. The model utilizes inputs such as daily meteorological data, soil profiles, land use and agricultural practices, and produces outputs related to biomass production, nutrient losses, crop yields and hydrology. It tracks issues such as nitrogen leaching, sediment transport, greenhouse gas emissions and soil carbon sequestration. EPIC can be integrated with other models, including IMAGE, MAGNET, MAgPIE, GLOBIOM and GCAM, to support comprehensive assessments of agriculture, water and emissions, enhancing its ability to inform policy and environmental decision-making.
Other models, such as DSSAT (Decision Support System for Agrotechnology Transfer) and AgMIP (Agricultural Model Intercomparison and Improvement Project), provide valuable tools for assessing agricultural systems under changing conditions. DSSAT models crop growth, water and nutrient requirements for various crops, incorporating different climate, soil and management scenarios to predict crop yields. AgMIP serves as a collaborative platform that integrates various crop models, including DSSAT and APSIM, to generate projections on climate impacts, crop yields and water use, helping improve the accuracy and consistency of agricultural projections across diverse regions. These models are critical for understanding the agricultural dimensions of climate change and supporting informed decision-making in agricultural management.
CLEWs – Climate, Land, Energy and Water strategies framework (International Atomic Energy Agency 2017) – is designed to analyse interlinkages among resource systems to understand how food, energy and water production and land use contribute to climate change, as well as how climate change, in turn, impacts these systems. The framework assesses pressure points and explores ways to reduce trade-offs while enhancing synergies, involving a robust quantification process. This approach requires the development of sector-specific models (water, energy and land use) that consider varying climate futures, with applications across geographical scales – from global to regional, national and urban levels. CLEWs models offer flexibility in analytical complexity: they can use simple accounting frameworks, develop sectoral models that are soft-linked iteratively or integrate interactions within a single modelling tool to explore key nexus questions. At the urban level, the CLEWs framework has been applied successfully in New York City to investigate water and energy interventions and examine cross-sectoral impacts of resource management. The tool is continually enhanced through collaboration with the United Nations Department of Economic and Social Affairs (UNDESA) and the United Nations Development Programme (UNDP), forming an essential part of the Global OpTIMUS (Open Tools, Integrated Modelling and Upskilling for Sustainable Development) community of practice.
Appendix B: Model Integration
Besides the accessibility of the models, another important aspect is the integration of gridded/remote-sensing-derived data via hard links (for instance, in the case of the MAgPIE–LPJmL and G4M/GLOBIOM pipelines) in opposition to the IAMs using exogenous inputs. Each of the 12 aforementioned models is further classified based on whether it uses hard-linked, endogenous integration, meaning that spatial data dynamically influence model outcomes within a unified computational framework, or exogenous inputs, where spatial data are used for calibration, parametrization or scenario setting without bidirectional feedback. This classification follows.
FABLE is characterized by an exogenous data integration mode. It is an Excel-based accounting tool that relies on global datasets, such as FAOSTAT, and user-provided national/subnational data. It does not embed gridded biophysical processes. Spatial data are used exogenously to define scenarios and calibrate pathways but do not dynamically interact with the model’s core calculations (Mosnier et al. Reference Mosnier, Penescu, Pérez Guzmán, Steinhauser, Thomson, Douzal and Poncet2020).
MAgPIE has a hard-linked endogenous integration mode. It is directly coupled with the dynamic vegetation model LPJmL at a 0.5° × 0.5° grid resolution. Crop yields, water constraints and carbon dynamics from LPJmL are endogenously embedded into MAgPIE’s land-use optimization, allowing for bidirectional feedback between land-use decisions and biophysical conditions (Dietrich et al. Reference Dietrich, Bodirsky, Humpenöder, Weindl, Stevanović, Karstens, Kreidenweis, Wang, Mishra, Klein, Ambrósio, Araujo, Yalew, Baumstark, Wirth, Giannousakis, Beier, Chen, Lotze-Campen and Popp2019, Reference Dietrich, Bodirsky, Weindl, Humpenöder, Stevanovic, Kreidenweis, Wang, Karstens, Mishra, Beier, Molina Bacca, Klein, Ambrósio, Araujo, Biewald, Lotze-Campen and Popp2020).
G4M has a hard-linked endogenous integration within the GLOBIOM pipeline. G4M operates at grid-cell level and is integrated with GLOBIOM in a coupled pipeline. It uses spatially explicit data on forest growth, carbon stocks and land rents to inform deforestation/afforestation decisions, with outputs consistently aggregated into GLOBIOM’s market equilibrium framework (Gusti Reference Gusti2015; Havlík et al. Reference Havlík, Valin, Herrero, Obersteiner, Schmid, Rufino, Mosnier, Thornton, Böttcher, Conant, Frank, Fritz, Fuss, Kraxner and Notenbaert2014).
GCAM has an exogenous data integration mode. It utilizes gridded datasets for water availability, crop yields, etc., as exogenous inputs for calibration and scenario definition. These data are not dynamically updated within GCAM’s market equilibrium solution, instead, they inform baseline parameters and constraints (Calvin et al. 2019).
GLOBIOM is hard-linked endogenous with G4M. It integrates grid-level data on land productivity, carbon stocks and water use through its coupling with G4M and other biophysical models. This facilitates the endogenous representation of land-use competition and environmental feedbacks within a partial equilibrium framework (Havlík et al. Reference Havlík, Valin, Herrero, Obersteiner, Schmid, Rufino, Mosnier, Thornton, Böttcher, Conant, Frank, Fritz, Fuss, Kraxner and Notenbaert2014).
CAPRI integrates exogenously. It applies spatially detailed data such as NUTS-2 agricultural statistics and land use maps, for calibration and scenario setup. These data are not hard-linked to dynamic biophysical processes and they serve as static inputs to the economic model (CAPRI Modelling Consortium 2023; Britz et al. Reference Britz, M’barek, Burrell and Delincé2012).
TOA-MD is exogenously integrated, utilizing farm- or region-level data on yields, soils and climate to simulate adoption impacts. Although it can incorporate spatial variability, it does not dynamically couple with gridded biophysical models, data are input exogenously (Britz et al. Reference Britz, M’barek, Burrell and Delincé2012; Oregon State University n.d.).
IMPACT integrates exogenously, incorporating spatial data on climate, water and crop yields through soft links to biophysical models, such as DSSAT. These data inform scenario parameters but are not endogenously updated during model runs (Robinson et al. Reference Robinson, Mason-D’Croz, Islam, Sulser, Robertson, Zhu, Gueneau, Pitois and Rosegrant2015).
MAGNET is exogenously integrated, applying regional and sectoral data from sources such as GTAP and FAOSTAT. It may incorporate spatially explicit assumptions exogenously but does not feature hard links to gridded biophysical models (MAGNET Consortium, 2023; Brinkman et al. Reference Brinkman, Levin-Koopman, Wicke, Shutes, Kuiper, Faaij and Van Der Hilst2020).
WEAP is integrated exogenously with optional soft links. It uses GIS-based data on hydrology, land use and demand nodes to simulate water allocation. While it can integrate spatially explicit datasets, these are typically input exogenously. WEAP does not endogenously couple with dynamic crop or vegetation models (Stockholm Environment Institute 2023).
IMAGE is of a hybrid integration type, where it integrates endogenously within the IMAGE framework and exogenously with other models. It uses internally a 0.5° grid for land and environment modules, with endogenous feedbacks between land use, vegetation and climate. When it is linked to other models, such as energy models, the data exchange is accomplished through exogenous scenarios or soft links (PBL Netherlands Environmental Assessment Agency n.d.; Integrated Assessment Modeling Consortium n.d.).
SIM4NEXUS is characterized by exogenous scenario-based integration. It uses spatially explicit data for nexus analysis but operates as a serious game and scenario exploration tool. Data are exogenously input to define case studies, there is no hard-linked bidirectional coupling with dynamic biophysical models (SIM4NEXUS n.d.; Potsdam Institute for Climate Impact Research n.d.b). Table B1 sums up each IAM’s integration of data and the respective links.
IAMs integration of data and respective links


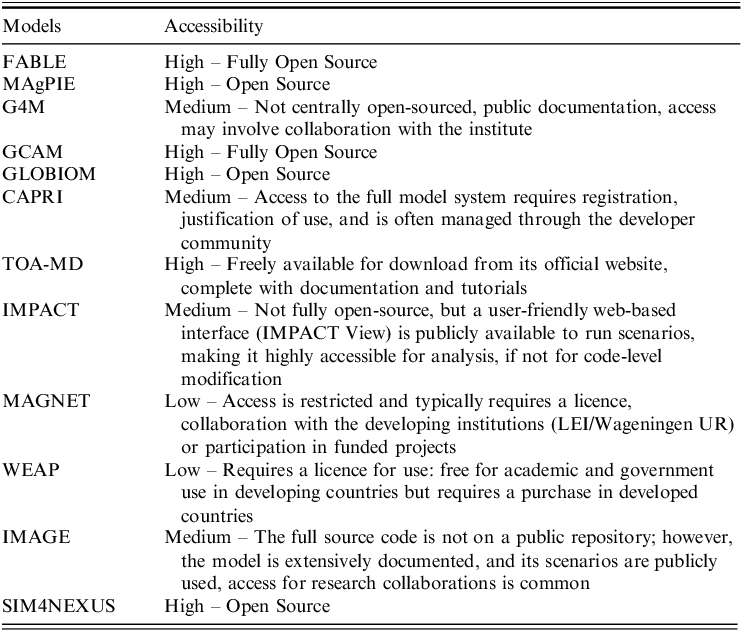

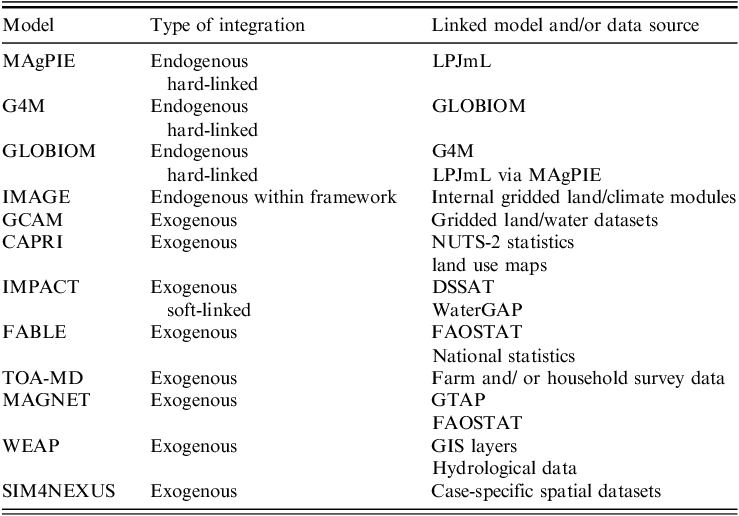

 Open access