

Introduction
Rugged terrain, defined here as local variation in elevation, is a landscape characteristic with complex and often contradictory impacts on the size, geographic distribution, and economic vitality of locations. While rugged terrain may have positive economic impacts on a location through tourism and migration (Moss Reference Moss2006; Rudzitis Reference Rudzitis1999), it may also hinder the expansion of settlements and the accessibility of hospitals, schools, social services, grocery stores, and other critical destinations. This negative impact may be a particular issue for rural areas, as residents often need to travel to more urban locations for specialized goods and services.
Community resilience consists of interconnected social, ecological, economic, and cultural dimensions (Machado and Coleman Reference Machado and Coleman2023). The benefits associated with rugged terrain, including recreation, tourism, and increased population through migration, may provide longer-term prosperity and increased resilience to economic downturns. These advantages may be associated with the community’s ability to sustain itself through transformation (Magis Reference Magis2010). However, the hindrances associated with rugged terrain may make rural communities and their residents more vulnerable to short-term economic shocks and natural disasters. The additional difficulty associated with obtaining food, health care, and other goods and services from larger urban centers would make it difficult to provide for community members, especially in cases where wildfires, earthquakes, flooding, and other natural disasters have affected the passability of roads. Rugged terrain increases the costs of providing and maintaining power lines and internet service, making repairs more difficult and increasing the vulnerability of those communities. Understanding where these vulnerabilities may exist can help communities plan for shocks, increasing their overall resilience (Magis Reference Magis2010, Cox and Hamlen Reference Cox and Hamlen2015).
To better understand the positive and negative impacts of rugged terrain on communities, two national representations of variable topography were developed by the U.S. Department of Agriculture’s Economic Research Service (ERS). These representations were introduced in Dobis et al. (Reference Dobis, Cromartie, Williams and Reed2023) and characterize the relative topographic variation among U.S. census tracts in 2010. The Area Ruggedness Scale (ARS) has six categories that describe the ruggedness of the overall landscape in a census tract as level to extremely rugged. While the Road Ruggedness Scale (RRS) has five categories that describe the ruggedness along roads and highways as level to highly rugged. These ordinal categories represent relative increases in the ruggedness of land in census tracts and allow for flexibility in defining which locations are considered rugged and which are not.
The Area and Road Ruggedness Scales data setFootnote 1 contains the first ruggedness measures with full nationwide coverage and is the first with a roads-only ruggedness measure (the RRS). By including just topographic variation along roads in a given census tract, the RRS more accurately depicts the relative difficulty of traveling across varying types of terrain to access resources. Census tracts are geographic units commonly used by social science researchers, Federal agencies, policymakers, and practitioners, making the Area and Road Ruggedness Scales data set an excellent resource to better understand and address issues of rural development, demographic change, and individual and community well-being (such as resiliency and vulnerability). However, requests for county-level versions of the ARS and RRS arose soon after publication, which was unsurprising given the dominance of counties in the study of natural amenities and their impact on demographic change and rural development (e.g., McGranahan Reference McGranahan1999, Hunter et al. Reference Hunter, Boardman and OngeSaint2009, Slack and Jensen Reference Slack and Jensen2020).
Researchers may be interested in using a county-level ruggedness measure for certain applications, particularly in situations that preclude using census-tract-level data. Existing county-level measures of terrain are limited and tend to focus on broader-scale land surface form classifications, such as plains, hills, or mountains. Since the ARS and RRS describe local changes in elevation, they can provide unique insights into topographical variation compared to commonly used county-level measures.
In this paper, we suggest several methods that could be used to aggregate the census-tract-level Area and Road Ruggedness Scales data set to counties. We then explore the effectiveness of the aggregated county-level ruggedness measures in a practical research application. We aggregated the census-tract ARS to counties using several different methods and analyzed the correlation between those measures and nonmetropolitan (nonmetro) net migration patterns.
Natural amenities such as a pleasant climate, appealing landscapes, and access to bodies of water have long been recognized as key determinants of regional growth and migration patterns (Ullman Reference Ullman1954; Graves Reference Graves1976, Reference Graves1979, Reference Graves1980; Deller et al. Reference Deller, Tsung-Hsiu, Marcouiller and English2001; Glaeser et al. Reference Glaeser, Kolko and Saiz2001; Rappoport Reference Rappaport2007; Partridge Reference Partridge2010; Rickman and Wang Reference Rickman and Wang2020). While less attention has been paid to the relationship between migration and topographic amenities, they have been shown to be an important factor (McGranahan Reference McGranahan1999, Reference McGranahan2008; Cordell et al. Reference Cordell, Heboyan, Santos and Bergstrom2011). These studies typically use topography measures from the ERS Natural Amenities Scale, which details the most prominent landform within a county.
To evaluate the effectiveness of the aggregated area ruggedness measures, we compared their relationship with net migration patterns to that of the topography measure from the ERS Natural Amenities Scale, an established predictor of net migration to nonmetro areas (McGranahan Reference McGranahan1999, Reference McGranahan2008). Using correlation parameters and descriptive regressions, we find that the aggregated county-level area ruggedness measures and the Natural Amenities Scale’s topographic measure have similar positive associations with net migration. However, we find that the aggregated county-level area ruggedness measures do not capture certain landscape features that positively influence migration that the Natural Amenities Scale’s topographic measure does. Therefore, the method chosen to aggregate the census-tract-level data to counties should be tailored to the project.
In section 2, we discuss the methodology used to create the ARS and RRS, followed by a description of the ARS in section 3. Section 4 contains our suggestions on how to aggregate the ARS and RRS data to counties and the statistical analysis of the effectiveness of these suggestions. Section 5 discusses the limitations of the Area and Road Ruggedness Scales data set, and section 6 contains the conclusion.
Methodology
We wanted our measures of rugged terrain to be detailed enough to depict the local differences in elevation that define rugged terrain. They also needed to be statistically consistent throughout the United States. Finally, we wanted a method that was flexible enough to be implemented for varying geographic units (e.g., counties, census tracts). Our methodology, introduced in Dobis et al. (Reference Dobis, Cromartie, Williams and Reed2023), includes all three of these elements.
The method we used to create the ARS and RRS has three steps. In the first step, we calculated a grid-cell terrain ruggedness index (TRI). In the second step, we aggregated the grid-cell-level TRI values to census-tract-level values. In the third step, we classified the census-tract-level values into discrete categories.
Step 1: calculating TRI
The first step in creating the ARS and RRS is calculating the underlying grid-cell TRI, a measure of topographic heterogeneity developed by Riley et al. (Reference Riley, DeGloria and Elliot1999). The TRI is the sum of the difference in elevation between a grid cell and its adjacent neighbors. It is calculated for each grid cell within the input digital elevation model (DEM). Each grid cell, ${x_{ij}}$
, is identified by its location (i, j) within a group of nine adjacent grid cells, where i = {–1, 0, 1} indicates the horizontal location and j = {–1, 0, 1} indicates the vertical location. The TRI of grid cell (0,0) is calculated as:
${x_{ij}}$
, is identified by its location (i, j) within a group of nine adjacent grid cells, where i = {–1, 0, 1} indicates the horizontal location and j = {–1, 0, 1} indicates the vertical location. The TRI of grid cell (0,0) is calculated as:
 $$TR{I_{00}} = \Upsilon {\left[ {\sum {{\left( {{x_{ij}} - {x_{00}}} \right)}^2}} \right]^{{1} \over{2}}},$$
where ${x_{00}}$
is the elevation of grid cell (0,0) and
${x_{00}}$
is the elevation of grid cell (0,0) and ${x_{ij}}$
is the elevation of each of the neighboring grid cells (i,j). Figure 1a illustrates the computational window used to calculate the TRI of each grid cell. If there is no grid cell in one of the adjacent positions, it is omitted from the calculation (see Figure 1b).
${x_{ij}}$
is the elevation of each of the neighboring grid cells (i,j). Figure 1a illustrates the computational window used to calculate the TRI of each grid cell. If there is no grid cell in one of the adjacent positions, it is omitted from the calculation (see Figure 1b).
Computation window for terrain ruggedness index values.
Note: When calculating the Area TRI for grid cell, x 00 , all eight adjacent, neighboring grid cells are used. However, when calculating the Road TRI for grid cell, x 00 only the adjacent, neighboring grid cells in which a road is present are used. Source: Authors’ illustration.

The TRI values produced depend on the spatial resolution of the data set used as an input. The finer the resolution of the data, the smaller the resulting TRI values, as the difference in elevation values between grid cells is smaller. If too fine a spatial resolution is chosen, it will be difficult to capture the overall elevation change in larger landforms. However, if too coarse a spatial resolution is chosen, the elevation change experienced by individuals on a day-to-day basis will not be captured. There is also a trade-off between resolution and computation time; the higher the spatial resolution, the longer computation takes. We chose median elevation from the 7.5 arc-second Global Multi-resolution Terrain Elevation Data 2010 (GMTED2010) as the input DEM to create our TRI values (U.S. Geological Survey and National Geospatial-Intelligence Agency 2010). The GMTED2010 is a publicly available Federal data set that has national coverage at a consistent spatial resolution, and the 7.5 arc-second resolution results in grid cells that are approximately 231 by 231 meters at the equator.
The difference between the ARS and RRS is due to different inputs in step 1 of the process. To create the ARS, our input to equation (1) was a DEM containing all grid cells in the United States (approximately 263 million). The result was a grid cell data set of Area TRI values. To create the RRS, the input DEM was slightly different. We used ESRI’s U.S. and Canada Detailed Streets (2012) data set to determine which grid cells in the DEM contained roads of any type (i.e., highways, arterial, collector, local, and semi-private). The resulting roads-only DEM, containing approximately 47 million grid cells, was our input to equation (1) to create the RRS. The result was a grid cell data set of Road TRI values. Figure 1 shows how the computational neighborhoods for the Area TRI and Road TRI correspond with the scenarios discussed earlier.
Step 2: aggregating to tracts
The second step in creating the ARS and RRS is aggregating the grid-cell TRI values to census tracts. Figure 2 provides several examples of census tracts and the grid cell TRI values that are aggregated in step 2. To aggregate the TRI values, zonal statistics operations were performed on both grids, using zones defined by 2010 TIGER/Line census tracts (U.S. Bureau of the Census 2012). Each summary statistic produced by the operations emphasizes a different aspect of the topography within a census tract, so ERS’s Area and Road Ruggedness Scales data set contains the mean, standard deviation, median, minimum, maximum, and range of Area and Road TRI values within a census tract, as well as the number of grid cells aggregated to obtain those values.
Examples of Area TRI grid cell values within census tracts.
Note: For illustrative purposes, grid cells were classified into five categories using their Area TRI value. The lightest shade indicates the highest Area TRI values, which have most topographic variation, while the darkest shade indicates the lowest area TRI values, with have the least topographic variation. Any perceived differences in color between the maps are due to the scale needed to show the entire census tract.Source: Authors’ illustration using the Global Multi-resolution Terrain Elevation Data 2010 from the U.S. Department of the Interior, U.S. Geological Survey and U.S. Department of Defense, National Geospatial-Intelligence Agency; and 2010 census tract TIGER/Line boundary files from the U.S. Department of Commerce, Bureau of the Census.

The TRI values could be aggregated to a variety of geographic units (e.g., census blocks, counties, land parcels, catchments). Census tracts made the most sense as the geographic unit for the ARS and RRS. As social scientists, we needed a geographic unit for which socioeconomic data is generally produced, allowing the data to be easily used for research. To be of use to policymakers, we needed a geographic unit that could also be easily identified for policies and legislation. We also needed a geographic unit for which a measure of rurality exists. Census tracts are the smallest geographic unit that satisfies all these criteria. Finally, census tracts also provide a more accurate description of an area’s topography than a larger geographic unit, such as a county, would.
Due to the size of counties (especially in the Western United States) and the incredible topographic differences that can exist across them, we feel that creating ARS and RRS measures at the county level using the grid-cell TRI values would not result in a useful proxy for the diversity of landscape features. However, we recognize that many researchers use counties as their unit of analysis. In section 4, we offer some suggestions on how to create county-level measures of topographic variation using the census-tract Area and Road Ruggedness Scales data.
Step 3: creating discrete categories
The third step in creating the ARS and RRS is classifying the census-tract-level values created in step 2 into discrete categories. We use the mean Area TRI and the mean Road TRI values within census tracts for this classification. The mean accounts for both the frequency and range of TRI values within a census tract, representing both very rugged (high TRI) and very flat (low TRI) topography, even though they do not compose the majority of the land within the census tract.
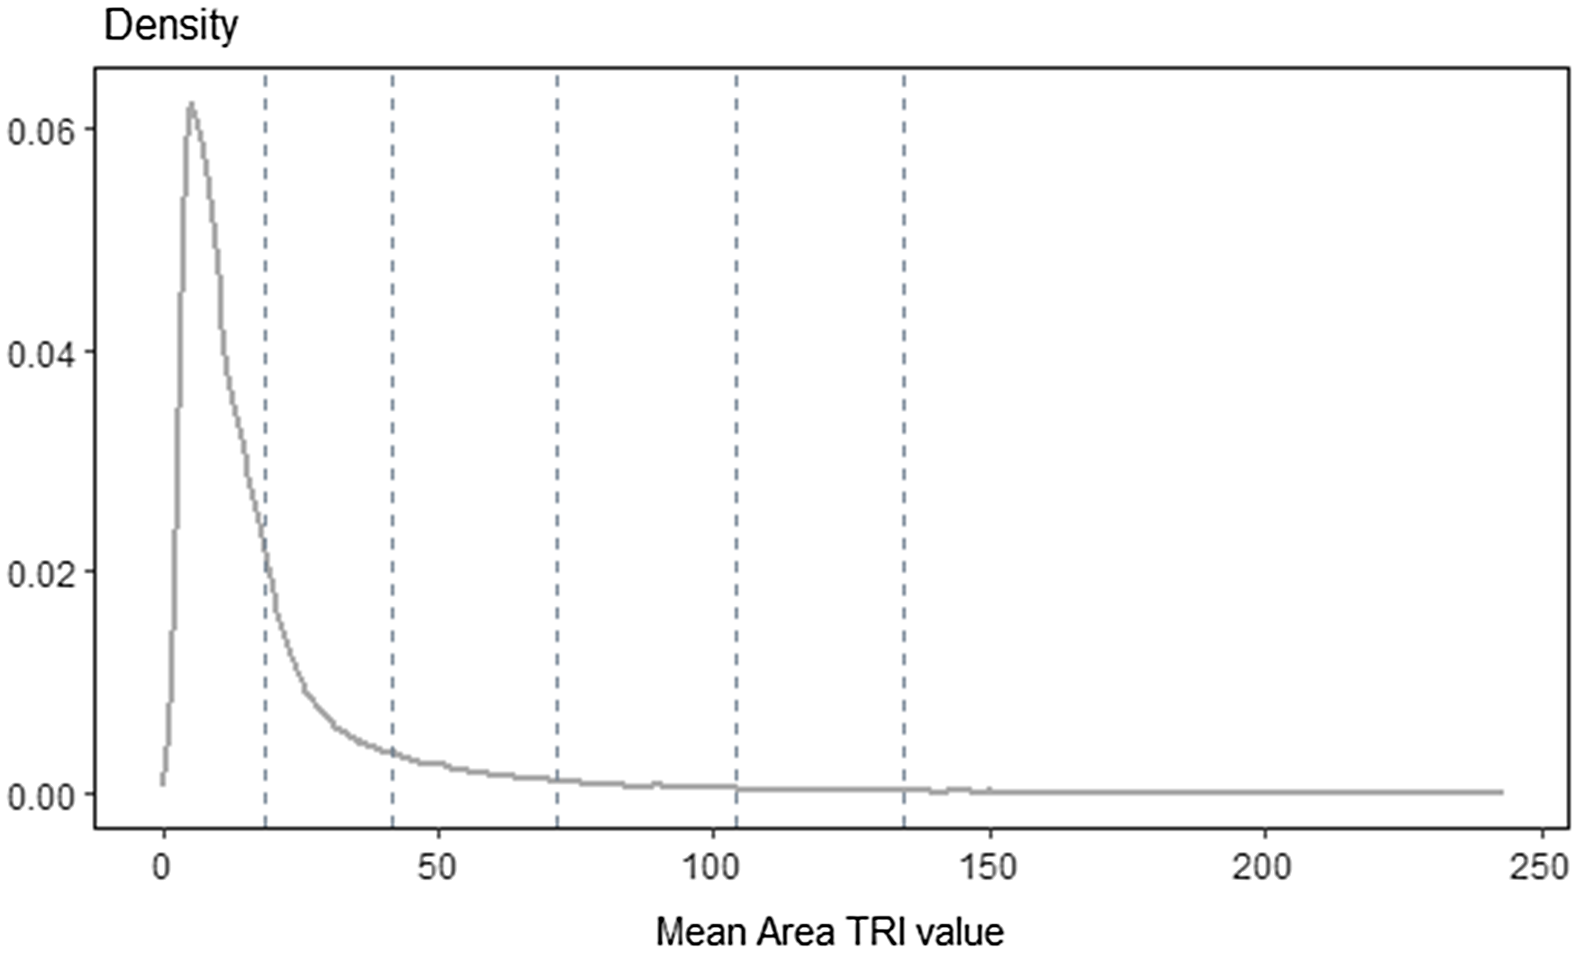
Analyzing the mean Area TRI values across census tracts, we find that the data are highly skewed with a long right tail and no clustering (Figure 3). The mean Road TRI data display the same characteristics. Therefore, the head/tail breaks classification method introduced by Jiang (Reference Jiang2013) is best suited to classifying the mean Area and Road TRI values into discrete categories. The head/tail breaks classification method places more emphasis on differentiating among high TRI values, allowing it to emphasize the greater impact of more rugged land on human activity. However, because the head/tail breaks classification relies upon the distribution of the underlying data to partition it into discrete categories, the number of categories and range of values within each category is unique to each distribution.
Distribution of census tract mean Area TRI values.
Note: Vertical lines represent thresholds between categories, as calculated using the head/tail breaks method. The flatter the census tract’s land, the lower the mean Area TRI, so category 1 – level is on the far left and category 6–extremely rugged is on the far right.Source: 2010 Area and Road Ruggedness Scales, U.S. Department of Agriculture, Economic Research Service.
We classified the mean Area TRI value of each census tract into one of six ARS categories, ranging from category 1–level to category 6–extremely rugged. These ARS categories compare changes in elevation for the overall landscape within a census tract with the overall landscape in all other census tracts in the United States. We classified the mean Road TRI value of each census tract into one of five RRS categories, ranging from category 1–level to category 5–highly rugged. These RRS categories compare changes in elevation in places where people travel within a census tract with where people travel in all other census tracts. For more details on the creation of the ARS and RRS, see Dobis et al. (Reference Dobis, Cromartie, Williams and Reed2023).
The Area Ruggedness Scale
The ARS is a classification of overall topographic variation within census tracts. It has six ordinal categories: 1–level, 2–nearly level, 3–slightly rugged, 4–moderately rugged, 5–highly rugged, and 6–extremely rugged. These categories are relative; each indicates a census tract’s topographic variation in comparison to other census tracts.
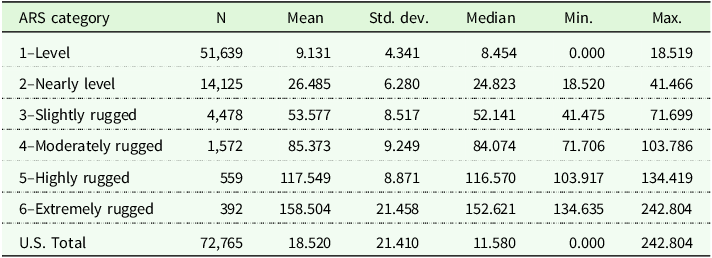
Each of the 72,765 land-based census tracts in the United States was classified into one of the six ARS categories based on its mean Area TRI. Summary statistics describing the mean Area TRI of the census tracts in each ARS category are available in Table 1. The table clearly illustrates that the share of census tracts in each ARS category decreases as the overall landscape becomes more rugged. Most census tracts (71.0 percent) are classified as level (category 1), indicating they have the least variation in the overall landscape. Nearly level (category 2) is the next largest, with 19.4 percent of census tracts. The remaining 9.6 percent of census tracts are classified as moderately to extremely rugged (categories 3–6).
Census-tract Area TRI summary statistics by Area Ruggedness Scale category
Source: 2010 Area and Road Ruggedness Scales, U.S. Department of Agriculture, Economic Research Service.
Figure 4 is a map of the ARS, where the lightest shade represents category 1, which has the most level land. The darkest shade represents category 6, which has the most rugged land. The shading reveals geographic patterns that are similar to those of a topographic relief map, indicating that, overall, the ARS is a good measure of relative variation in landscapes across the United States.
Map of the Area Ruggedness Scale.
Note: The ARS is a six-category ordinal measure of topographic variation ranging from level to extremely rugged. Level census tracts are represented by the lightest shade. The shading becomes darker with each successive category, representing an increase in topographic variation. The categories and range of Area TRI values within each are: 1 – level, 0.0 m to 18.5 m; 2 – nearly level, 18.5 m to 41.5 m; 3 – slightly rugged, 41.5 m to 71.7 m; 4 – moderately rugged, 71.7 m to 103.9 m; 5 – highly rugged 103.9 m to 134.4 m; and 6 – extremely rugged, 134.4 m to 242.8 m.Source: 2010 Area and Road Ruggedness Scales, U.S. Department of Agriculture, Economic Research Service.

The Rocky Mountains are clearly visible in the Western United States, with clusters of extremely rugged census tracts in western Montana and the Idaho panhandle (e.g., Bitterroot and Salmon River Mountains), east of the Great Salt Lake in Utah (Wasatch Range), and in west-central Colorado roughly coinciding with the Colorado Mineral Belt. The Sierra Nevada mountains are also visible in eastern California, as is the Pacific Mountain System (e.g., Cascade Range, Klamath Mountains, and Coast Ranges) along the Pacific Ocean in Washington, Oregon, California, and Alaska.
The Appalachian Mountains are clearly visible in the Eastern United States, stretching from western Maine down to northeastern Alabama. There are clusters of extremely rugged census tracts within this stretch, particularly the southern Blue Ridge Mountains (Tennessee-North Carolina border) and the Cumberland Mountains (Kentucky-Virginia border into West Virginia). In contrast, the Great Plains, Corn Belt, and coasts of the Atlantic Ocean and Gulf of Mexico are relatively level. Prominent exceptions to this are the Ozark and Ouachita Mountains (Arkansas, Missouri, and Oklahoma), the Black Hills (South Dakota), and the Driftless Area (western Wisconsin).
For a map of the RRS and a similar description of the underlying census tract data, see Dobis et al. (Reference Dobis, Cromartie, Williams and Reed2023).
Extending the ARS to counties
Many social scientists conduct research using counties as their unit of analysis. However, because of the topographic heterogeneity inherent within many counties given their size, using the Area TRI and Road TRI to create county-level ARS and RRS measures using the methodology described in section 2 may not be appropriate. Nonetheless, information provided in the Area and Road Ruggedness Scales data set can be used to create a county-level ruggedness measure suitable for specific research projects.
One strategy is to calculate the weighted average of the census tract mean TRI values within each county. This will create a continuous value that can be classified into groups if needed. For most applications, the number of grid cells aggregated within each census tract (the “count” variable, which is a measure of land area) should be used to weight the mean TRI values because the ruggedness scales are measures of land topography. Using population instead of grid cell counts creates a weighted average that reflects the topography of more populated areas, which may be relevant for some studies but will generally have less topographic variation. This will understate the actual amount of topographic variation within the county. Using the grid cell count rather than the land area is particularly important when working with the mean Road TRI because only the land (grid cells) with roads were used to create the input DEM.
If discrete ruggedness categories are needed, the counties can be classified into categories using the head/tail breaks method or another more appropriate method based on the distribution of the weighted averages.Footnote 2 Creating a new set of categories with thresholds unique to counties is essential because weighted average county data will have a different range and distribution of values, so census-tract thresholds will not work to distinguish the relative area or road ruggedness among counties.
Another way in which researchers may create a county-level ruggedness measure is by using the mode of the census tract ARS or RRS values within a county. This method assigns the most common census-tract ruggedness type (e.g., level, slightly rugged) to the county. This would emphasize the ruggedness of more populated (urban) locations, as there are more census tracts in these areas. Similarly, other summary statistics of the ARS or RRS categories could be used. For example, the maximum ARS or RRS category within the county would apply the most rugged census tract value to the whole county, while the median category would downplay the topographic extremes in the county.
Census tract summary statistics, such as a census tract’s minimum or maximum grid cell value, could be used in a similar way. Assigning the maximum TRI to the county would apply the most rugged grid cell value to the county, while the minimum TRI would emphasize the least rugged grid cell. In this case, the TRI value of an approximately 0.05 square kilometer piece of land would represent the entire county. The standard deviation of TRI values would emphasize topographic variation within the county, without giving undue weight to the extremes. One way to use the census-tract TRI standard deviation to create a county-level measure is calculating a pooled standard deviation. The county-level pooled standard deviation is a weighted average of the census-tract standard deviations. By combining the TRI standard deviation (variance) of different tracts, weighted by the number of grid cells in each tract, it provides a single measure reflecting the overall variability across all tracts within a county.
Another method researchers could use to create a county-level ruggedness measure is the share of census tracts in the county assigned a specific ARS or RRS category. For example, the share of census tracts within the county that are categorized as extremely rugged by the ARS may be used. Or, if a broader classification is desired, perhaps the share of census tracts considered moderately to extremely rugged by the ARS. Again, these shares could be based on the grid cells within a census tract rather than the number of census tracts to emphasize land area rather than population.
We have provided suggestions that utilize either the discrete ARS and RRS categories or the continuous Area TRI and Road TRI values, as well as weighted and unweighted options. This list of suggestions is by no means exhaustive. Ultimately, if a county-level measure of ruggedness is needed, the choice of method used should be tailored to the purpose of the research.
County-level area ruggedness measures, natural amenities, and migration
In this section, we put some of our aggregation suggestions into practice and explore options for county-level area ruggedness measures based on the ARS. We aggregated the data provided in ERS’s Area and Road Ruggedness Scales data set to the county level using four of the suggested techniques. We then compared our ARS-based ruggedness measures to the topography measure from the Natural Amenities Scale (U.S. Department of Agriculture, Economic Research Service 1999) by analyzing their relationship with rural net migration patterns through correlation parameters and descriptive regressions. This comparison allows us to evaluate the similarity of our aggregated local ruggedness measures to a standard measure of a county’s overall topography.
The Natural Amenity Scale’s topography measure classifies counties into one of twenty-one categories based on their most prevalent land surface form. Land surface forms take more than local ruggedness into account. They also account for the profile and local relief of the land within several miles of a location (Karagulle et al. Reference Karagulle, Frye, Sayre, Breyer, Aniello, Vaughan and Wright2017). Essentially, within a land surface form, there can be areas of both high and low ruggedness, and the overall impression is the land surface form.
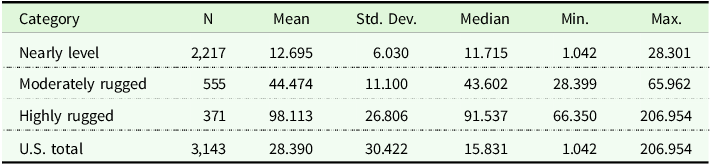
We used several of the methods described in section 4 to create county-level area ruggedness measures. These include county-level weighted mean Area TRI values, the maximum Area TRI value within each county, the mode of ARS categories within each county, and a county-level pooled standard deviation of the Area TRI standard deviations.Footnote 3 We also classified the weighted mean Area TRI values into categories using the head/tail breaks method. Summary statistics describing the weighted mean Area TRI of the counties in each of the three categories are available in Table 2. Like the tract-level measures, most counties (70.5 percent) are classified in the lowest ruggedness category, nearly level. However, the top two ruggedness categories have more similar shares, with 17.7 percent of counties considered moderately rugged and 11.8 percent considered highly rugged.
County weighted mean Area TRI summary statistics by ruggedness category
Source: 2010 Area and Road Ruggedness Scales, U.S. Department of Agriculture, Economic Research Service.
After creating the county-level area ruggedness measures, we analyzed their correlation with nonmetropolitan (nonmetro) net migration patterns and compared these correlations to those of the topography measure in the Natural Amenities Scale. Our net migration data come from two sources. Decadal net migration rates from 1970 to 2020 are from the Applied Population Laboratory at the University of Wisconsin – Madison (Egan-Robertson et al. Reference Egan-Robertson, Curtis, Winkler, Johnson and Bourbeau2024). We also analyzed net migration rates from 2020 to 2023 using the Vintage 2023 County Population Totals and Components of Change from the U.S. Census Bureau’s Population Estimates Program (2024). Correlation parameters between each county-level topography measure and decadal net migration rates are available in Table 3.
Correlation between county-level topography measures and nonmetro net migration rates, 1970–2023

Note: Nonmetropolitan counties lie outside Metropolitan Statistical Areas, as defined by the Office of Management and Budget.
Source: Net Migration by Decade from the University of Wisconsin’s Applied Population Laboratory; 2010 Area and Road Ruggedness Scales, Natural Amenities Scale, and 2013 Rural-Urban Continuum Codes from the U.S. Department of Agriculture, Economic Research Service.
Despite differences in the magnitude of the correlations across decades, several commonalities emerge over time. First, the weighted mean Area TRI and the Natural Amenities Scale topography code exhibit similar correlations with nonmetro net migration rates in each period. Second, the county-level mode of the census tract ARS classifications tends to be less correlated with nonmetro net migration than the other county topography measures. However, between 1980 and 1990, it is the strongest correlate among these measures. Third, both the maximum Area TRI and the pooled standard deviation Area TRI measures show stronger correlations with nonmetro net migration than the Natural Amenities Scale topography measure in each decade. Finally, the pooled standard deviation Area TRI is consistently the most highly correlated measure with nonmetro net migration among all the topography measures (except from 1980 to 1990).
The weighted mean Area TRI, maximum Area TRI, and pooled standard deviation Area TRI all have relatively high correlations with the Natural Amenities Scale topography measure. Because the county-level area ruggedness measures and the Natural Amenities Scale topography measure are highly correlated to each other and are similarly correlated with rural net migration patterns, this analysis suggests that the county-level area ruggedness measures provide a complementary measure for topographical amenities.
To further analyze the suitability of using these county-level area ruggedness measures to capture the benefits and hindrances of topographic variation in nonmetro areas, we conducted a series of descriptive OLS regressions (Table 4). These regressions incorporate climate and water measures from the original Natural Amenities Scale, county-level topography measures, population density, and state fixed effects to explain nonmetro net migration rates between 2010 and 2020. We want to determine whether the county-level area ruggedness measures significantly correlate to net migration rates after controlling for other natural amenities. Significance indicates that the association between the benefits and hindrances of rugged terrain is being captured. Additionally, these regressions allow for more nuanced comparisons between the county-level area ruggedness measures and the ERS Natural Amenities Scale topography measure.
OLS regressions of 2010–20 net migration rates on amenities in nonmetro counties, with differing topography measures

Note: State clustered standard-errors are given in parentheses. Only nonmetro counties are included. Nonmetropolitan counties lie outside Metropolitan Statistical Areas, as defined by the Office of Management and Budget.
Significance Codes: ‘***’ 0.01, ‘**’ 0.05, ‘*’ 0.1.
Source: Net Migration by Decade from the University of Wisconsin’s Applied Population Laboratory; 2010 Area and Road Ruggedness Scales, Natural Amenities Scale, and 2013 Rural-Urban Continuum Codes from the U.S. Department of Agriculture, Economic Research Service.
We find that the weighted mean Area TRI, pooled standard deviation Area TRI, and maximum Area TRI are associated with higher net migration rates from 2010 to 2020 after accounting for other natural amenities, population density, and state fixed effects. These positive coefficients indicate that the benefits of ruggedness outweigh the hindrances, making it primarily an amenity (rather than an overall disamenity). However, while the pooled standard deviation Area TRI is highly statistically significant (1 percent level), the weighted mean and maximum Area TRI are only statistically significant at the 10 percent level.
Additionally, the Natural Amenities Scale topography measure explains more than twice the variation in net migration between 2010 and 2020 than the pooled standard deviation Area TRI measure after controlling for other location characteristics. The weighted mean Area TRI and maximum Area TRI measures explain even less. This suggests that while the county-level ruggedness measures can act as a proxy for the amenities of land surface forms in this setting, they do not capture all landscape characteristics that are attractive to migrants. This is because the county-level area ruggedness measures only capture the local variability in terrain, rather than the overall impression of the landscape. It is likely this impression and the outdoor activities associated with more mountainous locations that are not captured by the county-level area ruggedness measures. There may also be some important discontinuities in the value of ruggedness that are captured by the discrete ordinal Natural Amenities Scale categories but are not by the continuous area ruggedness measures.
While the Natural Amenities Scale’s topographic measure effectively captures the overall county-level landscape amenities, it is not appropriate in all situations. For example, county-level road ruggedness measures based on the RRS may capture disamenities caused by barriers to travel or infrastructure development that the Natural Amenities Scale’s topographic measure cannot adequately address. This could prove particularly useful as the disamenities imposed by ruggedness have yet to be thoroughly explored (Dobis et al. Reference Dobis, Cromartie, Williams and Reed2023). Due to the relative lack of census-tract-level data on socioeconomic concepts, county-level measures may be necessary to conduct research on such topics.
Although the ARS was intended to be a more geographically granular measure, it performs well when aggregated to a broader geographical level. However, researchers should be cautious of potential issues that may arise. Counties, especially those in the western United States, can be quite large. This can mask the variation among the underlying census tracts, let alone the underlying grid cells. While this is also a concern for the tract-level data, the impact could be much greater for a county-level measure. The level of concern will vary according to the research question, so researchers should use caution when taking this approach.
Limitations
The Area and Road Ruggedness Scales data set is a multifaceted tool that can be used to understand the unique role of rugged terrain as both a benefit and hindrance. But it does have a few limitations. First, anomalies may exist in the input data sources that would affect the calculation of the grid cell and aggregate TRI measures. For example, satellite measurements may have difficulty distinguishing between terrain and tall buildings and falsely report elevation at roof level instead of ground level. Anomalies like this could affect the classification of census tracts in the ARS and RRS, but we do not possess the intimate local knowledge necessary to identify and correct possible anomalies within the input data.
A second limitation of the ARS and RRS is that they are relative scales, which allow for comparisons to be made among census tracts within each data set but not between them. This is because the mean Area and Road TRI values have different ranges and frequencies, leading to different thresholds when using the head/tail breaks method to classify the census tracts into categories. For example, a census tract with a value of 70 meters for both the mean Area and Road TRI would be classified as a highly rugged RRS census tract but would be a slightly rugged ARS census tract.
A third limitation of the ARS and RRS is that geographic aggregation leads to information loss. While we have done our best to retain as much information as possible by including Area and Road TRI summary statistics, some information is inevitably lost. This issue is exacerbated by the inconsistent size of census tracts. Census tract boundaries are drawn with a target population size in mind, so in sparsely populated rural areas, they can be quite large and are sometimes coextensive with counties. Therefore, large topographic differences can exist across census tracts. Additionally, physical features such as mountain ridges are used as census tract boundary lines. This means that census tracts may contain both relatively sparsely populated features with large changes in elevation, as well as more densely populated, flatter features.
This is a particular challenge in the Western United States and may lead to the topographic variation being “averaged out.” Nevada is an excellent example of this. The majority of census tracts in Nevada are classified as category 3–slightly rugged, making the entire state seem to have a relatively uniform topography. However, Nevada has several mountain ranges running North-South, including the Schell Creek Range in White Pine County, that are separated by more level land (see Figure 2b). White Pine County in east-central Nevada is 8,900 square miles and only has three census tracts. Therefore, the mean Area TRI values for these three census tracts account for both the flat and rugged parts of the county, averaging to a value that classifies the tract, as a whole, as slightly rugged.
This limitation could be ameliorated by aggregating to a smaller geographic unit, such as a census block. However, this limits the usefulness of the data for research and policymaking as it is incredibly difficult to obtain socioeconomic data at that level, particularly in rural areas. So, to address this issue, we included the summary statistics of the grid cells within each census tract in the Area and Road Ruggedness Scales data set. The standard deviation and range of Area TRI values within census tracts like those of White Pine County, Nevada, indicate the presence of the topographic variation hidden by the large size of the census tracts and can be used, as necessary, to account for that topographic variation.
Finally, while this is not necessarily a limitation, we’d like to highlight that there is a difference between ruggedness (i.e., change in elevation) and landforms (e.g., mountains, plateaus, hills). Ruggedness is only one component of landforms and cannot be used interchangeably. It is important to keep this in mind when utilizing the Area and Road Ruggedness Scales data set.
Conclusion
The Area and Road Ruggedness Scales data set is a multifaceted tool that may be useful for researchers, Federal agencies, policymakers, and practitioners to understand the unique role of rugged terrain as both a benefit and hindrance to economic development and well-being, especially for rural communities. These benefits and hindrances ultimately affect the vulnerability and resilience of rural communities. However, there are a number of limitations with these products, one of which is that researchers cannot always use census tracts as their unit of analysis.
In situations where research is being conducted using counties, it is necessary to appropriately aggregate the ruggedness measures. The aggregation methods suggested in this paper help make the ARS and RRS available for broader use. These methods are tailored to maintain maximum information available in the Area and Road Ruggedness Scales data set while being mindful of the limitations caused by the relatively larger size and heterogeneity of counties. Specific methods may be more or less suitable given specific goals of the research and differences in local settings, so researchers who apply these techniques to the Area and Road Ruggedness Scales data set or another measure should consider which is most appropriate.
We chose four of the suggested aggregation methods – weighted mean Area TRI, maximum Area TRI, mode ARS, and pooled standard deviation Area TRI – and used simple correlation statistics to measure their relative power to explain variation in nonmetro county net migration rates over several decades. We also compared the ability of these county-level ruggedness measures to explain variation in net migration between 2010 and 2020 within a regression model that controls for other explanatory variables, including climate, water bodies, population density, and state fixed effects.
Our analysis finds that, despite data loss due to aggregation, three of the four county-level area ruggedness measures show stronger correlation with net migration in all decades from 1970 to 2020 than the topography measure from the ERS Natural Amenities Scale does, with one exception. This indicates that these new measures are reasonable proxies for the overall landscape. The pooled standard deviation TRI measure showed the strongest correlations with net migration from 2010 to 2020 in both the correlation parameter analysis and the larger regression model. However, the Natural Amenities Scale topography measure is more highly correlated with net migration within the regression model, suggesting that its land surface forms capture more of the overall amenities associated with rugged terrain than topographic variation alone.
The methods demonstrated here using the ARS can also be used with the RRS to create county-level road ruggedness measures. It is worth investigating the degree to which summary statistics based on the RRS differ in their ability to explain variation in net migration and other socioeconomic variables. This opens up possibilities for new research on both the positive and negative impacts of rugged terrain on individuals and communities, including their vulnerabilities and resilience, using the Area and Road Ruggedness Scales data.
Data availability statement
All data used for this manuscript are freely available in the public domain.
Funding statement
This research was supported by the U.S. Department of Agriculture, Economic Research Service. The findings and conclusions in this publication are those of the authors and should not be construed to represent any official USDA or U.S. Government determination or policy.
Competing interests
The authors declare none.


 Open access

