


1 Introduction
The empirical analyses in 408 of 899 articles with nonlinear models published between January 2006 and January 2020 in the top three political science journals—the American Journal of Political Science, American Political Science Review, and Journal of Politics—include multiplicative interaction terms.Footnote 1 The proliferation of interactive nonlinear models in the political science literature is a welcome development, and we should not expect a decline in their number in the future. That is mainly because most theoretical expectations in social sciences are conditional in nature and, therefore, call for empirical models that are flexible enough to incorporate such conditionality.
More often than not, researchers expect their variables of interest to exert an effect only in specific contexts. For example, a long-standing tradition in electoral studies has argued that permissive electoral institutions lead to larger party systems only when the social structure is conducive to the proliferation of political parties (e.g., Amorim Neto and Cox Reference Amorim Neto and Cox1997; Ordeshook and Shvetsova Reference Ordeshook and Shvetsova1994). It is thus a widely accepted practice to include a multiplicative interaction term in the model when such a conditional expectation is present.Footnote 2 The ability of interactive models to capture the conditional effects of explanatory variables presents not only an opportunity but also a challenge. Brambor, Clark, and Golder (Reference Golder2006) give valuable advice on how to deal with the dependence of the effect of a variable of interest on the conditioning (also called the moderator) variable. The authors recommend holding the variable of interest at its mean and then plotting its marginal effects across the in-sample range of the conditioning variable. In this procedure, all variables—except for the conditioning variable, but including the one whose effect the researcher is theoretically interested in assessing—are set to their sample means.
We take as given that the goal of those studies is to estimate and characterize how the typical effect of their main explanatory variable varies with the values of the conditioning variable. We show in this article that the practice of using the mean value of the primary explanatory variable might not help achieve this goal when we estimate nonlinear models. There are at least three reasons for this. First, the effect of a variable at its mean might not be the typical effect of the variable, even if the variable’s mean is close to the typical values of that variable. Second, the distribution of the main variable might vary at different values of the conditioning variable, which, among other things, means that the combination of the global mean of the variable of interest and a given value of the conditioning variable might not be representative of all combinations of the values of these variables in the sample. Third, in rare cases, the global mean of a variable might be sufficiently far from the bulk of the data and make the estimates of the variable’s effect at its mean excessively model-dependent (King and Zeng Reference King and Zeng2006).
This article’s main goal is to encourage researchers to pay more attention to the distribution of the variable of which the marginal effect they assess, particularly how it is jointly distributed with the conditioning variable. We also propose two procedures that can help researchers characterize how the typical effect of the main explanatory variable varies in the sample (and with the values of the conditioning variable) by relying on the observed values of all covariates included in the model. First, we compute what we call the “Distribution-Weighted Average Marginal Effect” (DAME), a function of the values of the conditioning variable that summarizes the in-sample marginal effects. This procedure aggregates the marginal effects, weighting them by their conditional frequency at specific values of the conditioning variable. The second approach involves plotting marginal effect estimates based on all observed (i.e., in-sample) values using a three-dimensional plot (e.g., a contour plot or heatmap). To make the most of this simple graphical tool, we set the other covariates, not shown on the vertical and horizontal axes, to their central values, which is a concession to the average value approach but necessary for graphical interpolation. To illustrate how these techniques would work in practice, we replicate estimations presented in some highly cited studies, apply these techniques, and compare the conclusions against what we would obtain by following the conventional practices and computing the marginal effects at means.
In the next section, we focus on nonlinear models with interaction terms and introduce two sources of variation in the substantive and statistical significance of the estimated effects of constitutive variables. We then discuss the marginal effect at means approach to exploring the variation of the effect of the main variable as a function of the values of the conditioning variable. Next, we explain some potential problems that stem from the variation in the values of the variable of interest or both constitutive variables. The following section lays out our first proposed procedure—plotting the marginal effects at in-sample values, whereas we elaborate on the DAME approach in the following section. The concluding section discusses our replication analyses’ theoretical and empirical implications and two recommended methods for calculating and interpreting estimated effects of constitutive variables in nonlinear models.
2 Nonlinear Models with Interaction Terms
Models with interaction terms and generalized linear models (GLMs) are two variants of regression analysis that have become standard prescriptions for their respective uses in the last decades. The researcher’s expectation about the variation in the effect of an explanatory variable drives the choice to include an interaction term in a regression model. Whenever the theory suggests that the effect of the variable of interest (X) on the dependent variable (Y) varies depending on the values of a third variable (Z), the researchers include a multiplicative interaction (product) of these covariates on the right-hand side of the regression equation. A typical linear regression with an interaction term would thus be formulated as:
 $$ \begin{align} Y= \beta_0 + \beta_1X + \beta_2Z + \beta_3XZ + \epsilon. \end{align} $$
The type of the dependent variable typically drives the choice to use a nonlinear GLM. For instance, as Supplementary Appendix A shows, it is the standard practice among political scientists to employ logistic or probit regressions when the dependent variable is binary. On the other hand, if the dependent variable is a count of events or objects, researchers tend to revert to a Poisson or negative binomial regression (or their zero-inflated variants). Other types of limited dependent variables can also be used with GLMs as long as the researcher specifies an appropriate link function for the distribution of the dependent variable. A typical GLM can be written as:
 $$ \begin{align} Y= f(\beta_0 + \beta_1X + \beta_2Z) + \epsilon, \end{align} $$
where $f()$
is a strictly increasing nonlinear function. This (inverse link) function “links” the linear expression with the covariates’ values to the dependent variable’s expected value. For example, the inverse logit function connects the linear expression on the right-hand side of the model to the probability of the dependent variable taking the value of 1 in logistic regression, and the exponential function connects the linear expression to the expected number of events/objects in Poisson regression.
$f()$
is a strictly increasing nonlinear function. This (inverse link) function “links” the linear expression with the covariates’ values to the dependent variable’s expected value. For example, the inverse logit function connects the linear expression on the right-hand side of the model to the probability of the dependent variable taking the value of 1 in logistic regression, and the exponential function connects the linear expression to the expected number of events/objects in Poisson regression.
When the dependent variable is limited, and theory suggests that the effect of one of the variables depends on a third variable, as noted above, it is increasingly common to introduce an interaction term on the right-hand side of the model.
 $$ \begin{align} Y= f(\beta_0 + \beta_1X + \beta_2Z + \beta_3XZ) + \epsilon, \end{align} $$
To interpret regression estimates, researchers would like to understand whether the variable of interest has a statistically significant effect on the expected value of the dependent variable (e.g., the probability of the dependent variable being 1 in logit or probit or the expected count in the count models) and comment on the strength (i.e., substantive significance) of this effect. The marginal effect of a variable is a quantity of interest commonly representing such an effect. It is the expected change in the dependent variable in response to a small change in (and only in) the variable of interest. There are two major ways of calculating marginal effects. The first one is to compute the partial derivative of the function that returns the expected value of the dependent variable with respect to the variable of interest (i.e., the partial effects method). One can think about this value as the slope of a tangent to the model prediction curve (Agresti and Finlay Reference Agresti and Finlay2014). Accordingly, this approach is particularly appropriate with continuous covariates, where such a curve is meaningful.
The second common approach is to estimate the difference in the dependent variable that results from an increase of a specific magnitude in the variable of interest: a unit increase, a standard deviation increase, or a change from its minimum to its maximum value (i.e., the first-difference method). Even though this approach is particularly appropriate when the variable of interest is discrete, Long and Freese (Reference Long and Freese2005) also recommend using this method with continuous variables since it is easier to see the empirical content behind discrete increases in a covariate than differential changes implied in the partial effects method. One of the caveats of this approach is that the produced value depends, in addition to the targeted value of a covariate, on where we land after making the discrete step from that value (the size of the step and the direction in which we are making this step). Thus, when used with continuous variables, this approach makes the user responsible for choosing a substantively meaningful increment. Suppose, for example, that our variable of interest is the vote share and ranges from 0.1 to 0.7. A unit increase from any of its values will land outside its in-sample range. In this case, a 0.1 or 0.01 unit increase would thus be a more meaningful increment.
For convenience, below we talk primarily about the marginal effects computed as derivatives. In our examples, we use the partial effects method to characterize a marginal effect when the covariate is continuous and the first-difference method when the covariate can take on a limited number of unique values (as Greene Reference Greene2020; Powers and Xie Reference Powers and Xie2008). None of this should discourage the users from choosing the method they find most meaningful. Our suggestions and the two data-conscious approaches to calculating and graphically illustrating marginal effects we present apply to both cases.
Regardless of the method one chooses to follow when interpreting the estimates from nonlinear GLMs and other models with interaction terms, we cannot ignore that the estimated effect is rarely constant. Consider a simple model with an interaction term, as in Equation (1). The relationship between the expected value of the dependent variable and the covariates in such a model can be described as the following function:
 $$ \begin{align} h(x,z)=\hat{\beta}_0 + \hat{\beta}_1x + \hat{\beta}_2z + \hat{\beta}_3xz, \end{align} $$
where x and z are the values of the constitutive variables and $\hat {\beta }_j$
are the coefficient estimates. Here, the predicted effect of x depends on z:
$\hat {\beta }_j$
are the coefficient estimates. Here, the predicted effect of x depends on z: $h_x(x,z)= \hat {\beta }_1 + \hat {\beta }_3z$
.
$h_x(x,z)= \hat {\beta }_1 + \hat {\beta }_3z$
.
In nonlinear regression models, the effect of the variable of interest will vary even if the model equation does not include an interaction term. The expected value of the dependent variable in a nonlinear GLM (Equation (2)) can be expressed as:
 $$ \begin{align} h(x,z)= f(\beta_0 + \beta_1x + \beta_2z). \end{align} $$
The marginal effect of x in such a model can be computed as the first derivative of the predicted value of the dependent variable with respect to x. By the chain rule, the marginal effect of x is $h_x(x,z) = \beta _1f'(\beta _0 + \beta _1x + \beta _2z)$
. With a typical link function, the sought marginal effect will depend on the linear prediction of the model and will vary conditionally on both x and z.
$h_x(x,z) = \beta _1f'(\beta _0 + \beta _1x + \beta _2z)$
. With a typical link function, the sought marginal effect will depend on the linear prediction of the model and will vary conditionally on both x and z.
Combining these features, in a nonlinear GLM with an interaction term (3), the predicted value of the dependent variable and the marginal effects of x can be expressed using the following functions:
 $$ \begin{align} h(x,z)=f(\hat{\beta}_0 + \hat{\beta}_1x + \hat{\beta}_2z + \hat{\beta}_3xz), \end{align} $$
 $$ \begin{align} h_x(x,z)= \underbrace{(\hat{\beta}_1 + \hat{\beta}_3z)}_{\text{depends on }z}\cdot\underbrace{f'(\hat{\beta}_0 + \hat{\beta}_1x + \hat{\beta}_2z + \hat{\beta}_3xz )}_{\text{depends on }(x, z)}. \end{align} $$
The derivative in (7) has two components: the first derivative of the linear prediction $(\hat {\beta }_1 + \hat {\beta }_3z)$
and the first derivative of the inverse link function evaluated at the linear prediction, which depends on the combination of x and z. The conditioning variable, z, influences both of these components, while the main variable of interest, x, influences only the values of the first derivative of the inverse link function. Here, the difference between nonlinear interactive models and linear ones becomes more apparent. In linear models, the marginal effect of x depends only on z. Likewise, the difference in the dependent variable resulting from a fixed change in the variable of interest may depend on the starting level of the hypothesized change, its magnitude, as well as the values of the conditioning variable and all other covariates in the model equation. This suggests that nonlinear models with interaction terms can capture the variation in the effects of the covariates conditionally on the values of both the main explanatory variable and the conditioning variable (and can, certainly, disguise some of the noise and peculiarities of the data structure into the variation in the estimated effect, as illustrated by Berry, DeMeritt, and Esarey Reference Berry, DeMeritt and Esarey2016 and Hainmueller, Mummolo, and Xu Reference Hainmueller, Mummolo and Xu2019).Footnote 3
$(\hat {\beta }_1 + \hat {\beta }_3z)$
and the first derivative of the inverse link function evaluated at the linear prediction, which depends on the combination of x and z. The conditioning variable, z, influences both of these components, while the main variable of interest, x, influences only the values of the first derivative of the inverse link function. Here, the difference between nonlinear interactive models and linear ones becomes more apparent. In linear models, the marginal effect of x depends only on z. Likewise, the difference in the dependent variable resulting from a fixed change in the variable of interest may depend on the starting level of the hypothesized change, its magnitude, as well as the values of the conditioning variable and all other covariates in the model equation. This suggests that nonlinear models with interaction terms can capture the variation in the effects of the covariates conditionally on the values of both the main explanatory variable and the conditioning variable (and can, certainly, disguise some of the noise and peculiarities of the data structure into the variation in the estimated effect, as illustrated by Berry, DeMeritt, and Esarey Reference Berry, DeMeritt and Esarey2016 and Hainmueller, Mummolo, and Xu Reference Hainmueller, Mummolo and Xu2019).Footnote 3
As an illustration, let us take a dataset presented in Robertson and Teitelbaum (Reference Robertson and Teitelbaum2011) and estimate a logistic regression with an interaction term. This study looks into the influence of the inflow of foreign direct investment (FDI) on labor relations in general and industrial strikes in particular. The article argues that FDI increases the incidence of strikes in the recipient country. However, the effect is conditional on the political regime: democracies are more likely to resolve potential disputes by institutional means before evolving into a strike. The original study uses a count model with logged FDI flows, Polity score (as a measure of democracy), their product, and adjusts for other variables. We will return to a more detailed discussion of this example later on; for now, suppose that we are interested in modeling the probability of any strike in a given year and include only the two constitutive terms and their interaction in the regression.
The predictions of this model can be expressed using the following equation:
 $$ \begin{align} \text{Pr(strikes)} = \text{logit}^{-1} \left(-5.88 + 0.58 \cdot \text{ln(FDI)} + 0.15 \cdot \text{Polity} -0.01 \cdot \text{ln(FDI)} \cdot \text{Polity}\right). \end{align} $$
The marginal effect of the logged FDI inflows is:
 $$ \begin{align} \text{ME}_{\text{ln(FDI)}} =& \left(0.58 - 0.01 \cdot \text{Polity} \right)\cdot\\ &\frac{\exp\left(-5.88 + 0.58 \cdot \text{ln(FDI)} + 0.15\cdot \text{Polity} -0.01 \cdot \text{ln(FDI)} \cdot \text{Polity}\right)} {\left(1+\exp\left(-5.88 + 0.58 \cdot \text{ln(FDI)} + 0.15\cdot \text{Polity} -0.01 \cdot \text{ln(FDI)} \cdot \text{Polity}\right)\right)^2},\nonumber \end{align} $$
which depends on both the logged FDI inflow and the Polity score. Table 1 shows the values of the marginal effect of the logged FDI flows at the select values of the covariates—that are obtained by plugging these values into Equation (9) above. It shows significant variation in the marginal effects across the levels of FDI flows and Polity scores.
Variation in the marginal effect of logged FDI inflows on the probability of industrial strikes.

Note: Data are from Robertson and Teitelbaum (Reference Robertson and Teitelbaum2011).
Because of this variation, simply saying that the effect of logged FDI inflows in an autocracy is 0.003 would not be a completely accurate statement. Neither would be the statement that the effect of logged FDI inflows in an autocracy is 0.006 as it does not take into account the variation across the levels of the variable of interest. Accordingly, the interpretation of the estimates from these models necessarily involves dealing with—and capitalizing on—the variation in the estimated effects across the levels of both variables constituting the interaction term.Footnote 4
3 Studying How the Effect of X Varies with Z
Analysts seldom include an interaction term in their model specification unless their theory suggests that the effect of the explanatory variable of interest (X) depends on some condition determined by another variable (Z). Thus, interpreting the variation in the estimated effects of X is not only a matter of making accurate statements but is more than often also of theoretical interest.
The publication of King, Tomz, and Wittenberg (Reference King, Tomz and Wittenberg2000) and especially Brambor et al. (Reference Golder2006) have increased the popularity of graphical approaches to illustrating this variation in marginal effects. The idea is to show the effects of the variable of interest under different conditions simultaneously in a single graph. Researchers would typically pick one of the constitutive variables and allow it to vary over the range of its in-sample values. To single out the variation of the effect of X along the values of Z, analysts hold all other variables at specific values (often at the means for continuous variables, at the modes or medians for categorical variables, or both values of dichotomous variables), compute marginal effects (or the effect of a fixed unit-change in itFootnote 5), and plot them against the values of Z.
Figure 1 presents a graphical illustration of the effects estimated by Golder (Reference Golder2006, 94) and included among the helpful examples on Matt Golder’s websiteFootnote 6 to illustrate this approach proposed by Golder and his colleagues and others (Berry, Golder, and Milton Reference Berry, Golder and Milton2012; Brambor et al. Reference Golder2006). In her analysis, Golder (Reference Golder2006) employs a dataset of political party dyad-elections and models the probability that the parties in a dyad are part of an electoral alliance. The analysis evaluates the expectation that party (system) polarization incentivizes parties to make coalitions to the extent to which electoral rules favor larger running blocs. To this end, the model includes an interaction term of the effective electoral threshold and a measure of political polarization.
The effect of polarization on pre-electoral coalition formation at the sample mean of polarization.
Source: Replication of Figure 6.2 from Golder (Reference Golder2006, 94).

Figure 1 seems to corroborate this expectation. The predicted effect of a unit increase in polarization on the probability of observing a pre-electoral coalition formation increases from about 0 to 0.4 percentage points over the range of the effective electoral threshold variable. The effect is statistically significant for the values of the effective electoral threshold over 23% and the party system polarization is held constant at its mean (30.2).Footnote 7 Such graphs enable comparisons provided that researchers have clear theoretical expectations about the variation in the effect of the variable of interest across different levels of the conditioning variable, and the analyses produce relevant measures of uncertainty about the estimates.
4 Dealing with the Variation in the Effect of X along the Values of X
An important decision to be made while using this graphical approach is about choosing the value of the variable for which one computes the marginal effect. This is because the magnitude of the effect depends on this value.
As noted above, this choice appears straightforward when one of the variables of interest is dichotomous: we can compute predictions for both values of this variable and their difference. After all, there are not many alternatives to choose from, and the theory presents a clear expectation about the effect of the dichotomous constitutive variable (i.e., the difference between the two levels/groups in the predicted quantities of interest). Ignoring the differences in the distribution of this variable across the levels of the continuous variables, one can treat the difference between these predictions as the estimate of the (marginal) effect of that variable.
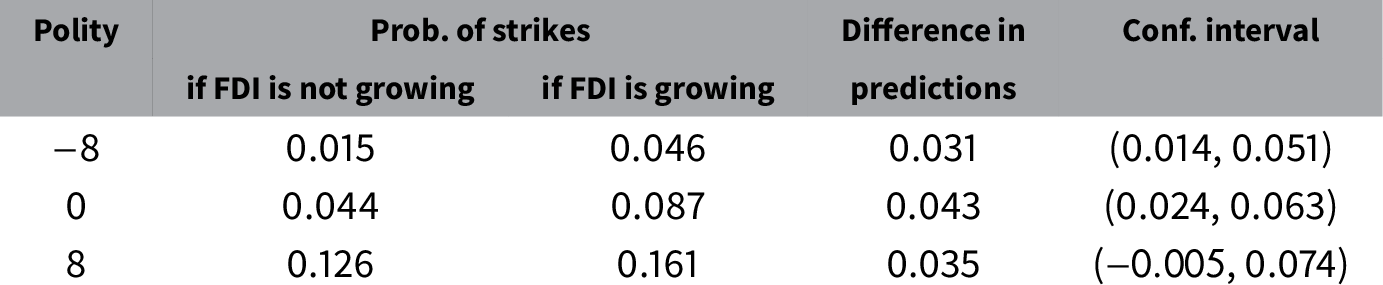
Continuing with the example about the relationship between FDI and labor relations, suppose we are interested in whether the upward trajectory in the FDI flows increases the probability of having any strikes and whether this effect is conditional on the level of democracy. Using the data from Robertson and Teitelbaum (Reference Robertson and Teitelbaum2011) and the binary indicator of whether the FDI flows have, on average, increased over the preceding 5 years, we arrive at the following estimates:
 $$ \begin{align} \text{Pr(strikes)} = \text{logit}^{-1} \left(-3.08 + 0.73 \text{~(Growing FDI)} + 0.14 \text{~Polity} -0.05 \text{~(Growing FDI)} \cdot \text{Polity}\right). \end{align} $$
Table 2 shows the predicted probabilities of strikes for the combinations of growing and not growing FDI and select Polity scores. According to this table, in autocracies, the effect of increasing FDI inflows on the probability of strikes is 3 percentage points. On the other hand, it is 4.3 percentage points for intermediate regimes and insignificant for democracies.Footnote 8 We can ignore here the fact that the growing FDI was slightly more common in democracies than in autocracies in the observed period.
The conditional effect of the upward trend in FDI on the probability of industrial strikes.
In cases when the constitutive variables are continuous (or ordinal and treated as continuous), choosing the value for the variable of interest is less straightforward, and theory rarely helps with this choice. Political scientists seldom theorize about the variation in the effect of a variable across its own values (and when they do so, they tend to incorporate it in the model directly by adding additional variables or interactions as part of the linear component). The variation in the marginal effect of a variable along its own values is often merely a by-product of the bounds on the limited dependent variable (and the specific GLM function)Footnote 9 rather than a matter of theoretical interest for the researcher. Thus, theoretical relationships assessed in literature rarely provide scholars with clear expectations about the variation in the effect of a variable across its hypothetical or in-sample range. If they do state such clear expectations, one should choose “theoretically motivated” values to interpret marginal effects.
Without theoretical reasons for selecting specific values of the variable of interest, researchers often follow the recommendation of Brambor et al. (Reference Golder2006) by setting the variable of interest to its mean (or occasionally to its median). For instance, this is the method used in Figure 1. The mean case variant of this approach to interpreting nonlinear models with interaction terms that include continuous variables is also quite common in literature. Of the 110 articles with similar models published in the APSR, AJPS, and JOP between January 2006 and January 2020, 94 contain a graphical illustration, and 25 plot the marginal effects at means.Footnote 10
We argue that using the mean value approach is not always justified, nor does computing the effect of a variable only at its mean always serves well the purpose of evaluating the theory. In the absence of a theoretical prescription for choosing the values for the variable of interest, it is safer to assume that the researcher is interested in the modal mechanism under consideration. This cause is best served by estimating the typical effect of constitutive variables—that is, the effect that we believe is most likely to be observed in empirical reality. Unfortunately, the marginal effect of X at the mean of X is not guaranteed to correspond to the typical marginal effect of X.
This problem also applies to nonlinear GLMs without interaction terms. As Hanmer and Kalkan (see the derivation of Equation (7a): Hanmer and Kalkan Reference Hanmer and Kalkan2013, 266) show, the effect of a variable at its average value may significantly depart from its average effect, even in the models without interaction terms. To appreciate that the marginal effect at mean might not be a typical effect of the variable, consider Figure 2. The left panels of the figure show four different distributions of the variable X and the same fitted curve from a hypothetical logistic regression. The vertical red line indicates the mean value of that variable. The right panels show the distributions of the marginal effects of the variable X, computed as the partial derivatives of $\hat {Y}$
on the left panel at each value of X. Here, the red lines indicate the marginal effect at the mean of X. As the reader would notice, in all four cases, the marginal effect at mean is far from the modal value of the marginal effect. It is not equal to the average of marginal effects (indicated as AME on the chart), either.
$\hat {Y}$
on the left panel at each value of X. Here, the red lines indicate the marginal effect at the mean of X. As the reader would notice, in all four cases, the marginal effect at mean is far from the modal value of the marginal effect. It is not equal to the average of marginal effects (indicated as AME on the chart), either.
Varying effect size in nonlinear models—a hypothetical logistic regression.

In addition to not being typical, the effects computed for rarely occurring values of covariates may suffer from low predictive validity. King and Zeng (Reference King and Zeng2006) show that the predictions exhibit higher model-dependence when calculated for the values of covariates that depart from the bulk of the data employed in the estimation of the model parameters (as, for instance, in case four in Figure 2). When computed using nontypical values, the predicted quantities of interest are highly sensitive to model parameters and specification, implying that small changes in the sample or model specification may result in drastically different inferences. Since the mean is not necessarily a typical value of a variable, choosing it for such a purpose may lead to drawing invalid inferences relying on “extreme counterfactuals”Footnote 11
A natural way out is to aggregate the marginal effects calculated for different values of the covariates of interest. For example, Hanmer and Kalkan (Reference Hanmer and Kalkan2013) calculate marginal effects using in-sample values and average them. Stata’s “margins” command, by default, computes average effects. This is also the most commonly used approach to aggregating marginal effects in the models without interaction terms. This version of AME produces only one estimate for each covariate. Building on the logic behind the AME approach, our proposed DAME statistics also incorporate the information about the joint distribution of covariates and present marginal effect aggregates as conditional on the chosen values of the conditioning variable.
5 Dealing with the Variation in the Effect of X with (X, Z)
Brambor et al.’s (Reference Brambor, Clark and Golder2006) graphical approach to presenting marginal effects deals with the changes in the marginal effect of a constitutive variable included in response to the changes in the conditioning variable. The average marginal effects allow researchers to deal with the dependence of marginal effects of a variable on its values in nonlinear models without interaction terms. How should one deal with the fact that the estimated effect of a constitutive variable of an interaction term simultaneously depends on that variable’s value, the conditioning variable, and the combination of their values?
Stata’s “margins” command (or the R package named after that) is often—and uncritically—used to compute a modified version of the average marginal effects in models with interaction terms. The researchers specify the range of values of the conditioning variable for which they would like to produce a summary of the marginal effects of the main variable and the software loops through each listed value of the conditioning variable, replaces it through the dataset as it computes the effects of the main variable, and averages those. In this case, the average marginal effect is computed as:
 $$ \begin{align} AME_x(z)= (\hat{\beta}_1 + \hat{\beta}_3z)\frac{1}{N}\sum\limits_{i=1}^Nf'(\hat{\beta}_0 + \hat{\beta}_1x_i+ \hat{\beta}_2z + \hat{\beta}_3zx_i). \end{align} $$
Much to our regret, this approach ignores the possibility that the distribution of the variable X conditional on Z might depart from its overall distribution. Among many others, a possible reason can be found in the conditional data generation process of the constitutive variables. For instance, referring to the earlier example of the analysis presented in Golder (Reference Golder2006), mainstream parties in majoritarian systems might be more likely to converge toward the median of the voter distribution on an ideological scale. That may make observing lower values of party system polarization more likely when the effective threshold of representation is high.Footnote 12
Gelman and Pardoe’s (Reference Gelman and Pardoe2007) “average predictive comparisons” approach is the closest to what we advocate in this study. The authors’ suggestion is to calculate the change in the expected value of the dependent variable for each possible positive transition in the variable of interest and, weighting on the chances of a given transition occurring without a change in the values of other covariates, average over all such transitions and all observations (Gelman and Pardoe Reference Gelman and Pardoe2007, 33–34). This procedure produces a single, aggregated value of the impact of the selected variable. This single value reflects the average of the conditional effects of the variable in question in the sample. It is thus a more typical value of its impact than an estimate produced using its mean. While it is a good characterization of the impact of a variable in general and for comparing its effect across distinct models, we need to be able to produce separate estimates for the values of the conditioning variable and the combinations of constitutive terms if we were to know how the statistical and substantive significance of the marginal effect of the variable of interest varies with an increase or decrease in the other (constitutive) variable(s).
We propose two alternative procedures for characterizing the distribution of marginal effects of variables included in an interactive model and checking whether their typical marginal effects significantly differ from their effects predicted using the mean values.Footnote 13 The first procedure is to compute the marginal effects for all in-sample combinations of only the constitutive variables, plot them, and scrutinize the conditions under which the estimated effect is statistically and substantively significant. This is a simple extension of the graphical approach described earlier that capitalizes on the power of data visualization without sacrificing the data-conscious approach we advocate. To facilitate the interpolation of the color-coded values of marginal effects, we make a concession to the mean value approach by setting the variables not shown on the horizontal and vertical axes to their central values.
As a second procedure, we suggest breaking the sample down into bins determined according to the values of the conditioning variable and averaging the marginal effects at the observed values of the covariates by the bins. We call this function the as it effectively weighs the marginal effects by the conditional relative frequencies of the variable of interest and other covariates in the model equation. This is an extension of the “Average Marginal Effect” approach that aggregates marginal effects within meaningful segments of a dataset rather than producing a single marginal effect estimate for the full dataset. This approach incorporates the conditional distribution of all covariates given the selected values of the conditioning variable. Thus, despite being computationally more demanding than the approaches that rely on covariates’ central values, it provides a better estimate of the typical conditional effect of a variable.
As both our procedures are data-driven, the conclusions drawn from them will be generalizable to the extent to which the sample at hand is representative of a broader population. Thus, we encourage researchers to think carefully about the data generation process and sample’s representativeness. If the sample is biased, the conclusions can be misleading due to the bias in parameter estimates and nonrepresentativeness of the values used for computing marginal effects (and the same is true about the marginal effects at means approach). If the estimation employs sampling weights or other methods for dealing with nonrepresentative data, similar adjustments may be applied to the marginal effect aggregates.Footnote 14 In the following sections, we discuss these two procedures in more detail and illustrate their potential use in substantive research.
6 Marginal Effects at Observed In-Sample Values
The first procedure involves computing and illustrating the marginal effects of the variable of interest at distinct combinations of the values of the constitutive variables. The main goal of this procedure is to determine the combinations of these variables at which the variable of interest has a statistically significant effect and where this effect is stronger (i.e., substantively more significant). This simple procedure builds on the now conventional graphical illustration methods of marginal effects in linear and nonlinear models and utilizes the values of both constitutive variables at once. On the other hand, it is short of using the variation in all variables, which will be the case for the DAME procedure—using the central values for all other variables is a compromise needed to produce point estimates and facilitate the interpolation of colors representing the marginal effect estimates. This procedure can be described in a series of steps:
-
1. Create a grid with unique combinations of only the constitutive variables in the estimation sample and construct a dataset that, in addition to these values, includes all other variables in the analysis, which are to be set to their means or medians depending on whether they are continuous or discrete.Footnote 15 Let us denote this set $\{\mathbf {u}_i\}$
.
$\{\mathbf {u}_i\}$
. -
2. Simulate the coefficients: Draw a sample from the multivariate normal distribution with the mean equal to the coefficient estimates and the variance–covariance equal to the variance-covariance matrix of the parameter estimates. Denote it
$\{\hat {\boldsymbol {\beta }}_j\}$
.Footnote 16
-
3. Compute the marginal effect for the first element of the grid,
$\mathbf {u}_1$
, and each simulated vector of coefficients,
$\hat {\boldsymbol {\beta }}_j$
For the models described in Equation (6), the formula will look as follows:(12)Since we are dealing with the first element in set
$$ \begin{align} m_{i,j} = (\hat{\beta}_{j,X} + \hat{\beta}_{j,XZ}u_{i,Z})f'(\mathbf{u}_i^T\hat{\boldsymbol{\beta}}_j). \end{align} $$
$\{\mathbf {u}_i\}$
, i should be set to 1.Footnote 17 If we wish to compute a unit-change effect of the variable X, this formula should be replaced with (13)where
$$ \begin{align} m_{i,j} = f(\tilde{\mathbf{u}}_i^T\hat{\boldsymbol{\beta}}_j)- f(\mathbf{u}_i^T\hat{\boldsymbol{\beta}}_j), \end{align} $$
$\tilde {u}_{i,X}=u_{i,X}+\Delta _X$
,
$\tilde {u}_{i,XZ}=u_{i,XZ}+\Delta _X u_{i,Z}$
, and all other entries of
$\tilde {\boldsymbol{u}}_{i}$
are the same as those in
$\mathbf {u}_{i}$
. Here, one needs to find the predicted value of the dependent variable for a given vector
$\mathbf {u}_i$
, add an increment to the value of the variable of interest and update the value of the product term, generate the prediction for the updated vector, and record how different it is from the previously predicted value.Footnote 18
-
4. Use the distribution from step 3 to compute an estimate (the mean of the marginal effects at
$\mathbf {u}_1$
) and its associated confidence interval. To construct a confidence interval around the mean effect, find the related percentiles of its distribution (e.g., 2.5th and 97.5th percentiles for the 95% confidence level). -
5. Declare the estimated marginal effect from step 4 statistically significant if the computed confidence interval does not include zero.
-
6. Repeat steps 3–5 for the remaining elements of set 1.
-
7. Plot these values and determine at which combinations of the constitutive variables the marginal effect is substantively more or less significant—that is, where it is stronger and weaker.


We recommend plotting the marginal effects in a color-coded plot and overlaying a scatter plot to see the gaps in the joint distribution of the constitutive terms so that the user can see the predicted marginal effects at their unique combinations and assess how representative a specific combination is. Figure 3 shows two applications of this procedure to the analysis of the effect of polarization on the formation of pre-electoral coalitions as described earlier.
The effect of polarization on pre-electoral coalition formation.
Source: Data are from Golder (Reference Golder2006).

Panels a and b present two slightly different approaches. The left panel, where we plot the marginal effects using a contour plot, contains less information but still gives a clear indication of the substantive significance of the marginal effects and makes related comparisons easier. The right panel, on the other hand, maximizes the amount of information presented. It adds the mean values and histograms showing the univariate distributions of the constitutive variables and a continuous scale for the effect size. In both panels, on the other hand, marker sizes are proportional to the in-sample frequencies of observations for each combination of the two interacting variables, and only the markers for which the calculated effect is statistically significant at 95% confidence level are filled.Footnote 19, Footnote 20
Since polarization is a continuous variable, we compute its marginal effect as the partial derivative. The plot suggests that polarization only exerts a statistically significant effect when the effective electoral threshold is 35. This effective electoral threshold corresponds to electoral systems with single-member districts, which points to the possibility that there is something with the plurality rule that may drive this conditional effect. Among those observations, the systems with higher levels of polarization feature higher marginal effects of polarization. It also appears that the mean value of the variable (30.2) is relatively close to the bulk of the observations in the low- and high-threshold groups of observations. In light of this analysis, it is safe to suggest that the effect of polarization evaluated at its sample mean with the lower values of the threshold is typical for electoral systems with lower electoral thresholds. Likewise, the effect of polarization evaluated at its sample mean with the high values of the threshold is typical for those with single-member districts. Since the model does not include polynomials of constitutive variables, we should expect significance to vary with the threshold but not with polarization. This is exactly what we find.
Figure 4 is based on the data presented by Nagler (Reference Nagler1991). This study re-analyzes the determinants of voters’ decision to turn out to vote and, specifically, the effect of the restrictiveness of voter registration rules (as measured by the number of days between the election day and closing date of registration) conditional on voter education. Since the dependent variable is binary, the author estimates a probit regression. Because both constitutive variables are discrete, we compute their effects as the change in the predicted probability of turning out in response to a unit increase, rather than a partial derivative, in the covariate.
Marginal effects at means and marginal effects at in-sample observations. Notes: If a computed marginal effect is not statistically significant at 95% confidence level, it is marked with a hollow marker. Marker sizes are proportional to the in-sample frequencies of the observations with the given combinations of the interacting variables.
Source: Data are from Nagler (Reference Nagler1991) and were made available online by Berry et al. (Reference Berry, DeMeritt and Esarey2010).

The marginal effects at means support the expectations put forward in the article: the least and most educated voters seem to be less susceptible to the influence of restrictive registration rules. The examination of the marginal effects at the in-sample values of the constitutive variables also supports the original study’s conclusions regarding the statistical significance of the effects of education and restrictive registration rules. The predicted effect of the closing date of registration is negative and significant across all levels of the education variable except for its lowest level.
Figure 4 also reveals gaps in the distributions of the constitutive variables. The primary variable of interest—the number of days between the election day and closing date of registration—has a (rounded) mean of 25 and a mode of 30 days. None of the observations take on the former value, which was used by the previous studies employing this canonical dataset (Berry et al. Reference Berry, DeMeritt and Esarey2010; Nagler Reference Nagler1991). Also notice that the joint distribution of the constitutive variables shows that almost no voters with the lowest level of education were sampled in the states with more or less restrictive registration rules. One should thus be cautious when describing the statistical and substantive significance of the effects of the variables of interest for the states with restrictive registration rules.
Finally, we should also note that the estimated marginal effect of education considerably varies across the range of this variable, and it is weaker at more extreme values. The smaller effect size at the low and high values of this variable is, in part, an artifact of the polynomial specification of the model. As a cautionary note, we should indicate that despite the presence of the squared education term in the model equation, we do not observe statistical significance varying across the range of the education variable. That is, while introducing polynomials might influence statistical significance, it is not the case for Nagler’s analysis.
Figure 5 illustrates the marginal effects based on the replication of Arceneaux et al. (Reference Arceneaux, Johnson, Lindstädt and Vander Wielen2016). This study uses data on the votes cast in the U.S. House of Representatives between 1997 and 2002 to examine how then-novel Fox News affected the electoral incentives of Congressmen. The authors’ main finding is that “the introduction of Fox News caused Republican members of Congress to side more often with their party in the run-up to general elections while causing Democratic legislators to side with their party less often before elections” (Arceneaux et al. Reference Arceneaux, Johnson, Lindstädt and Vander Wielen2016, 6). To reach this conclusion, the authors estimate a number of logistic regressions of a partisan vote on a bill, which include multiplicative interactions of the presence of Fox News in the Congressmen’s districts and the cubic polynomial of the number of days to the next election or those of the Democratic vote share in the Congressmen’s districts and the cubic polynomial of the number of days to the next election. The latter were estimated on subsamples of the votes cast by Democrats representing the districts with Fox News, by Democrats from the districts without Fox News, by Republicans from the districts with Fox News, and by Republicans from the districts without Fox News. With space concerns, we present the marginal effects for only one of those regressions.
Varying statistical significance of marginal effects of election proximity. Notes: If a computed marginal effect is not statistically significant at 95% confidence level, it is marked with a hollow marker. Marker sizes are proportional to the in-sample frequencies of the observations with given combinations of the interacting variables.
Source: Data are from Arceneaux et al. (Reference Arceneaux, Johnson, Lindstädt and Vander Wielen2016).

The one we replicate includes the interaction terms between the Democratic vote share in Congressmen’s districts and the cubic polynomial of the number of days to the next election and is on the subsample limited to the votes cast by Republicans from the districts with Fox News presence. Since the number of days to the next election is a discrete variable, the marginal effect is computed as the unit-change effect. Figure 5 shows how the partisan composition of the district conditions the marginal effect of days until the next election on the likelihood of Republican members of Congress from districts with Fox News voting against the party majority. The effect is negative and strongest when there is little competition in the district and the elections are quite close. However, there are relatively few observations in that area: more typical negative effects are about 6 months before the next election in relatively more competitive districts.
The effect’s statistical significance also depends on the values of both the variable of interest (days before the next election) and the conditioning variable (Democratic vote share). It is negative and statistically significant for Congressmen from safe districts in the last 300 days before the election, insignificant around the sample mean of days before the next election, and positive and statistically significant if the next election is at least a year ahead. Furthermore, we should note that neither the constitutive variables nor their interaction term had a statistically significant coefficient in the regression. These results suggest that plotting marginal effects is particularly useful for a data-conscious interpretation of nonlinear interactive models that include nonlinear functions of constitutive variables: the regression coefficients and marginal effect at means approach both point to the insignificant effect of days to the election, while it is, in fact, significant for a substantial chunk of the in-sample combinations of the constitutive variables.
As yet another illustration of this approach, we replicate the analyses in Robertson and Teitelbaum (Reference Robertson and Teitelbaum2011) that investigates whether the effect of FDI on labor protests is conditioned by democratic institutions. Robertson and Teitelbaum (Reference Robertson and Teitelbaum2011) argue that political competition and conflict resolution function more effectively in democracies, contributing to a more peaceful resolution of globalization-induced labor grievances. The dependent variable in the empirical analysis in this paper is the number of strikes in a country-year. Accordingly, it employs a negative binomial regression with an interaction term between various measures of democracy and the natural log of FDI flows and the logarithmic link function.
Figure 6 is a heatmap illustrating the marginal effects of FDI flows (computed as the partial derivative because FDI flows is a continuous variable) and suggesting that both the FDI flows toward and the democracy level of a country affect the size of the marginal effect of FDI flows. We prefer a heatmap here because democracy has a much stronger conditioning effect only when the FDI inflows are high, but the observations corresponding to this scenario are relatively infrequent in the estimation sample. Moreover, the distribution of the Polity scores is bimodal and that of the logged FDI flows is highly skewed. Holding the level of democracy fixed, the choice of the FDI flows’ value is the most consequential for autocracies, as the size of the FDI flows’ effect substantially depends on this value.
Varying substantive significance of marginal effects of FDI flows.
Notes: The histograms show the distributions of the constitutive variables. If a computed marginal effect is not statistically significant at 95% confidence level, it is marked with a hollow marker. Marker sizes are proportional to the in-sample frequencies of the observations with given combinations of the interacting variables.
Source: Data are from Robertson and Teitelbaum (Reference Robertson and Teitelbaum2011).

Researchers rarely need to deal with interactions of more than two variables. Nonetheless, we provide below some simple guidelines for how to use the described procedure when such a need arises. For three-way interactions, we recommend generating multiple two-dimensional plots where one of the conditioning variables is set to its mean, mode, median, or other representative values (e.g., 10, 25, 75, or 90 percentiles).Footnote 21 This will allow researchers to get a better understanding of the statistical and substantive significance of a variable’s effect at different parts of the sample. For interactions of four or more variables, we recommend reporting only the ranges of the constitutive variables for which the effect of the variable of interest is significant.
To summarize, the examination of the marginal effects at in-sample values procedure shows that the marginal effects at means may not necessarily be the best representation of an estimated effect in general. Thus, if the findings that seem to corroborate the hypothesized relationship are only driven by a handful of observations in the estimation sample, researchers should be cautious about making generalizations and claiming empirical support for their hypotheses.
7 Distribution-Weighted Average Marginal Effects
Despite its many advantages vis-à-vis the marginal effects at means, the procedure we propose in the previous section has some important limitations as well. Although it allows researchers to illustrate the values of Z where the effect of X becomes significant in a manner consistent with the estimation sample at hand, it is hard to describe how the marginal effect of X varies conditionally on Z. For instance, one can easily notice from the right column of Figure 4 that the choice of the value of the education variable substantially affects the estimated magnitude of its marginal effect. Due to the link function, the estimated effect has a lower magnitude at the lowest and highest levels of education. In Figures 5 and 6, the problem is even more severe because both the statistical and substantive significance of the effect depend on the values of the variable of interest. Which values should we pick then?
We propose below a procedure that aggregates the marginal effects by relying on the information about the conditional distribution of all covariates given the values of the conditioning variable. For each value of the conditioning variable (or for each bin defined based on the distribution of that variable), we compute a weighted average of the marginal effects, placing a higher weight on the covariate vectors with higher frequencies in the data. If the estimation employs sampling or other sorts of weights, this procedure can also incorporate those in the calculations, which would require the users to use the sums of any weights instead of the observation counts for each bin.
This function seems more appropriate than the marginal effects at means and the modified average marginal effects (Equation (11)) approaches since the computed values more closely represent the effect of the variable of interest that is typical for the selected values of the conditioning variable. It also allows us to compare the estimates at different values of the conditioning variable by putting them on the same plot that seems quite similar to what many readers are now used to seeing in leading political science journals.
As in the case of the plot with the in-sample marginal effects, we follow a series of steps to calculate and graphically illustrate this statistic:
-
1. Use variable Z to break all observations in the estimation sample into bins. If appropriate, as in the case of a nominal variable, we recommend using all distinct in-sample values of Z. If the number of observed values is too large or the data are sparse at some of the values of Z, we recommend using bins of equal size. One can start with tercilesFootnote 22 since researchers are often interested in the effects at low, medium, and high values of Z and it would be sufficient to demonstrate whether the effect is truly nonlinear. If Z exhibits substantial variation, one can increase the number of bins to assess the heterogeneity of marginal effects better.Footnote 23
-
2. Simulate coefficients: draw a sample from the multivariate normal distribution, taking the means from the matrix of coefficient estimates and their variances from the variance-covariance matrix of the coefficient estimates. Denote this set
$\{\hat {\boldsymbol {\beta }}_j\}$
. -
3. For the first vector of simulated coefficients, compute the marginal effects with each observation in the sample.Footnote 24In models with a single interaction term, the formula will be as follows:
(14)If we wish to compute a unit-change effect of the variable X, this formula should be replaced with:
$$ \begin{align} g(\mathbf{u}_i, \hat{\boldsymbol{\beta}}_j) = (\hat{\beta}_{j,X} + \hat{\beta}_{j,XZ}u_{i,Z})f'(\mathbf{u}_i^T\hat{\boldsymbol{\beta}}_j). \end{align} $$
(15)where
$$ \begin{align} g(\mathbf{u}_i, \hat{\boldsymbol{\beta}}_j) = f(\tilde{\mathbf{u}}_i^T\hat{\boldsymbol{\beta}}_j)- f(\mathbf{u}_i^T\hat{\boldsymbol{\beta}}_j), \end{align} $$
$\tilde {u}_{i,X}=u_{i,X}+\Delta _X$
,
$\tilde {u}_{i,XZ}=u_{i,XZ}+\Delta _X u_{i,Z}$
, and all other entries of
$\tilde {\boldsymbol{u}}_{i}$
are the same as those in
$\mathbf {u}_{i}$
. One needs to find the predicted value of the dependent variable for
$\mathbf {u}_i$
, add an increment to the value of the variable of interest, update the value of the product term, generate the prediction for the updated vector, and record how different it is from the first prediction.Footnote 25
-
4. Compute the average within each bin defined in step 1.
-
5. Repeat steps 4 and 5 for the remaining coefficient vectors.
-
6. For each bin, compute the DAME estimate (the mean of the distribution constructed in steps 3–5) and its associated confidence interval. For the 99% confidence level, for instance, find 0.5 and 99.5th percentiles of this distribution
-
7. Declare a DAME estimate significant if its associated confidence interval does not include zero.
-
8. Plot DAME of the variable of interest, X, against the values of the conditioning variable, Z.Footnote 26


As in the previous section, we illustrate our approach using the data and models from Arceneaux et al. (Reference Arceneaux, Johnson, Lindstädt and Vander Wielen2016), Golder (Reference Golder2006), Nagler (Reference Nagler1991), and Robertson and Teitelbaum (Reference Robertson and Teitelbaum2011). Figure 7 shows the DAME and the marginal effects at means for the analyses presented by Arceneaux et al. (Reference Arceneaux, Johnson, Lindstädt and Vander Wielen2016), Golder (Reference Golder2006), and Robertson and Teitelbaum (Reference Robertson and Teitelbaum2011), while Figure 8 plots the same quantities for Nagler (Reference Nagler1991). Here, we also use different approaches to discretizing the observations: the DAME plot in Figure 7a and b and Figure 8b use deciles, whereas panel c uses quartiles to separate consolidated democracies and autocracies from the intermediate regimes. Figure 8a uses all distinct values of the conditioning variable.Footnote 27
Distribution-weighted average marginal effects.
Notes: The plots show distribution-weighted average marginal effects, the marginal effects at means, and their respective 95% confidence intervals. The sizes of markers are proportional to the frequencies of the observations with the given values in the estimation sample. Whiskers represent 95% confidence intervals.

DAME of closing date and education on voter turnout.
Notes: The plots show the marginal effects of variables at their means and their respective 95% confidence intervals based on Nagler (Reference Nagler1991). The sizes of the markers are proportional to the frequencies of the observations with the given values in the sample. Whiskers represent 95% confidence intervals.

First, consider Figure 7c, which is based on the analysis of the determinants of labor strikes in Robertson and Teitelbaum (Reference Robertson and Teitelbaum2011). The solid line and associated dashed confidence intervals represent the marginal effects computed by setting the logged FDI flows variable to its global mean. On the other hand, the circles and whiskers represent point estimates and confidence intervals associated with the DAME approach. While the confidence intervals produced by the two approaches overlap, DAME demonstrate the heterogeneity of the marginal effects of FDI associated with the joint distribution of FDI flows and Polity scores. DAME’s ability to capture this heterogeneity without sacrificing interpretability shows an important advantage over the marginal effect at means approach. It also provides stronger support for the conditional hypothesis of the original article that the effect of FDI is lower in democracies. The typical effect of logged FDI flows, as captured by DAME, declines as we move from autocracies to democracies.
The effects of election proximity on party discipline in Figure 7b, also show important differences between the marginal effect at means and DAME procedures. While the former suggests that the effect of election proximity is not conditioned and is insignificant over the range of Democratic Party vote share, DAME shows a significant conditionality and statistically and substantively significant effects in relatively more competitive districts.
Less dramatic conclusions can be drawn from Figure 8. Here we follow the recommendation of Berry et al. (Reference Berry, Golder and Milton2012) and report the marginal effect plots for each of the interacting variables. When the restrictiveness of voter registration rules is taken as the conditioning variable, the DAME estimates of the effect of education differ from the marginal effects at means: they appear higher than the marginal effects at means when the registration rules are less restrictive. This effect can be traced back to the observation that the marginal effects of the education variable significantly vary across the values of this variable (Figure 4). In addition to the information about voters with intermediate levels of education, which is also accounted for by the marginal effects at means approach, the DAME estimates incorporate the information about voters with low and high levels of education.
In these three studies, the interpretation based on the DAME approach would be different from those based on the marginal effect at means approach. While the latter performs relatively well in some cases, it is less justifiable in others—especially when the joint distribution of the constitutive variables suggests a difference between the estimation sample and that employed in predicting out-of-sample quantities of interest, and when the mean value of the constitutive variable of interest is not necessarily representative of its distribution in the examined sample.
8 Conclusions and Discussion
Interaction terms in nonlinear models have become a common research practice in recent years. Yet, the questions of how to calculate and interpret the statistical and substantive significance of the effects of the constitutive variables in a theoretically motivated and intuitive manner remain to be answered. The mean case approach employed in many studies to date sets a constitutive variable of interest to its mean value and reports its marginal effects at varying levels of the conditioning variable(s). However, researchers rarely set the constitutive variables to meaningful values and report marginal effects at those values. Even in such rare instances, the common practice is to interpolate or extrapolate the marginal effect without giving sufficient attention to the estimation sample, specifically to the joint distribution of the constitutive variables.
In this article, we underline the perils of the mean case approach and present two procedures that can be used to improve our ability to estimate and interpret nonlinear models with interaction terms. We argue that the resulting marginal effect estimates better mirror sample properties and offer interpretations that, on the one hand, do not depend on case selection and, on the other, incorporate more information into the computation of marginal effects without sacrificing simplicity and lucidity—perhaps the two most appealing properties of the marginal effects at means procedure.
We believe it is always useful to provide the reader with detailed information about the sample and an idea about how the sample characteristics are related to the model (estimation and) interpretation. Our presentation of the marginal effects at observed in-sample values in the estimation sample aims to accomplish that by communicating several important pieces of information with the help of a clear and intuitive graphical illustration. However, it cannot provide simple-to-understand answers to certain theoretical and methodological questions, such as to what extent the marginal effect of X is conditioned by Z. We, therefore, advocate the use of the DAME or other data-conscious approaches (e.g., Gelman and Pardoe Reference Gelman and Pardoe2007) for interpreting model estimates.
As we show in this article, in some cases, the mean case approach can lead to statistically and substantively very similar estimates and an equally intuitive interpretation to those produced by the two approaches we present in this article. It would thus be useful to speculate more about the conditions under which using a data-conscious method can be expected to make a difference. For example, how frequently can we expect to see a convergence between the procedures presented in this study and the commonly employed marginal effects at means approach? And, what determines whether those two produce (dis)similar results in the first place?
We start with the second question about generic data characteristics that drive similarities and dissimilarities between the two approaches. We find that the answer depends on whether the mean of a variable presents a typical case for its distribution. We can also suggest that if the marginal and conditional distributions of the variable under consideration are similar to each other, symmetric and unimodal, the interpretations using the marginal effect at means and the procedures suggested in this article will allow for making similar inferences. Unfortunately, such data characteristics are not common in political science research employing observational data, where empirical distributions are often skewed and have multiple modes, and we observe nontrivial correlations among covariates. We also suspect that the interpretation’s reliance on data, for the most part, depends on the degree to which the model captures the nonlinearity and conditionality in the data generating process.
In these respects, we encourage researchers to use the approaches we advocate in this paper at least as a complement to, if not a replacement for, the marginal effects at means approach. To this end, we present an R package and easily adjustable Stata code to facilitate the implementation of both procedures, which can be found at https://github.com/andreizhirnov/data-conscious-marginal-effects. We believe that the replication exercises in this article would also serve as a reminder of the need to think more about the link between the (joint) data generation process of the constitutive variables, the sample used in the estimation, as well as the validity of the claims regarding the statistical and substantive significance of marginal effects. While this article focuses on marginal effects in interactive nonlinear models, we also would like to encourage researchers to carefully think about the joint distribution of their covariates as they calculate and interpret the predicted values of the dependent variable and generate other quantities of interest.
Acknowledgments
Earlier versions of this paper were presented at the 33rd Summer Meeting of the Society for Political Methodology in Houston, TX, World Politics Workshop at Binghamton University, NY, 77th Annual Meeting of the Midwest Political Science Association in Chicago, IL, and 1st Polmeth Europe. We are grateful to all participants, and particularly to Dave Clark, Justin Esarey, Daniel Argyle, Andreas Murr, Ruslan Kuchakov, two anonymous reviewers, and the editor for helpful comments. Any remaining errors are our own.
Data Availability Statement
Replication code for this article is available at Zhirnov, Moral, and Sedashov (Reference Zhirnov, Moral and Sedashov2022) at https://doi.org/10.7910/DVN/ZJCYGP.
Supplementary Material
For supplementary material accompanying this paper, please visit https://doi.org/10.1017/pan.2022.9.
Conflicts of Interest
There is no conflict of interest to disclose.


 Open access