

Introduction
Functional impairment is a central feature of major depressive disorder (MDD).1 The substantial impact of depression on workplace productivity is well-documented,Reference Lerner, Adler and Chang2–Reference Asami, Goren and Okumura5 and impairment in other domains, including social functioning and home life or family relationships, is commonly observed in patients with MDD.Reference Kessler, Berglund and Demler6 Among individuals surveyed in the National Comorbidity Survey Replication, 87% of the 622 respondents who met Diagnostic and Statistical Manual of Mental Disorders, 4th ed. (DSM–IV), criteria for MDD reported at least moderate impairment in at least one functional domain; for 59% of respondents with MDD, functional impairment was characterized as severe or very severe.Reference Kessler, Berglund and Demler6
Functional impairment in patients with MDD seems to improve with treatment along with reduction in depressive symptoms.Reference Guico-Pabia, Fayyad and Soares7, Reference Dennehy, Marangell, Martinez, Balasubramani and Wisniewski8 However, functional recovery may lag behind symptomatic remission,Reference Sheehan, Chokka, Granger, Walton, Raskin and Sagman9–Reference Rush11 and residual symptoms of depression can delay full functional recovery even in patients who have achieved clinical remission.Reference Zajecka, Kornstein and Blier12 Treatment goals for patients with MDD, therefore, should include both symptom remission and functional recovery.Reference Gelenberg, Freeman and Markowitz13, Reference Lam, McIntosh and Wang14 Proper management of MDD, including early optimization of treatment,Reference Habert, Katzman and Oluboka15 requires the assessment of psychosocial functioning throughout treatment.Reference Gelenberg, Freeman and Markowitz13, Reference Lam, McIntosh and Wang14 This means that, in addition to commonly used scales for measuring symptomatic improvement, clinicians should administer instruments designed to assess function in domains that are important to the patient (e.g., work, social, family) in order to monitor functional response to treatment.Reference Gelenberg, Freeman and Markowitz13, Reference Lam, McIntosh and Wang14, Reference Lam, Filteau and Milev16
The Sheehan Disability Scale (SDS) is among the most commonly used function scales in clinical trials of antidepressant treatment of MDD.Reference Sheehan, Nakagome, Asami, Pappadopulos and Boucher17 It is a patient-rated instrument that comprises three domains designed to assess function in work, social life, and family life.Reference Sheehan, Harnett-Sheehan and Raj18 Functional remission has been defined as an SDS total score ≤6, or a score ≤2 on each subscale.Reference Sheehan and Sheehan19 Both mean changes in SDS scores and functional remission rates based on the SDS have been employed to determine the effects of antidepressant treatment on functional impairment associated with depression in clinical trials.Reference Soares, Kornstein, Thase, Jiang and Guico-Pabia20–Reference Mancini, Sheehan and Demyttenaere24 Cutler and colleaguesReference Cutler, Gommoll, Chen, Greenberg and Ruth25 have suggested that examining categorical shifts in improvement on the SDS (rather than simply assessing changes in mean scores) can be useful in assessing clinically meaningful functional improvement in patients treated for depression. Using pooled data from clinical trials of levomilnacipran for the treatment of MDD, they examined proportions of patients who shifted from more severe to less severe categories of functional impairment after 8 or 10 weeks of antidepressant treatment.Reference Cutler, Gommoll, Chen, Greenberg and Ruth25 When determined early in treatment, categorical shifts based on the SDS might also allow clinicians to better monitor patient progress over time.
Desvenlafaxine (administered as desvenlafaxine succinate) is a serotonin–norepinephrine reuptake inhibitor that has demonstrated antidepressant efficacy in short- and long-term clinical trials.Reference Boyer, Montgomery and Lepola26–Reference Rosenthal, Boyer, Vialet, Hwang and Tourian29 Desvenlafaxine is approved for the treatment of depression in adults with recommended therapeutic doses of 50 and 100 mg/d.30, 31 In this post-hoc pooled analysis of eight short-term, placebo-controlled trials of desvenlafaxine for the treatment of MDD, we assessed categorical shifts in SDS scores. In addition, we extended the analysis to examine whether assessment of early improvement in function could inform clinician decisions for optimizing a treatment plan. In other words, what degree of improvement in function can be expected early in treatment, and can the patient’s early progress (or lack thereof) indicate whether continuing this treatment is likely to bring the patient to functional recovery? The objectives of our analysis were to evaluate categorical changes in functional impairment measured by the SDS in patients with MDD treated with desvenlafaxine (at the approved doses of 50 or 100 mg) compared with placebo and to examine whether improvement in SDS subscale scores early in treatment could predict functional outcomes at study endpoint.
Methods
Dataset
This analysis included data pooled from eight multicenter, randomized, double-blind, placebo-controlled studies of desvenlafaxine for the treatment of MDD (Appendix Table 1; see Supplementary Materials for all appendix tables and figures). These comprise all phase 3, fixed-dose MDD studies including desvenlafaxine 50- and/or 100-mg dose arms conducted by the sponsor (Pfizer Inc) in which the SDS was administered.Reference Boyer, Montgomery and Lepola26, Reference Iwata, Tourian, Hwang, Mele and Vialet27, Reference DeMartinis, Yeung, Entsuah and Manley32–Reference Dunlop, Reddy, Yang, Lubaczewski, Focht and Guico-Pabia37 Each study was conducted in accordance with the ethical principles that have their origin in the Declaration of Helsinki and was consistent with the principles of good clinical practice and the applicable regulatory requirements in each participating country.
Patients were randomly assigned to receive placebo or a fixed dose of desvenlafaxine (10, 25, 50, 100, 200, or 400 mg) in each study (one study included duloxetine 60 mg/d), and data from placebo and the desvenlafaxine 50- and 100-mg/d treatment arms were included in the analysis. The studies were similar in design; however, six studies were 8 weeks in duration, one was 10 weeks in duration with a week 8 primary endpoint, and one lasted 12 weeks. The primary efficacy outcome for each study was change from baseline total score on the 17-item Hamilton Rating Scale for DepressionReference Hamilton38 (HAM–D17) at week 8 (except one study,Reference Dunlop, Reddy, Yang, Lubaczewski, Focht and Guico-Pabia37 which had a 12-week primary endpoint). The SDS was administered in each study as a secondary efficacy outcome or health outcome assessment.
Patients
All studies enrolled adult outpatients with a diagnosis of MDD based on the DSM–IV39 or the DSM–IV, Text Revision,40 with depressive symptoms for at least 30 days and a minimum baseline HAM–D17 total score of 20 (six studies) or Montgomery–Åsberg Depression Rating ScaleReference Montgomery and Åsberg41 (MADRS) score of 25 (two studies). One study enrolled perimenopausal and postmenopausal women aged 40 to 70 yearsReference Clayton, Kornstein and Dunlop36; one enrolled gainfully employed patients with an SDS total score ≥10 at both screening and baseline visits.Reference Dunlop, Reddy, Yang, Lubaczewski, Focht and Guico-Pabia37
The exclusion criteria were designed to select a sample of medically stable patients with a primary diagnosis of MDD. Patients with a lifetime diagnosis of bipolar or psychotic disorder or other comorbid psychiatric disorders (except generalized anxiety disorder, panic disorder, or social anxiety disorder, not considered primary) were excluded. Patients with clinically important abnormalities on screening physical examinations, including vital signs and electrocardiograms, were also excluded, as were those who had a significant risk of suicide, current psychoactive substance abuse, or dependence.
Outcome measures
The outcome measures for this pooled analysis were the three SDS subscales (work/studies, social life/leisure activities, and family life/home responsibilities) and SDS total score. For each subscale, patients rated the degree to which their activities were disrupted by depression using a scale from 0 to 10 (0=not at all, 1–3=mildly, 4–6=moderately, 7–9=markedly, and 10=extremely).Reference Sheehan, Harnett-Sheehan and Raj18 SDS total score was calculated by summing the subscale scores. SDS total and subscale scores at weeks 2, 4, and 8 were evaluated in this analysis. The timepoint of primary interest was week 8.
Statistical analysis
The efficacy analysis was performed on the intent-to-treat population, defined as all patients who were randomly assigned to treatment, took at least one dose of double-blinded study drug, and had at least one postbaseline HAM–D17 score.
Shift tables were generated for change in functional impairment category from baseline to week 8, using the last-observation-carried-forward (LOCF) approach for handling missing data. For each subscale, the proportions of patients who shifted functional impairment categories were summarized by treatment group, using the categories of none/mild (0–3), moderate (4–6), and marked/extreme (7–10).Reference Cutler, Gommoll, Chen, Greenberg and Ruth25 Shifts were also examined for the following endpoints of interest: improvement from moderate/extreme impairment (≥4) at baseline to mild/no impairment (≤3) at week 8 (LOCF); improvement from marked/extreme impairment (≥7) at baseline to moderate/no impairment (≤6) at week 8 (LOCF); improvement from marked/extreme impairment (≥7) at baseline to mild/no impairment (≤3) at week 8 (LOCF); and improvement from baseline of at least one category in all subscales (for patients with ≥1 subscale measured as moderate or higher impairment at baseline). The proportion of patients with worsening function, from moderate/no impairment (≤6) at baseline to marked/extreme impairment (≥7) at week 8 (LOCF), was also assessed.
Treatment comparisons for each of the endpoints of interest were assessed using logistic regression, including treatment group, baseline SDS subscale score, study, and the interactions of treatment group and baseline SDS subscale score as independent variables. If there was no statistically significant interaction effect (p≥0.05, two-sided), the interaction term was dropped from the model; none of the final models included the interaction term. Treatment effects were expressed as the estimated odds ratio (OR) of each active treatment over placebo, and desvenlafaxine 100 mg/d over desvenlafaxine 50 mg/d.
The predictive value of early improvement in function (change in SDS subscale score) for functional outcome at week 8 (LOCF) was assessed for each SDS subscale in an analysis of the four studies that included the desvenlafaxine 100-mg dose groups. The predictor analysis was conducted based on early improvement at week 2 and repeated based on improvement at week 4. For each subscale, the outcome of interest was a functional improvement shift from marked/extreme impairment (≥7) at baseline to mild/no impairment (≤3) at week 8 (LOCF). Full functional recovery is the ultimate goal of MDD treatment,Reference Gelenberg, Freeman and Markowitz13, Reference Lam, McIntosh and Wang14 with functional remission being defined as SDS subscale scores ≤2;Reference Sheehan and Sheehan19 for this particular analysis, we used a shift to mild/no impairment (≤3) as the endpoint given the low rates of functional remission at the end of an 8-week trialReference Soares, Endicott, Boucher, Fayyad and Guico-Pabia23 and the de-synchronicity between symptomatic remission and functional recovery.Reference Sheehan, Chokka, Granger, Walton, Raskin and Sagman9–Reference Rush11
A receiver operating characteristic (ROC) analysis was conducted to determine the optimal threshold of early improvement (percentage change from baseline in the SDS subscale score) for predicting achievement of the functional shift threshold for each respective subscale. First, changes in functioning over time were examined in patients included in the ROC analysis (patients with marked/extreme impairment (≥7) at baseline). Mean (± SD) percentage change from baseline in SDS subscale and total scores were summarized by treatment group. Next, optimal threshold of early improvement were determined using the Max–Min rule.Reference Gallop42 Sensitivity, specificity, positive predictive value (PPV), and negative predictive value (NPV) were computed for each threshold based on results from logistic regression with a shift to mild/no impairment (yes/no) at week 8 (LOCF) as the dependent variable and percentage change from baseline at week 2 as the independent variable. The proportions of patients who achieved a shift to mild/no impairment (≤3) at week 8 (LOCF) was calculated by threshold achievement (yes/no) at week 2 for each subscale. Odds ratios were computed from the logistic regression model to assess the predictability of week 2 improvement on a shift to mild/no impairment at week 8 (LOCF). The predictor analysis was repeated using early improvement at week 4.
Results
Patients
The intent-to-treat population for the eight pooled studies included 3,384 patients (Table 1). Of those, 3,252 patients (desvenlafaxine 50 mg, n=1,354; desvenlafaxine 100 mg, n=568; placebo, n=1,330) had SDS data at baseline.
Patient demographics and baseline characteristics: intent-to-treat population
HAM–D17=17-item Hamilton Rating Scale for Depression; SD=standard deviation; SDS=Sheehan Disability Scale.
Shift analysis at baseline, the percentages of patients in each treatment group who were in the markedly/extremely impaired category, ranged from 42.3 to 45.6% for the work subscale, 53.4 to 64.7% for the social subscale, and 49.2 to 59.3% for the family subscale; 26.5 to 37.7% were moderately impaired across treatment groups and subscales. At week 8 (LOCF), 47.2 to 55.6% of desvenlafaxine-treated patients had no/mild impairment (across doses and subscales; placebo, 37.6‒42.8%), and 27.8 to 32.1% were moderately impaired (placebo, 33.3–34.7%).
Among desvenlafaxine-treated patients, 17.3 to 25.2% of patients, across doses and subscales, shifted from marked/extreme impairment at baseline to no/mild impairment at week 8 (LOCF), compared with 12.7 to 16.3% of placebo-treated patients across subscales (Table 2). Across SDS subscales, 17.1 to 23.4% of placebo-treated patients versus 11.6 to 18.4% of desvenlafaxine-treated patients remained markedly/extremely impaired from baseline to week 8 (LOCF).
Shift table of functional impairment categories at baseline and week 8 (LOCF) by treatment group
* Work/studies subscale: placebo, n=1,296; desvenlafaxine 50 mg, n=1,324; desvenlafaxine 100 mg, n=540. LOCF=last observation carried forward; SDS=Sheehan Disability Scale.
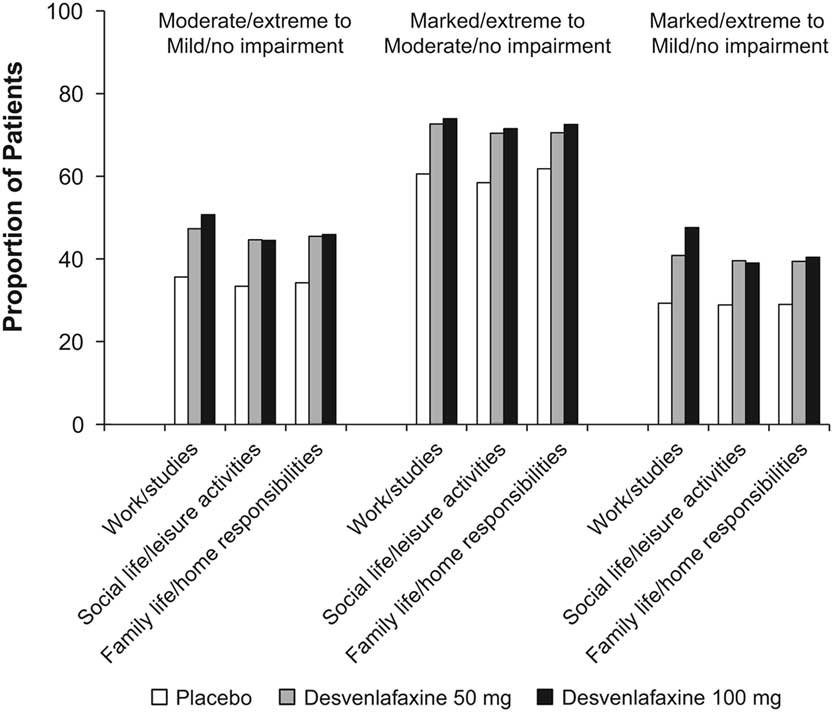
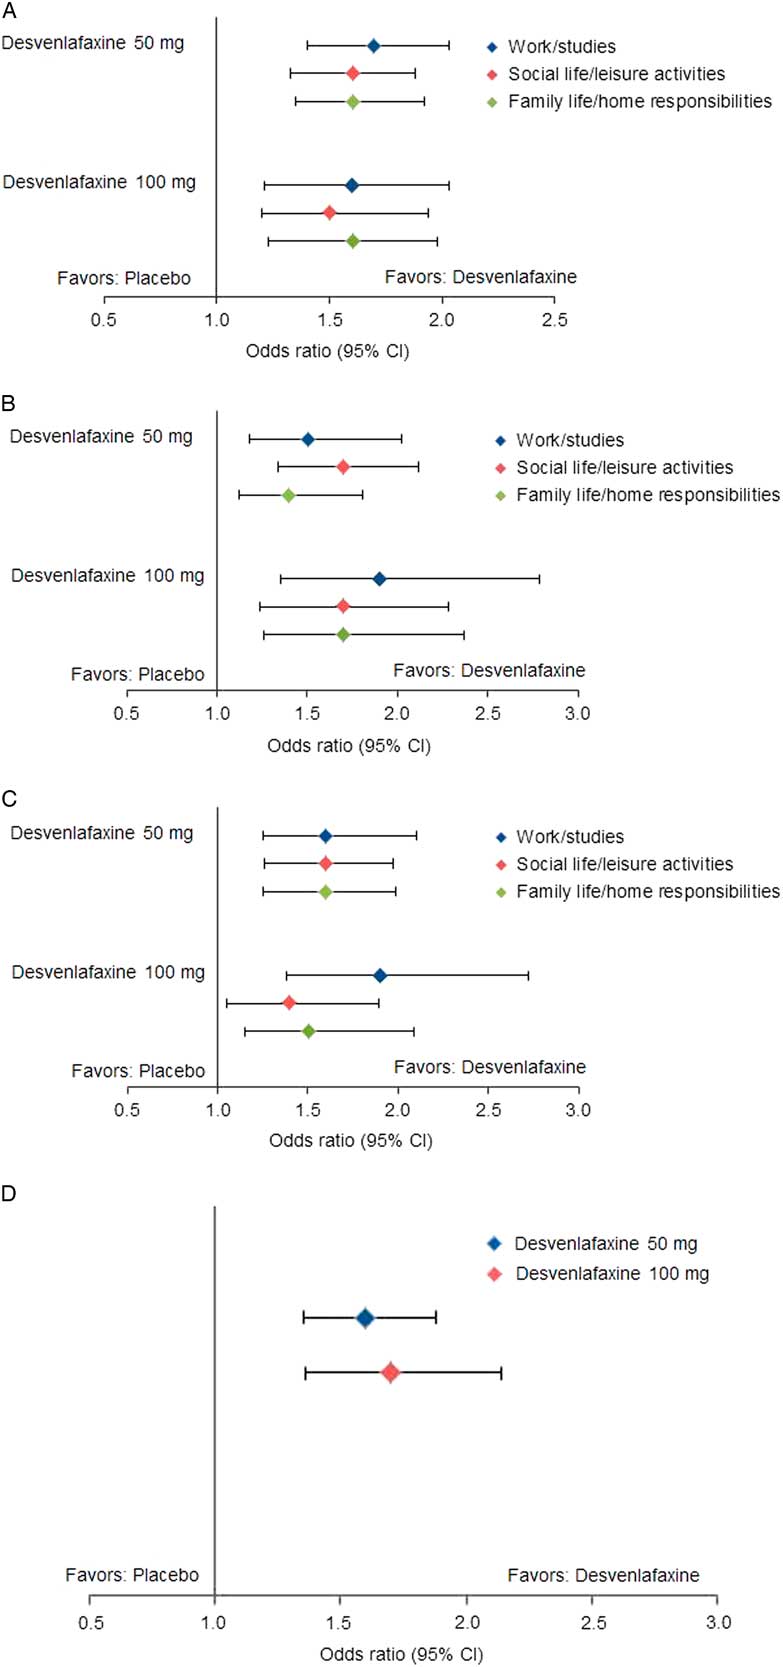
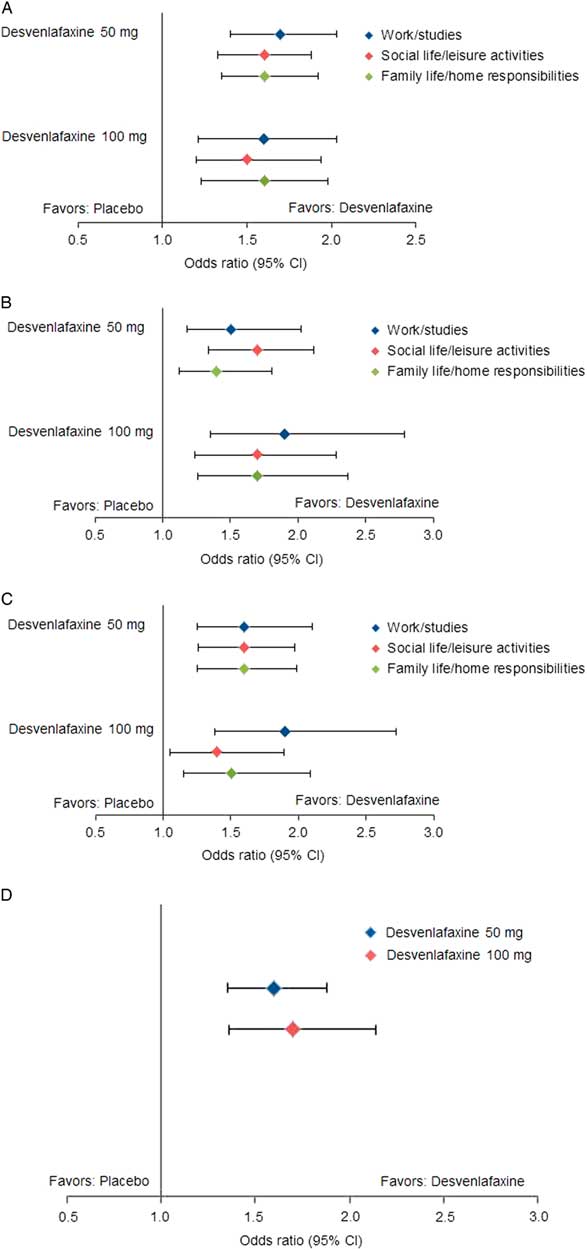
Statistically significantly greater proportions of patients in the desvenlafaxine 50- and 100-mg dose groups achieved improvement from baseline to week 8 (LOCF) for each of the prespecified shift endpoints of interest compared with the placebo group (all p≤0.02; see Table 3 and Figure 1). There were no statistically significant differences between desvenlafaxine dose groups. The odds ratios for categorical improvements in SDS subscales for desvenlafaxine compared with placebo are shown in Figure 2A–C. The proportion of patients with at least one category improvement in each subscale (among patients scoring moderate/extreme [≥4] in each scale at baseline) was also significantly greater for the desvenlafaxine groups versus placebo (both p<0.001; see Table 3 and Figure 2D).
Proportions of patients with categorical improvements from moderate/extreme at baseline to mild/no impairment at week 8 (LOCF), from marked/extreme at baseline to moderate/no impairment at week 8 (LOCF), and from marked/extreme at baseline to mild/no impairment at week 8 (LOCF) in each SDS subscale, by treatment group. LOCF=last observation carried forward; SDS=Sheehan Disability Scale. *p<0.001 vs. placebo; † p<0.01 vs. placebo; ‡ p<0.05 vs. placebo.
Estimated odds ratios for categorical improvements in SDS subscales, desvenlafaxine versus placebo. (A) Improvement from moderate/extreme impairment (≥4) at baseline to mild/no impairment (≤3) at week 8 (LOCF). (B) Improvement from marked/extreme impairment (≥7) at baseline to moderate/no impairment (≤6) at week 8 (LOCF). (C) Improvement from marked/extreme impairment (≥7) at baseline to mild/no impairment (≤3) at week 8 (LOCF). (D) Improvement of ≥1 category in each scale from baseline to week 8 (LOCF). CI=confidence interval; LOCF=last observation carried forward; SDS=Sheehan Disability Scale.
Proportions of patients with prespecified shifts of interest from baseline
* n/N=number shifted/number moderate/extreme (≥4) at baseline.
† p < 0.001 versus placebo.
‡ n/N=number shifted/number marked/extreme (≥7) at baseline.
§ p < 0.01 versus placebo.
‖ p < 0.05 versus placebo.
¶ Among patients scoring moderate/extreme (≥4) in each scale at baseline; n/N=number shifted/number moderate/extreme (≥4) at baseline.
# n/N=number shifted/number moderate/no impairment (≤6) at baseline.
Significantly smaller proportions of desvenlafaxine-treated patients versus placebo-treated patients worsened on the work/studies and family life/home responsibilities subscales (from moderate/no impairment [≤6] at baseline to marked/extreme impairment [≥7] at week 8 [LOCF]; both p≥0.0027); no significant difference was observed for the social life/leisure activities subscale (Table 3 and Appendix Figure 1). There were no statistically significant differences between the desvenlafaxine 100-mg and placebo groups in the proportions of patients who had worsening of function during treatment on any SDS subscale (Table 3).
Predictor analysis
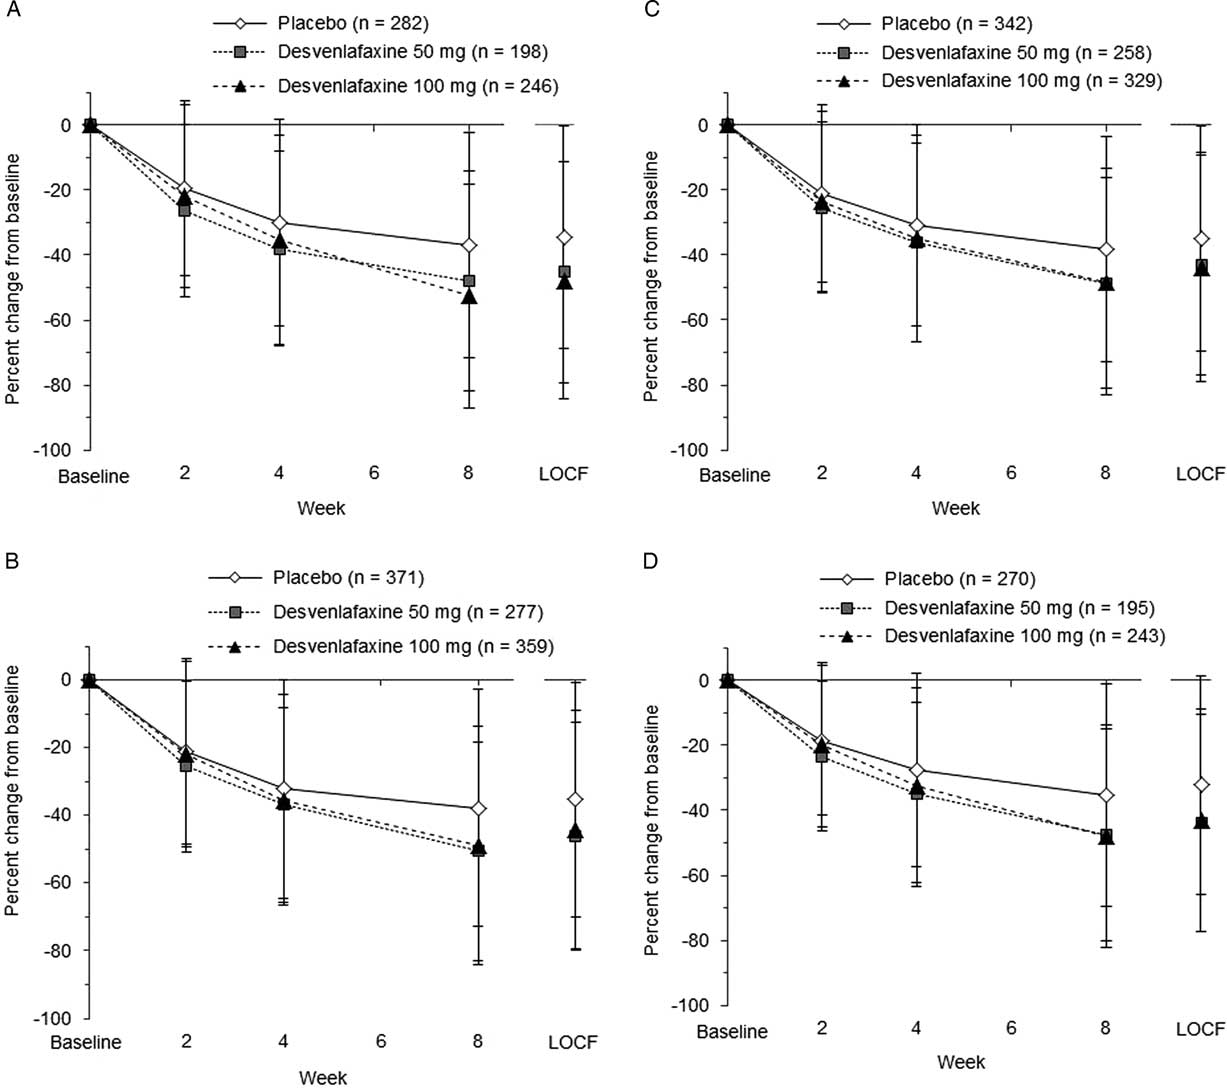
The predictive value of early functional improvement (at week 2 or 4) for achievement of a shift to mild/no impairment at week 8 (LOCF) was assessed in 1,007 patients with marked/extreme impairment (≥7) at baseline (only studies including the desvenlafaxine 100-mg dose). Percentage change from baseline over time in SDS total and subscale scores for those patients is shown in Figure 3. At week 2, mean percentage change from baseline for the SDS subscale scores ranged from −25.4 to −26.3% for desvenlafaxine 50 mg, −21.8 to −23.4% for desvenlafaxine 100 mg, and −19.4 to −21.2% for placebo.
Percentage change from baseline over time in SDS total and subscale scores. (A) SDS work/studies score. (B) SDS social life/leisure activities score. (C) SDS family life/home responsibilities score. (D) SDS total score. LOCF=last observation carried forward; SDS=Sheehan Disability Scale.
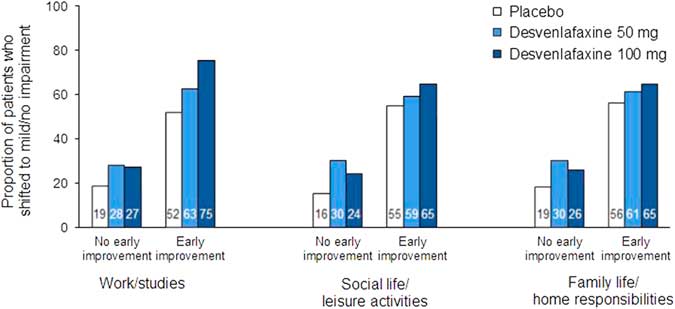
In the ROC analysis, optimal thresholds of improvement at week 2 for predicting a shift to a score of ≤3 (mild/no impairment) at week 8 (LOCF) from marked/extreme impairment (≥7) at baseline ranged from 14.3 to 28.6% across treatment groups for the three SDS subscales; for all treatments combined, thresholds ranged from 20 to 25% (Table 4). Optimal thresholds of improvement at week 4 ranged from 30.0 to 42.9% (all treatments, 37.5–40%; Appendix Table 2). Attainment of the threshold of change in SDS subscale score at either week 2 or 4 was a statistically significant predictor of a shift to mild/no impairment at week 8 (LOCF) for all SDS subscales, both overall and for each treatment group (all p<0.0001; Appendix Table 3). For all treatments and on all scales, NPV exceeded PPV for early improvement at week 2 (NPV=69.7–84.0, PPV=49.6–72.6) and at week 4 (NPV=75.7–90.5, PPV=60.5–78.6). Sensitivity ranged from 62.9 to 76.6 across treatments and subscales for week 2 improvement, and specificity ranged from 64.9 to 73.2 (74.2–82.1 and 68.4–82.3, respectively, for week 4). The proportions of patients who shifted to mild/no impairment at week 8 (LOCF) were significantly higher among patients who attained the early improvement threshold compared with those who did not (OR [early improvement: yes versus no]=3.35–8.14; all p<0.0001; see Figure 4 and Appendix Figure 2).
Proportions of patients who shifted to mild/no impairment (SDS subscale score ≤3) at week 8 (LOCF) by no early improvement vs. early improvement at week 2. Patients with marked/extreme impairment (≥7) at baseline only. Early improvement significantly predicted functional response at week 8 (LOCF) on each subscale for all treatment groups (all p<0.0001). LOCF=last observation carried forward; SDS=Sheehan Disability Scale.

Operating characteristics of improvement at week 2 to predict a shift to mild/no impairment (SDS subscale score ≤3) at week 8 (LOCF) for patients with marked/extreme impairment (≥7) at baseline: intent-to-treat population
LOCF=last observation carried forward; NPV=negative predictive value; PPV=positive predictive value; SDS=Sheehan Disability Scale.
Discussion
The results of this post-hoc analysis of categorical functional impairment shifts using SDS subscale scores demonstrate that greater proportions of desvenlafaxine-treated patients achieved shifts from marked/extreme impairment to moderate or mild/no impairment compared with placebo-treated patients. The proportions of patients shifting to less severe levels of impairment were significantly greater for desvenlafaxine compared with placebo for all prespecified endpoints: from moderate/extreme (≥4) to mild/no impairment (≤3), from marked/extreme (≥7) to moderate/no impairment (≤6), from marked/extreme (≥7) to mild/no impairment (≤3), and at least one category improvement in each subscale. Few patients treated with desvenlafaxine had adverse progress throughout treatment (i.e., shifted to poorer functional categories).
The current findings are consistent with those from previous analyses of SDS mean scores in desvenlafaxine trials showing significantly greater improvement from baseline for desvenlafaxine versus placebo.Reference Soares, Kornstein, Thase, Jiang and Guico-Pabia20 The use of a categorical approach to assess changes in function, however, might provide additional information on how individual patients’ functioning evolved over time.Reference Cutler, Gommoll, Chen, Greenberg and Ruth25 By examining shifts from marked/extreme impairment to moderate/no impairment versus mild/no impairment after 8 weeks of treatment, we addressed questions that are often raised in clinical practice regarding expectations for antidepressant treatment: How likely is a depressed patient with marked/extreme impairment at baseline to show some improvement to moderate impairment or better over the course of short-term treatment with antidepressants? Would it be realistic to target mild/no impairment after 8 weeks of treatment? In the current analysis, more than 70% of desvenlafaxine-treated patients reached the first goal (improvement to moderate impairment or better) for each SDS subscale, whereas approximately 40% of patients reached the goal of mild/no impairment. These results suggest that, for most patients with MDD, a longer course of treatment may be needed to attain complete functional remission. In an analysis with another serotonin–norepinephrine reuptake inhibitor antidepressant (levomilnacipran compared with placebo), a greater percentage of patients with MDD shifted from moderate/extreme or marked/extreme impairment at baseline to mild/no impairment, and from marked/extreme impairment to moderate/no impairment at study endpoint (week 8 or 10) on each SDS subscale and for SDS total score.Reference Cutler, Gommoll, Chen, Greenberg and Ruth25
Clinical guidelines for the management of depression emphasize the importance of monitoring response to treatment in the first weeks in order to make critical optimizations or adjustments (when appropriate and needed) as rapidly as possible.Reference Gelenberg, Freeman and Markowitz13, Reference Lam, McIntosh and Wang14 There is a growing body of research examining the value of measuring early improvement in depression symptoms to predict clinical efficacy outcomes.Reference Habert, Katzman and Oluboka15 An approximately 20% improvement from baseline in depression scale scores (e.g., HAM–D17 or MADRS total score) at week 2 significantly predicts clinical efficacy outcomes, such as symptom remission, at study endpoint.Reference Habert, Katzman and Oluboka15 Importantly, analyses have shown that failure to achieve early improvement can be an even stronger predictor of a poor clinical outcome,Reference Tohen, Case, Trivedi, Thase, Burke and Durell43, Reference Soares, Fayyad and Guico-Pabia44 so that early optimization of treatment may result in faster and better outcomes (e.g., functional recovery).Reference Habert, Katzman and Oluboka15 In a previous analysis of data from desvenlafaxine trials, we found that early improvement in SDS total score at week 2 was a significant predictor of functional response or remission based on SDS total score (SDS total score ≤12 and <7, respectively), as well as combined functional/symptomatic remission (SDS total score <7 and HAM–D17 total score ≤7) at week 8.Reference Soares, Endicott, Boucher, Fayyad and Guico-Pabia23 The results of the current predictor analysis further demonstrate that functional improvement at week 2 (or week 4) significantly predicts a shift in categorical measures of functioning—namely, from marked/extreme impairment (≥7) at baseline to mild/no impairment (≤3) for each SDS subscale. Based on the ROC analysis, the optimal threshold of improvement at week 2 for predicting functional outcome in this patient sample was approximately 20 to 25%, which would correspond to roughly a 1- to 2-point improvement in a subscale score for patients with marked impairment at baseline. Thus, failure to show a 1- to 2-point improvement on SDS subscales after 2 weeks of treatment suggests that the patient may need a treatment adjustment in order to eventually achieve full functional recovery. At week 4, an improvement of approximately 3 points on an SDS subscale (≈30‒40% improvement from baseline) also significantly predicts functional outcome, with a higher sensitivity and specificity compared with achievement of the 2-week threshold.
This post-hoc analysis had several limitations. First, this analysis was based on data pooled from multiple studies, which had some differences in design (e.g., number of treatment arms, duration of treatment, enrollment criteria). Also, none of the pooled studies was originally designed to assess functioning (i.e., SDS) as a primary endpoint. The generalizability of the current results is also limited by the sample characteristics: patients with few significant medical or psychological comorbidities were enrolled in the pooled studies. Finally, it would be of interest to fully explore the relationship between shifts in functioning and improvements in depressive symptoms over the course of antidepressant treatment. In a previous post-hoc analysis of a desvenlafaxine trial, early improvement in depressive symptoms was a significant predictor of SDS total score at week 12.Reference Lam, Endicott, Hsu, Fayyad, Guico-Pabia and Boucher45 Although outside the scope of the current analysis, future studies could better determine the association and timing of shifts in functioning as they relate to changes in symptom severity.
Conclusions
Categorical improvements in functional impairment, as measured by shifts in SDS subscale scores, were observed in greater percentages among patients treated with desvenlafaxine 50 or 100 mg/d compared with those who received placebo. Improvement in SDS subscale scores significantly predicted functional outcomes. The optimal early improvement threshold for predicting mild/no impairment at week 8 (LOCF) was an approximately 20 to 25% change, or a 1- to 2-point improvement, from baseline at week 2. These results suggest a potential role for early monitoring of functioning (in addition to symptomatic relief) in the course of antidepressant treatment; for that, the use of measures such as the SDS may help clinicians determine sooner than later whether treatment adjustments are needed.
Disclosures
Dr. Soares reports grants from the Ontario Brain Institute; from the Ontario Ministry of Research, Innovation, and Science; from the Canadian Network for Biomarker Integration in Depression; and personal fees from Pfizer.
Min Zhang is an employee of Pfizer.
Dr. Boucher is an employee of Pfizer Canada and owns Pfizer stock and stock options.
This study was sponsored by Pfizer Inc. Medical writing support was provided by Kathleen M. Dorries, PhD, of Peloton Advantage and was funded by Pfizer. The authors, however, are entirely responsible for the scientific content of the paper.
Clinical trial registration: NCT00072774, NCT00277823, NCT00300378, NCT00384033, NCT00798707, NCT00863798, NCT01121484, and NCT00824291 (ClinicalTrials.gov).
Supplementary material
To view supplementary materials for this article, please visit https://doi.org/10.1017/S1092852917000633


 Open access