

1. Introduction
Over the past century, groundbreaking medical advances have transformed healthcare in the US (and in most developed countries). (a) Improvements in preventive care, such as vaccinations and cancer screenings, have reduced the spread of diseases, while (b) breakthroughs in curative treatments, like antibiotics and chemotherapy, have lowered mortality risk for a given health condition (left panel of Fig. 1). During this period, health outcomes improved dramatically: (i) life expectancy surged from just over 60 years in 1935 to nearly 80 years in 2019, and (ii) the dispersion of age at death dropped from 25 years to 17 years (right panel of Fig. 1).
Selected medical advances and age at death in US: trends.
Notes: Left panel: Based on selected key medical advances detailed in Appendix A. Preventive advances and curative advances correspond to the trends (a) and (b) mentioned in the text. Right panel: Based on data from the Human Mortality Database.

How did medical trends (a) and (b) contribute to health outcomes (i) and (ii)? The answer is not straightforward, as both medical advances may have differing effects. For instance, advancements in preventive care not only enhance the benefits of prevention but also encourage its use, improving overall health across the population. This should increase the mean age at death, though its impact on the dispersion of age at death remains uncertain. Meanwhile, curative breakthroughs weaken the link between an agent’s health status and mortality risk, potentially narrowing the dispersion of age at death. However, this weaker link could also reduce agents’ incentives to use preventive care, making the effect of improved curative care on the mean age at death ambiguous.Footnote 1
To address our question, we present a simple theoretical setup that considers the impact of both preventive and curative medical advances on the distribution of age at death. To the best of our knowledge, this is the first model to differentiate between these two types of innovations. Moreover, while prior research has focused on increased longevity (see e.g., Nichols, Reference Nichols2004; Acemoglu and Johnson, Reference Acemoglu and Johnson2007; Chernew et al., Reference Chernew, Cutler, Ghosh and Landrum2016; Ewbank and Preston, Reference Ewbank, Preston, Caldwell, Findley, Caldwell, Santow, Cosford, Braid and Broers-Freeman1990; Hu et al., Reference Hu, Sung and Keeler1995; Cutler and Miller, Reference Cutler and Miller2005; Ferrie and Troesken, Reference Ferrie and Troesken2008), the role of medical innovations in reducing the dispersion of age at death remains largely unexplored. This paper fills this gap, arguing that while both preventive and curative technologies have increased life expectancy, it is mainly curative innovations that have reduced the dispersion of age at death.
Ours is a simple life-cycle model in which both health and lifespan are endogenous. As individuals age, they experience adverse health events, which accumulate over time and are collectively referred to as the health deficit. This deficit incurs associated costs, reflecting real-world expenses such as long-term care (LTC) as well as curative and palliative treatments. However, individuals can slow the accumulation of health deficits by consuming preventive care, which includes measures to avoid diseases and risk factors (e.g., vaccination) or to detect diseases early (e.g., screenings). In line with recent empirical evidence suggesting that age is malleable (see Scott, Reference Scott2023, and references therein), our model assumes that individuals do not die of old age per se but due to deteriorating health. Specifically, the time of death is treated as a random variable, with its probability distribution determined by the agent’s health deficit. Simply put, higher deficits result in a higher probability of death. We prevent unjustifiably long lifespans by imposing an exogenous maximum health deficit; if an individual reaches it, she will pass away immediately. Such a maximum health deficit endogenously determines a maximum lifespan. Section 3 discusses the empirical validity of these assumptions underlying our theoretical framework.
The life-cycle structure is essential for studying how advances in health technologies have shaped the distribution of age at death. Without life-cycle optimization behavior, both technologies would have similar effects on mortality patterns. Indeed, improved curative care would not alter the level of health deficit but reduce the mortality risk associated with each level of deficit. In contrast, improved preventive care would not change the mortality risk at a given deficit level but lower the entire trajectory of deficit accumulation over time. Despite these differences, the resulting effect on the age-at-death distribution would be observationally equivalent. However, when prevention is endogenous over life, changes in the two technologies affect prevention choices, and hence the death distribution, differently.
We conduct our quantitative analysis in two steps. In the first step, we calibrate our life-cycle model – including the levels of preventive and curative technologies – to replicate 2019 U.S. data. In the second step, we retain the same calibration, except that we set the levels of both medical technologies (as well as income and health care prices which have also significantly evolved over the past century) to match those of 1935. We then examine how the distribution of age at death evolved between 1935 and 2019 and compare our results to the changes observed in the data.
More precisely, in the first step, we begin by selecting values for the model parameters using 2019 US data, prior to the COVID-19 pandemic. We estimate the relationship between an individual’s health deficit and her instantaneous probability of death directly from the data. We use the National Health Interview Survey (NHIS) to calculate the average health deficit for individuals, assessing each age from 20 through 80. As in Mitnitski et al. (Reference Mitnitski, Mogilner, MacKnight and Rockwood2002) and Hosseini et al. (Reference Hosseini, Kopecky and Zhao2021), we construct our deficit measure as the ratio of accumulated adverse health effects to the total number of potential effects considered. Next, we obtain the probability of dying within the next year for individuals in this age range (20 to 80) from the Human Mortality Database. We then fit the functional form linking the probability of death to the health deficit used in our theoretical model, based on the empirical data. The remaining parameters are calibrated to match simple statistics on time-discounting, medical expenditures and the time profile of individual’s health deficit.
Quantitatively, the model generates an age-at-death distribution consistent with empirical observations, despite none of its moments being targeted during parameter selection. For example, the model gives a life expectancy of 83.9 years (compared to 79.5 in the data), a standard deviation of 15 (compared to 16.7), a skewness of −1.9 (compared to −1.6), and a 0.3% proportion of individuals reaching age 105 (compared to 0.5%). The model also captures the rising health expenditures-to-income ratio with age, which accelerates later in life due to high health deficits, in line with observed trends (De Nardi et al., Reference De Nardi, French, Jones and McCauley2016). Furthermore, in our setup, a 10% increase in income is associated with a one-year increase in life expectancy at age 40, which, though slightly higher than the roughly six-month increase estimated by Chetty et al. (Reference Chetty, Stepner, Abraham, Lin, Scuderi, Turner, Bergeron and Cutler2016), remains within a plausible range.
In our second step, we incorporate medical trends (a) and (b) into the model to assess how well it aligns with health outcomes (i)–(ii). Because these advances occurred alongside major socioeconomic shifts in the U.S., we also include (c) the sharp rise in the relative price of medical care and (d) the increase in real median income, followed by its later stagnation.
Quantifying medical progress is challenging, as measuring medical advances is notoriously difficult. To address this, we take a holistic approach, assuming that in 1935, when modern medicine was still in its early stages, the efficiency of preventive care was negligible, and individuals consumed none at that time. This allows us to derive time series for advances in both preventive and curative care. Incorporating these four trends enables the model to qualitatively capture health outcomes (i)–(ii). Life expectancy increases from 67 years in 1935 to 84 years in 2019, yielding a 17-year gain, compared to the 19 years observed in the data. As for the standard deviation of age at death, it decreases from 18 years to 15 years, reflecting a 3-year reduction, while the data shows an 8-year decline. In addition, the model replicates the surge in the share of GDP devoted to health care, as well as the rise in the use of preventive care.
Next, we perform a series of counterfactual exercises, introducing the trends cumulatively. First, we introduce advances in preventive care while holding the other three trends fixed at their 1935 levels. In this counterfactual scenario, life expectancy increases, as better preventive care improves health status across the population. This finding aligns with evidence on oral polio vaccination campaigns reducing child mortality in low- and middle-income countries (Nielsen et al., Reference Nielsen, Khalek, Benn, Aaby and Hanifi2021). However, the dispersion of age at death increases, contrary to what is observed in the data. Offsetting the rise in the dispersion of age at death requires advances in curative care, which reduce mortality risk and lead to a more compressed age-at-death distribution. This finding aligns with evidence on penicillin’s role in reducing infectious disease mortality variation in post-WWII Italy (Alsan et al., Reference Alsan, Atella, Bhattacharya, Conti, Mejía-Guevara and Miller2021). As expected, these reductions in mortality also contribute to higher life expectancy. Lastly, we incorporate economic trends (c) and (d) (price of medical care and median income), which have limited effects on the distribution of age at death but are crucial to explain the rise in health care’s share of total resources. This aligns with empirical evidence pointing to rising healthcare prices as a key driver of the growing share of output devoted to healthcare spending (Anderson et al., Reference Anderson, Reinhardt, Hussey and Petrosyan2003, Reference Anderson, Hussey and Petrosyan2019).
In sum, our model suggests that while both preventive and curative technologies have contributed to the increase in life expectancy in the US since 1935, it is curative innovations that have driven the reduction in the dispersion of age at death.
Finally, we examine the role of the four trends in the historical evolution of living standards, measured using a consumption-equivalent metric as in Jones and Klenow (Reference Jones and Klenow2016). We find that medical advances increased welfare by an average of 0.11% per year, with curative advances making the most significant contribution. We also highlight the negative welfare impact of rising healthcare prices. This finding aligns with widespread public concern about the escalating cost of medical care, which has led many Americans to forgo treatment, as documented in the NHIS.
All these insights remain robust across a range of sensitivity analyzes, including the introduction of a risk-free asset as well as variations in the parametrization strategy. Two caveats apply. First, our four trends are treated as exogenous and uncorrelated (see subsection 6.2 for further discussion). Second, we compare the stationary equilibrium in 1935 with that in 2019, leaving aside questions related to transitional dynamics (see subsections 8.1 and 8.2 for further discussion). These features keep the numerical exercises tractable without compromising the analysis.
The remainder of the paper is organized as follows. Section 2 reviews the literature. Section 3 sets out the empirical facts justifying our modeling approach. Section 4 lays out the continuous-time setup used for quantitative analysis. Section 5 describes our estimation and calibration procedures. Section 6 presents the main quantitative results. Section 7 tests their robustness, while Section 8 discusses our model’s limitations. Lastly, Section 9 concludes.
2. Literature review
Since the beginning of the twentieth century, human mortality has declined significantly (see Bergeron-Boucher et al., Reference Bergeron-Boucher, Canudas-Romo and Ebeling2015; Pestieau and Ponthiere, Reference Pestieau and Ponthiere2016, for extensive discussions). Improvements in living standards, nutrition, and medical care have been the main drivers of this change (Oeppen and Vaupel, Reference Oeppen and Vaupel2002; Riley, Reference Riley2001) In the first half of the century, early reductions in infant, child, and young adult mortality played a crucial role in narrowing lifespan disparities and increasing life expectancy, as deaths became more concentrated at older ages (Kannisto, Reference Kannisto2000; Edwards and Tuljapurkar, Reference Edwards and Tuljapurkar2005; Cheung et al., Reference Cheung, Robine, Paccaud and Marazzi2009; Vaupel et al., Reference Vaupel, Zhang and van Raalte2011). This pattern led to survival curves taking on a more rectangular shape, a phenomenon referred to as rectangularization (Fries, Reference Fries1980).
Starting in the 1950s and continuing into the 1960s, increases in life expectancy began to largely be driven by declines in mortality at old ages (Christensen et al., Reference Christensen, Doblhammer, Rau and Vaupel2009). Meanwhile, the dispersion of age at death began to decrease at a slower rate compared to earlier periods (Fig. 1). Under this emerging pattern, improvements in life expectancy are marked by a shift in the distribution of deaths to older ages, with only slight changes in its shape (Cheung and Robine, Reference Cheung and Robine2007; Canudas-Romo, Reference Canudas-Romo2008).
These historical developments, well-known to demographers and health researchers, motivate our research question: how have breakthroughs in both preventive care and curative treatments contributed to improvements in human mortality? To our knowledge, previous works have largely overlooked the distinction between technological progress in preventive and curative care, especially in the theoretical literature. Importantly, our analysis focuses on advancements in health technologies, given their crucial role as determinants of health (Cutler et al., Reference Cutler, Deaton and Lleras-Muney2006; Fuchs, Reference Fuchs2010). Extending our insights to frameworks that incorporate the earlier mentioned improvements in living standards and nutrition remains a topic for future research.
Murphy and Topel (Reference Murphy and Topel2006) also examine breakthroughs in health technologies during the twentieth century, quantifying the large economic benefits of declining mortality in the US population. Their theoretical framework distinguishes between two types of health technologies: those that extend life and those that improve quality of life. Our modeling choices incorporate these two effects. Breakthroughs in preventive care improve health, extending expected lifespans and reducing the economic burden of poor health, thereby freeing resources for utility-enhancing activities. Similarly, breakthroughs in curative care extend lifespans by lowering the probability of death for a given health condition. That said, our work extends Murphy and Topel (Reference Murphy and Topel2006) since we also study how advancements in health technologies shape changes in the distribution of age at death over time. In addition, in our framework, individuals’ health choices are endogenous and depend on the state of medical technology, unlike the exogenous approach in Murphy and Topel (Reference Murphy and Topel2006).
This endogeneity of health choices connects our work to the seminal contributions of Grossman (Reference Grossman1972) and Ehrlich and Becker (Reference Ehrlich and Becker1972), who stressed that health is, in part, an investment good that can be actively shaped by allocating effort and resources.Footnote 2 In this vein, Strulik (Reference Strulik2015) uses a life-cycle model to argue that income growth and medical advances in preventive care have reduced the biological age of middle-aged Americans by about 15 years and doubled their value of life. In subsequent work, Strulik (Reference Strulik2022) shows that when the effectiveness of preventive care increases by 50%, the average American lives over 7 years longer, and experiences a 10% increase in the value of life at age 65. An important distinction with these papers is that, in our setup, we also introduce curative technology and consider the age-at-death dispersion. Moreover, the uncertainty surrounding the time of death plays a more significant role. While the mentioned papers assume that the survival function depends solely on the current health deficit, we assume that it is the hazard rate that depends on it. Hence, our survival function depends on the entire history of health deficits since birth, not just the current one. Therefore, our approach introduces the probability of remaining alive each instant as a state variable with an associated co-state, known as the “value of life-saving” (Schelling, Reference Schelling and Chase1968; Mishan, Reference Mishan1971). This is not innocuous for the optimality conditions governing the model’s solution, and hence, for the role of uncertainty in determining the use of preventive care (see, e.g., Ehrlich, Reference Ehrlich2000, for an approach similar to ours, where the survival function depends on all past choices since birth). Finally, Garcia Sanchez et al. (Reference Garcia Sanchez, Marchiori and Pierrard2025) also propose a life-cycle model with endogenous prevention that affects health deficits. They examine how uncertainty regarding the monetary cost of health deficits influences prevention decisions. However, their model features a degenerate distribution of age at death, with the entire population dying at the same exogenous age, and therefore excludes curative technology.
Regarding the role of medical progress more broadly, Zhang et al. (Reference Zhang, Zhang and Lee2001) show that rising longevity has direct effects on fertility, human capital investment, and economic growth, as well as indirect effects through increasing unfunded social security contributions. However, Hwang and Kim (Reference Hwang and Kim2023) reveal that these effects vary depending on whether the increase in longevity is expected or unexpected. Examining barriers to health care, Frankovic and Kuhn (Reference Frankovic and Kuhn2019) suggest that a large share of the increase in longevity inequality between high- and low-income groups results from wealthier individuals’ better access to state-of-the-art medical care. Also worth noting is the extensive literature assessing the role of health insurance in rising medical expenditures, health, and life expectancy (see e.g., Pashchenko and Porapakkarm, Reference Pashchenko and Porapakkarm2017; Cole et al., Reference Cole, Kim and Krueger2019; Fonseca et al., Reference Fonseca, Michaud, Galama and Kapteyn2020; Frankovic and Kuhn, Reference Frankovic and Kuhn2023; Wang et al., Reference Wang, Yue, Chang and Chang2023; Chen et al., Reference Chen, Feng and Gu2025). All of these models differ significantly from ours, particularly in their formulation, methods, and research questions.
A key work on endogenous health investments is De Nardi et al. (Reference De Nardi, French and Jones2010), who explore why many elderly keep large amounts of assets until very late in life. Unlike ours, their model assumes that survival is exogenous to health investments and focuses on retired households. In addition, our work is close in spirit to Hall and Jones (Reference Hall and Jones2007), who study a simple setup where utility depends on quantity of life (life expectancy) and quality of life (consumption). They argue that health spending, which enables individuals to live longer and improve their quality of life, is a superior good with an income elasticity greater than one. As people become wealthier, they allocate a larger share of their resources to healthcare, since extending life does not experience the same diminishing returns as consumption. However, recent empirical research challenges this conclusion. Baltagi et al. (Reference Baltagi, Lagravinese, Moscone and Tosetti2017) estimate a global income elasticity using data from 167 countries between 1995 and 2012, finding that healthcare functions as a necessity with an income elasticity less than one, rather than as a superior good. Our framework reconciles these findings, suggesting that while the use of preventive care is indeed a superior good, a healthcare basket – encompassing not only preventive care, but also curative, palliative, and LTC – does feature an income elasticity less than one.
3. Motivating empirical facts
Our theoretical model will be built on four premises: first, as individuals age, they accumulate an increasing number of health problems, collectively termed the health deficit; second, as the health deficit rises, individuals become more vulnerable to death; third, although it depends on the health deficit, the time of death is uncertain; and fourth, individuals can affect the dynamic evolution of their health by consuming preventive care. This section discusses the empirical plausibility of these premises.
3.1. The health deficit increases with age
In their pioneering work, Mitnitski et al. (Reference Mitnitski, Mogilner, MacKnight and Rockwood2002) showed that an individual’s health status can be represented by an index variable, summarizing the accumulated number of health problems. The index, here termed the health deficit, is defined as the ratio of a person’s accumulated health issues to the total number of conditions considered.
To construct the health deficit index used throughout our paper, we use data from the 2023 NHIS, which provides a sample of over 29,000 individuals after restricting ages to 18 to 85. We consider 17 health conditions, all requiring a medical diagnosis to prevent variations in pain thresholds from affecting the index: hypertension, high cholesterol, coronary heart disease, angina pectoris, myocardial infarction, stroke, asthma, cancer, diabetes, chronic obstructive pulmonary disease, arthritis, dementia, hepatitis, epilepsy, Crohn’s disease, ulcerative colitis, and psoriasis. As in Mitnitski et al. (Reference Mitnitski, Mogilner, MacKnight and Rockwood2002) and Hosseini et al. (Reference Hosseini, Kopecky and Zhao2021), we weight all health conditions equally, so incurring one additional health condition increases one’s deficit by
 $ 1/17$
or
$ 1/17$
or
 $ 6\mathrm{\%}$
.
$ 6\mathrm{\%}$
.
After computing the health deficit for each individual in our sample, we group individuals by age and calculate the mean health deficit for the average person within each age range. To smooth out any abrupt spikes, we apply a four-year backward moving average. The left panel in Fig. 2 plots the resulting index, which is a convex function of age. In Section 5.2, we approximate this index with a parametric exponential function. We show that the fit is strong and implies an average growth rate of 3% per annum, as documented in studies involving Australia, Canada, Sweden, and the United States (Rockwood and Mitnitski, Reference Rockwood and Mitnitski2007).
Selected health-related data.
Notes: The left panel displays various statistics based on a sample of over 29,000 individuals from the NHIS. An individual’s health deficit is calculated as the ratio of accumulated health issues to the total number of conditions considered. The right panel plots the expected probability of living to be 75 or more as a function of self-reported health status on a sample of over 1400 individuals from the Health and Retirement Study. Each box chart displays the median, lower and upper quartiles, as well as the minimum and maximum values that are not outliers.

3.2. Higher health deficits make individuals more vulnerable to death
It is a scientific fact that most health issues included in our health deficit index increase the probability of death, making this modeling assumption uncontroversial. The right panel of Fig. 2 illustrates the link between health status and life expectancy using a sample of over 1400 individuals aged 50 to 54 from the 2019 Health and Retirement Study (HRS). It shows that as individuals report a deterioration in their health status – from excellent to poor – their expected probability of living to age 75 or beyond declines. Each box chart displays the median, lower and upper quartiles, as well as the minimum and maximum values that are not outliers.
3.3. The time of death is uncertain
While poor health increases the probability of death, uncertainty remains regarding the time of death. Knowing one’s current health status does not allow for a precise forecast of when death will occur.Footnote 3 The right panel of Fig. 2 illustrates this uncertainty, using data from the Health and Retirement Study. Consider the blue box chart representing individuals who self-report excellent health. The distance between the lower and upper quartiles can be interpreted as the uncertainty surrounding the median estimate of living to be 75 or more. Under this interpretation, the probability of a person aged 50 to 54 living to age 75 or more likely ranges from 60% to 100%, indicating significant uncertainty while remaining consistent with actuarial life tables. For example, the US 2019 actuarial life table in the Human Mortality Database indicates that the unconditional probability of someone aged 50 living to age 75 is roughly 70%.
3.4. Preventive care use slows down health deficit growth
The notion that health and aging are malleable is widely acknowledged, with extensive research focusing on the social determinants of health and aging (Marmot and Allen, Reference Marmot and Allen2014; Hood et al., Reference Hood, Gennuso, Swain and Catlin2016). In fact, recent studies indicate that the aging process is far more adaptable than previously believed (Scott, Reference Scott2023). Furthermore, healthy lifestyles, regular screening tests, and effective management of existing health conditions are known to prevent or delay serious illnesses such as strokes, heart disease, and cancer – conditions included in our health deficit index and leading causes of death.Footnote 4 For instance, Cole et al. (Reference Cole, Kim and Krueger2019) use survey data to show that Americans who exercise more than the cross-sectional average are more likely to maintain or improve their health statuses over the following six years.
All told, the empirical evidence supports the four premises underlying our theoretical analysis.
4. Baseline continuous-time life-cycle model
In this section, we introduce the model for evaluating the quantitative impact of breakthroughs in preventive and curative care on the distribution of age at death. Its key feature is that the time of death is a random variable, with its probability distribution determined by an individual’s health deficit, which depends on their endogenous use of preventive care. Advances in preventive care technology enhance its effectiveness in slowing the accumulation of health deficits, while improvements in curative care technology reduce the probability of death for a given health deficit level.
4.1. Setup
Let
 $ d\left(t\right)$
represent an individual’s health deficit, which evolves according to the following law of motion
$ d\left(t\right)$
represent an individual’s health deficit, which evolves according to the following law of motion
 $$\dot d\left( t \right) = \gamma \left( {d\left( t \right) - {{Ah{{(t)}^\beta }} \over \beta }} \right),$$
 $$ d\left(0\right)={d}_{0}\mathrm{},$$
where
 $ {d}_{0}$
is a strictly positive parameter. Equation (1) captures a simple dynamic: as an individual ages, her health deteriorates, reflected by the accumulation of the health deficit at a rate
$ {d}_{0}$
is a strictly positive parameter. Equation (1) captures a simple dynamic: as an individual ages, her health deteriorates, reflected by the accumulation of the health deficit at a rate
 $ \gamma \gt 0$
. However, preventive care,
$ \gamma \gt 0$
. However, preventive care,
 $ h\left(t\right)$
, slows down this process. Preventive care includes activities aimed at preventing diseases and risk factors (e.g., vaccination) or early disease detection (e.g., screening), with further examples in Appendix A. The parameter
$ h\left(t\right)$
, slows down this process. Preventive care includes activities aimed at preventing diseases and risk factors (e.g., vaccination) or early disease detection (e.g., screening), with further examples in Appendix A. The parameter
 $ A\gt 0$
governs the effectiveness of preventive care, while
$ A\gt 0$
governs the effectiveness of preventive care, while
 $ \beta \in \left(\mathrm{0,1}\right)$
introduces diminishing returns to scale, as in Dalgaard and Strulik (Reference Dalgaard and Strulik2014). This reflects the principle that as preventive care efforts increase, each additional intervention yields a smaller marginal improvement in health. For example, repeated screenings for the same cancer type within a short period provide little added value beyond the first.
$ \beta \in \left(\mathrm{0,1}\right)$
introduces diminishing returns to scale, as in Dalgaard and Strulik (Reference Dalgaard and Strulik2014). This reflects the principle that as preventive care efforts increase, each additional intervention yields a smaller marginal improvement in health. For example, repeated screenings for the same cancer type within a short period provide little added value beyond the first.
The individual’s lifespan extends from
 $ 0$
to
$ 0$
to
 $ T$
, where
$ T$
, where
 $ T$
is a random variable. The probability law governing
$ T$
is a random variable. The probability law governing
 $ T$
is defined by the hazard rate
$ T$
is defined by the hazard rate
 $ \lambda \left(d\right(t\left)\right)\ge 0$
, which is a
$ \lambda \left(d\right(t\left)\right)\ge 0$
, which is a
 $ {C}^{1}$
-function of
$ {C}^{1}$
-function of
 $ d\left(t\right)$
with
$ d\left(t\right)$
with
 $ {\lambda }_{d}\left(d\right(t\left)\right)\gt 0$
. It follows that the probability that the individual is alive at time
$ {\lambda }_{d}\left(d\right(t\left)\right)\gt 0$
. It follows that the probability that the individual is alive at time
 $ t$
is
$ t$
is
 $ \mathrm{\Lambda }\left(t\right)={\mathrm{e}}^{-{\int }_{0}^{t}\, \lambda \left(d\right(u\left)\right)\mathrm{d}u}$
. We prevent unjustifiably long lifespans by imposing an exogenous maximum health deficit
$ \mathrm{\Lambda }\left(t\right)={\mathrm{e}}^{-{\int }_{0}^{t}\, \lambda \left(d\right(u\left)\right)\mathrm{d}u}$
. We prevent unjustifiably long lifespans by imposing an exogenous maximum health deficit
 $\overline d \gt {d_0}$
; if the individual reaches
$\overline d \gt {d_0}$
; if the individual reaches
 $ {\overline d}$
, she passes away immediately. Consequently, the maximum attainable age is implicitly determined by
$ {\overline d}$
, she passes away immediately. Consequently, the maximum attainable age is implicitly determined by
 $ d\left({\overline T}\right)={\overline d}$
.
$ d\left({\overline T}\right)={\overline d}$
.
The above specification implies that the likelihood of death increases with the individual’s health deficit. Thus, changes in the function
 $ \lambda \left(d\right(t\left)\right)$
that lower its value for a given health deficit reflect improvements in curative treatments that reduce mortality risks (e.g., antibiotics, chemotherapy, and statins), with further examples in Appendix A.
$ \lambda \left(d\right(t\left)\right)$
that lower its value for a given health deficit reflect improvements in curative treatments that reduce mortality risks (e.g., antibiotics, chemotherapy, and statins), with further examples in Appendix A.
At each instant
 $ t\in [0,T]$
, the individual receives a constant income
$ t\in [0,T]$
, the individual receives a constant income
 $ y\gt 0$
. Her budget constraint is
$ y\gt 0$
. Her budget constraint is
 $$ c\left(t\right)+\theta \left(h\right(t)+Bd(t\left)\right)=y\mathrm{},$$
where
 $ c\left(t\right)$
represents consumption and
$ c\left(t\right)$
represents consumption and
 $ \theta \gt 0$
is the relative price of medical-related activities. The term
$ \theta \gt 0$
is the relative price of medical-related activities. The term
 $ B$
is a positive parameter that captures the monetary cost associated with the health deficit,
$ B$
is a positive parameter that captures the monetary cost associated with the health deficit,
 $ \theta Bd\left(t\right)$
. These costs represent pure expenditures with no direct effect on the health deficit and can be viewed as expenses related to LTC (e.g., nursing, home care), palliative care, as well as some types of curative expenditures. Equation (3) implicitly includes several simplifying assumptions: we consider only the active population, assume constant income over the life cycle, and exclude income heterogeneity. Moreover, no risk-free assets are available to smooth consumption over time. We examine and discuss these assumptions in detail in Sections 7 and 8.
$ \theta Bd\left(t\right)$
. These costs represent pure expenditures with no direct effect on the health deficit and can be viewed as expenses related to LTC (e.g., nursing, home care), palliative care, as well as some types of curative expenditures. Equation (3) implicitly includes several simplifying assumptions: we consider only the active population, assume constant income over the life cycle, and exclude income heterogeneity. Moreover, no risk-free assets are available to smooth consumption over time. We examine and discuss these assumptions in detail in Sections 7 and 8.
The individual’s expected lifetime utility is
 $$\int _0^{\mathop T\limits^ - }{\mkern 1mu} {e^{ - \rho t}}\Lambda \left( t \right){{c{{(t)}^{1 - \sigma }} - 1} \over {1 - \sigma }}{\rm{d}}t,$$
where
 $ \rho \ge 0$
is the discount rate. We take a constant relative risk aversion (CRRA) utility function, where
$ \rho \ge 0$
is the discount rate. We take a constant relative risk aversion (CRRA) utility function, where
 $ 1/\sigma \gt 0$
is the inter-temporal elasticity of substitution. For future reference, our numerical exercises ensure
$ 1/\sigma \gt 0$
is the inter-temporal elasticity of substitution. For future reference, our numerical exercises ensure
 $ c\left(t\right)\gt 1\forall t$
, so that utility flows remain strictly positive. Otherwise, the individual would prefer an earlier death, as continuing life would result in negative utility (see e.g., Dragone and Strulik, Reference Dragone and Strulik2020, for a similar discussion).
$ c\left(t\right)\gt 1\forall t$
, so that utility flows remain strictly positive. Otherwise, the individual would prefer an earlier death, as continuing life would result in negative utility (see e.g., Dragone and Strulik, Reference Dragone and Strulik2020, for a similar discussion).
The individual chooses sequences
 $ \left\{c\right(t),h(t){\}}_{t=0}^{{\overline T}}$
to maximize (4), subject to (1)–(3) and the endogenous hazard rate
$ \left\{c\right(t),h(t){\}}_{t=0}^{{\overline T}}$
to maximize (4), subject to (1)–(3) and the endogenous hazard rate
 $ \lambda \left(d\right(t\left)\right)$
.Footnote
5
$ \lambda \left(d\right(t\left)\right)$
.Footnote
5
4.2. Solution
We solve our stochastic control problem by reformulating it as an equivalent deterministic control problem.Footnote
6
As mentioned earlier, the probability that the individual is alive at time
 $ t$
is
$ t$
is
 $ \mathrm{\Lambda }\left(t\right)={\mathrm{e}}^{-{\int }_{\!\!\!0}^{t}\, \lambda \left(d\right(u\left)\right)\mathrm{d}u}$
. Hence, we have
$ \mathrm{\Lambda }\left(t\right)={\mathrm{e}}^{-{\int }_{\!\!\!0}^{t}\, \lambda \left(d\right(u\left)\right)\mathrm{d}u}$
. Hence, we have
 $ \dot{\mathrm{\Lambda }}\left(t\right)=-\lambda \left(d\right(t\left)\right)\mathrm{\Lambda }\left(t\right)$
with
$ \dot{\mathrm{\Lambda }}\left(t\right)=-\lambda \left(d\right(t\left)\right)\mathrm{\Lambda }\left(t\right)$
with
 $ \mathrm{\Lambda }\left(0\right)=1$
, allowing us to write the Hamiltonian function
$ \mathrm{\Lambda }\left(0\right)=1$
, allowing us to write the Hamiltonian function
 $$H\left( t \right) = {{\rm{e}}^{ - \rho t}}\Lambda \left( t \right){{c{{(t)}^{1 - \sigma }} - 1} \over {1 - \sigma }} - \tilde q\left( t \right)\gamma \left( {d\left( t \right) - {{Ah{{(t)}^\beta }} \over \beta }} \right) $$
 $$\ \ \ \ \ \ \ \ \ \ \ \ \ \ -{\tilde p}\left(t\right)\lambda \left(d\right(t\left)\right)\mathrm{\Lambda }\left(t\right)+{\tilde \varepsilon }\left(t\right)\left[y-c\left(t\right)-\theta \left(h\right(t)+Bd(t\left)\right)\right].$$
Here
 $ -{\tilde q}\left(t\right)$
is the shadow price of health deficit and measures the value of an infinitesimal increase in
$ -{\tilde q}\left(t\right)$
is the shadow price of health deficit and measures the value of an infinitesimal increase in
 $ d\left(t\right)$
. Similarly,
$ d\left(t\right)$
. Similarly,
 $ {\tilde p}\left(t\right)$
is the shadow price of the probability of survival, better known as the value-of-life-saving (Schelling, Reference Schelling and Chase1968; Mishan, Reference Mishan1971). It measures the remaining lifetime utility along the optimal path from
$ {\tilde p}\left(t\right)$
is the shadow price of the probability of survival, better known as the value-of-life-saving (Schelling, Reference Schelling and Chase1968; Mishan, Reference Mishan1971). It measures the remaining lifetime utility along the optimal path from
 $ t$
to
$ t$
to
 $ {\overline T}$
. Lastly,
$ {\overline T}$
. Lastly,
 $ {\tilde \varepsilon }\left(t\right)$
measures the change in the optimal value of the utility function per unit of change in the budget constraint. Economic logic suggests that all three co-state variables
$ {\tilde \varepsilon }\left(t\right)$
measures the change in the optimal value of the utility function per unit of change in the budget constraint. Economic logic suggests that all three co-state variables
 $ \left\{{\tilde q}\right(t),{\tilde p}(t),{\tilde \varepsilon }(t\left)\right\}$
should be positive.
$ \left\{{\tilde q}\right(t),{\tilde p}(t),{\tilde \varepsilon }(t\left)\right\}$
should be positive.
Applying the maximum principle to
 $ H\left(t\right)$
yields
$ H\left(t\right)$
yields
 $$\left\{\begin{matrix}\!\!\!\!\!\!\!\!\!\!\!\!\!\!\!\!\!\!\!\!\!\!\!\!\!\!\!\!\!\!\!\!\!\!\!\!\!\!\!\!\!\!\!\!\!\!\!\!\!\!\!\!\!\!\!\!\!\!\!\!\!\!\!\!\!\!\!H_h = 0, \quad H_c = 0, \quad H_{\tilde{\varepsilon}} = 0, \\ H_d = -\dot{\tilde{q}}(t), \quad H_{\Lambda} = -\dot{\tilde{p}}(t), \quad H_{-\tilde{q}} = \dot{d}(t), \quad H_{\tilde{p}} = \dot{\Lambda}(t).\end{matrix}\right.$$
These necessary optimality conditions are standard in deterministic control theory. Furthermore, the concavity of the utility function ensures that these necessary conditions are also sufficient. Let
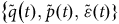
 $ q\left(t\right):={\mathrm{e}}^{\rho \mathrm{}t}{\tilde q}\left(t\right)/\mathrm{\Lambda }\left(t\right)$
,
$ q\left(t\right):={\mathrm{e}}^{\rho \mathrm{}t}{\tilde q}\left(t\right)/\mathrm{\Lambda }\left(t\right)$
,
 $ \epsilon \left(t\right):={\mathrm{e}}^{\rho \mathrm{}t}{\tilde \varepsilon }\left(t\right)/\mathrm{\Lambda }\left(t\right)$
and
$ \epsilon \left(t\right):={\mathrm{e}}^{\rho \mathrm{}t}{\tilde \varepsilon }\left(t\right)/\mathrm{\Lambda }\left(t\right)$
and
 $ p\left(t\right):={\mathrm{e}}^{\rho \mathrm{}t}{\tilde p}\left(t\right)$
. The optimal control system must thus solve the following system of differential equations
$ p\left(t\right):={\mathrm{e}}^{\rho \mathrm{}t}{\tilde p}\left(t\right)$
. The optimal control system must thus solve the following system of differential equations
 $$\left\{ {\matrix{ { \dot d(t) = \gamma \left( {d\left( t \right) - {{Ah{{(t)}^\beta }} \over \beta }} \right),} \ \ \ \ \ \ \ \qquad\qquad\qquad\qquad\qquad\ \ (5a)\cr {\mathop \Lambda \limits^. \left( t \right) = - \lambda \left( {d\left( t \right)} \right)\Lambda \left( t \right),} \qquad\qquad\qquad\qquad\qquad\quad\ \ \ \ \ \ \ \ (5b)\cr {\dot q\left( t \right) = \left( {\rho + \lambda \left( {d\left( t \right)} \right) - \gamma } \right)q\left( t \right) - {\lambda _d}\left( {d\left( t \right)} \right)p\left( t \right) - \theta B\left( t \right),} \ \ \ \ (5c)\cr {\dot p\left( t \right) = \left( {\rho + \lambda (d(t))} \right)p\left( t \right) - {{{{\epsilon(t)}^{ - {{1 - \sigma } \over \sigma }}} - 1} \over {1 - \sigma }},} \qquad\qquad\qquad\quad\ \ \ (5d)\cr } } \right.$$
as well as the three intratemporal conditions
 $$\left\{ {\matrix{ {c(t) = \epsilon {{(t)}^{ - {1 \over \sigma }}},} \qquad\qquad\qquad\qquad\qquad\qquad\qquad\qquad\quad(6a)\cr {h\left( t \right) = {{\left( {{{\gamma Aq\left( t \right)} \over {\theta \left( t \right)}}} \right)}^{{1 \over {1 - \beta }}}},} \qquad\qquad\qquad\qquad\qquad\qquad\qquad\quad\ (6b)\cr {y = c\left( t \right) + \theta (h(t) + Bd(t)).} \qquad\qquad\qquad\qquad\qquad\ \ \ \ (6c)\cr } } \right.$$
Solving the above system of differential equations requires a set of boundary conditions, which in our setup are naturally given by
 $$d\left( 0 \right) = {d_0},{\rm{\;\;\Lambda }}\left( 0 \right) = 1,{\rm{\;\;}}d\left( {\overline T} \right){\rm{\;}} = \overline d{\rm{\;}},{\rm{\;\;}}p\left( {\overline T} \right) = 0.$$
The first three conditions have been previously introduced. As for the last condition, it ensures that the remaining lifetime utility at the maximum attainable age
 $ {\overline T}$
is zero, which must be the case since the objective function does not include any bequest terms. Lastly, since
$ {\overline T}$
is zero, which must be the case since the objective function does not include any bequest terms. Lastly, since
 $ {\overline T}$
is free, it must be endogenously determined by
$ {\overline T}$
is free, it must be endogenously determined by
 $ H\left({\overline T}\right)=0$
(see e.g., Seierstad, Reference Seierstad2009, for a formal derivation).
$ H\left({\overline T}\right)=0$
(see e.g., Seierstad, Reference Seierstad2009, for a formal derivation).
Unfortunately, there is no closed-form solution to this nonlinear boundary value problem. Therefore, after selecting all parameter values, the next section will solve it numerically using the collocation method proposed by Shampine et al. (Reference Shampine, Gladwell and Thompson2003).
4.3. Stationary distribution
So far, we have described the optimization problem for a single individual. However, our objective is to study the distribution of age at death across the entire population. To address this, we consider the stationary distribution implied by our model. Specifically, we assume that at each instant, a new cohort of size 1 is born, represented by
 $ n\left(0\right)=1$
. Since all individuals are identical and face the same optimization problem, population dynamics are captured by
$ n\left(0\right)=1$
. Since all individuals are identical and face the same optimization problem, population dynamics are captured by
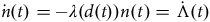 $ \dot{n}\left(t\right)=-\lambda \left(d\right(t\left)\right)n\left(t\right)=\dot{\mathrm{\Lambda }}\left(t\right)$
. Thus,
$ \dot{n}\left(t\right)=-\lambda \left(d\right(t\left)\right)n\left(t\right)=\dot{\mathrm{\Lambda }}\left(t\right)$
. Thus,
 $ \mathrm{\Lambda }\left(t\right)$
, which indicates the probability of a single individual being alive at age
$ \mathrm{\Lambda }\left(t\right)$
, which indicates the probability of a single individual being alive at age
 $ t$
, also represents the size of the population aged
$ t$
, also represents the size of the population aged
 $ t$
in the stationary equilibrium.
$ t$
in the stationary equilibrium.
Therefore, the first moment of the distribution of age at death, referred to as life expectancy, is
 $$ {\mu }_{T}={\int }_{0}^{{\overline T}}\, t\lambda \left(d\right(t\left)\right)\mathrm{\Lambda }\left(t\right)\mathrm{}\mathrm{}\mathrm{d}t+{\overline T}\left[1-{\int }_{0}^{{\overline T}}\, \lambda \left(d\right(t\left)\right)\mathrm{\Lambda }\left(t\right)\ \mathrm{d}t\right].$$
The first term integrates over ages up to the maximum admissible age, weighting each age by its density,
 $ \lambda \left(d\right(t\left)\right)\mathrm{\Lambda }\left(t\right)$
. The second term adjusts for the probability of surviving to the maximum age,
$ \lambda \left(d\right(t\left)\right)\mathrm{\Lambda }\left(t\right)$
. The second term adjusts for the probability of surviving to the maximum age,
 $ {\overline T}$
. Similarly, the variance of age at death is
$ {\overline T}$
. Similarly, the variance of age at death is
 $$ {\sigma }_{T}^{2}={\int }_{0}^{{\overline T}}\, (t-{\mu }_{T}{)}^{2}\lambda (d\left(t\right)\left)\mathrm{\Lambda }\right(t)\mathrm{}\mathrm{}\mathrm{d}t+({\overline T}-{\mu }_{T}{)}^{2}\left[1-{\int }_{0}^{{\overline T}}\, \lambda \left(d\right(t\left)\right)\mathrm{\Lambda }\left(t\right)\ \mathrm{d}t\right].$$
For future reference, the share of total resources spent on healthcare is
 $${H_1} = {{\theta \int _0^{\overline T}\left( {h\left( t \right) + Bd\left( t \right)} \right)\Lambda \left( t \right)\ {\rm{d}}t} \over {y\int _0^{\overline T}\Lambda \left( t \right)\ {\rm{d}}t}},$$
while the share spent on preventive care is
 $${H_2} = {{\theta \int _0^{\overline T}h\left( t \right)\Lambda \left( t \right)\ {\rm{d}}t} \over {y\int _0^{\overline T}\Lambda \left( t \right)\ {\rm{d}}t}}.$$
5. Mapping the model to the data
As explained in the introduction, we conduct our quantitative analysis in two steps. In this Section 5, we select parameter values to align the model with key observations from the US in 2019, prior to the impact of COVID-19. Then, in the next Section 6, we keep the same calibration, except that we set the levels of both medical technologies, income and health care prices to their observed counterparts in 1935, and we examine how the distribution of age at death evolved between 1935 and 2019.
To reproduce 2019 U.S. data, we group the model parameters into three sets: a subset determined a priori,
 $ \{\beta, \theta, y,\sigma \}$
; a subset estimated from data,
$ \{\beta, \theta, y,\sigma \}$
; a subset estimated from data,
 $ \{\gamma, \lambda (d),\rho, {d}_{0},{\overline d}\}$
; and a subset calibrated within the model to minimize the distance between data targets and model outcomes,
$ \{\gamma, \lambda (d),\rho, {d}_{0},{\overline d}\}$
; and a subset calibrated within the model to minimize the distance between data targets and model outcomes,
 $ \{A,B\}$
. Table 1 summarizes the calibration.
$ \{A,B\}$
. Table 1 summarizes the calibration.
Model parametrization

Notes:
 $ t=0$
in the model corresponds to the age of 20 years, and
$ t=0$
in the model corresponds to the age of 20 years, and
 $ t={\bar T}$
corresponds to the age of 105 years. Since our calibration implies that
$ t={\bar T}$
corresponds to the age of 105 years. Since our calibration implies that
 $ {\bar T}=4.3$
, one unit of time in the model corresponds to
$ {\bar T}=4.3$
, one unit of time in the model corresponds to
 $ (105-20)/4.3\approx 20$
years.
$ (105-20)/4.3\approx 20$
years.
5.1. A priori chosen parameters
To solve the model, we need to express
 $ \epsilon \left(t\right)$
as a function of the state and co-state variables. We do this by substituting equations (6a) and (6b) into equation (6c), which yields an equation in
$ \epsilon \left(t\right)$
as a function of the state and co-state variables. We do this by substituting equations (6a) and (6b) into equation (6c), which yields an equation in
 $ \epsilon \left(t\right)$
. The solution to this equation gives
$ \epsilon \left(t\right)$
. The solution to this equation gives
 $ \epsilon \left(t\right)$
, but it is guaranteed to be unique and positive only for certain values of
$ \epsilon \left(t\right)$
, but it is guaranteed to be unique and positive only for certain values of
 $ (\beta, \sigma )$
. Appendix B1 shows that uniqueness holds under any of the following conditions: (i)
$ (\beta, \sigma )$
. Appendix B1 shows that uniqueness holds under any of the following conditions: (i)
 $ \sigma =1-\beta $
; (ii)
$ \sigma =1-\beta $
; (ii)
 $ \sigma =0.5(1-\beta )$
; or (iii)
$ \sigma =0.5(1-\beta )$
; or (iii)
 $ \sigma =2(1-\beta )$
. Outside of these cases, uniqueness and positivity of
$ \sigma =2(1-\beta )$
. Outside of these cases, uniqueness and positivity of
 $ \epsilon \left(t\right)$
are not assured. In this paper, we choose
$ \epsilon \left(t\right)$
are not assured. In this paper, we choose
 $ \sigma =1$
, which corresponds to log utility. Under this specification, only condition (iii) implies
$ \sigma =1$
, which corresponds to log utility. Under this specification, only condition (iii) implies
 $ \beta \in \left(\mathrm{0,1}\right)- \mathrm{}$
that is, diminishing returns to preventive care – and leads to
$ \beta \in \left(\mathrm{0,1}\right)- \mathrm{}$
that is, diminishing returns to preventive care – and leads to
 $ \beta =0.5$
. In subsection 7.4, we conduct a sensitivity analysis on the parameter pair
$ \beta =0.5$
. In subsection 7.4, we conduct a sensitivity analysis on the parameter pair
 $ (\beta, \sigma )$
.
$ (\beta, \sigma )$
.
Next, we set the income stream
 $ y$
, which is a scaling parameter, to 3, ensuring that
$ y$
, which is a scaling parameter, to 3, ensuring that
 $ c\left(t\right)\gt 1$
for all
$ c\left(t\right)\gt 1$
for all
 $ t$
. This choice keeps utility flows positive, ruling out any preference-for-death scenario. Lastly, we normalize the relative price of medical care,
$ t$
. This choice keeps utility flows positive, ruling out any preference-for-death scenario. Lastly, we normalize the relative price of medical care,
 $ \theta $
, to 1.
$ \theta $
, to 1.
5.2. Parameters estimated from the data
We think of
 $ t=0$
as the age at which an individual reaches adulthood, setting its empirical counterpart to age 20. Based on the 2019 actuarial life table from the Human Mortality Database, only 0.5% of individuals live to age 105, so we set 105 as the empirical counterpart for the model’s maximum admissible age,
$ t=0$
as the age at which an individual reaches adulthood, setting its empirical counterpart to age 20. Based on the 2019 actuarial life table from the Human Mortality Database, only 0.5% of individuals live to age 105, so we set 105 as the empirical counterpart for the model’s maximum admissible age,
 $ {\overline T}$
.Footnote
7
Assuming an annual time discount factor of 0.95, we could normalize
$ {\overline T}$
.Footnote
7
Assuming an annual time discount factor of 0.95, we could normalize
 $ {\overline T}=1$
and choose the time discount rate
$ {\overline T}=1$
and choose the time discount rate
 $ \rho $
such that
$ \rho $
such that
 $$ {e}^{-\rho {\overline T}}\approx 0.9{5}^{(105-20)}.$$
However, since
 $ {\overline T}$
is determined as part of the model’s solution rather than set as a fixed parameter, we instead normalize
$ {\overline T}$
is determined as part of the model’s solution rather than set as a fixed parameter, we instead normalize
 $ \rho =1$
, and retain this equation as a condition to match (i.e., matching
$ \rho =1$
, and retain this equation as a condition to match (i.e., matching
 $ {\overline T}=4.3$
) when setting the third subset of parameters.
$ {\overline T}=4.3$
) when setting the third subset of parameters.
To model the health deficit process, we first set the initial value
 $ d\left(0\right)$
and the exogenous upper bound
$ d\left(0\right)$
and the exogenous upper bound
 $ {\overline d}$
using our empirical health deficit index, shown by the solid blue line in Fig. 2 (left panel). We set
$ {\overline d}$
using our empirical health deficit index, shown by the solid blue line in Fig. 2 (left panel). We set
 $ d\left(0\right)=0.02$
, matching the mean health deficit for individuals aged 20 in the data. Calibrating
$ d\left(0\right)=0.02$
, matching the mean health deficit for individuals aged 20 in the data. Calibrating
 $ {\overline d}$
, representing the mean health deficit at age 105, is more challenging, as our data only includes individuals up to age 80. To overcome this problem, we follow Mitnitski et al. (Reference Mitnitski, Mogilner, MacKnight and Rockwood2002) and fit the exponential regression
$ {\overline d}$
, representing the mean health deficit at age 105, is more challenging, as our data only includes individuals up to age 80. To overcome this problem, we follow Mitnitski et al. (Reference Mitnitski, Mogilner, MacKnight and Rockwood2002) and fit the exponential regression
 $$ d\left(t\right)={\theta }_{0}+{\theta }_{1}{e}^{{\theta }_{2}t},\ t\in \left[\mathrm{18,80}\right].$$
The fit is strong, with a root mean square error below 0.01, so we set
 $\overline d = \theta _0^{\rm{*}} + \theta _1^{\rm{*}}{e^{\theta _2^{\rm{*}}105}} \approx 0.31.$
Next, parameter
 $ \gamma $
represents the natural growth rate of the health deficit – that is, its rate of increase in the absence of preventive care. We estimate
$ \gamma $
represents the natural growth rate of the health deficit – that is, its rate of increase in the absence of preventive care. We estimate
 $ \gamma $
as follows: as discussed in the introduction, in 1935, when modern medical care was in its infancy, the effectiveness of preventive care was negligible, which translates to
$ \gamma $
as follows: as discussed in the introduction, in 1935, when modern medical care was in its infancy, the effectiveness of preventive care was negligible, which translates to
 $ A=0$
in the model (see also subsection 6.1 for a discussion). Therefore, the evolution of the health deficit in 1935 would depend solely on biological parameters
$ A=0$
in the model (see also subsection 6.1 for a discussion). Therefore, the evolution of the health deficit in 1935 would depend solely on biological parameters
 $$ d\left(t\right)=d\left(0\right){e}^{\gamma t}\mathrm{},$$
with
 $ d\left({\overline T}\right)={\overline d}$
or equivalently
$ d\left({\overline T}\right)={\overline d}$
or equivalently
 $ d\left({\overline T}\right)=d\left(0\right){e}^{\gamma {\overline T}}$
. More precisely, it depends on the natural growth rate
$ d\left({\overline T}\right)=d\left(0\right){e}^{\gamma {\overline T}}$
. More precisely, it depends on the natural growth rate
 $ \gamma $
, the initial health deficit
$ \gamma $
, the initial health deficit
 $ d\left(0\right)$
, and the maximum level of health deficits an individual can sustain,
$ d\left(0\right)$
, and the maximum level of health deficits an individual can sustain,
 $ {\overline d}$
. The actuarial life table from 1935 suggests that taking a maximum admissible age of 98 years is reasonable, given that only 0.5% of individuals lived to that age. In model’s unit, the maximum age of 98 years in 1935 corresponds to
$ {\overline d}$
. The actuarial life table from 1935 suggests that taking a maximum admissible age of 98 years is reasonable, given that only 0.5% of individuals lived to that age. In model’s unit, the maximum age of 98 years in 1935 corresponds to
 $ t={{\overline T}}^{1935}\approx 4$
(since
$ t={{\overline T}}^{1935}\approx 4$
(since
 $ t=0$
corresponds to the age of 20 years,
$ t=0$
corresponds to the age of 20 years,
 $ t=4.3$
corresponds to the age of 105 years). Thus, we determine
$ t=4.3$
corresponds to the age of 105 years). Thus, we determine
 $ \gamma $
as
$ \gamma $
as
 $$\gamma = {1 \over {{{\overline T}^{1935}}}}{\rm{ln}}{{\overline d} \over {d\left( 0 \right)}} \approx 0.7.$$
Lastly, we address the hazard rate function
 $ \lambda \left(d\right(t\left)\right)\in {C}^{1}$
that governs the probability law of the death process. Section 3 argued that higher health deficits increase individuals’ vulnerability to death, leading us to assume
$ \lambda \left(d\right(t\left)\right)\in {C}^{1}$
that governs the probability law of the death process. Section 3 argued that higher health deficits increase individuals’ vulnerability to death, leading us to assume
 $ {\lambda }_{d}\left(d\right(t\left)\right)\gt 0$
. A simple functional form in line with these requirements is
$ {\lambda }_{d}\left(d\right(t\left)\right)\gt 0$
. A simple functional form in line with these requirements is
 $$ \lambda \left(d\right(t\left)\right)={\alpha }_{1}{e}^{{\alpha }_{2}d\left(t\right)}.$$
Here,
 $ {\alpha }_{2}$
measures the percentage change in the hazard rate for a one-unit change in the health deficit, while
$ {\alpha }_{2}$
measures the percentage change in the hazard rate for a one-unit change in the health deficit, while
 $ {\alpha }_{1}$
scales the entire exponential distribution. In other words,
$ {\alpha }_{1}$
scales the entire exponential distribution. In other words,
 $ {\alpha }_{2}$
governs the sensitivity of
$ {\alpha }_{2}$
governs the sensitivity of
 $ \lambda \left(d\right)$
to changes in
$ \lambda \left(d\right)$
to changes in
 $ d$
, and
$ d$
, and
 $ {\alpha }_{1}$
affects the magnitude of that sensitivity at each point along the curve. Before estimating the
$ {\alpha }_{1}$
affects the magnitude of that sensitivity at each point along the curve. Before estimating the
 $ \alpha $
coefficients, we must construct a time series for the exogenous hazard rate variable
$ \alpha $
coefficients, we must construct a time series for the exogenous hazard rate variable
 $ \lambda \left(t\right)$
. The Human Mortality Database provides the probability
$ \lambda \left(t\right)$
. The Human Mortality Database provides the probability
 $ z\left(t\right)$
of death for individuals aged 0 to 110 in the coming year. In model’s notation, we have
$ z\left(t\right)$
of death for individuals aged 0 to 110 in the coming year. In model’s notation, we have
 $$z\left( t \right) = {{\Lambda \left( t \right) - \Lambda (t + {\rm{d}}t)} \over {\Lambda \left( t \right)}},$$
with
 $ \mathrm{d}t=4.3/85=0.05$
representing one year in the data (since
$ \mathrm{d}t=4.3/85=0.05$
representing one year in the data (since
 $ t=4.3$
in the model represents
$ t=4.3$
in the model represents
 $ (105-20)=85$
years). Then, the hazard rate is
$ (105-20)=85$
years). Then, the hazard rate is
 $$\lambda \left( t \right) = {{ - \mathop \Lambda \limits^. \left( t \right)} \over {\Lambda \left( t \right)}} \approx {{ - (\Lambda (t + {\rm{d}}t) - \Lambda (t))} \over {{\rm{d}}t\Lambda \left( t \right)}} = {{z\left( t \right)} \over {{\rm{d}}t}}.$$
Using the two time series for the hazard rate and health deficit index across an individual’s lifespan, we estimate the
 $ \alpha $
coefficients via ordinary least squares. More precisely, we estimate
$ \alpha $
coefficients via ordinary least squares. More precisely, we estimate
 $${\rm ln}\ \lambda \left(t\right)= {\rm In}\ {\alpha }_{1}+{\alpha }_{2}d\left(t\right),$$
which results in
 $ {\alpha }_{1}\approx 0.015$
,
$ {\alpha }_{1}\approx 0.015$
,
 $ {\alpha }_{2}\approx 24$
, and an R-squared value of almost 0.99. Figure 3 compares the empirical hazard rate with the hazard rate obtained with our estimated functional form.
$ {\alpha }_{2}\approx 24$
, and an R-squared value of almost 0.99. Figure 3 compares the empirical hazard rate with the hazard rate obtained with our estimated functional form.
Hazard rate governing the probability law of the death process.
Notes: The solid blue line represents the US hazard rate observed in 2019, derived from the Human Mortality Database. The dashed red line depicts the fitted hazard rate based on the exponential regression
 $ \lambda \left(d\right(t\left)\right)={\alpha }_{1}{e}^{{\alpha }_{2}d\left(t\right)}.$

5.3. Parameters calibrated within the model
We calibrate the remaining parameters using a simple grid search method, where we evaluate parameter values over a predefined range to ensure selected statistics align with their empirical counterparts. These parameters govern the efficiency of preventive care in slowing the growth of health deficits (
 $ A$
) and the monetary costs associated with those deficits (
$ A$
) and the monetary costs associated with those deficits (
 $ B$
). The empirical targets used for estimation include a maximal admissible age of 105 and a ratio of total expenditures on preventive care to GDP of 0.5%, as observed in the US in 2019.Footnote
8
Using our model notation and units, these targets read as:
$ B$
). The empirical targets used for estimation include a maximal admissible age of 105 and a ratio of total expenditures on preventive care to GDP of 0.5%, as observed in the US in 2019.Footnote
8
Using our model notation and units, these targets read as:
 $ {\overline T}=4.3$
and
$ {\overline T}=4.3$
and
 $ {H}_{2}=0.54\mathrm{\%}$
(see subsection 4.3).
$ {H}_{2}=0.54\mathrm{\%}$
(see subsection 4.3).
The resulting parameter values are
 $ A=0.013$
and
$ A=0.013$
and
 $ B=3.6$
. The targeted moments are well matched; the model yields
$ B=3.6$
. The targeted moments are well matched; the model yields
 $ {\overline T}=4.2$
and
$ {\overline T}=4.2$
and
 $ {H}_{2}=0.57\mathrm{\%}$
. We do not achieve a perfect match for the two targets, despite having two instruments, because utility flows must remain positive to avoid the “preference-for-death” scenario discussed earlier. As a result, our grid search algorithm functions as a constrained minimization problem. Table 2 summarizes the fit.
$ {H}_{2}=0.57\mathrm{\%}$
. We do not achieve a perfect match for the two targets, despite having two instruments, because utility flows must remain positive to avoid the “preference-for-death” scenario discussed earlier. As a result, our grid search algorithm functions as a constrained minimization problem. Table 2 summarizes the fit.
Targeted moments: data and model

Notes: Maximum lifespan and preventive health expenditures divided by GDP, in both the 2019 US data and the model. In the model, we compute the expenditures using a 10,000-agent Monte Carlo simulation.
 $ {\bar T}$
is expressed in years.
$ {\bar T}$
is expressed in years.
5.4. Assessment
To assess the model’s performance regarding non-targeted moments, we first examine the first three moments of the age-at-death distribution and the share of individuals reaching the maximal admissible age. For simplicity, we compute the moments of the age-at-death distribution using a 10,000-agent Monte Carlo simulation. Table 3 shows that the model performs reasonably well in capturing the patterns observed in the data. While it slightly overestimates (underestimates) the first (second) moment of the age-at-death distribution, these estimates remain within a plausible range. Additionally, the model successfully replicates the well-known long left tail of the age-at-death distribution and the share of individuals living to age 105. Figure 4 summarizes the fit of the model regarding the age-at-death distribution.
Non-targeted moments: data and model

Notes: Expected value, standard deviation, skewness, share of individuals living to age 105, and total health expenditures divided by GDP, in both the 2019 US data and the model. In the model, we compute the moments using a 10,000-agent Monte Carlo simulation.
 $ {\mu }_{T}$
and
$ {\mu }_{T}$
and
 $ {\sigma }_{T}$
are expressed in years.
$ {\sigma }_{T}$
are expressed in years.
Age-at-death distribution: data and model.
Notes: The solid blue line and the dotted red line represent the share of deaths in 5-year intervals based on the 2019 U.S. data and the model, respectively. The model’s distribution is calculated using a Monte Carlo simulation with 10,000 agents.

Finally, our calibration targets the share of expenditures on prevention (
 $ {H}_{2}$
) but not the share of total health expenditures (
$ {H}_{2}$
) but not the share of total health expenditures (
 $ {H}_{1}$
). The last column in Table 3 shows that our model underestimates total expenditures (17.5% in the data vs. 10% in the model). However, our model is able to reproduce the convexity of total expenditures relative to income over the life cycle, particularly the strong increase for the elderly, as described in De Nardi et al. (Reference De Nardi, French, Jones and McCauley2016). Specifically, in our model, total expenditures as a share of income rise from 3.2% at age 20 to 14% at age 80 and 38% at age 100.
$ {H}_{1}$
). The last column in Table 3 shows that our model underestimates total expenditures (17.5% in the data vs. 10% in the model). However, our model is able to reproduce the convexity of total expenditures relative to income over the life cycle, particularly the strong increase for the elderly, as described in De Nardi et al. (Reference De Nardi, French, Jones and McCauley2016). Specifically, in our model, total expenditures as a share of income rise from 3.2% at age 20 to 14% at age 80 and 38% at age 100.
Next, we look at the effect of income on healthcare expenditures and life expectancy. We compare the results obtained with our model to the results from related papers (since we cannot compare to direct evidence from the data). First, we compute the income elasticity of preventive care expenditures as
 $$\eta = {{\partial \int _0^{\overline T}\theta h\left( t \right)\Lambda \left( t \right){\rm{d}}t} \over {\partial \int _0^{\overline T}y\Lambda \left( t \right){\rm{d}}t}}{{\int _0^{\overline T}y\Lambda \left( t \right){\rm{d}}t} \over {\int _0^{\overline T}\theta h\left( t \right)\Lambda \left( t \right){\rm{d}}t}}.$$
The income elasticity of total medical expenditures (
 $ \theta (h+Bd)$
) is defined in a similar manner. The model suggests an income elasticity of preventive care use of 2.9 and an income elasticity of total medical expenditures of 0.3. These figures align with previous studies. As in Hall and Jones (Reference Hall and Jones2007), preventive care use in our setup enables individuals to live longer (on average) and enhances their quality of life by reducing the monetary costs associated with health deficits. As a result, preventive care use is a superior good. In contrast, the model suggests that total medical expenditures, which also encompass the monetary costs of health deficits related to curative, palliative and LTC, have an income elasticity of less than one, consistent with recent empirical evidence in Baltagi et al. (Reference Baltagi, Lagravinese, Moscone and Tosetti2017).
$ \theta (h+Bd)$
) is defined in a similar manner. The model suggests an income elasticity of preventive care use of 2.9 and an income elasticity of total medical expenditures of 0.3. These figures align with previous studies. As in Hall and Jones (Reference Hall and Jones2007), preventive care use in our setup enables individuals to live longer (on average) and enhances their quality of life by reducing the monetary costs associated with health deficits. As a result, preventive care use is a superior good. In contrast, the model suggests that total medical expenditures, which also encompass the monetary costs of health deficits related to curative, palliative and LTC, have an income elasticity of less than one, consistent with recent empirical evidence in Baltagi et al. (Reference Baltagi, Lagravinese, Moscone and Tosetti2017).
Second, we consider how much life expectancy increases with a 10% rise in income. Chetty et al. (Reference Chetty, Stepner, Abraham, Lin, Scuderi, Turner, Bergeron and Cutler2016) estimate that in 2014, the expected age at death for 40-year-old American men in the second quartile of the income distribution (mean $47k) was approximately 81 years, while for those in the third quartile (mean $83k), it was around 85 years. Assuming a linear relationship between expected age at death and income in that segment of the income distribution – an assumption supported by further results in the paper – an increase in income of 10% correlates with an increase in life expectancy of about six months. When individuals’ income (
 $ y$
) increases by 10% in our model, the expected life expectancy at age 40 rises by slightly less than year. In our model, the income increase is permanent and begins at birth, whereas in Chetty et al. (Reference Chetty, Stepner, Abraham, Lin, Scuderi, Turner, Bergeron and Cutler2016), a person at a given income quartile at age 40 could have experienced varying income levels earlier in life and might shift quartiles later. This difference, along with the model’s omission of potential effects of health on income, might partly account for our model’s higher estimate of income’s effect on life expectancy, though it remains broadly consistent with Chetty et al. (Reference Chetty, Stepner, Abraham, Lin, Scuderi, Turner, Bergeron and Cutler2016).
$ y$
) increases by 10% in our model, the expected life expectancy at age 40 rises by slightly less than year. In our model, the income increase is permanent and begins at birth, whereas in Chetty et al. (Reference Chetty, Stepner, Abraham, Lin, Scuderi, Turner, Bergeron and Cutler2016), a person at a given income quartile at age 40 could have experienced varying income levels earlier in life and might shift quartiles later. This difference, along with the model’s omission of potential effects of health on income, might partly account for our model’s higher estimate of income’s effect on life expectancy, though it remains broadly consistent with Chetty et al. (Reference Chetty, Stepner, Abraham, Lin, Scuderi, Turner, Bergeron and Cutler2016).
In sum, the model replicates well empirical patterns of mortality and medical expenditures, which are key components of our analysis. This gives us confidence that the model provides a plausible laboratory for our quantitative decomposition of the roles of the trends (a)–(b) in shaping health outcomes (i)–(ii), between 1935 and 2019.
6. Quantitative exercises
We begin by constructing time series for the medical technologies that capture trends (a) and (b) – preventive and curative advances, respectively. Next, we construct two additional series reflecting major developments over the past century: (c) the sharp rise in the relative price of medical care, and (d) the increase in real median income per male worker from 1960 until the mid-1970s, followed by a period of stagnation. These four series are then incorporated into the model. Hosseini et al. (Reference Hosseini, Kopecky and Zhao2021), Strulik (Reference Strulik2022), De Nardi et al. (Reference De Nardi, Pashchenko and Porapakkarm2024), and Chen et al. (Reference Chen, Feng and Gu2025), we do not simulate the transitional dynamics from 1935 to 2019. Instead, we compare stationary equilibria. Specifically, we solve the model using the values of trends (a) through (d) for the years 1935, 1960, 1990, and 2019. For each year, we compute the stationary distribution and derive key statistics. Lastly, we evaluate the relative contributions of each trend through counterfactual exercises.
Needless to say, what follows is conditional on the assumptions that we consider long-run equilibria and that individuals rationally choose their full life-cycle consumption and prevention paths. We discuss these modeling features in more detail in Section 8.
6.1. Advances in medical technology
Quantifying medical trends is challenging due to the difficulty in measuring medical progress. We proceed as follows: our calibration provides the 2019 values for parameters related to medical technology:
 $ A$
, governing preventive care efficiency, and
$ A$
, governing preventive care efficiency, and
 $ {\alpha }_{1}$
and
$ {\alpha }_{1}$
and
 $ {\alpha }_{2}$
, governing the relationship between health deficits and mortality risk, that is, governing the curative care technology. To set the value of
$ {\alpha }_{2}$
, governing the relationship between health deficits and mortality risk, that is, governing the curative care technology. To set the value of
 $ A$
in 1935, we follow Dalgaard and Strulik (Reference Dalgaard and Strulik2014) and assume that preventive care efficiency was virtually zero at that time, that is the role of technology in repairing health deficits was nil.Footnote
9
Then we impose that
$ A$
in 1935, we follow Dalgaard and Strulik (Reference Dalgaard and Strulik2014) and assume that preventive care efficiency was virtually zero at that time, that is the role of technology in repairing health deficits was nil.Footnote
9
Then we impose that
 $ A$
increases linearly to its 2019 value of 0.013 (see Fig. 5, left panel). This assumption also determines the evolution of health deficits in 1935, based solely on biological parameters (see subsection 5.2). The Human Mortality Database provides one-year-ahead death probabilities for ages 0 to 110, allowing us to derive the 1935 hazard rate as before (see again subsection 5.2). Using these two 1935 series for hazard rate and health deficit, we estimate the
$ A$
increases linearly to its 2019 value of 0.013 (see Fig. 5, left panel). This assumption also determines the evolution of health deficits in 1935, based solely on biological parameters (see subsection 5.2). The Human Mortality Database provides one-year-ahead death probabilities for ages 0 to 110, allowing us to derive the 1935 hazard rate as before (see again subsection 5.2). Using these two 1935 series for hazard rate and health deficit, we estimate the
 $ \alpha $
parameters as we did for 2019, resulting in
$ \alpha $
parameters as we did for 2019, resulting in
 $ {\alpha }_{1}\approx 0.06$
and
$ {\alpha }_{1}\approx 0.06$
and
 $ {\alpha }_{2}\approx 21$
, with an R-squared of 0.97. Finally, we assume a gradual transition between 1935 and 2019, with each parameter adjusting by an equal amount each year (Fig. 5, left panel). The right panel of Fig. 5 shows the hazard rates in 1935 and 2019 as functions of the health deficit, based on the corresponding
$ {\alpha }_{2}\approx 21$
, with an R-squared of 0.97. Finally, we assume a gradual transition between 1935 and 2019, with each parameter adjusting by an equal amount each year (Fig. 5, left panel). The right panel of Fig. 5 shows the hazard rates in 1935 and 2019 as functions of the health deficit, based on the corresponding
 $ \alpha $
coefficients. As expected, the 2019 hazard rate lies below the 1935 rate at any given health deficit level, reflecting advancements in curative treatments over this period.
$ \alpha $
coefficients. As expected, the 2019 hazard rate lies below the 1935 rate at any given health deficit level, reflecting advancements in curative treatments over this period.
Effectiveness of preventive and curative care: Trends.
Notes: In the left panel, the increase in
 $ A$
corresponds to advances in the prevention technology and the joint decreases in
$ A$
corresponds to advances in the prevention technology and the joint decreases in
 $ {\alpha }_{1}$
and
$ {\alpha }_{1}$
and
 $ {\alpha }_{2}$
correspond to advances in the curative technology. The right panel shows that lower
$ {\alpha }_{2}$
correspond to advances in the curative technology. The right panel shows that lower
 $ \alpha $
’s indeed reduce the hazard rate for all levels of deficit.
$ \alpha $
’s indeed reduce the hazard rate for all levels of deficit.

There are at least two reasons to think medical technology likely evolved non-linearly. First, changes in the age-at-death distribution have shown significant non-linearity; for example, the expected age at death increased by about three years between 1935 and 1945, which matches the increase observed from 1965 to 2000. Indeed, most longevity gains in the US occurred during the early 20th century, largely due to reductions in mortality from infectious diseases, then the leading cause of death (Jayachandran et al., Reference Jayachandran, Lleras-Muney and Smith2010). Second, there have been notable breakthroughs, such as the “golden age of antibiotics” in the 1950s and 1960s (Hutchings et al., Reference Hutchings, Truman and Wilkinson2019). However, in light of limited empirical guidance, our emphasis on simplicity, and our focus on qualitative insights over precise quantitative estimates, we opt for a gradual, linear transition. Our key insights are independent of this assumption, as our counterfactual scenarios focus solely on the initial and final years (1935 and 2019), with no attention given to the transition period between them.
6.2. Median income and healthcare prices
Together with the medical advances just described, the U.S. economy experienced two major developments: (c) a sharp rise in the relative price of medical care, and (d) an increase in real median income per male worker from 1960 until the mid-1970s, followed by stagnation (see Fig. 6). Considering medical advances (a)–(b) while ignoring these two developments may lead to an incomplete, or even misleading, understanding of the forces shaping longevity over time.
Economy-related trends in the US.
Notes: We define the relative price of healthcare as the ratio of the consumer price index for medical care to the overall consumer price index, both sourced from the US Bureau of Labor Statistics. Normalizing the 2019 value to 1 yields the left panel. Data on income is sourced from the Current Population Survey, conducted by the US Census Bureau and the US Bureau of Labor Statistics.

Needless to say, medical advances may have contributed to the rise in the relative price of medical care (Newhouse, Reference Newhouse1992), suggesting that trends (a) and (b) might not be independent of trend (c). Likewise, increased life expectancy could raise income levels (Acemoglu and Johnson, Reference Acemoglu and Johnson2007), indicating a potential causal link from health outcome (i) to trend (d). Despite these caveats, we treat trends (c) and (d) as exogenous – both for simplicity and because there is no compelling evidence that health outcomes (i)–(ii) and medical advances (a) and (b) are the main drivers of economic trends (c) and (d). More plausible explanations include structural features of the healthcare system, such as fragmentation across public and private payers (Anderson et al., Reference Anderson, Hussey and Petrosyan2019), as well as broader forces like foreign competition (Autor et al., Reference Autor, Dorn and Hanson2013); shifts in technology and the relative price of capital (Acemoglu and Restrepo, Reference Acemoglu and Restrepo2018); the decline of unions (Stansbury and Summers, Reference Stansbury and Summers2020); and employer concentration in local labor markets (Benmelech et al., Reference Benmelech, Bergman and Kim2022).
In terms of trend (c), we define the relative price of healthcare as the ratio of the consumer price index for medical care to the overall consumer price index, both sourced from the US Bureau of Labor Statistics. Normalizing the 2019 value to 1 for consistency with our calibration yields the left panel of Fig. 6. The relative price of medical care has tripled over the period, rising from approximately 0.3 in 1947 to 1 in 2019. Since data are available only from 1947 onward, we estimate the 1935 value by fitting a linear time trend to the available observations.
Turning to trend (d), we define income as the real median income of a full-time, year-round male worker, as shown in the right panel of Fig. 6. This data is sourced from the Current Population Survey, conducted by the US Census Bureau and the US Bureau of Labor Statistics. To align with our calibration, we normalize the 2019 value to 3. Since data is available only from 1960 onward, we estimate the 1935 value by fitting a linear time trend to the first 30 years of the sample, placing less emphasis on the later stagnation periods.
6.3. Benchmark scenario
Table 4 compares observed health outcomes with those implied by the model when we insert medical trends (a) through (d). Except for the preventive care expenditures to GDP ratio in 2019, none of the statistics in the table was targeted when selecting parameter values.
Comparison of data and model outputs over selected years

Notes: In the model, we compute the moments associated with the age-at-death distribution using a 10,000-agent Monte Carlo simulation. Data for
 $ {H}_{1}$
refer to Personal Health Care expenditures from the National Health Expenditure Accounts (Centers for Medicare and Medicaid Services). Data for
$ {H}_{1}$
refer to Personal Health Care expenditures from the National Health Expenditure Accounts (Centers for Medicare and Medicaid Services). Data for
 $ {H}_{2}$
follow the System of Health Accounts 2011, and are sourced from the OECD. Expenditures are classified under “HC.6 Preventive care” if they fall within the health care boundary and aim to prevent disease, reduce risk factors, or enable early detection.
$ {H}_{2}$
follow the System of Health Accounts 2011, and are sourced from the OECD. Expenditures are classified under “HC.6 Preventive care” if they fall within the health care boundary and aim to prevent disease, reduce risk factors, or enable early detection.
Let us begin with the model’s strengths. First, it captures the direction of changes in the distribution of age at death: life expectancy rises, while the standard deviation declines. It also replicates the increase in health care expenditure – both total and preventive – as a share of output. Finally, the model matches all statistics within a plausible range of their empirical counterparts. Nonetheless, the model overestimates the mean and underestimates the variance of the age-at-death distribution in 2019, with similar discrepancies in 1935. It also falls short in reproducing the full magnitude of the decline in the standard deviation over time.
All told, given its simplicity and limited number of parameters, the model does a good job of replicating key patterns in mortality and health expenditure. But how much does each trend (a)–(d) contribute to this performance? We turn to this next.
6.4. Counterfactual scenarios
To understand the contribution of each trend, we introduce them into the model cumulatively: first trend (a) alone, then trends (a) and (b) together, and finally the full set (a) through (d).Footnote 10 Table 5 reports the resulting changes in life expectancy, dispersion in age at death, and health care spending as a share of income over the past several decades. The time span for each statistic varies based on data availability: from 1935 for the age-at-death distribution, from 1960 for total health spending, and from 1990 for preventive care. As a benchmark, the first row shows the corresponding changes observed in the data.
Shock decomposition: changes in key variables over time

Notes: Total changes in life expectancy, age-at-death dispersion, and preventive care spending as a share of total income. The second row includes trends for both
 $ A$
and
$ A$
and
 $ \lambda $
, while the third (and fourth) rows include only the trend for
$ \lambda $
, while the third (and fourth) rows include only the trend for
 $ A$
(and
$ A$
(and
 $ \lambda $
, respectively). Since the model is nonlinear, a general Superposition Principle does not apply; the combined effects of trend
$ \lambda $
, respectively). Since the model is nonlinear, a general Superposition Principle does not apply; the combined effects of trend
 $ A$
and trend
$ A$
and trend
 $ \lambda $
need not equal the sum of their individual effects.
$ \lambda $
need not equal the sum of their individual effects.
We begin by introducing trend (a), which captures medical advances in preventive care. Specifically, we hold curative care technology, income, and the relative price of healthcare fixed at their 1935 levels. This means the
 $ \alpha $
coefficients,
$ \alpha $
coefficients,
 $ y$
, and
$ y$
, and
 $ \theta $
remain constant at their 1935 values, while the effectiveness of preventive care,
$ \theta $
remain constant at their 1935 values, while the effectiveness of preventive care,
 $ A$
evolves as observed. The second row of Table 5 reports the results. Crucially, the dispersion of age at death increases from 1935 to 2019, whereas it decreases in the data.
$ A$
evolves as observed. The second row of Table 5 reports the results. Crucially, the dispersion of age at death increases from 1935 to 2019, whereas it decreases in the data.
The logic is as follows. In our model, advancements in preventive care lower the average health deficit at each age by both increasing the effectiveness of current resources and boosting overall investment in preventive care (with an elasticity of total preventive care use with respect to
 $ A$
hovering around 2). A lower health deficit at each age then reduces the hazard rate, increasing life expectancy and extending the maximum possible lifespan, as deficits accumulate more slowly and
$ A$
hovering around 2). A lower health deficit at each age then reduces the hazard rate, increasing life expectancy and extending the maximum possible lifespan, as deficits accumulate more slowly and
 $ {\overline d}$
is reached later. These dynamics have competing effects on the dispersion of age at death: lower mortality reduces it, while higher life expectancy and a longer maximum lifespan increase it. Under our calibration, the latter effect dominates, leading to a 1.4-year increase in the dispersion of age at death.
$ {\overline d}$
is reached later. These dynamics have competing effects on the dispersion of age at death: lower mortality reduces it, while higher life expectancy and a longer maximum lifespan increase it. Under our calibration, the latter effect dominates, leading to a 1.4-year increase in the dispersion of age at death.
Offsetting this upward trend in dispersion requires advances in curative care, as the third row of the table shows. Improved curative care reduces the hazard rate of death at a given health deficit level (right panel of Fig. 5), weakening the impact of an individual’s health deficit. Ceteris paribus, better curative care lowers the shadow price of health deficits, reducing the demand for preventive care. As a result, the average health deficit at each age rises, and the maximum lifespan shortens, with deficits accumulating more quickly and
 $ {\overline d}$
reached sooner. These dynamics compress the distribution of age at death: both a lower death probability and a reduced maximum lifespan contribute to this effect.Footnote
11
$ {\overline d}$
reached sooner. These dynamics compress the distribution of age at death: both a lower death probability and a reduced maximum lifespan contribute to this effect.Footnote
11
Does this prediction – that advances in curative care reduce the dispersion of age at death – align with empirical findings? Empirical evidence on this topic is limited, likely for two reasons. First, studies typically examine the impact of medical technology on life expectancy rather than on age-at-death dispersion. Second, disaggregated data on the spread of medical technologies is often unavailable, making it difficult to assess their specific effects on mortality patterns. One exception is Alsan et al. (Reference Alsan, Atella, Bhattacharya, Conti, Mejía-Guevara and Miller2021), who find that penicillin reduced both the mean and the standard deviation of infectious disease mortality in Italy following World War II.Footnote 12
Back to Table 5, the third row confirms that curative advances play a central role in raising life expectancy. By lowering the hazard rate of death at a given health deficit level, they allow individuals to live longer. This mechanism is consistent with empirical evidence. For example, Lichtenberg (Reference Lichtenberg2018) shows that cancer mortality declines significantly following the introduction of new cancer drugs, with effects appearing about five years after launch, across a sample of 36 countries.
Lastly, economic trends (c) and (d) have a limited effect on the distribution of age at death (fourth row of the table). Higher income raises preventive care, which leads to a modest increase in life expectancy relative to the previous scenario, with little change in the standard deviation. However, these trends play a central role in helping the model replicate the sharp increase in healthcare’s share of total resources (
 $ {H}_{1}$
, subsection 4.3), which rose by 10 percentage points from 1960 to 2019. Medical advances alone (trends a–b) account for only a 1-percentage-point increase, but adding economic trends (c) and (d) raises this to about 5 percentage points. This aligns with empirical evidence pointing to rising healthcare prices as a key driver of the growing share of output devoted to healthcare spending (Anderson et al., Reference Anderson, Reinhardt, Hussey and Petrosyan2003, Reference Anderson, Hussey and Petrosyan2019).
$ {H}_{1}$
, subsection 4.3), which rose by 10 percentage points from 1960 to 2019. Medical advances alone (trends a–b) account for only a 1-percentage-point increase, but adding economic trends (c) and (d) raises this to about 5 percentage points. This aligns with empirical evidence pointing to rising healthcare prices as a key driver of the growing share of output devoted to healthcare spending (Anderson et al., Reference Anderson, Reinhardt, Hussey and Petrosyan2003, Reference Anderson, Hussey and Petrosyan2019).
To conclude, while both preventive and curative technologies have increased life expectancy in the US since 1935, it is curative innovations that have lowered the dispersion of age at death. In turn, economic factors are the primary drivers of the sharp growth in healthcare spending.
6.5. Welfare implications of preventive and curative advances
To better understand the historical role of medical breakthroughs, we now study their effects on living standards between 1935 and 2019, using a Lucas (Reference Lucas1987)-style metric. We define
 $$ {\cal{U}}_{j}\left(\omega \right)={\int }_{\!\!\!0}^{{\overline T}}\, {e}^{-\rho t}\mathrm{\Lambda }\left(t\right)\ \mathrm{}\mathrm{l}\mathrm{n}\left(\omega \mathrm{}c\ \left(t\right)\right)\mathrm{}\mathrm{}\mathrm{d}t\mathrm{},$$
as the expected discounted sum of future utility flows for an individual born at time
 $ j$
if her consumption at each instant was multiplied by a factor
$ j$
if her consumption at each instant was multiplied by a factor
 $ \omega $
. To ease the notation, we immediately write our utility function as a log (we use a CRAA utility with
$ \omega $
. To ease the notation, we immediately write our utility function as a log (we use a CRAA utility with
 $ \sigma =1$
, see Table 1). We then compute the value of
$ \sigma =1$
, see Table 1). We then compute the value of
 $ \omega $
that would make an individual born in 1935 indifferent to living in 2019. An increase in living standards implies
$ \omega $
that would make an individual born in 1935 indifferent to living in 2019. An increase in living standards implies
 $ \omega \gt 1$
. Formally, we compute
$ \omega \gt 1$
. Formally, we compute
 $ \omega $
such that
$ \omega $
such that
 $$ {\cal{U}}_{1935}\left(\omega \right)={\cal{U}}_{2019}\left(1\right)\mathrm{},$$
which yields
 $${\rm{ln}}\omega = {{{{\cal U}_{2019}}\left( 1 \right) - {{\cal U}_{1935}}\left( 1 \right)} \over {\int _0^{{{\mathop T\limits^ - }_{1935}}}{\mkern 1mu} {e^{ - \rho t}}{\Lambda _{1935}}\left( t \right)\ {\rm{d}}t}}.$$
Hence, the average annual growth rate of living standards, in consumption-equivalent welfare terms, between 1935 and 2019 is
 $$g = {{{\rm{ln}}\omega } \over {84}}.$$
The first row of Table 6 shows that the four trends between 1935 and 2019 – curative advances
 $ \lambda $
, preventive advances
$ \lambda $
, preventive advances
 $ A$
, median income
$ A$
, median income
 $ y$
, and the relative price of medical care
$ y$
, and the relative price of medical care
 $ \theta \mathrm{}- \mathrm{}$
together account for a welfare growth rate of 0.87% per year. Breaking this down, medical advances contribute 0.11% per year, with curative improvements accounting for most of this (0.10%) and preventive measures contributing the remainder (0.01%).
$ \theta \mathrm{}- \mathrm{}$
together account for a welfare growth rate of 0.87% per year. Breaking this down, medical advances contribute 0.11% per year, with curative improvements accounting for most of this (0.10%) and preventive measures contributing the remainder (0.01%).
Annual growth rate of welfare (in %)

Notes: The table reports the annual average consumption-equivalent welfare growth rate
 $ g$
, as well as its decomposition into the four contributing trends: (a) preventive advances
$ g$
, as well as its decomposition into the four contributing trends: (a) preventive advances
 $ {g}_{A}$
, (b) curative advances
$ {g}_{A}$
, (b) curative advances
 $ {g}_{\lambda }$
, (c) relative price of medical care
$ {g}_{\lambda }$
, (c) relative price of medical care
 $ {g}_{\theta }$
, and (d) median income
$ {g}_{\theta }$
, and (d) median income
 $ {g}_{y}$
.
$ {g}_{y}$
.
The reason why advances in curative care play a more prominent role in raising living standards than those in preventive care is twofold. First, as noted in the previous subsection, curative improvements were key to increasing life expectancy and reducing the standard deviation of age at death, both of which enhance welfare by lowering the risk of dying young. Second, better curative care reduces the shadow price of health deficits. Ceteris paribus, this allows individuals to shift resources away from prevention and toward consumption, which further boosts welfare. Lastly, the remaining growth in welfare (0.76%) stems from the joint evolution of income and prices.Footnote 13
How do our model’s estimates compare with empirical evidence? Using microdata, Jones and Klenow (Reference Jones and Klenow2016) compute a welfare growth rate of 3.1% per year in the US between 1984 and 2006, primarily driven by income growth (2.1%) and increased life expectancy (0.9%). To facilitate comparison, we replicate our analysis for the sub-period 1984–2006. This shorter time horizon allows us to isolate the effects of income (
 $ y$
) from those of healthcare prices (
$ y$
) from those of healthcare prices (
 $ \theta $
), since these shocks are less pronounced over 1984–2006 than over the full period from 1935 to 2019. The second row of Table 6 reports the results.
$ \theta $
), since these shocks are less pronounced over 1984–2006 than over the full period from 1935 to 2019. The second row of Table 6 reports the results.
Over this limited time horizon, our model implies an annual welfare growth rate of 0.19%, far below the 3.1% estimated by Jones and Klenow (Reference Jones and Klenow2016). Most of the gap stems from income dynamics. We focus on the real median income of full-time male workers, which grew by just 0.1% per year between 1984 and 2006. In contrast, Jones and Klenow (Reference Jones and Klenow2016) consider a 2.1% annual income growth rate, over twenty times higher. The remainder of the gap likely reflects differences in methodology. While we rely on a simple theoretical setup with a limited set of trends, Jones and Klenow (Reference Jones and Klenow2016) use an empirical approach that captures a broader range of factors absent from our model, including socioeconomic inequalities.
That said, our simple model complements the empirical estimates in Jones and Klenow (Reference Jones and Klenow2016) by highlighting the negative welfare effects of rising healthcare prices, which nearly offset the gains from increasing real incomes. This result aligns with both the data and prevailing public concerns on the costs of surging healthcare prices. For example, in 1980, total healthcare premiums for the median worker accounted for 8% of take-home pay; by 2000, this share had more than doubled to 17%, and by 2020, it had reached 25% (Miller and Nyce, Reference Miller and Nyce2023). Rising healthcare prices lead many Americans to forgo necessary medical care, a pattern well documented in national surveys such as the NHIS. They also contribute to higher out-of-pocket spending relative to other high-income countries and are a frequent cause of financial distress, including personal bankruptcy.
7. Sensitivity analysis
We now explore the robustness of our results to alternative strategies of mapping the model to the data and to model assumptions. In subsection 7.1, we extend the model by introducing a risk-free asset, allowing agents to transfer resources safely over time. In subsections 7.2 and 7.3, we introduce age-varying income as well as income heterogeneity. Finally, in subsection 7.4, we assess how a different calibrations for
 $ (\beta, \sigma )$
would impact our findings.
$ (\beta, \sigma )$
would impact our findings.
7.1. Complete markets
For mathematical tractability, the baseline model assumes incomplete markets. We now relax this assumption, introducing a risk-free asset to allow agents transfer resources safely over time. Specifically, let an agent’s asset holdings (or equivalently stock of savings) at age
 $ t$
be denoted as
$ t$
be denoted as
 $ s\left(t\right)$
. Assuming no assets at birth,
$ s\left(t\right)$
. Assuming no assets at birth,
 $ s\left(t\right)$
follows
$ s\left(t\right)$
follows
 $$ \dot{s}\left(t\right)=i\left(t\right)\mathrm{},$$
 $$ s\left(0\right)=0\mathrm{}.$$
where
 $ i\left(t\right)$
denotes the flow of savings, which is either positive or negative. Because of savings, the budget constraint (3) becomes
$ i\left(t\right)$
denotes the flow of savings, which is either positive or negative. Because of savings, the budget constraint (3) becomes
 $$ c\left(t\right)+i\left(t\right)+\theta \left(h\right(t)+Bd(t\left)\right)=y+rs\left(t\right)+z\left(t\right)\mathrm{},$$
where
 $ r\gt 0$
is the risk-free rate. Due to the uncertainty surrounding the agent’s age at death, accidental bequests are certain. This means that when the agent passes away, she does so with either positive asset holdings (
$ r\gt 0$
is the risk-free rate. Due to the uncertainty surrounding the agent’s age at death, accidental bequests are certain. This means that when the agent passes away, she does so with either positive asset holdings (
 $ s\left(T\right)\gt 0$
) or debts (
$ s\left(T\right)\gt 0$
) or debts (
 $ s\left(T\right)\lt 0$
). To tackle this issue, we introduce an annuity market as in Yaari (Reference Yaari1965) or Blanchard (Reference Blanchard1985). More precisely, insurance firms pay
$ s\left(T\right)\lt 0$
). To tackle this issue, we introduce an annuity market as in Yaari (Reference Yaari1965) or Blanchard (Reference Blanchard1985). More precisely, insurance firms pay
 $ z\left(s\right(t\left)\right)$
to the individual at each instant. In return, the insurance firm collects all assets when the individual dies. The running profit of the insurance firm is
$ z\left(s\right(t\left)\right)$
to the individual at each instant. In return, the insurance firm collects all assets when the individual dies. The running profit of the insurance firm is
 $$ \pi \left(t\right)=\lambda \left(d\right(t\left)\right)s\left(t\right)-z\left(t\right)\mathrm{}.$$
Free entry ensures zero profits, and hence,
 $ z\left(t\right)=\lambda \left(d\right(t\left)\right)s\left(t\right)$
. The budget constraint can therefore be written
$ z\left(t\right)=\lambda \left(d\right(t\left)\right)s\left(t\right)$
. The budget constraint can therefore be written
 $$ c\left(t\right)+i\left(t\right)+\theta \left(h\right(t)+Bd(t\left)\right)=y+\left(r+\lambda \left(d\right(t\left)\right)\right)s\left(t\right)\mathrm{}.$$
Lastly, should the agent reach the maximum admissible lifespan, her assets must be zero, yielding
 $ s\left({\overline T}\right)=0$
. Appendix B2 derives the optimality conditions for the extended model, highlighting the numerical challenges brought by complete markets.
$ s\left({\overline T}\right)=0$
. Appendix B2 derives the optimality conditions for the extended model, highlighting the numerical challenges brought by complete markets.
To quantify the effects of complete markets, we retain the calibration of the baseline model, and, in keeping with much of the literature, set the risk-free rate equal to the discount rate,
 $ r=\rho $
. Figure 7 contrasts the paths of consumption, health deficits, savings, and survival probability over the life cycle of an individual who reaches the maximum admissible lifespan in both the baseline and extended models. The comparison reveals that savings have a negligible effect on the accumulation of health deficits and, consequently, on survival probability. Since the latter equals the size of the population aged
$ r=\rho $
. Figure 7 contrasts the paths of consumption, health deficits, savings, and survival probability over the life cycle of an individual who reaches the maximum admissible lifespan in both the baseline and extended models. The comparison reveals that savings have a negligible effect on the accumulation of health deficits and, consequently, on survival probability. Since the latter equals the size of the population aged
 $ t$
in the stationary equilibrium (see subsection 4.3), savings have basically no impact on the distribution of age at death either. In other words, the incomplete market assumption is not behind our previous insights.
$ t$
in the stationary equilibrium (see subsection 4.3), savings have basically no impact on the distribution of age at death either. In other words, the incomplete market assumption is not behind our previous insights.
Paths of selected variables over the life-cycle.
Notes: The solid blue lines represent the baseline model with incomplete markets. The dashed red line represent the extended model with complete markets and
 $ r=\rho $
.
$ r=\rho $
.

What is then the role of savings? Consumption smoothing. In the baseline model, consumption declines over the life cycle due to the increasing costs of accumulating health deficits and time discounting. In contrast, in a complete market economy, the standard assumption
 $ r=\rho $
leads to a constant consumption profile. Consequently, agents accumulate assets in their younger years and deplete them in old age to shield consumption against the burden of deteriorating health.
$ r=\rho $
leads to a constant consumption profile. Consequently, agents accumulate assets in their younger years and deplete them in old age to shield consumption against the burden of deteriorating health.
7.2. Life-cycle income dynamics
In the baseline model, individuals received a constant income
 $ y\gt 0$
at each instant
$ y\gt 0$
at each instant
 $ t\in [0,T]$
. In reality, however, income follows a hump-shaped pattern, rising early in life, peaking in middle age, and declining as individuals reduce work hours or retire. To illustrate, Table 7 reports income per household member by age of the householder in 2019, using data from the U.S. Census Bureau’s Current Population Survey.
$ t\in [0,T]$
. In reality, however, income follows a hump-shaped pattern, rising early in life, peaking in middle age, and declining as individuals reduce work hours or retire. To illustrate, Table 7 reports income per household member by age of the householder in 2019, using data from the U.S. Census Bureau’s Current Population Survey.
2019 Income by age of householder

Notes: The table reports average annual household income per household member, in thousands of 2020 U.S. dollars, by age group of the householder. Data are from the U.S. Census Bureau, Current Population Survey (CPS), 2020 Annual Social and Economic Supplement. Income includes all sources before taxes and is divided by household size to yield per-member values.
The simplest way to capture these hump-shaped income dynamics in the model is to let income
 $ y$
vary over time exogenously according to
$ y$
vary over time exogenously according to
 $$ y\left(t\right)={\mu }_{0}+{\mu }_{1}t+{\mu }_{2}{t}^{2},$$
where
 $ {\mu }_{0}$
,
$ {\mu }_{0}$
,
 $ {\mu }_{1}$
, and
$ {\mu }_{1}$
, and
 $ {\mu }_{2}$
are parameters. We calibrate these parameters by running an OLS regression on the data in Table 7. For consistency with the baseline model, we normalize income at age 20 to 2. This ensures that total lifetime income for an individual who reaches the maximum admissible age
$ {\mu }_{2}$
are parameters. We calibrate these parameters by running an OLS regression on the data in Table 7. For consistency with the baseline model, we normalize income at age 20 to 2. This ensures that total lifetime income for an individual who reaches the maximum admissible age
 $ {\overline T}$
,
$ {\overline T}$
,
 $ {\int }_{0}^{{\overline T}}\, ({\mu }_{0}+{\mu }_{1}t+{\mu }_{2}{t}^{2})\mathrm{d}t$
, closely matches that in the baseline case with constant income,
$ {\int }_{0}^{{\overline T}}\, ({\mu }_{0}+{\mu }_{1}t+{\mu }_{2}{t}^{2})\mathrm{d}t$
, closely matches that in the baseline case with constant income,
 $ y{\overline T}$
. The resulting parameter values are
$ y{\overline T}$
. The resulting parameter values are
 $ {\mu }_{0}=2$
,
$ {\mu }_{0}=2$
,
 $ {\mu }_{1}=1.4$
, and
$ {\mu }_{1}=1.4$
, and
 $ {\mu }_{2}=-0.33$
, yielding a good fit with an
$ {\mu }_{2}=-0.33$
, yielding a good fit with an
 $ {R}^{2}$
of over 0.7.
$ {R}^{2}$
of over 0.7.
In addition, all parameters that are either chosen a priori or estimated from the data remain unchanged. However, the two parameters calibrated within the model,
 $ A$
and
$ A$
and
 $ B$
, must be re-estimated. Following the same procedure as before (see subsection 5.3), we choose
$ B$
, must be re-estimated. Following the same procedure as before (see subsection 5.3), we choose
 $ A$
and
$ A$
and
 $ B$
so that the model matches a maximum admissible age of 105 years and a total expenditure on preventive care equal to 0.5% of GDP. The resulting values,
$ B$
so that the model matches a maximum admissible age of 105 years and a total expenditure on preventive care equal to 0.5% of GDP. The resulting values,
 $ A=0.0135$
and
$ A=0.0135$
and
 $ B=4$
, are both close to their counterparts in the baseline model.
$ B=4$
, are both close to their counterparts in the baseline model.
Figure 8 compares the life-cycle paths of consumption, health deficits, income, and survival probability for an individual who reaches the maximum admissible age, under both the baseline model and the version with time-varying income. As expected, when income follows a hump-shaped pattern (dotted red lines), consumption over the life cycle adopts the classical inverted-U shape. In contrast, the effect on health is limited: health deficits and survival probabilities remain similar across the two models. This is confirmed by the first three moments of the age-at-death distribution, which change only marginally: from 83.9, 15.0, and −1.9 in the baseline model to 84.3, 15.2, and −1.9 with time-varying income.
Paths of selected variables over the life-cycle.
Notes: The solid blue lines represent the baseline model with incomplete markets. The dashed red line represent the extended model with life-income dynamics.

In sum, assuming constant income over the life cycle does not drive the earlier results. However, another income-related factor deserves attention: inequality. We turn to this next.
7.3. Income heterogeneity
Household income is highly dispersed in the U.S. In 2019, for example, households at the 90th percentile earned more than twelve times as much as those at the 10th percentile.Footnote
14
The baseline model assumes a single income level for all individuals (
 $ y$
), abstracting from inequality. To relax this assumption in a simple way, we allow income to vary across agents while remaining constant over their lifetimes. Specifically, each individual’s income,
$ y$
), abstracting from inequality. To relax this assumption in a simple way, we allow income to vary across agents while remaining constant over their lifetimes. Specifically, each individual’s income,
 $ {y}_{i}$
, is drawn at birth from a uniform distribution:
$ {y}_{i}$
, is drawn at birth from a uniform distribution:
 $ {y}_{i}\sim U(y-\chi, y+\chi )$
, where
$ {y}_{i}\sim U(y-\chi, y+\chi )$
, where
 $ \chi $
is a parameter. We set
$ \chi $
is a parameter. We set
 $ \chi =0.8$
, so that even the lowest-income individuals receive strictly positive utility flows.Footnote
15
$ \chi =0.8$
, so that even the lowest-income individuals receive strictly positive utility flows.Footnote
15
As expected, income heterogeneity generates a gap in life expectancy between rich and poor. For instance, among 20-year-olds, individuals with the highest income (
 $ y+\chi $
) live, on average, four years longer than those with the lowest income (
$ y+\chi $
) live, on average, four years longer than those with the lowest income (
 $ y-\chi $
). Indeed, higher income enables greater use of preventive care, which lowers health deficits and reduces mortality risk. The same mechanism also widens the upper bound of the life cycle: the richest individuals have a maximum admissible age,
$ y-\chi $
). Indeed, higher income enables greater use of preventive care, which lowers health deficits and reduces mortality risk. The same mechanism also widens the upper bound of the life cycle: the richest individuals have a maximum admissible age,
 $ {\overline T}$
, that is 5 years longer than that of the poorest ones. That said, the first three moments of the age-at-death distribution remain nearly identical to those in the baseline model, with only a modest increase in dispersion of age at death of about two months.
$ {\overline T}$
, that is 5 years longer than that of the poorest ones. That said, the first three moments of the age-at-death distribution remain nearly identical to those in the baseline model, with only a modest increase in dispersion of age at death of about two months.
Historically, income and wealth dispersion have increased over recent decades. In 1967, the first year for which data are available, households at the 90th percentile earned about nine times as much as those at the 10th percentile. By 2019, as previously noted, this ratio had risen to over twelve. Similarly, the share of net worth held by the top 0.1% rose from 8.5% in the late 1980s to nearly 14% in recent years.Footnote 16 Since income heterogeneity increases the dispersion of age at death in our model, introducing a rising trend in inequality would partially offset the compression in longevity dispersion induced by advances in curative technologies (see Table 4).
There is, however, another trend likely to have compressed the distribution of age at death over time: better access to health care, especially among the poorest households. In the first decades of the 20th century, health insurance was rare. Free care was sometimes available at charity clinics and dispensaries, barter was not uncommon, and many doctors operated a sliding-scale fee system, treating poorer patients for little, while relying on wealthier ones to subsidize care for the community (Chapin, Reference Chapin2015). After World War II, prepayment plans for medical care expanded rapidly. Coverage broadened significantly to include not just hospitalization, but also surgical procedures, physician visits, laboratory services, and prescription drugs. Still, as of 1962, the year of the first NHIS, 30% of Americans remained uninsured. Coverage rates differed markedly by income: only 34% of individuals in the poorest income group had health insurance, compared to 88% among the wealthiest.Footnote 17 Since then, the share of uninsured individuals has declined markedly. Landmark public programs like Medicare and Medicaid, introduced in 1965, expanded access for the elderly and low-income populations. More recently, the Affordable Care Act further broadened coverage through Medicaid expansion and subsidized private insurance. As a result, by 2023, the NHIS reported that nearly 93% of Americans had health insurance.
As explained in subsection 6.3, our baseline model falls short of reproducing the full magnitude of the decline in the standard deviation of age at death between 1935 and 2019. Accounting for improved access to medical care would likely improve the model’s performance on this dimension. Since our focus is on the role of medical technology, we leave this extension outside the scope of the present paper. Nonetheless, it is a promising avenue for future empirical and theoretical research.
7.4. Alternative parameter values
So far, we have assumed a logarithmic utility function (CRRA utility function with
 $ \sigma =1$
) for three main reasons. First, together with
$ \sigma =1$
) for three main reasons. First, together with
 $ \beta =1/2$
, it ensures that
$ \beta =1/2$
, it ensures that
 $ \epsilon \left(t\right)$
has a unique positive solution. Second, it allows us to compare our results on annual welfare growth with empirical estimates in Jones and Klenow (Reference Jones and Klenow2016), which also rely on log utility. Third, survey evidence from Browning et al. (Reference Browning, Hansen and Heckman1999) suggests that the inter-temporal elasticity of substitution is only slightly above one, consistent with log utility.
$ \epsilon \left(t\right)$
has a unique positive solution. Second, it allows us to compare our results on annual welfare growth with empirical estimates in Jones and Klenow (Reference Jones and Klenow2016), which also rely on log utility. Third, survey evidence from Browning et al. (Reference Browning, Hansen and Heckman1999) suggests that the inter-temporal elasticity of substitution is only slightly above one, consistent with log utility.
This subsection checks the robustness of our results to alternative values of the inter-temporal elasticity of substitution. Specifically, we retain the CRRA utility function
 $$u\left( c \right) = {{{c^{1 - \sigma }} - 1} \over {1 - \sigma }},$$
and vary the parameter
 $ \sigma $
to explore different levels of inter-temporal substitution.
$ \sigma $
to explore different levels of inter-temporal substitution.
As discussed earlier and detailed in Appendix B1, solving our model requires addressing several important non-linearities. One such non-linearity concerns the co-state variable
 $ \epsilon \left(t\right)$
, which captures how the optimal value of the utility function responds to a marginal relaxation of the budget constraint. To ensure that
$ \epsilon \left(t\right)$
, which captures how the optimal value of the utility function responds to a marginal relaxation of the budget constraint. To ensure that
 $ \epsilon \left(t\right)$
is the unique positive solution to a quadratic equation, one of the following relationships must be satisfied: (i)
$ \epsilon \left(t\right)$
is the unique positive solution to a quadratic equation, one of the following relationships must be satisfied: (i)
 $ \sigma =1-\beta $
; (ii)
$ \sigma =1-\beta $
; (ii)
 $ \sigma =0.5(1-\beta )$
; or (iii)
$ \sigma =0.5(1-\beta )$
; or (iii)
 $ \sigma =2(1-\beta )$
. Outside of these cases,
$ \sigma =2(1-\beta )$
. Outside of these cases,
 $ \epsilon \left(t\right)$
is no longer guaranteed to be unique and positive.
$ \epsilon \left(t\right)$
is no longer guaranteed to be unique and positive.
Since our baseline calibration satisfies the condition
 $ \sigma =2(1-\beta )$
, we restrict attention to that class of parametrizations. Specifically, we explore alternative values of
$ \sigma =2(1-\beta )$
, we restrict attention to that class of parametrizations. Specifically, we explore alternative values of
 $ \sigma $
while adjusting
$ \sigma $
while adjusting
 $ \beta $
accordingly to preserve the relationship. To ensure consistency with our previous analysis, we re-calibrate the parameters
$ \beta $
accordingly to preserve the relationship. To ensure consistency with our previous analysis, we re-calibrate the parameters
 $ \{A,B\}$
for each new pair
$ \{A,B\}$
for each new pair
 $ (\sigma, \beta )$
so that the model continues to match two key targets: a maximum admissible age of 105 years and total preventive care expenditure equal to 0.5% of GDP.
$ (\sigma, \beta )$
so that the model continues to match two key targets: a maximum admissible age of 105 years and total preventive care expenditure equal to 0.5% of GDP.
In line with Murphy and Topel (Reference Murphy and Topel2006), we consider values of the parameter
 $ \sigma $
ranging from 0.8 to 1.2. Figure 9 compares the life-cycle consumption path of an individual who lives to age 100 under each parametrization. As expected, a lower inter-temporal elasticity of substitution (i.e., higher values of
$ \sigma $
ranging from 0.8 to 1.2. Figure 9 compares the life-cycle consumption path of an individual who lives to age 100 under each parametrization. As expected, a lower inter-temporal elasticity of substitution (i.e., higher values of
 $ \sigma $
) results in stronger consumption smoothing, reducing the decline in consumption later in life. That said, the differences across parametrizations remain mild.
$ \sigma $
) results in stronger consumption smoothing, reducing the decline in consumption later in life. That said, the differences across parametrizations remain mild.
Consumption over the life-cycle.
Notes: The solid blue line represents the baseline parametrization. The dotted red and dashed yellow lines vary
 $ \sigma $
while adjusting
$ \sigma $
while adjusting
 $ \beta $
according to
$ \beta $
according to
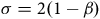 $ \sigma =2(1-\beta )$
.
$ \sigma =2(1-\beta )$
.

In turn, Table 8 compares the age-at-death distribution and the average annual consumption-equivalent welfare growth (see subsection 6.5) across parametrizations. The key message is clear: none of the indicators change substantially, suggesting that the values of
 $ \{\sigma, \beta, A,B\}$
are not critical to the model’s main insights. That said, some differences do emerge across parametrizations. For instance, life expectancy increases in the high-
$ \{\sigma, \beta, A,B\}$
are not critical to the model’s main insights. That said, some differences do emerge across parametrizations. For instance, life expectancy increases in the high-
 $ \sigma $
scenario. Pinpointing the exact mechanism is difficult, as each parametrization involves simultaneous adjustments to four parameters. However, one consistent pattern is that higher
$ \sigma $
scenario. Pinpointing the exact mechanism is difficult, as each parametrization involves simultaneous adjustments to four parameters. However, one consistent pattern is that higher
 $ \sigma $
values are associated with lower values of
$ \sigma $
values are associated with lower values of
 $ B$
. This reduces the monetary cost of health deficits, freeing up resources for preventive care and thereby supporting longer lifespans.
$ B$
. This reduces the monetary cost of health deficits, freeing up resources for preventive care and thereby supporting longer lifespans.
Age-at-death distribution and welfare growth under alternative parametrizations

Notes: Expected value, standard deviation, skewness, and share of individuals living to age 105 in both the 2019 US data and the model. In the model, we compute the moments using a 10,000-agent Monte Carlo simulation.
 $ {\mu }_{T}$
and
$ {\mu }_{T}$
and
 $ {\sigma }_{T}$
are expressed in years. The final column reports average annual consumption-equivalent welfare growth from 1935 to 2019, based on the methodology described in subsection 6.5.
$ {\sigma }_{T}$
are expressed in years. The final column reports average annual consumption-equivalent welfare growth from 1935 to 2019, based on the methodology described in subsection 6.5.
In addition to the alternative parametrizations discussed above, we explored two further modifications. First, we considered a higher annual time discount factor (0.975 instead of the baseline value of 0.95). Second, when calibrating
 $ A$
and
$ A$
and
 $ B$
, we targeted total medical expenditures equal to 15% of GDP, as observed in the data (see Table 4), rather than focusing on preventive care expenditures of 0.5% of GDP. In both cases, our core results remain unchanged. For brevity, we do not report the full results here, but they are available upon request.
$ B$
, we targeted total medical expenditures equal to 15% of GDP, as observed in the data (see Table 4), rather than focusing on preventive care expenditures of 0.5% of GDP. In both cases, our core results remain unchanged. For brevity, we do not report the full results here, but they are available upon request.
All told, we are confident that our findings are not dependent on particular parameter values, but hold instead for a wide parameter space.
8. Discussion
In this final section, we explore how relaxing some of our modeling assumptions –such as rational expectations– might affect our main insights. By its nature, the discussion raises more questions than it answers, but it helps clarify the scope of our framework and the interpretation of our results.
8.1. Rational expectations
Our model emphasizes dynamic optimization, making individuals’ expectations crucial. Following standard practice, we assume rational expectations: individuals hold probability beliefs that coincide with those implied by the model. When allocating resources between consumption and preventive care, they understand precisely how each additional unit of prevention affects mortality risk, both at time
 $ t$
and in all future periods
$ t$
and in all future periods
 $ \tau \in [t,{\overline T}]$
. As a result, their choices are optimal in the formal, mathematical sense.
$ \tau \in [t,{\overline T}]$
. As a result, their choices are optimal in the formal, mathematical sense.
However, rational expectations is a strong assumption. Empirical studies show that consumers often struggle to make informed choices when purchasing health insurance (see, e.g., Harris and Keane, Reference Harris and Keane1998; McFadden, Reference McFadden2006; Frank and Zeckhauser, Reference Frank and Zeckhauser2009). Difficulties are particularly pronounced among the elderly, who, for example, frequently find it hard to navigate Medicare and Medigap rules (Harris-Kojetin et al., Reference Harris-Kojetin, McCormack, Jael, Sangl and Garfinkel2001; McCormack et al., Reference McCormack, Garfinkel, Hibbard, Norton and Bayen2001). Similar challenges arise beyond insurance markets: patients face difficulties evaluating options related to physicians, drugs, or treatments, and tend to disregard technical information they do not fully understand (see Keane and Thorp, Reference Keane and Thorp2016, and references therein).
Replacing the rational expectations assumption with a weaker alternative may thus be worthwhile. However, it is unclear what form such an alternative should take, given the “wilderness” of competing models of expectations formation (see Angeletos et al., Reference Angeletos, Huo and Sastry2021). A simple, naive alternative within our model is to assume that individuals do not understand how their health impacts mortality risk. While the true hazard rate satisfies
 $ {\lambda }_{d}\left(d\right)\gt 0$
, individuals could assume
$ {\lambda }_{d}\left(d\right)\gt 0$
, individuals could assume
 $ {\lambda }_{d}\left(d\right)=0$
, ignoring the link between health and survival. As a result, their probability beliefs would no longer align with those implied by the model. Not surprisingly, this “myopic” specification leads to lower preventive care use (
$ {\lambda }_{d}\left(d\right)=0$
, ignoring the link between health and survival. As a result, their probability beliefs would no longer align with those implied by the model. Not surprisingly, this “myopic” specification leads to lower preventive care use (
 $ {H}_{2}=0.1\mathrm{\%}$
compared to
$ {H}_{2}=0.1\mathrm{\%}$
compared to
 $ {H}_{2}=0.6\mathrm{\%}$
in the baseline), as individuals fail to recognize its benefits. This lower preventive care shortens life expectancy by about three years.
$ {H}_{2}=0.6\mathrm{\%}$
in the baseline), as individuals fail to recognize its benefits. This lower preventive care shortens life expectancy by about three years.
Our paper focuses on how medical advances have shaped mortality risk over the past century. For this purpose, we are comfortable adopting the rational expectations hypothesis, as we see no alternative that is both well-founded and internally consistent. That said, relaxing rational expectations could be needed to study other questions, such as why most Americans consume less preventive care than recommended – an area to which our model naturally lends itself.Footnote 18
8.2. Stationary equilibria
Throughout the paper, we compare stationary equilibria, that is, steady state equilibria, as in Hosseini et al. (Reference Hosseini, Kopecky and Zhao2021), Strulik (Reference Strulik2022), De Nardi et al. (Reference De Nardi, Pashchenko and Porapakkarm2024), and Chen et al. (Reference Chen, Feng and Gu2025). Specifically, we solve the model using values of
 $ \{A,\lambda, \theta, y\}$
for selected years, such as 1935 and 2019, and compute key statistics from the corresponding steady state. An alternative approach would be to simulate the full transitional dynamics from 1935 to 2019. Beyond its computational demands, this would require strong assumptions about how individuals form expectations over time, as well as data that do not exist – issues we briefly discuss below.
$ \{A,\lambda, \theta, y\}$
for selected years, such as 1935 and 2019, and compute key statistics from the corresponding steady state. An alternative approach would be to simulate the full transitional dynamics from 1935 to 2019. Beyond its computational demands, this would require strong assumptions about how individuals form expectations over time, as well as data that do not exist – issues we briefly discuss below.
One option assumes that individuals born at time
 $ t$
perfectly anticipate how medical technology (
$ t$
perfectly anticipate how medical technology (
 $ A,\lambda $
), healthcare prices (
$ A,\lambda $
), healthcare prices (
 $ \theta $
), and real median income (
$ \theta $
), and real median income (
 $ y$
) will evolve over their entire potential lifespans
$ y$
) will evolve over their entire potential lifespans
 $ t+a$
with
$ t+a$
with
 $ a\in [0,{\overline T}]$
, and the maximum attainable age
$ a\in [0,{\overline T}]$
, and the maximum attainable age
 $ {\overline T}$
itself depending on these trends. With this perfect foresight, they would choose at time
$ {\overline T}$
itself depending on these trends. With this perfect foresight, they would choose at time
 $ t$
the optimal life-cycle paths for consumption and preventive care, with no need or re-optimizing later in life. At the other end of the spectrum, individuals could be myopic: when making choices at time
$ t$
the optimal life-cycle paths for consumption and preventive care, with no need or re-optimizing later in life. At the other end of the spectrum, individuals could be myopic: when making choices at time
 $ t$
, they assume
$ t$
, they assume
 $ \{A,\lambda, \theta, y\}$
will remain constant at their current levels indefinitely. However, at every time
$ \{A,\lambda, \theta, y\}$
will remain constant at their current levels indefinitely. However, at every time
 $ t+dt$
, they observe that
$ t+dt$
, they observe that
 $ \{A,\lambda, \theta, y\}$
has in fact evolved, which force them to update their beliefs to reflect the new levels and re-optimize accordingly. Lastly, the most mathematically elegant, yet also most complex, approach assumes that
$ \{A,\lambda, \theta, y\}$
has in fact evolved, which force them to update their beliefs to reflect the new levels and re-optimize accordingly. Lastly, the most mathematically elegant, yet also most complex, approach assumes that
 $ \{A,\lambda, \theta, y\}$
evolve stochastically rather than deterministically. This would require abandoning calculus of variations in favor of dynamic programming: at each instant
$ \{A,\lambda, \theta, y\}$
evolve stochastically rather than deterministically. This would require abandoning calculus of variations in favor of dynamic programming: at each instant
 $ t$
, individuals with rational expectations observe the current values of the four trends and choose optimal controls accordingly. This still requires individuals to have full knowledge of the probability laws governing
$ t$
, individuals with rational expectations observe the current values of the four trends and choose optimal controls accordingly. This still requires individuals to have full knowledge of the probability laws governing
 $ \{A,\lambda, \theta, y\}$
, which is by no means a weak assumption.
$ \{A,\lambda, \theta, y\}$
, which is by no means a weak assumption.
Regardless of the approach, studying transitional dynamics complicates aggregation across individuals relative to the stationary case. At any given time
 $ t$
, the population consists of a distribution of cohorts of age
$ t$
, the population consists of a distribution of cohorts of age
 $ a$
, that is, born at time
$ a$
, that is, born at time
 $ t-a$
, each exposed since birth to different values of
$ t-a$
, each exposed since birth to different values of
 $ \{A,\lambda, \theta, y\}$
and therefore facing different mortality risks.
$ \{A,\lambda, \theta, y\}$
and therefore facing different mortality risks.
As a result, simulating transitional dynamics requires information that does not exist. For example, the age-at-death distribution in 1935 depends on cohorts born roughly a century earlier, whose choices were shaped by the (perceived) evolution of
 $ \{A,\lambda, \theta, y\}$
from 1835 to 1935. Likewise, the distribution in 2019 reflects individuals making decisions based on beliefs about medical advances, prices, and income over the coming century. To our knowledge, reliable historical data on these trends from approximately 1835 to 1925, along with credible forecasts out to 2120, are unavailable, making the simulation of full transitional dynamics challenging.
$ \{A,\lambda, \theta, y\}$
from 1835 to 1935. Likewise, the distribution in 2019 reflects individuals making decisions based on beliefs about medical advances, prices, and income over the coming century. To our knowledge, reliable historical data on these trends from approximately 1835 to 1925, along with credible forecasts out to 2120, are unavailable, making the simulation of full transitional dynamics challenging.
For all the reasons mentioned above, considering transitional dynamics over a shorter horizon (e.g., from 1980 to 2000), while still difficult, would be more manageable. However, the effects of medical advances unfold over long periods, often shaping health, longevity, and behavior across multiple decades. This motivates our focus on century-scale comparisons of stationary equilibria.
8.3. Endogenous curative expenditures
Our model distinguishes between two types of health expenditures: preventive care, which slows the accumulation of health deficits, and the monetary costs associated with the health deficit, which can be interpreted as palliative or LTC expenditures, as well as some types of curative expenditures. It is thus natural to treat preventive care as endogenous – a choice made by households, shaped by preferences and perceived health risks (Grossman, Reference Grossman1972; Kenkel, Reference Kenkel1990). In contrast, palliative care, LTC and curative expenditures are often unavoidable (Gertler and Gruber, Reference Gertler and Gruber2002; Wagstaff, Reference Wagstaff2007). As Ozkan (Reference Ozkan2025) notes, poorer individuals tend to use less preventive care early in life but more curative care later, reinforcing the idea that prevention is a choice, while treatment is a necessity. In line with this evidence, our model treats preventive care
 $ h$
as a control variable and assumes the monetary cost of health deficits (
$ h$
as a control variable and assumes the monetary cost of health deficits (
 $ \theta Bd$
) is fully exogenous.
$ \theta Bd$
) is fully exogenous.
For completeness, let us now assume that individuals also choose the monetary costs associated with health deficits. In practice, this captures the possibility of individuals deciding the intensity of palliative, LTC or some curative expenditures (we simply refer to all of them as LTC expenditures). To accommodate this additional control variable, we slightly modify our setup. Specifically, we assume that health deficits generate utility losses each period, which can be mitigated by LTC resources
 $ k$
to make daily lives easier. Mathematically, the budget constraint (3) and the expected lifetime utility (4) become
$ k$
to make daily lives easier. Mathematically, the budget constraint (3) and the expected lifetime utility (4) become
 $$ c\left(t\right)+\theta \left(h\right(t)+k(t\left)\right)=y\mathrm{},$$
 $$ {\int }_{0}^{{\overline T}}\, {e}^{-\rho t}\mathrm{\Lambda }\left(t\right)\mathrm{}\left(\mathrm{l}\mathrm{n}c\right(t)-g(d\left(t\right),k\left(t\right)\left)\right)\mathrm{}\mathrm{}\mathrm{d}t\mathrm{},$$
where the function
 $ g(d,k)$
represents the instantaneous disutility from the deficit and satisfies:
$ g(d,k)$
represents the instantaneous disutility from the deficit and satisfies:
 $ g\gt 0$
,
$ g\gt 0$
,
 $ {g}_{d}\gt 0$
,
$ {g}_{d}\gt 0$
,
 $ {g}_{k}\lt 0$
,
$ {g}_{k}\lt 0$
,
 $ {g}_{kk}\gt 0$
, and
$ {g}_{kk}\gt 0$
, and
 $ {g}_{dk}\lt 0$
. These properties are intuitive: the deficit increases disutility; LTC expenditures decrease disutility both directly and by mitigating the effect of
$ {g}_{dk}\lt 0$
. These properties are intuitive: the deficit increases disutility; LTC expenditures decrease disutility both directly and by mitigating the effect of
 $ d$
; and there are diminishing returns to LTC expenditures. The key difference between
$ d$
; and there are diminishing returns to LTC expenditures. The key difference between
 $ h$
and
$ h$
and
 $ k$
is that
$ k$
is that
 $ h$
permanently reduces the deficit, while
$ h$
permanently reduces the deficit, while
 $ k$
has only a temporary effect on utility.Footnote
19
$ k$
has only a temporary effect on utility.Footnote
19
We present the full solution in Appendix B3, which closely resembles that of the baseline model. The key difference is that we replace the exogenous health expenditures
 $ k=\theta Bd$
with a first-order condition
$ k=\theta Bd$
with a first-order condition
 $$ -{g}_{k}=\theta \epsilon \mathrm{},$$
where
 $ \epsilon $
is the shadow price related to the budget constraint (equal to the marginal utility of consumption, see Appendix B3). This condition states that, at equilibrium, the marginal return on LTC expenditures equals their marginal cost. Fully differentiating (10) under the assumption of constant
$ \epsilon $
is the shadow price related to the budget constraint (equal to the marginal utility of consumption, see Appendix B3). This condition states that, at equilibrium, the marginal return on LTC expenditures equals their marginal cost. Fully differentiating (10) under the assumption of constant
 $ \epsilon $
givesFootnote
20
$ \epsilon $
givesFootnote
20
 $${{{\rm{d}}k} \over {{\rm{d}}d}} = - {{{g_{kd}}} \over {{g_{kk}}}},$$
which is strictly positive given the assumed properties of
 $ g(d,k)$
. In other words, LTC expenditures increase with
$ g(d,k)$
. In other words, LTC expenditures increase with
 $ d$
, as in our baseline model.
$ d$
, as in our baseline model.
To further illustrate this, let us define
 $ g(d,k)=/k$
, which satisfies the conditions above. The first-order condition (10) then becomes
$ g(d,k)=/k$
, which satisfies the conditions above. The first-order condition (10) then becomes
 $$k = {\left( {{{Bdc} \over \theta }} \right)^{{1 \over 2}}},$$
where we use that
 $ \epsilon =1/c$
. We see that
$ \epsilon =1/c$
. We see that
 $ k$
increases with
$ k$
increases with
 $ d\mathrm{}c$
. Earlier, Fig. 7 showed that in the baseline model, the rise in
$ d\mathrm{}c$
. Earlier, Fig. 7 showed that in the baseline model, the rise in
 $ d$
over the life cycle was larger than the drop in
$ d$
over the life cycle was larger than the drop in
 $ c$
. As a result, the optimal
$ c$
. As a result, the optimal
 $ k$
would likely go up with age too, in line with the baseline setup. Moreover, in our extension with complete markets (Section 7.1),
$ k$
would likely go up with age too, in line with the baseline setup. Moreover, in our extension with complete markets (Section 7.1),
 $ \epsilon $
is constant, and
$ \epsilon $
is constant, and
 $ k$
would unambiguously rise over time. We thus conclude that allowing LTC expenditures to be endogenous should not change our main results.
$ k$
would unambiguously rise over time. We thus conclude that allowing LTC expenditures to be endogenous should not change our main results.
Finally, solving the model with endogenous LTC expenditures is complex, as
 $ \epsilon $
is no longer a function of the state and co-state variables (see Appendix B3).Footnote
21
$ \epsilon $
is no longer a function of the state and co-state variables (see Appendix B3).Footnote
21
8.4. Childhood
Following Cole et al. (Reference Cole, Kim and Krueger2019) and De Nardi et al. (Reference De Nardi, Pashchenko and Porapakkarm2024), among many others, our setup abstracts from childhood and focuses on life-cycle dynamics from age 20 onward. We leave out children for simplicity. Including them would further link cohorts, as parents born at time
 $ {t}_{1}$
would need to make decisions and incur costs for children born at time
$ {t}_{1}$
would need to make decisions and incur costs for children born at time
 $ {t}_{2}\gt {t}_{1}$
.
$ {t}_{2}\gt {t}_{1}$
.
Excluding children could be problematic if healthcare use patterns shifted sharply at age 18. In practice, they do not appear to do so. According to 2019 data from the National Center for Health Statistics (Ashman et al., Reference Ashman, Santo and Okeyode2023), office-based physician visit rates rise steadily with age: from 1.5 visits per year for children aged 1 to 17 to 7.08 for those 65 and over. The reasons for visits evolve similarly: preventive care declines with age (40% of visits under 18, 13% at 65+), as do visits for new problems (38% under 18, 17% at 65+), while visits for chronic conditions increase (12% under 18, 56% at 65+), as do those related to pre- or post-surgical care (2% under 18, 7% at 65+). Injury is the only major reason for physician visits that does not exhibit a clear age trend.
Nonetheless, children have benefited the most from several major advances in preventive care over the past century, especially vaccines. For example, Shattock et al. (Reference Shattock, Johnson, Sim, Carter, Lambach, Hutubessy, Thompson, Badizadegan, Lambert, Ferrari, Jit, Fu, Silal, Hounsell, White, Mosser, Gaythorpe, Trotter, Lindstrand, O’Brien and Bar-Zeev2024) estimate that since 1974, vaccination has averted 154 million deaths worldwide, including 146 million among children younger than 5 years of whom 101 million were infants younger than 1 year. Actuarial life tables from the Human Mortality Database also reflect the dramatic decline in child mortality, particularly for infants under age 1: in 1935, a newborn faced a 6% probability of dying within the first year of life; by 2019, that figure had fallen to just 0.5%.
Our model links the hazard rate of death not to age itself but to the health deficit, which increases monotonically with age. Therefore, to the extent that mortality risk rises with age in the data, excluding children should have limited consequences. This holds for those aged 1 to 17, whose mortality risk increases steadily with age. In this case, instead of calibrating
 $ {d}_{0}$
to match the health deficit of the median 20-year-old, we could have matched that of a 5- or 10-year-old. Our findings would be unchanged. However, it does not hold for infants under age 1, who face substantially higher mortality than older children, despite (presumably) having lower health deficits. Moreover, as noted above, this group has benefited most from advances in preventive care. Excluding them may therefore lead the model to understate the full impact of such advances. One possibility would be to introduce a more sophisticated function for the hazard rate of death as
$ {d}_{0}$
to match the health deficit of the median 20-year-old, we could have matched that of a 5- or 10-year-old. Our findings would be unchanged. However, it does not hold for infants under age 1, who face substantially higher mortality than older children, despite (presumably) having lower health deficits. Moreover, as noted above, this group has benefited most from advances in preventive care. Excluding them may therefore lead the model to understate the full impact of such advances. One possibility would be to introduce a more sophisticated function for the hazard rate of death as
 $ \lambda (t,A,d(t\left)\right)={\lambda }_{1}(t,A)+{\lambda }_{2}\left(d\right(t\left)\right)$
. Here,
$ \lambda (t,A,d(t\left)\right)={\lambda }_{1}(t,A)+{\lambda }_{2}\left(d\right(t\left)\right)$
. Here,
 $ {\lambda }_{1}(\cdot )$
would only hold for the very first years in life and be decreasing and convex in
$ {\lambda }_{1}(\cdot )$
would only hold for the very first years in life and be decreasing and convex in
 $ t$
, as well as decreasing in
$ t$
, as well as decreasing in
 $ A$
.
$ A$
.
 $ {\lambda }_{2}(\cdot )$
would be the usual hazard rate increasing in deficits. A more detailed treatment of this issue is left for future research.
$ {\lambda }_{2}(\cdot )$
would be the usual hazard rate increasing in deficits. A more detailed treatment of this issue is left for future research.
9. Conclusion
Over the past century, advances in preventive care have reduced disease incidence, while innovations in curative treatments have lowered mortality risks. These medical breakthroughs might have affected the age-at-death distribution differently, for they shape both individual incentives and the link between health and mortality in distinct ways. Our quantitative analysis shows that although both forms of medical progress have boosted life expectancy since 1935, it is curative treatments that account for the narrowing of the age-at-death distribution.
In addition to the avenues for future research already highlighted in the main text, two further directions seem particularly promising. First, future work will explore the mechanisms underlying the well-documented but poorly understood relationship between income and life expectancy (Deaton, 2016). A deeper understanding of this link could shed light on the historical evolution of the age-at-death distribution and help guide the design of more effective public health policies. Second, another important question concerns the optimal allocation of scarce resources between developing preventive and curative medical technologies. Our current framework – partial equilibrium in nature and treating medical technologies as exogenous – cannot address this issue directly. Nonetheless, it offers a useful foundation: it is tractable, empirically grounded, and well-suited for further extensions.
Supplementary material
To view supplementary material for this article, please visit https://doi.org/10.1017/dem.2025.10009.
Competing interests
The authors declare none.


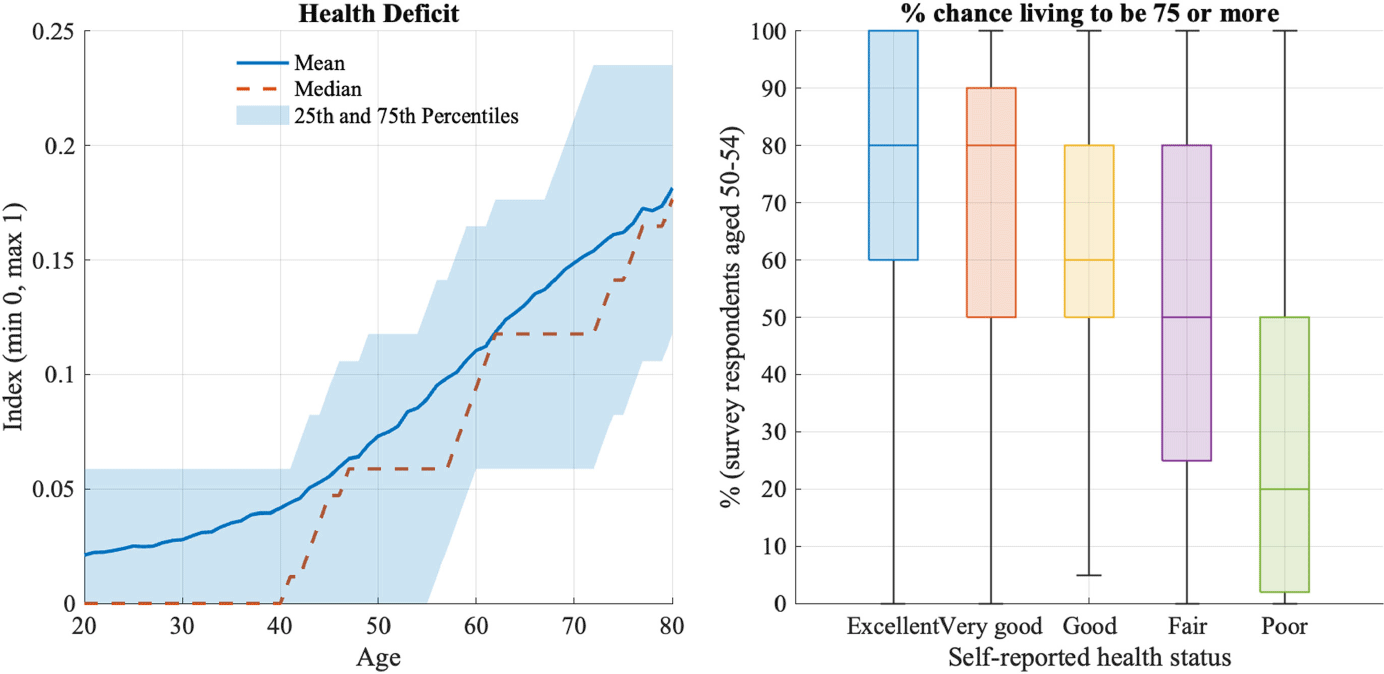
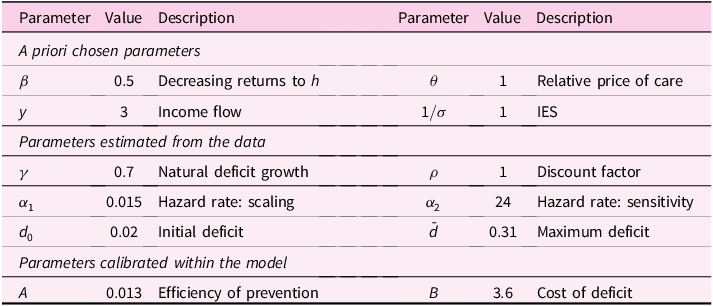
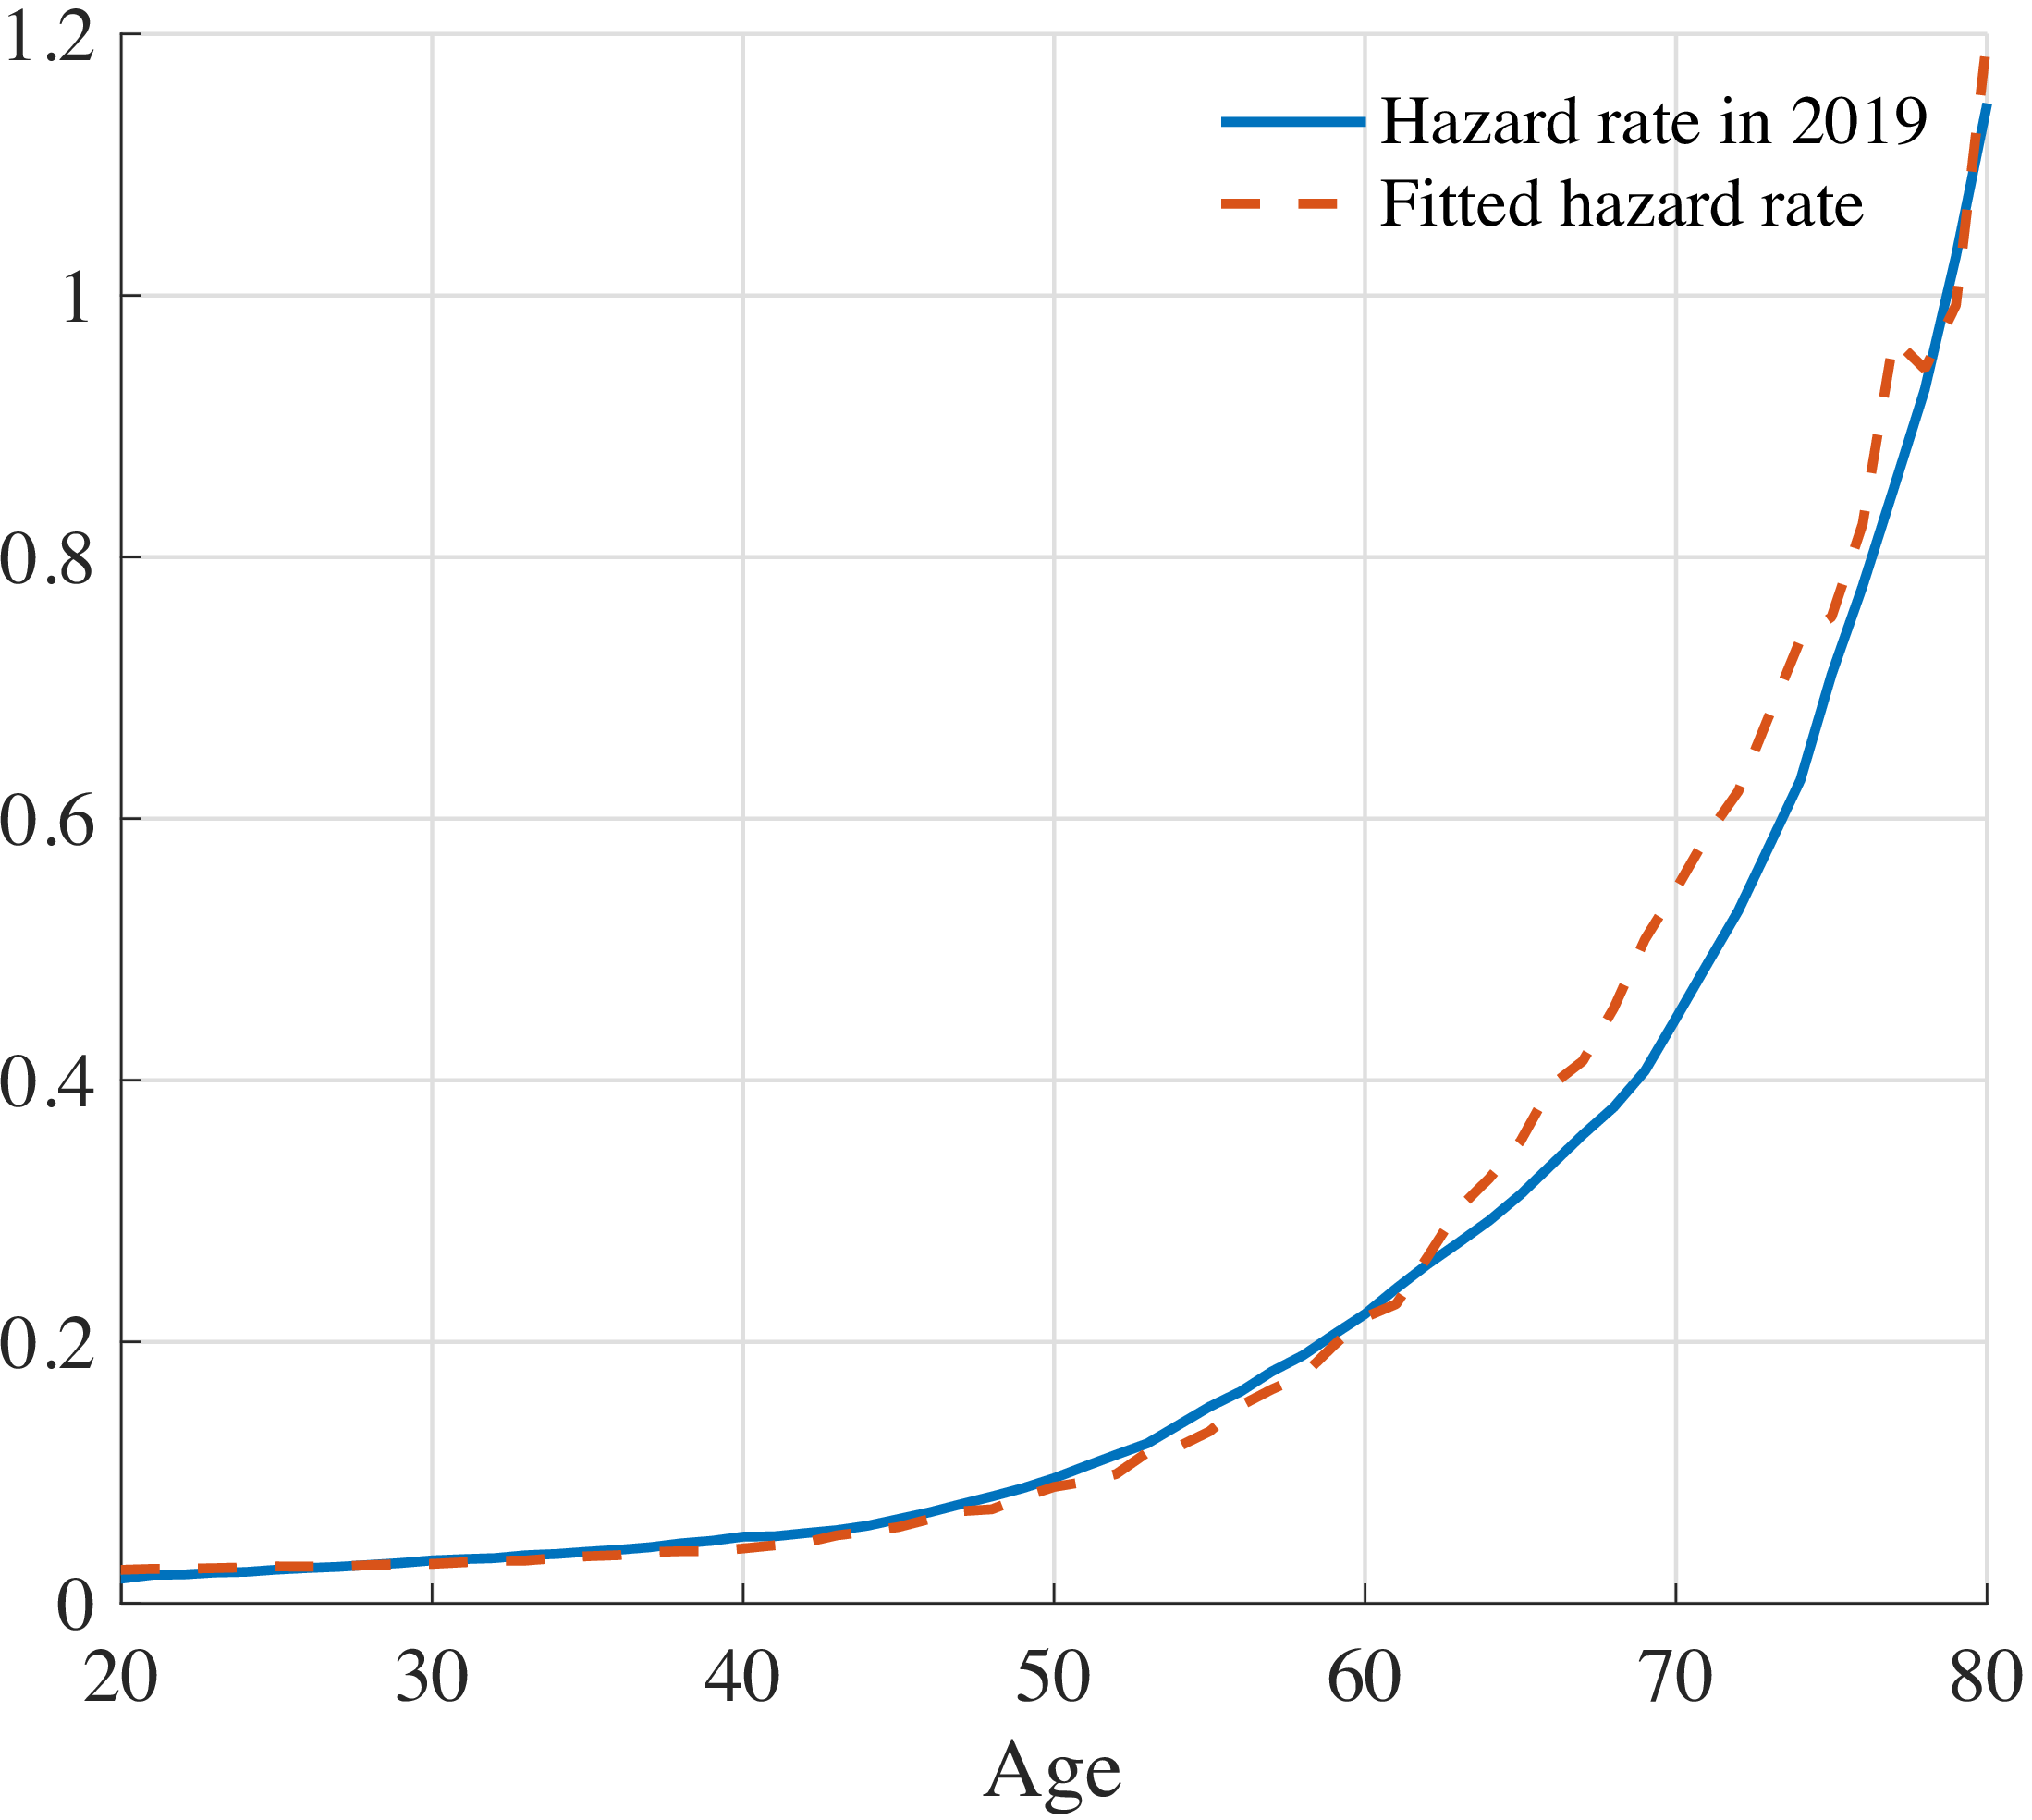

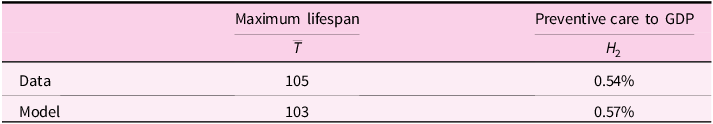
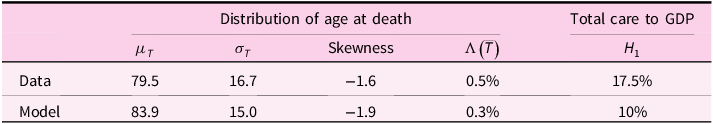
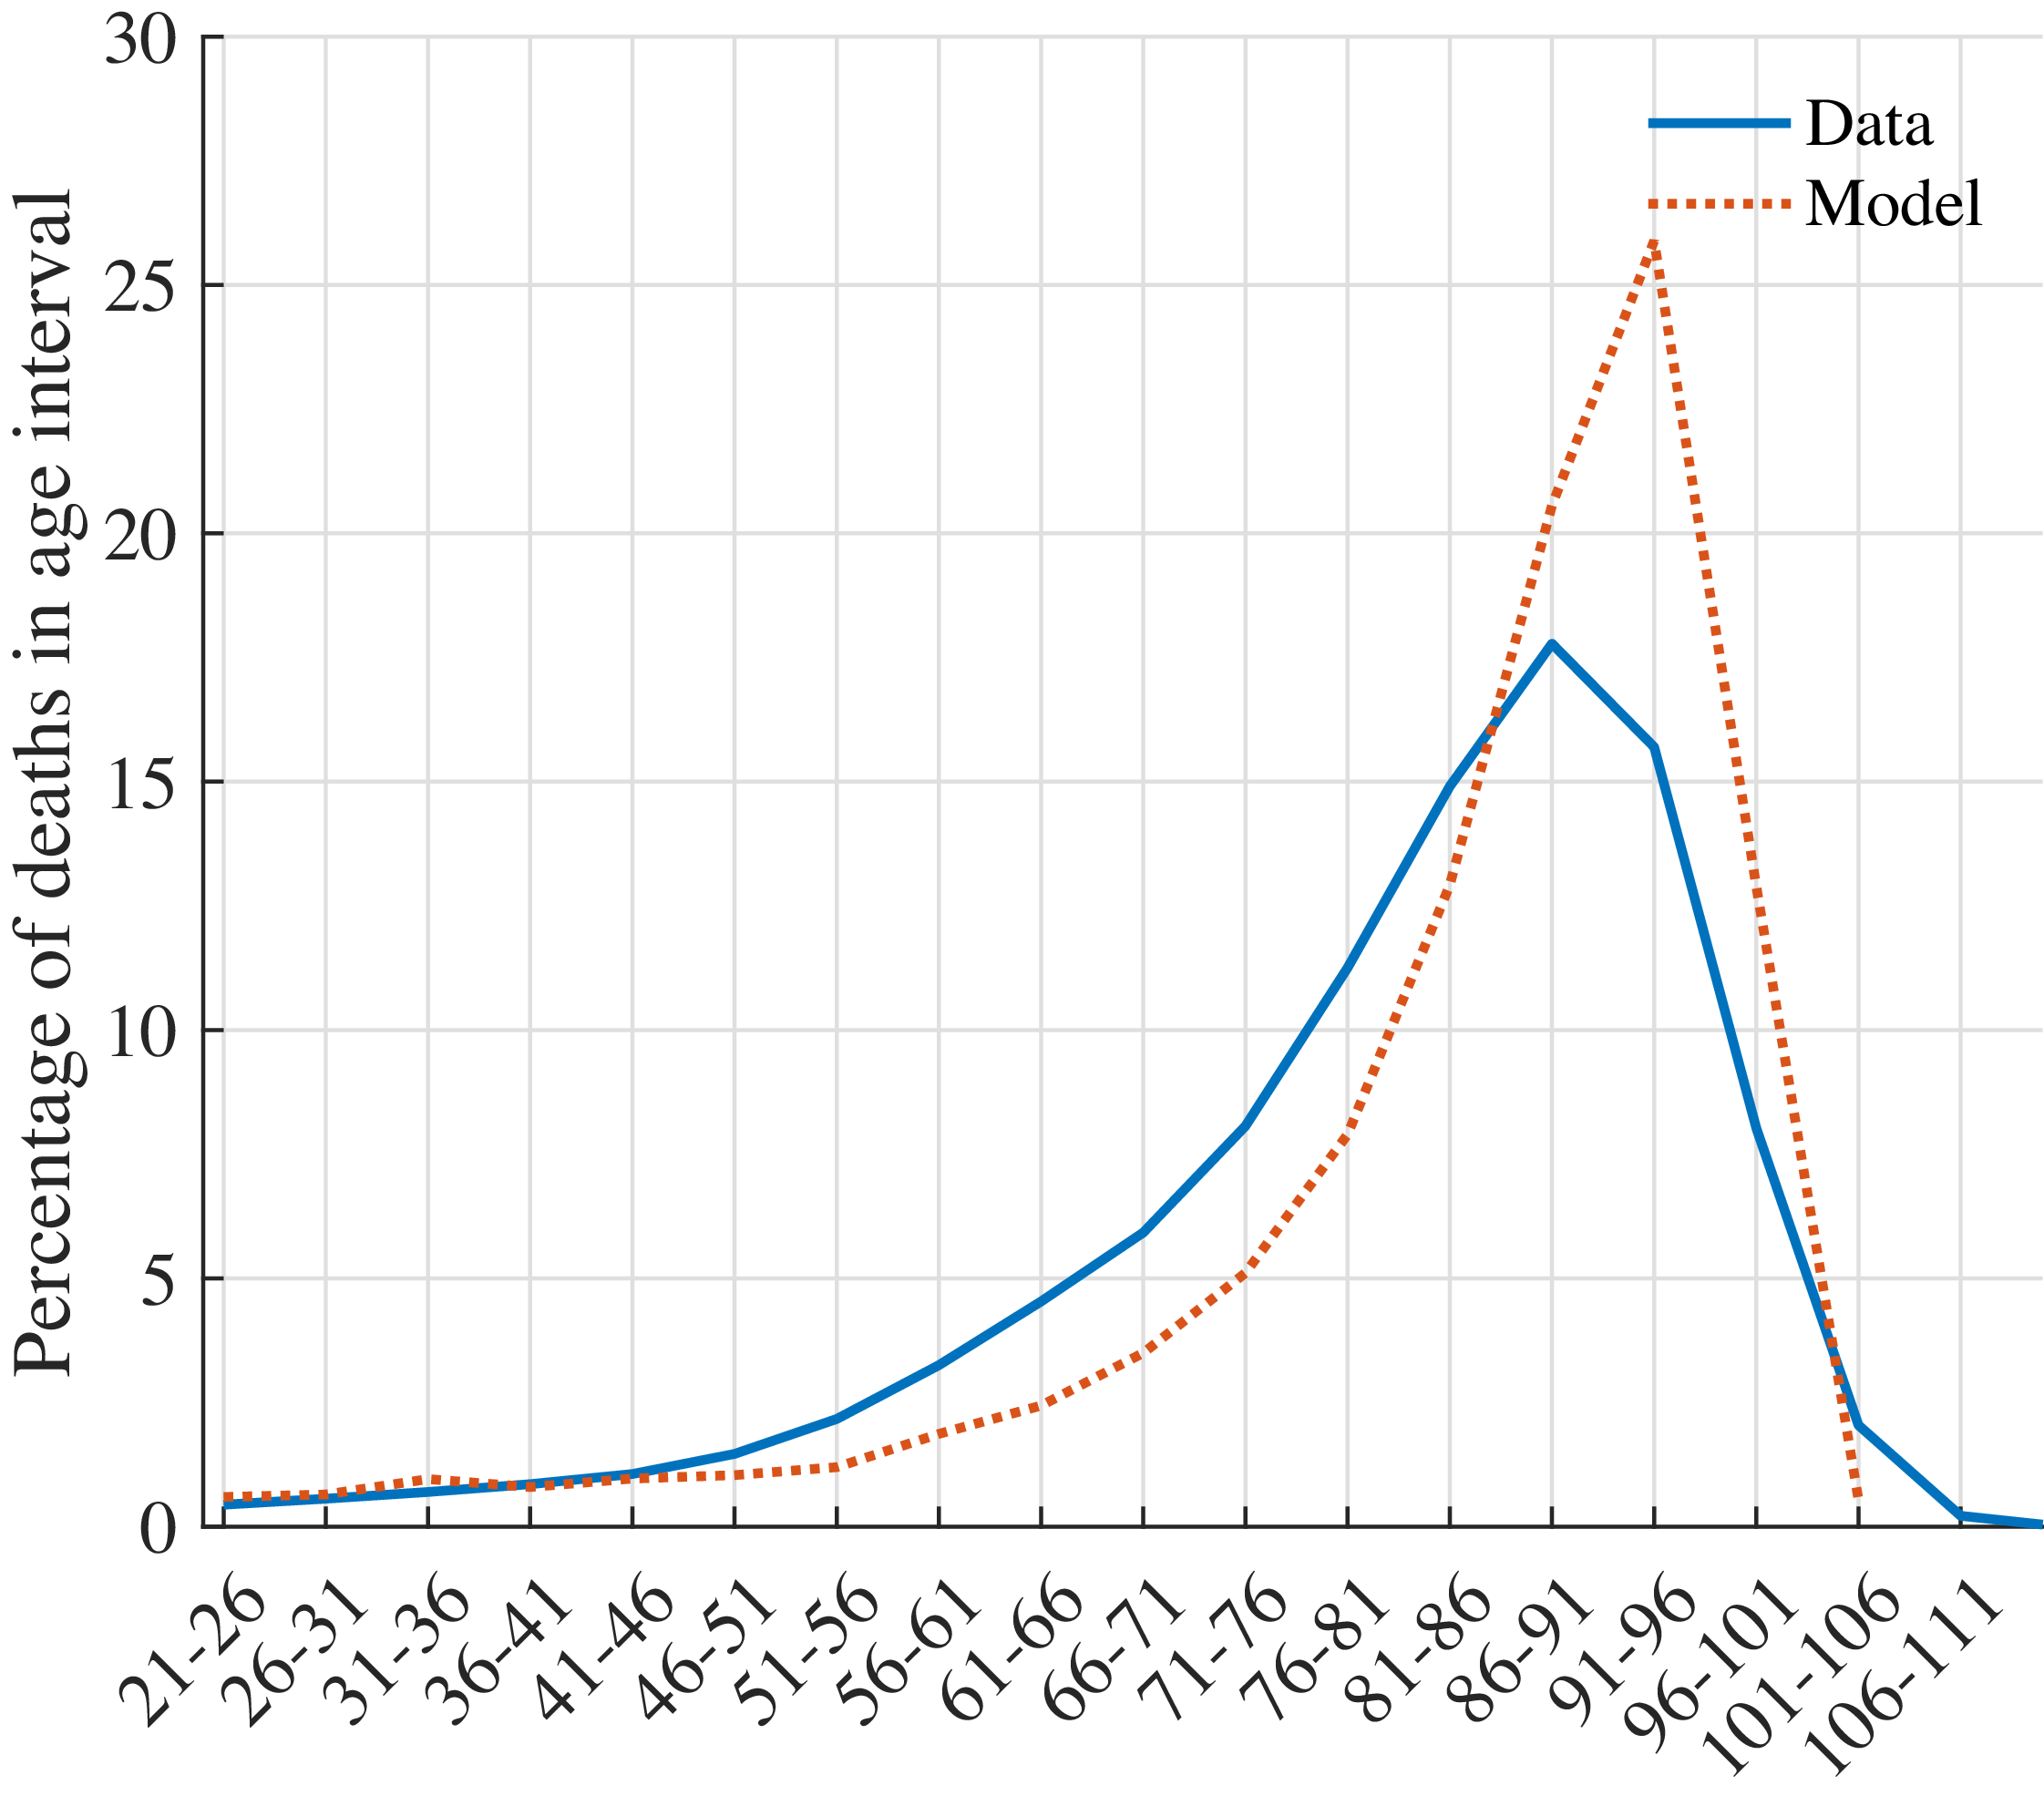


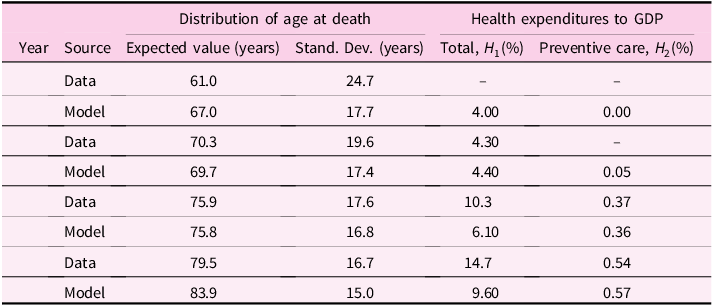
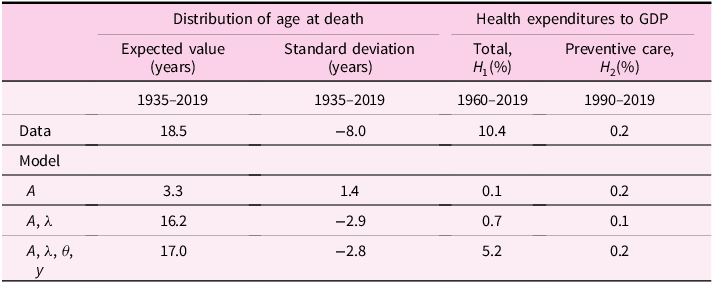
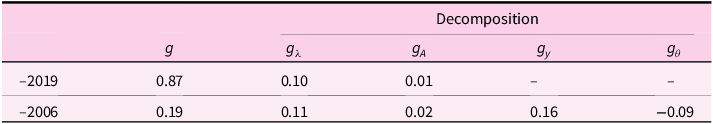


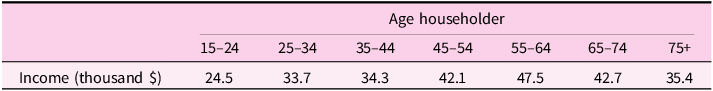


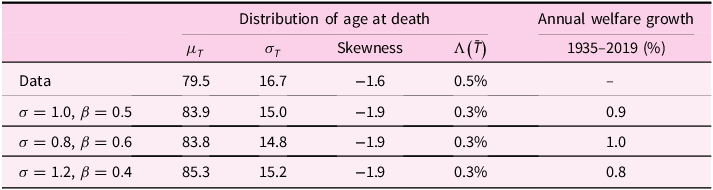

 Open access