


1. INTRODUCTION
In glaciology, strain is a measure of how much ice stretches, compresses and deforms in all directions as it flows, and strain rates represent how quickly these deformations occur. This quantity is a fundamental measure of ice flow that is used in a variety of applications. Combined with Glen's Flow Law, strain rates can be used to calculate the stress state of flowing ice and how that stress state has changed through time (Nye, Reference Nye1953; Glen, Reference Glen1955). Strain rates can be used to identify areas of thinning and thickening that may relate to surge dynamics (Murray and others, Reference Murray, Strozzi, Luckman, Jiskoot and Christakos2003; Burgess and others, Reference Burgess, Forster, Larsen and Braun2012) or bed properties (Bindschadler and Vornberger, Reference Bindschadler and Vornberger1996; Howat and others, Reference Howat, Tulaczyk, Waddington and Björnsson2008). Many authors (e.g. Ambach, Reference Ambach1968) have calculated the local direction of greatest principal stress based on strain-rate measurements to determine the most likely direction of crevasse formation. Empirical (e.g. Alley and others, Reference Alley2008) and modeling (e.g. Benn and others, Reference Benn, Hulton and Mottram2007) studies demonstrate that strain rates may be used to predict calving velocities on ice shelves and tidewater glaciers. ‘Compressive arches,’ defined based on strain-rate patterns, may delineate the limit of ice shelf stability during retreat (Doake and others, Reference Doake, Corr, Rott, Skvarca and Young1998). Strain rates are also used to calculate mass flux divergence on flowing ice, which is an important component in mass-balance calculations (Jenkins and Doake, Reference Jenkins and Doake1991; Rignot and others, Reference Rignot, Jacobs, Mouginot and Scheuchl2013).
The earliest strain-rate measurements on flowing ice employed in situ measurements of the movements of stakes placed on a glacier surface (e.g., Nye, Reference Nye1959). These calculations were limited to discrete measurements over small regions that were accessible to repeat field campaigns. More recently, GPS monuments have made it possible to monitor strain rates continuously (e.g. Howat and others, Reference Howat, Tulaczyk, Waddington and Björnsson2008). In situ methods constrain strain rates at only a few points on accessible glaciers, limiting their applications. However, the availability of satellite-derived velocity grids has made it possible to calculate comprehensive strain-rate maps for broad areas of flowing ice. Various methods have been applied to calculate these strain-rate maps, which yield different results.
In this paper, we explore two commonly employed approaches for the calculation of strain rates from satellite-derived velocity grids: a nominal strain-rate calculation using simple differencing of velocity grids (e.g., Paterson and Savage, Reference Paterson and Savage1963), and a logarithmic strain-rate formulation (Nye, Reference Nye1959) that relies on a numerical stake-tracking scheme. We compare the resulting strain-rate fields, and analyze the importance of the length scales used in the calculations. Finally, we present data products for three components of the strain-rate tensor calculated using Antarctica-wide velocity mosaics derived from Landsat-8 imagery (Fahnestock and others, Reference Fahnestock2016).
2. STRAIN-RATE DEFINITIONS
Denoting two (horizontal) components of velocity as u and v, the strain-rate tensor in two dimensions may be defined as (Nye, Reference Nye1959):
 $${\dot {\epsilon}} = \left[ {\matrix{ {\displaystyle{{\partial u} \over {\partial x}}} & {\displaystyle{1 \over 2}\left( {\displaystyle{{\partial v} \over {\partial x}} + \displaystyle{{\partial u} \over {\partial y}}} \right)\;} \cr {\displaystyle{1 \over 2}\left( {\displaystyle{{\partial v} \over {\partial x}} + \displaystyle{{\partial u} \over {\partial y}}} \right)\;} & {\displaystyle{{\partial v} \over {\partial y}}} \cr}} \right] = \left[ {\matrix{ {{{\dot {\epsilon}}}_x} & {{{\dot {\epsilon}}}_{xy}{\rm \;}} \cr {{{\dot {\epsilon}}}_{xy}{\rm \;}} & {{{\dot {\epsilon}}}_y} \cr}} \right]$$
We will define the x- and y-directions based on the velocity grids from which strain rates are calculated. If the strain-rate tensor is rotated relative to the local flow direction, the longitudinal strain ( ${\dot {\epsilon}}_{{\rm lon}}$, parallel to the local flow direction) can be found in the upper left-hand entry, transverse strain ( ${\dot {\rm \epsilon}}_{{\rm trans}}$, perpendicular to the local flow direction) in the lower right and shear strain ( ${\dot {\rm \epsilon}}_{{\rm shear}}$) in the other two entries. The rotation to orient the strain-rate components relative to the local flow direction can be applied following Bindschadler and others (Reference Bindschadler and Vornberger1996):
 $${\dot {\epsilon}}_{{\rm lon}} = {\dot {\epsilon}}_x\cos ^2\alpha + 2{\dot {\epsilon}}_{xy}\,{\rm cos} \, \alpha \, {\rm sin}\,\alpha + {\dot {\epsilon}}_y\sin ^2 \, \alpha $$
 $${\dot {\epsilon}}_{{\rm trans}} = {\dot {\epsilon}}_x\sin ^2\alpha - 2{\dot {\epsilon}}_{xy}\,{\rm cos\;} \alpha {\rm \; sin\;} \alpha + {\dot {\epsilon}}_y\cos ^2\alpha $$
 $${\dot {\epsilon}}_{{\rm shear}} = ({\dot {\epsilon}}_y - {\dot {\epsilon}}_x){\rm cos} \, \alpha \, {\rm sin} \, \alpha + {\dot {\epsilon}}_{xy}(\cos ^2\alpha - \sin ^2\alpha )$$
where the flow angle α is defined counter-clockwise from the x-axis.
The strain-rate tensor must be discretized or integrated in some way for an application to satellite-derived velocity fields. The simplest formulation is known as ‘nominal’ or ‘engineering’ strain, and is commonly defined in one dimension as the change in length of a parcel (δL) divided by the original length (L o), which can then be divided by the increment of time over which the deformation occurs (δt) to calculate a strain rate (Rees, Reference Rees2006):
 $$\dot e = \displaystyle{{\delta L/L_{\rm o}} \over {\delta t}}.$$
This strain-rate definition is directly equivalent to differencing velocities over some distance and dividing by the offset distance, which is the most straightforward calculation of the strain-rate tensor (Supplementary Section S1). It is derived with the assumption that the change in length δL is very small compared with the original length of the object or parcel, and that velocities change linearly between sample points. Many authors (e.g. Howat and others, Reference Howat, Tulaczyk, Waddington and Björnsson2008; Rignot and others, Reference Rignot, Mouginot and Scheuchl2011) have relied on nominal strain-rate formulations for calculating strain rates from ice flow velocity grids or in situ measurements.
However, errors are introduced when this approximation is used for a parcel that is strained significantly, such as an ice parcel flowing through large velocity gradients in a glacier (for example, when flowing through an ice fall or shear margin). In this case, a different definition that essentially compares a length change to a previous length, rather than the original length, is more appropriate because the calculated strain rate will depend on the history of strain experienced by the parcel. This integrated quantity is known as ‘logarithmic strain’ or ‘true strain’ (Nye, Reference Nye1959):
 $${\dot {\epsilon}} = \displaystyle{1 \over {{\rm \Delta} t}}\ln \left( {\displaystyle{{L_{\rm f}} \over {L_{\rm o}}}} \right).$$
L f in this equation is the final length of the parcel. This approach to calculating strain rates has also seen the significant application in the glaciological literature (e.g. Nye, Reference Nye1959; Bindschadler and Vornberger, Reference Bindschadler and Vornberger1996; Scherler and others, Reference Scherler, Leprince and Strecker2008; Burgess and others, Reference Burgess, Forster, Larsen and Braun2012). However, many authors do not specify whether logarithmic or nominal strain was utilized in their study.
Nominal strain and logarithmic strain will generally be approximately equal if length change is <2% of the original length (Rees, Reference Rees2006). If accurate integration of parcel trajectories is possible, nominal and logarithmic strain rates are exactly equal (Supplementary Section S1). With real data, however, exact integration is impossible, and application of the two methods to the same data will yield different results.
3. DATA AND METHODS
We present two Matlab codes for calculating strain rates, as well as data products for longitudinal, transverse and shear strain rates calculated for the Antarctic continent. Codes are provided as Supplementary Files; strain-rate data products can be obtained through open ftp by contacting the National Snow and Ice Data Center (NSIDC) or the authors.
3.1. Velocity grids
The ice velocity grids used in this study have been derived from the cross-correlation of pairs of Landsat-8 scenes. The velocities have then been mosaicked to cover the Antarctic continent as the Landsat Ice Speed of Antarctica (LISA) data product (using the methods of Fahnestock and others, Reference Fahnestock2016; data available from NSIDC). The grids, which are provided as separate rasters for ice speeds in the x-direction (u) and y-direction (v), were assembled from data collected between 1 July 2013 and 30 June 2016.
The feature tracking program used by Fahnestock and others (Reference Fahnestock2016) is accurate to ~0.1 pixels; Landsat-8 panchromatic imagery, used for the LISA mosaic, has a resolution of 15 m. The accuracy in velocity estimates is then tied to the time separation between the images and the amount of displacement observed, as well as geolocation errors in the imagery. However, the LISA mosaics are stacked products including many overlapping pairs of Landsat scenes spanning many different time intervals, allowing for significant reduction in both the geolocation and random velocity error. Errors are discussed in detail in later sections. The analyses presented here are built on the LISA mosaic gridded at a spatial resolution of 750 m.
3.2. Nominal strain-rate code
A one-dimensional strain rate is correctly defined as an instantaneous change in velocity (speed) with distance, du/dx. However, to implement this definition, velocity differences have to be taken over some finite distance:
 $$\displaystyle{{{\rm d}u} \over {{\rm d}x}} = \displaystyle{{u2 - u1} \over {\Delta x}}.$$
This quantity is frequently seen in the literature, generalized to 2d and calculated from a velocity grid. This method inherently assumes that velocities change linearly across the differencing distance, as it does not take into account the velocities between the sample points.
In the nominal strain-rate code, tensor components are derived by offsetting a u or v velocity grid some distance relative to itself in the x- or y-direction according to (1) (Supplementary Section S2). The velocity differences at that distance are then calculated and divided by the offset distance to determine the strain-rate components. Values are assigned to the center point around which the velocity differences were calculated; we will define the half-length-scale (r) as the distance between the center point and one of the velocity points used for differencing, which is half the offset distance (Supplementary Fig. S2).
In this code, as in the logarithmic strain-rate code described below, strain-rate components are first calculated relative to the x- and y-directions of the velocity grid. A tensor rotation is then applied to align measurements relative to the local flow direction to derive longitudinal, transverse and shear-strain values using (2)–(4).
3.3. Logarithmic strain-rate code
Some of the first calculations of the strain-rate tensor on a glacier were made by J.F. Nye as part of the 1956 Cambridge Austerdalsbre Expedition (Nye, Reference Nye1959). Nye's method calculated the surface strain rate at a point by measuring changes over time in a grid of five stakes. Multiple measurements were made in the same direction to minimize error and take into account strain-rate patterns averaged over a length scale of interest. The stakes were placed as close to a perfect square as possible, as shown in Figure 1, and measurements were taken of each labeled distance.
Stake setup used by Nye (Reference Nye1959) to measure the strain-rate tensor.

Returning after some period of time, the change in length of each segment defining the grid was recorded, and the initial and final lengths (L o. and L f.) were used, along with the time interval, to calculate the strain rate for each segment using the logarithmic strain Eqn (6). Each of the strain-rate components was averaged with its corresponding component on the opposite side of the grid in order to account for the variation of the strain-rate tensor across the square. This resulted in four measured strain rates: a, b, c and d, which correspond to  ${\dot {\epsilon}}_0$, ${\dot {\epsilon}}_{45}$, ${\dot {\epsilon}}_{90}$ and ${\dot {\epsilon}}_{135}$. A least-squares method was used to estimate the longitudinal, transverse and shear strain rates from these averages (Supplementary Section S3).
Our logarithmic strain-rate code adapts Nye's technique for measuring strain rates to satellite-derived velocity grids. A digital ‘stake’ is placed at a center point in the grid, with four others placed at a length scale r in perpendicular directions from the center point, in the same pattern as Nye's strain square (Fig. 1). Stakes are allowed to move through the velocity field using a numerical tracking scheme with adaptive time-stepping (Supplementary Section S4) that ensures a reasonable level of accuracy for each stake movement. We assume that the velocity field is constant during the time the stakes are allowed to move. After stakes have moved for a sufficient period of time, the final lengths for each segment are calculated, and the data are reduced and rotated to find the three flow-oriented strain-rate components. This process is repeated for each pixel in the velocity grid.
Unlike the nominal method, which assumes that velocities change linearly over the length scale used for calculation, the logarithmic method takes into account nonlinear velocity variations between sample points. The code extracts velocity values throughout the travel paths of the virtual stakes, employing bilinear interpolation to estimate velocity values between grid center points.
3.4. Validation and sign conventions
We validated the performance of both codes by calculating strain rates for a synthetic velocity field that produces uniform strain rates for axis-oriented components (Supplementary Section S5). Both strain-rate algorithms reproduced the correct values with high accuracy; the logarithmic code introduced a small amount of error due to numerical approximations, and the nominal code yielded exact results because its inherent assumption of linear strain-rate change is correct for this field.
When strain rates are rotated relative to the local flow direction, the uniform strain-rate field is also useful for demonstrating the applied sign conventions. Flow vectors for a uniform strain-rate field centered on the origin are shown in Figure 2a. Figure 2b shows flow-oriented longitudinal strain rates, with positive values between 315° and 45° as well as between 135° and 225°, and negative values elsewhere. As shown by the flow vectors in Figure 2a, regions with positive longitudinal strain rates are areas where the velocity increases along a flowline; a parcel traveling in these regions will extend as it flows, which is defined as a positive longitudinal strain rate. Figure 2c is the transverse strain rate for the field, which measures stretching or compression across flow. In this case, the positive and negative values are reversed from the longitudinal strain-rate field. In negative areas, flowlines approach each other, leading to transverse compression, while in positive areas the flow lines are spreading farther apart.
Strain rates calculated from a uniform-strain velocity field. (a) Velocity vectors, (b) longitudinal strain rates, (c) transverse strain rates, (d) shear strain rates.

Longitudinal and transverse strain rates can both be expressed in terms of extension or compression. In both cases, strain rates are defined as positive in extension, and negative in compression. In other words, ice parcels that stretch in the along- or cross-flow directions have positive longitudinal and transverse strain rates, respectively, while ice parcels that compact along- or across-flow have negative strain rates.
Sign conventions for shear strain rates are more obscure. In Figure 2d, we see that the positive shear strain rates are found between 0° and 90°, as well as between 180° and 270°. If an imaginary parcel is placed in the field in one of these regions, the parcel would deform with the right-hand face moving downwards and the left-hand face moving up, relative to each other; in other words, ice deformations that have right-lateral movement are considered to have positive shear strain values. This sign convention is maintained throughout this paper.
4. QUANTIFYING CODE ACCURACY USING A SYNTHETIC VELOCITY FIELD
A uniform strain-rate field is useful for validating the codes and defining sign conventions, but it is not realistic. In order to test the level of error introduced by our codes, we create a strain field corresponding to potential flow (White, Reference White1999) around a Rankine half-body, which is simple enough that the coordinate-oriented strain-rate components can be derived analytically (Supplementary Section S6). The analytical solutions, as well as results discussed below, are shown in Figure 3. The Rankine half-body flow field yields patterns similar to flow around a nunatak or ice rise within flowing ice; we chose parameters that approximate flow characteristics around large ice rises in Antarctic ice shelves, such as Roosevelt Island in the Ross Ice Shelf or Berkner Island in the Filchner-Ronne. Note that real strain-rate fields are considerably more complicated and have much larger gradients in strain rates, particularly at shear margins. Because this field only includes smooth, predictable changes that can be reasonably approximated in linear segments, the nominal code will perform better than in more complex flow fields, where the logarithmic strain calculations and stake-tracking will be more important.
Theoretical and calculated strain-rate results for flow around a Rankine half-body.

In order to understand the impacts of our numerical approximations on strain-rate results, we use a simple measure to assess code accuracy: the mean of the absolute value of the difference between the calculated and theoretical strain fields (we will refer to this as the ‘difference’ throughout this section). This is a single value that will not be representative of all areas. We chose a domain that encompasses the higher-strain-rate regions near the tip of the Rankine half-body, but still includes large areas of very low strain rates where the nominal code is expected to perform very well (Fig. 3).
Figure 4a shows the difference between the numerical results and the analytical solution for both codes. Differences are generally on the order of 10−8–10−7 day−1, which means they are generally between 0.1 and 1% of the strain-rate values calculated for this scenario. The difference for the nominal code shows very little change with length scale because the smooth gradients in the velocity field are approximated well by linear assumptions regardless of differencing distance. The logarithmic code shows an increase in difference with length scale, which is related to error introduced by the repeated stake velocity approximations. However, very few locations would rely on the larger length scales shown on the graph, and at maximum, the difference is <1% of typical values. The length scales more commonly used would yield even smaller differences, at levels where the disparities between the nominal and logarithmic codes are not statistically significant.
Measure of difference in Rankine half-body results at different length scales. Difference measure is the mean of the absolute value of the difference between the calculated and analytical solutions. (a) Difference calculated without added noise. (b) Difference calculated with added Gaussian noise.

We also tested the codes with added simulated noise in the Rankine half-body velocity grids, in the form of a normally distributed perturbation with a mean of zero and a Std dev. of 2.5 m a−1, which is on the order of error expected in the LISA mosaics. Images of the results are shown in Figure 3. Difference results are shown in Figure 4b. In this case, difference estimates were about an order of magnitude higher, yielding percentages between ~1% and 10%. Furthermore, the results suggest that in real data, any differences added by larger numbers of approximations in the logarithmic code will be insignificant compared with any error in the data. With noise added, the logarithmic code has slightly smaller differences than the nominal code. The reduction is a consequence of the logarithmic code sampling over many pixels, which smooths out noisy measurements. On the other hand, the nominal code makes calculations simply by differencing two measurements at a time; if these measurements are corrupted by measurement error, the resulting differences in strain-rate estimates can become magnified. In contrast to the trends in difference without noise, the fields with noise show a decrease in difference as the length scale increases. This is due to a smoothing effect produced by spreading calculations over larger distances.
Overall, these tests show that both codes perform well on this relatively smooth strain-rate field, both with and without added noise, and that differences introduced by the numerical methods are insignificant. We also conclude, however, that the logarithmic code is more likely to be accurate when applied to a wide variety of real velocity fields. Its use of logarithmic strain will make it more accurate in areas with high strain rates (Rees, Reference Rees2006), and its numerical integration along stake paths makes it less sensitive to large errors in isolated measurements. It also avoids the assumptions of large-scale linear changes in velocity inherent in the nominal strain-rate code.
5. RESULTS USING LISA MOSAICS
5.1. Impacts of calculation approach
In order to explore the impacts of the calculation approach on real data, we extracted a section of the LISA velocity mosaic around the Bindschadler and MacAyeal Ice Streams (also known as Ice Streams D and E) that feed the Ross Ice Shelf. We chose this region as a representative of many areas of interest for strain-rate calculations. Although the strain rates are not the largest in Antarctica, they are still high at the shear margins, which is likely to highlight any differences between the codes. The ice streams also exhibit complex strain-rate patterns between the shear margins. In addition, this is a region in which strain rates have been previously calculated (Bindschadler and Vornberger, Reference Bindschadler and Vornberger1996) because they reveal important information about the ice stream flow patterns.
Figure 5 shows the normalized error between the results of the logarithmic and nominal codes for the region of interest. The percent difference is calculated as the absolute value of the difference between the two results divided by the absolute value of the results for the logarithmic code, multiplied by 100.
Percent difference in strain-rate calculations between the logarithmic and nominal codes for the Bindschadler and MacAyeal Ice Streams. Location is shown in red box in (a); ice speeds from the LISA Mosaic (Fahnestock and others, Reference Fahnestock2016) shown in (b). Location is the same as in Figures 6 and 7. Area of no velocity data in the upper right of the grid represents the region south of Landsat image coverage. Both codes were run using a length scale of 3000 m, which means the effective averaging distance is ~6× the average ice thickness in this area. Percent difference is calculated as the absolute value of the difference between the two codes divided by the absolute value of the results of the logarithmic code, multiplied by 100.

Because we are showing differences as percentages, small differences in strain-rate results due either to code differences and/or random error in the original data yield much larger values in areas with very small strain rates, such as those generally found outside the ice streams. Therefore, most of the speckled values shown outside the ice streams can be treated as spurious noise. However, the areas within and along the edges of the ice streams show more reliable results, with the biggest errors found at shear margins. This is predictable because shear margins are typically where the largest strain rates and the largest gradients in strain rates occur, which leads to larger differences between engineering and logarithmic strain estimates.
The differences between the codes vary with strain-rate component, but generally are not large, particularly within the ice streams. It is only in the narrow shear margins where significant errors are found. Typical difference values in the shear margins for longitudinal and shear strain rates are below 10%, but can reach 20–30% in some areas. Transverse strain rates have higher differences near the shear margins, typically above 10% and often reaching above 50% in areas that are not obviously noisy. There are also some significant differences within the ice streams for transverse strain rates, in areas where absolute values for strain rates are larger.
As noted, we expect smaller differences between the codes, due to better alignment with assumptions, in areas with small strain-rate gradients where linear approximations between pixels are relatively accurate. There is also an interesting feedback in the strain-rate calculations between differences in the codes, the local strain rate and the length scale assigned. Rees (Reference Rees2006) noted that logarithmic strain formulations are significantly more accurate when an object strains more than ~2%. In an area with high strain rates, each strain-rate segment will change length a relatively large amount during the designated time interval. So, we expect the logarithmic code to perform better in areas with high strain rates. However, the length scale applied is also important. If a calculation is made with a larger length scale in an area with high strain rates, a comparable amount of absolute length change in a strain segment translates to a smaller percentage, and use of the logarithmic strain-rate approach is not as important. Therefore, we expect smaller differences between the codes in areas with low strain rates and when using larger length scales.
Overall, we conclude that, in most locations, there is very little difference between the two approaches, and either code can be reasonably applied. However, if it is important to measure strain rates accurately at the shear margins or in other areas with high strain rates and/or high gradients in strain rates, the logarithmic strain-rate code is significantly more accurate. We, therefore, continue our analysis with only the logarithmic strain-rate code, and use the logarithmic approach to create our strain-rate data products.
5.2. Impacts of length scale on logarithmic code
Although differences between results produced by the two codes were relatively small, with significant differences confined to shear margins and areas of large strain rates, larger differences are found associated with the use of different length scales. The use of a larger length scale has essentially a smoothing or averaging effect on the results. Figure 6 shows logarithmic code results for the MacAyeal/Bindschadler Ice Streams region at four different length scales. Close inspection shows that shear margins and features within the ice streams tend to be thinner and more well-defined at smaller length scales, while at larger length scales shear margins spread to larger areas and some small-scale features are no longer visible. For example, the circled region in the longitudinal strain-rate images is an area where details within the ice stream are lost at larger length scales; the arrow in the shear strain-rate fields shows the widening of a shear margin.
Logarithmic code results for Bindschadler and MacAyeal Ice Streams at different length scales. Labeled lengths correspond to r, and therefore represent half of the effective length scale used in the calculation. Circled region in the longitudinal strain-rate grids highlights an area where detail within the ice stream is lost at larger length scales; arrow in shear strain-rate grids shows a region where the shear margin spreads at larger length scales.

Figure 7 shows the absolute value of the difference between the results for the logarithmic code at user-defined length scales of r = 1500 and 3000 m (effective length scales of 3000 and 6000 m). Note that the units used in this case are day−1, and are the same units and order of magnitude as seen in the raw results in Figure 6. As with the differences between the codes, the biggest differences are found at the shear margins. However, differences in length scale also cause differences of comparable magnitude in strain rates within the ice streams.
Length-scale differences between numerical code strain-rate calculations for the Bindschadler and MacAyeal Ice Streams. Values shown are absolute values of differences. Half-length scales used are 1500 and 3000 m.
Unfortunately, deciding on a ‘correct’ length scale is not straightforward. If large-scale features of the flow, such as thinning or thickening of the ice, are of interest, it is best to choose a length scale that reflects the viscous processes governing ice flow. Therefore, we seek a ‘longitudinal stress-gradient coupling’ length that roughly indicates how far away a perturbation in one location can be felt by another ice parcel (Cuffey and Paterson, Reference Cuffey and Paterson2010). Longitudinal coupling is governed by many factors such as effective viscosity, ice thickness and basal shear stress. Ice with higher viscosities, larger thicknesses and lower basal shear stress exhibits longer longitudinal stress-gradient coupling lengths (Cuffey and Paterson, Reference Cuffey and Paterson2010; Gudmundsson, Reference Gudmundsson2013). Additionally, crystal fabric orientation may make longitudinal coupling lengths anisotropic, putting our centered, isotropic approach to strain-rate calculation at a disadvantage.
Of the major factors that govern longitudinal coupling length (effective viscosity, ice thickness and basal shear stress), only ice thickness can currently be reasonably constrained across the Antarctic continent. Longitudinal coupling length scales in temperate mountain glaciers tend to be small because of high basal shear stresses and low ice viscosities, as well as small ice thicknesses, with length scales generally 1–3 times the ice thickness. Colder ice sheets have longitudinal coupling length scales that are typically 4–10 times the ice thickness (Cuffey and Paterson, Reference Cuffey and Paterson2010). As ice sheets also tend to have much larger thicknesses, this leads to very large length scales for calculation.
If strain rates are calculated for application to brittle processes, such as crevasse formation, or are being related to other small-scale features, it may be best to consider strain rates over smaller length scales. Therefore, the selection of a length scale is both location- and application-dependent.
5.3. Impacts of length scale in a glaciological calculation: basal melt rates
To evaluate the importance of length scale choice in glaciological calculations, we applied strain-rates calculated at different length scales to calculations of basal melt rates on ice shelves. Strain-rate calculations are inherent in assessments of ice shelf mass balance at a given location. If we assume that ice is incompressible, we can write the mass-balance equation for flowing ice following Jenkins and Doake (Reference Jenkins and Doake1991):
 $$\displaystyle{{\partial H} \over {\partial t}} = \dot \alpha_{\rm s} + \dot \alpha_{\rm b} - \nabla (H{\bi u}).$$
In this equation,  $\dot \alpha_{\rm s}$ and $\dot \alpha_{\rm b}$ are rates of surface and basal accumulation, respectively, H. is the ice thickness, and t is time. u is a vector of horizontal velocities, which are assumed to be uniform throughout the vertical column in shelf ice. Expansion using the chain rule makes the dependence on strain rates explicit:
 $$\displaystyle{{\partial {\rm H}} \over {\partial {\rm t}}} = \dot \alpha_{\rm s} + \dot \alpha_{\rm b} - H({\dot {\epsilon}}_x + {\dot {\epsilon}}_y) + u\displaystyle{{\partial H} \over {\partial x}} + v\displaystyle{{\partial H} \over {\partial y}}.$$
Given independent estimates of, surface mass balance  $(\dot \alpha_{\rm s})$ and ice thickness (H), velocity grids may be used to calculate horizontal strain rates which can be used with (9) to calculate rates of ice shelf basal mass balance ${\rm (}\dot \alpha_{\rm b})$ (Rignot and others, Reference Rignot, Jacobs, Mouginot and Scheuchl2013). In areas with high steady-state basal melt rates, the time-varying term ∂H/∂t and the surface mass-balance term ( $\dot \alpha_{\rm s}$) have relatively insignificant impacts on the calculated basal melt rates. The ice thickness and mass flux divergence, calculated from surface strain rates, have much larger impacts.
We carried out example basal melt rate calculations using a variety of data sources. Ice shelf thicknesses (H) are derived at a 1 km resolution from Cryosat-II radar altimetry data collected between 2011 and 2014 (Chuter and Bamber, Reference Chuter and Bamber2015). All other data have been resampled to match this 1 km resolution. Surface mass balance ( $\dot \alpha_{\rm s}$) is derived from a 30-year average of RACMO-2.3 model output from 1984 to 2014 (Van Wessem and others, Reference Van Wessem2014). Ice thickness change (∂H/∂t) is calculated from an 18-year trend of satellite altimetry data between 1996 and 2014 (Paolo and others, Reference Paolo, Fricker and Padman2015). We approximate ice thickness change from surface elevation change using a density of 917 kg m−3 for ice and a density of 1023 kg m−3 for seawater. Surface velocities (u, v) are from LISA mosaics (Fahnestock and others, Reference Fahnestock2016). Data sources are unavailable for a single coincident time period; however, as mentioned previously, the data sources that have the largest impacts on the calculations are ice thickness and surface velocity, and the time periods of data collection for these overlap. In addition, our intent is to offer an example of the importance of length scale within a reasonable glaciological calculation, not to present a defensible estimate of basal melt on ice shelves, which decreases the importance of using data from coincident time periods.
Because ice thickness and velocity measurements are not from precisely the same time period, local basal melt rates may be strongly affected by the advection of large rifts. These features are reflected in both the ice thickness measurements and the calculated strain rates. If the rift locations are offset between the two datasets, the basal melt calculation will falsely indicate parallel regions of very high basal melt and freeze-on. These parallel regions can be prominently seen on the Ross Ice Shelf, among other locations (Fig. 8). These are obvious transient effects due to the differing time periods of the datasets; less obvious transient effects may also be present. These and other outliers are therefore reflected in our results, but they will be included to a similar magnitude in both example calculations made for each ice shelf.
Estimated basal melt rates on ice shelves. Basal melt rates calculated using Eqn (9). First column shows results with strain rates calculated at the smallest possible length scale according to the pixel size; second column shows results with strain rates calculated at a length scale of 8× the ice thickness. Third column is first column subtracted from second column.

Figure 8 shows the calculated basal melt rate results for several large ice shelves in Antarctica. We first calculated basal melt rates using strain rates computed at the smallest possible length scale, which in this case uses the pixel size of 1 km (therefore the length scale is effectively 2 km). This commonly used approach utilizes the highest resolution possible given the pixel size and may be appropriate for assessments of small-scale patterns of basal melt rates on ice shelves with complex basal topography. Then basal melt rates were recalculated with strain rates determined using length scales of ~8× the ice thickness. These viscous-scale calculations might be appropriate for large-scale averages and for ice shelves with less complex basal topography. Finally, we compared the average values in each calculation. We chose example ice shelves that are not dominated by large rifts.
In Table 1 we show a comparison of average basal melt rates for each calculation. For some ice shelves with low strain rates and low overall melt rates, such as on the Ross and Filchner-Ronne, the percent differences are very large because the absolute melt rates are very small; therefore, percentages are likely not representative measures of change. However, it is notable that the difference in length scale actually reversed the sign of the melt on the Filchner-Ronne Ice Shelf, an effect very significant to the interpretation of the results. On ice shelves that have large strain rates and strain-rate gradients as well as large overall melt rates, such as Pine Island Ice Shelf, the basal melt rates calculated with the two methods are significantly different in both magnitude and percentage. In these cases, the length scale used to calculate strain rates may have a significant impact on the interpretation of ice shelf mass balance.
Average basal melt rates for several Antarctic ice shelves

6. STRAIN-RATE DATA PRODUCTS
6.1. Results
We present three strain-rate data products derived from the LISA mosaics (Fahnestock and others, Reference Fahnestock2016) at a spatial resolution of 750 m: longitudinal, transverse and shear strain rates. Effective and vertical strain rates may be calculated from the three strain-rate product grids. Data products are available through open ftpby contacting NSIDC or the authors.
As the data products cover a large area, we choose a longitudinal coupling length representing large-scale viscous processes. Longitudinal coupling lengths are on the order of 4–10 ice thicknesses for polar ice (Cuffey and Paterson, Reference Cuffey and Paterson2010). Because the data product includes grounded ice, ice streams with very low basal shear stresses and floating ice, an appropriate longitudinal coupling length might lie somewhere in the middle of this range. However, because most of the areas with complex strain-rate patterns are found within ice streams and ice shelves, we chose a number at the upper end of the range that would favor ice that experiences little basal resistance. The effective length scale used in the data products is adjusted locally based on ice thickness from Bedmap-2 (Fretwell and others, Reference Fretwell, Pritchard and Vaughan2012) to ~8× the ice thickness (r = 4× the ice thickness).
Figure 9 shows example strain-rate results for the Filchner Ice Shelf region, which is fed by a complex network of ice streams. In this region of low basal shear stresses, longitudinal strain rates are primarily positive, indicating ice extension along-flow. Two rifts near the ice shelf edge show particularly high rates of extension. Areas with negative longitudinal strain rates likely reflect variations in basal shear stress in grounded regions or convergence where ice streams join. Transverse strain rates show broadly the opposite sign from longitudinal strain rates; areas where this relationship does not hold, such as the region of positive longitudinal and transverse strain rates near the ice shelf edge, have large vertical strain-rate magnitudes (in this case indicating thinning). Prominent bands of high shear strain-rate magnitudes along ice stream margins illustrate the rapid change in ice velocity across these regions.
Example strain-rate products for the Filchner Ice Shelf.

6.2. Error estimates
However the error in the original velocity grids is reduced by image mosaicking and therefore not predictable based on the parameters of the code, we rely on empirical methods to estimate error and understand how it propagates through the strain-rate code. We make a rough and conservative estimate of error by using velocities in slow-moving areas of Antarctica. Table 2 shows statistics for the x- and y-velocities (u and v, respectively) in three slow-moving sample areas: Roosevelt Island on the Ross Ice Shelf, Berkner Island on the Filchner-Ronne Ice Shelf and a grounded portion of interior East Antarctica. Although these areas move very slowly, they are still flowing; t-tests show that the mean velocities in these regions are significantly different from zero. Nonetheless, we will make the assumption that the velocities here should be zero, and treat the mean as an approximate measure of the standard error in the velocities. Since we know the means are not zero, this is likely to be an overestimate of the error in the velocity measurements.
Velocity statistics for slow-moving test regions

To understand how this error propagates through the logarithmic strain-rate code, we add a random error with a Std dev. of 0.005 m day−1 (the average of the means in Table 1) to the velocity fields before calculating strain rates and repeat the procedure 100 times in a Monte Carlo simulation. Computing time prohibits the application of this procedure to all of Antarctica; therefore, we run it only on the Bindschadler/MacAyeal Ice Streams region used previously.
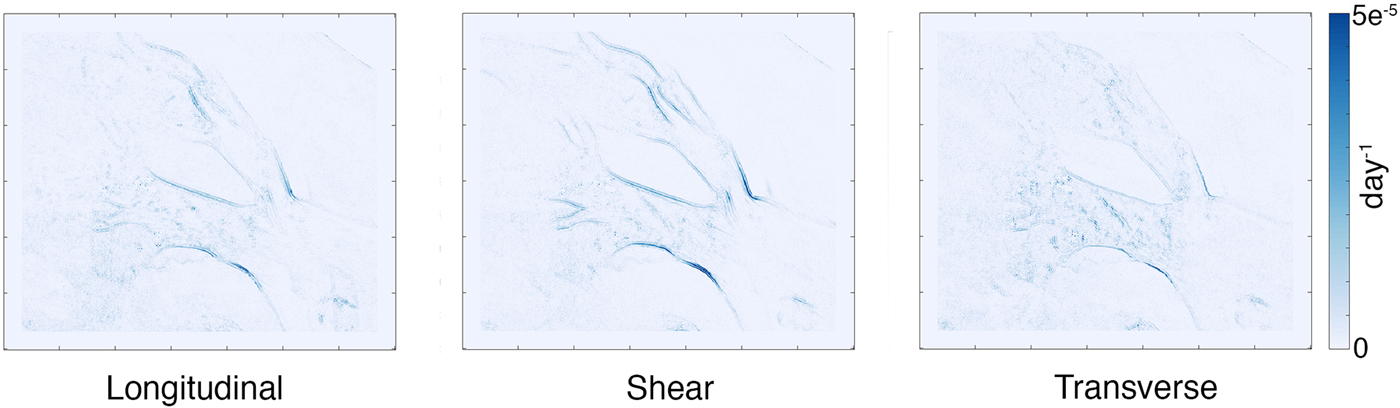
The Std dev. of the Monte Carlo simulation is a reasonable estimate of error in the strain-rate calculations due to random error in the velocity measurements. The standard deviations are largest at the shear margins and other areas with large gradients in strain. The significance of error can be most easily understood when expressed as a percentage of the measured strain-rate values; we show these percentages in Figure 10. Errors within the ice streams are comparatively small; they are generally <10% of the measured strain rates. The large-magnitude errors found at shear margins are shown to be insignificant when expressed as percentages. However, in slow-moving regions with very low strain rates, errors can be large compared with measurements. The magnitudes of these errors are typical compared with other published studies (Bindschadler and Vornberger, Reference Bindschadler and Vornberger1996).
Percent error as measured by results of the Monte Carlo simulation.

Although the percent errors are extremely high in areas with low strains, they are likely to only slightly impact quantitative calculations related to strain rates. Since the strains are small to begin with, the errors have small absolute values. It is only in areas with high strain rates that one can find, for example, significant vertical velocities. Even with errors of large percentages, vertical velocities calculated in low strain-rate areas will still be very small, yielding very little impact on the interpretation of results.
The calculated Monte Carlo simulation revealed very strong relationships between the percent error and the absolute value of the strain rates (Fig. 11). We fit a power law curve of the form percent error = a*|strain rate|b to each error relationship. The coefficients and R 2 values are shown in Table 3. The high R 2 values indicate the reliability of these power laws. We used the calculated relations to estimate percent errors across the entire Antarctic strain rate product and then used the percentages to convert to absolute error values. The resulting estimates are available through open ftp from NSIDC or by contacting the authors.
Error relations for calculated strain rates. Percent error is calculated from the Std dev. of the Monte Carlo simulations and the calculated strain-rate values. All values are calculated for the Bindschadler and MacAyeal Ice Streams region.
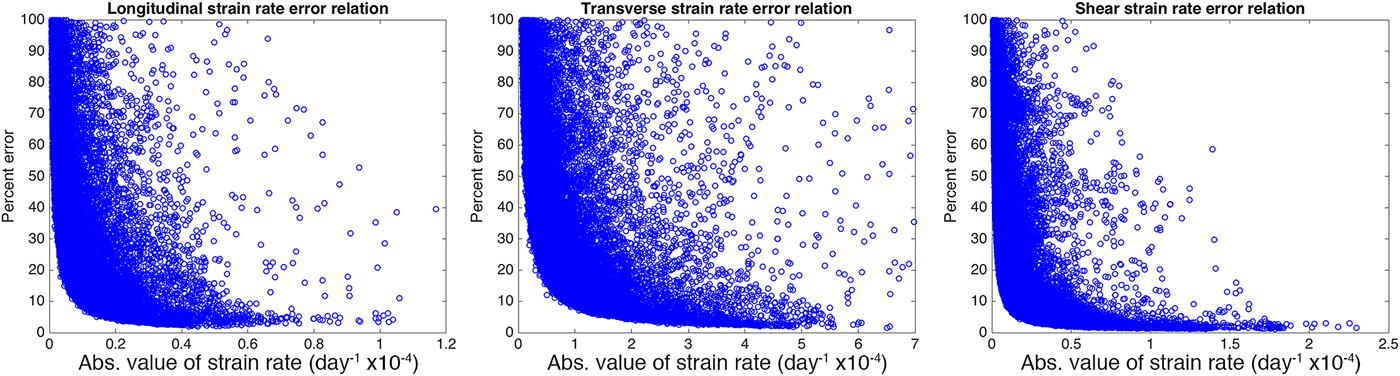
Power law coefficients for error relations

7. CONCLUSIONS
Ice surface strain rates have historically been calculated using inconsistent methods and length scales, which are often not specified in the text of a given study. Logarithmic strain-rate calculations are more reliably accurate for ice; however, significant differences between logarithmic and nominal strain-rate approaches are found only in areas with very high strain rates and strain-rate gradients, such as along shear margins. Overall, the calculation method used does not significantly impact glaciological calculations involving strain rates.
The length scale over which strain rates are calculated can have much bigger impacts on the results. As demonstrated above, mass-balance calculations of average basal melt rates on ice shelves can yield results differing by almost 60% when different length scales are used. This example demonstrates that length scales must be chosen carefully with reference to factors such as the local ice thickness and the type of process being examined; these values should also be stated explicitly within each study.
The strain-rate products presented here reflect large-scale viscous processes, calculated with a length scale of ~8× the local ice thickness. In the past, large-scale strain-rate datasets have been frequently derived from models (e.g., Kulessa and others, Reference Kulessa, Jansen, Luckman, King and Sammonds2014). The continent-wide datasets presented here are derived from observations, and therefore reliably reflect real processes that affect grounded and floating ice in Antarctica. These datasets may be used directly in future studies, for example, to examine dynamically complex ice flow, to identify areas of thinning and thickening, or to estimate the stress states of ice streams and ice shelves. They may also be incorporated into large-scale models in order to increase the accuracy and reliability of current assessments and future projections of Antarctic ice flow.
SUPPLEMENTARY MATERIAL
The supplementary material for this article can be found at https://doi.org/10.1017/jog.2018.23
ACKNOWLEDGEMENTS
This study was supported by NASA through a NASA Earth Science Student Fellowship (NNX14AK82H), NASA Cryosphere grant NNX16AJ88G and by USGS contract G12PC00066. We thank W. H. Armstrong and D. R. MacAyeal for help in the development of the strain-rate algorithm, and D. R. MacAyeal for comments on this manuscript.
AUTHOR CONTRIBUTION STATEMENT
K. E. Alley led the algorithm development and writing of this manuscript. T. A. Scambos and T. Haran developed the velocity grids used in calculations. R. S. Anderson, H. Rajaram, and A. Pope assisted in algorithm development. All authors contributed to the editing of this manuscript.


 Open access