


Introduction
In recent years, climate policy has become increasingly ambitious across all major economies, including the European Union (EU). At the same time, the character of climate policy is changing. Green industrial policy (GIP) is emerging as a central pillar alongside the longstanding emphasis on carbon pricing and stringent regulatory measures like standards and bans. Green industrial policies focus on nurturing and protecting domestic low-carbon technology industries like renewable energy and electric vehicles through R&D support, deployment subsidies, trade protection, and more (Lewis Reference Lewis2021). Simply put, GIP promises to upend the dynamics of climate politics by replacing ‘sticks’ with ‘carrots’ (Allan et al. Reference Allan, Lewis and Oatley2021; Meckling Reference Meckling2021). Such climate policy strategies have taken centre stage in all major economies, including in the EU, where a raft of policies aimed at supporting domestic low-carbon industries have been enacted or proposed in recent years (Oberthür and von Homeyer Reference Oberthür and von Homeyer2023).
This policy shift is driven by political economy considerations. Climate policy instruments like carbon pricing, fossil fuel subsidy reform, and emissions and efficiency standards that have traditionally dominated policy debates in the EU and beyond continue to meet vehement corporate opposition, enjoy limited popularity among citizens (Beiser-McGrath and Busemeyer Reference Beiser-McGrath and Busemeyer2024), and even spark disruptive protests because they impose costs visibly and directly (Breetz et al. Reference Breetz, Mildenberger and Stokes2018). This fraught political economy has resulted in highly uneven and reversible policy adoption and unclear success in reducing emissions (Bayer and Aklin Reference Bayer and Aklin2020; Green Reference Green2021; Meckling et al. Reference Meckling, Kelsey, Biber and Zysman2015).
The shift towards GIP is premised on two complementary effects on corporate lobbying. Supportive policies targeting low-carbon technologies are expected both to reduce incumbent mobilisation against ambitious climate policy (Stokes and Mildenberger Reference Stokes and Mildenberger2020) and to boost support from low-carbon industries that benefit from such policies and will subsequently lobby more broadly for stringent climate regulations (Meckling et al. Reference Meckling, Kelsey, Biber and Zysman2015; Reference Meckling, Sterner and Wagner2017).
Yet our knowledge of the veracity of this proposition remains limited. Firstly, the few studies of GIP resistance from fossil fuel-reliant incumbent sectors reach mixed conclusions (Culhane et al. Reference Culhane, Hall and Timmons Roberts2021; Stokes Reference Stokes2020). Secondly, work on renewable energy industry lobbying focuses on policies that narrowly and directly benefit these firms (Gullberg Reference Gullberg2013; Trachtman Reference Trachtman2023).
On the one hand, it seems plausible that firms will generally mobilise more strongly when proposed policies target them more directly. On the other hand, the energy transition unavoidably creates ‘interest group politics’ (Wilson Reference Wilson1980, 385) because of concentrated corporate costs and benefits among, respectively, high-carbon incumbent sectors existentially threatened by decarbonisation and emerging low-carbon sectors reaping the rewards of this transition (Colgan et al. Reference Colgan, Green and Hale2021; Paterson Reference Paterson2021). The central unanswered question is whether and how climate policy strategies can shift the balance of interest group mobilisation among expected winners and losers simply by using different policy instruments. In this paper, I advance our understanding of this question theoretically and empirically.
Drawing on theories of interest groups and stakeholder consultations, I argue that different policy strategies can (de)mobilise winners and losers through regulatory targeting. Sectors directly targeted (indirectly affected) by a proposed policy are more (less) likely to mobilise and lobby because regulatory impacts are more immediate and more certain (temporally distant and uncertain) and because they possess (lack) technical, sector-specific knowledge that policymakers need. These two mechanisms make direct targets more motivated to engage in and more effective at lobbying, resulting in a higher propensity to mobilise. Compared with traditional climate policies, green industrial policies should therefore increase lobbying among low-carbon sectors that benefit directly and demobilise high-carbon sectors that lose out indirectly.
To test this proposition empirically, I study the European Commission (EC) climate and energy policy consultation regime in the post-Paris Agreement era (2017–2022). During this time, the EC has proposed numerous green industrial policies pertaining to, inter alia, the financing and permitting of renewable energy projects, the Innovation Fund, and a novel hydrogen strategy, but it has also maintained a strong focus on traditional cost-imposing climate policies such as the Emissions Trading System (ETS), vehicle emissions standards, and energy efficiency requirements. I collect a novel and uniquely comprehensive data set of the entire population of corporate submissions to all climate- and energy-related open online consultations (OOCs), supplemented with all memberships of relevant expert groups. I manually code 1,551 unique corporate stakeholders into sectors and 142 policy consultations into climate policy types. This yields a dyadic data set of 220,242 stakeholder-consultation pairs that I use to investigate how climate policy types affect sectoral propensities to lobby.
Results align with my theoretical expectations. Corporate stakeholders are more likely to mobilise and provide more technical information when they are directly targeted. Green industrial policies increase mobilisation from low-carbon sectors but depress high-carbon sector mobilisation compared to traditional cost-imposing climate policies.
This paper makes a substantial contribution to our understanding of the political economy of climate politics by providing the most systematic evidence to date that different climate policy strategies can indeed change the mobilisation propensity of likely winners and losers and by theorising and testing the mechanisms underpinning this effect.
These findings also have general relevance to public policy research. My results quantitatively document a case of policies determining politics (Lowi Reference Lowi1972; Pierson Reference Pierson1993; Schattschneider Reference Schattschneider1935). I show that a policy strategy that supports emerging sectors instead of penalising incumbents can tilt corporate mobilisation towards likely policy proponents, even in the context of well-organised incumbent sectors with strong material interests. This finding could apply to other policy areas characterised by substitutable policy strategies and conflicting corporate interests, such as agriculture, trade, and competition.
Through this investigation of climate policy mobilisation, I also contribute to our general understanding of interest groups and stakeholder consultations. Firstly, I expand the recent finding that the degree of interest group policy affectedness matters for mobilisation (Junk et al. Reference Junk, Crepaz, Hanegraaff, Berkhout and Aizenberg2022) to include the kind of affectedness, ie whether it is direct or indirect. Secondly, I demonstrate the value of understanding informational advantages in lobbying not as fixed and stemming from inherent interest group characteristics, but as context-dependent and emerging in relation to specific policy proposals. Finally, my findings underscore that the determinants of interest group bias and diversity cannot be assessed comprehensively without considering issue-specific cleavages among corporate actors.
In the remainder of the paper, I review our knowledge of corporate climate lobbying (Section 2), present my theoretical argument (Section 3), explain my data collection, coding procedure, and analytical strategy (Section 4), describe my descriptive and inferential results (Section 5), and conclude by summarising and reflecting on the limitations and implications of my findings (Section 6).
Corporate lobbying on climate policy
There is widespread agreement that corporate lobbying plays a decisive role in climate politics (eg Markussen and Svendsen Reference Markussen and Tinggaard Svendsen2005; Meng and Rode Reference Meng and Rode2019; Michaelowa Reference Michaelowa1998; Skodvin et al. Reference Skodvin, Gullberg and Aakre2010). The simplest and most intuitive understanding of this dynamic is as a contest between a ‘brown’ camp working against and a ‘green’ camp supporting ambitious climate policy (Böhler et al. Reference Böhler, Hanegraaff and Schulze2022). An extensive literature on anti-climate lobbying by fossil fuel and manufacturing industries, and their allies, documents their significant obstructionist influence (eg Brulle Reference Brulle2018; Brulle and Downie Reference Brulle and Downie2022; Cory et al. Reference Cory, Lerner and Osgood2021; Downie Reference Downie2018).
However, despite growing scholarly attention to the increasing diversity of climate ‘policy mixes’ used to combat climate change in the EU and elsewhere (Oberthür and von Homeyer Reference Oberthür and von Homeyer2023; Skjærseth Reference Skjærseth2021) and to the global rise of ‘green industrial policy’ (Allan et al. Reference Allan, Lewis and Oatley2021; Rodrik Reference Rodrik2014), very few studies systematically study corporate climate lobbying across types of climate policy. This gap is particularly significant because the turn to GIP is motivated in no small part with reference to its effects on corporate lobbying. Proponents argue that, compared to traditional climate policies like carbon pricing and emissions standards, green industrial policies have two effects on corporate mobilisation. They reduce resistance from incumbent fossil fuel-reliant firms, who feel less threatened by such policies. Moreover, they expand domestic low-carbon sectors that are key allies in defending green industrial polices and pushing for more restrictive climate policies to be introduced and ratcheted up (Aklin and Urpelainen Reference Aklin and Urpelainen2013; Breetz et al. Reference Breetz, Mildenberger and Stokes2018; Linsenmeier et al. Reference Linsenmeier, Mohommad and Schwerhoff2022; Meckling et al. Reference Meckling, Kelsey, Biber and Zysman2015; Meckling and Nahm Reference Meckling and Nahm2022; Srivastav and Rafaty Reference Srivastav and Rafaty2023).
The limited empirical evidence we do have on these propositions is mixed. Stokes (Reference Stokes2020) finds that a ‘fog of enactment’ led fossil-reliant utilities in the United States to ignore initial renewable energy support measures, but that their awareness and opposition increased over time. Culhane, Hall, and Roberts’ detailed examination of climate policy lobbying in Massachusetts indicates that each high-carbon sector mobilises on certain issues but remains disengaged from others (Culhane et al. Reference Culhane, Hall and Timmons Roberts2021). Studies of renewable energy industry lobbying have focused almost exclusively on their mobilisation for supportive policies that aid them directly, such as the EU’s 20 per cent renewable energy target (Gullberg Reference Gullberg2013) and the Renewable Energy Directive (Ydersbond Reference Ydersbond2014; see also Downie Reference Downie2019; Trachtman Reference Trachtman2023). While important, this work leaves unaddressed the question of wider climate policy lobbying by emerging low-carbon sectors.
In sum, the climate politics literature has provided interesting propositions but lacks (i) more systematic empirical evidence of patterns of corporate lobbying across climate policy types and (ii) a clear theory of how and why different policy strategies shape lobby propensities among different corporate sectors. The aim of this paper is to fill these gaps by engaging with insights from extant work on interest groups and lobbying.
A theory of policy strategies, regulatory targeting, and sectoral mobilisation
In this section, I develop the theoretical argument that policy strategies affect the propensity of individual corporate interests to mobilise (and therefore shape the overall balance of sectoral corporate lobbying) through regulatory targeting.
I understand policy strategies as policymakers’ choice of which policy instruments to utilise in pursuit of overarching policy goals, in particular whether they penalise incumbent technologies or support new ones (see also Breetz, Mildenberger, and Stokes Reference Breetz, Mildenberger and Stokes2018). The defining characteristic of each policy strategy is therefore its regulatory targeting, ie what subset of corporate sectors in a policy field it directly targets and what sectors it indirectly affects by changing their relative competitiveness. In policy areas characterised by concentrated and conflicting corporate interests – what Wilson (Reference Wilson1980, 385) termed ‘interest group politics’ – the choice of policy strategy is fundamentally about whom to target. Policies inescapably create winners and losers, but either group may be directly targeted or indirectly affected by a given policy. Directly targeted sectors are those whose operations fall within the scope of a proposed policy. These firms may be affected by having to pay new fees, produce new documentation, or meet new standards, by becoming eligible for new subsidies, or by the removal of existing regulatory obligations or levies, etc. Indirectly affected sectors are those that will feel a financial impact from a policy because of their competitive relation to the regulated entities or through their supply chain connection to them (as in Cory et al. Reference Cory, Lerner and Osgood2021).Footnote 1
To understand how the ability of policy strategies to shift regulatory targeting affects corporate mobilisation, we must first recognise that all interest groups are resource-constrained and have to prioritise what issues they lobby on (Fraussen et al. Reference Fraussen, Halpin and Nownes2021) and that policy characteristics shape these priorities by affecting the ability and motivation of different groups to lobby (Røed and Hansen Reference Røed and Hansen2018). Policy strategies matter exactly because regulatory targeting shapes what sectors have the clearest motivation to mobilise and the best ability to do so effectively. My core argument is this: Compared to indirectly affected actors, the directly targeted (i) experience comparatively more immediate and certain regulatory impacts, creating a clearer motivation for lobbying, and (ii) enjoy an informational advantage in providing sector-specific technical knowledge to regulators, which reduces the cost of lobbying effectively. Through these mechanisms, regulatory targeting tilts mobilisation towards the directly targeted. The following subsections unpack these mechanisms in greater detail.
The certainty and immediacy of regulatory impacts
When firms and business associations decide whether to mobilise and lobby on a proposed policy, they cannot know exactly how that policy is going to affect them because it has yet to be enacted and implemented. It is generally true that prospective regulatory impacts are always inherently uncertain from the point of view of corporations (Woll Reference Woll2008), and the certainty of regulatory impacts plausibly varies across instrument types (the costs of a tax are more certain than the benefits of a new fund to which one can apply). My distinct proposition is that regulatory targeting introduces significant variation in the sectoral distribution of the certainty and salience of these impacts.
For a directly targeted entity, an assessment of regulatory impacts depends on knowledge of its own production processes, product range, and innovative capacity and an understanding of its competitive position vis-à-vis its peers (Falkner Reference Falkner2008; Kennard Reference Kennard2020; Kim et al. Reference Kim, Urpelainen and Yang2016). These factors determine the costs or benefits that a firm can expect to incur or accrue. An indirectly affected entity must make a much more complex assessment. To understand the likely regulatory impact on its own profitability, it must assess (i) the direct regulatory impacts on the regulatory targets for a sector it does not itself operate in, as well as (ii) its own operations and competitive position, and (iii) the nature of the resulting spill-overs, which depend on eg substitutability, the cross price elasticity of demand, and the actions of other sectors that also experience spill-over effects from the same policy proposal. This is clearly a more difficult task.
For these same reasons, we can expect the regulatory impact on the indirectly affected to be not just more uncertain but also more temporally distant. Directly targeted firms and sectors can generally expect regulatory impacts to occur immediately or over known time horizons as legislation is enacted, implemented, and phased in. In contrast, the economic impact on those sectors that are only indirectly affected by a proposed policy depends on supply chain linkages and competitive spill-over effects, which take time to materialise.
This combination of temporally distant and uncertain expected regulatory impacts resembles Stokes’ (2020, 47–57) concept of the ‘fog of enactment’. Stokes uses this notion to capture the ambiguity that exists ahead of regulatory implementation and shows how the unclear effects of early renewable energy support policies led fossil-reliant electric utilities in the United States to underestimate the threat posed by these measures and to refrain from sustained countermobilisation. In the context of this paper, I expect that corporate stakeholders are more motivated to lobby when directly targeted by a policy strategy because they face more certain and immediate regulatory impacts. Corporate stakeholders have weaker perceived incentives to lobby when indirectly affected by a policy strategy because of more uncertain and temporally distant regulatory impacts.
Informational advantages
The second mechanism through which policy strategies can tilt lobbying in favour of directly targeted sectors concerns the ability of corporate actors to supply the information demanded by regulators in specific legislative processes.
Information is a central aspect of regulatory lobbying (Austen-Smith Reference Austen-Smith1993; Bouwen Reference Bouwen2002; Hall and Deardorff Reference Hall and Deardorff2006). Interest groups often possess or procure unique knowledge relating to a policy proposal that they can supply to regulators in exchange for influence (De Bruycker and Colli Reference De Bruycker and Colli2023, 515; Klüver et al. Reference Klüver, Mahoney and Opper2015). But individual interest groups are not equally able to supply relevant information (Albareda, Braun, et al. Reference Albareda, Braun and Fraussen2023; Albareda and Braun Reference Albareda and Braun2019; Chalmers Reference Chalmers2014; Reference Chalmers2017; Flöthe Reference Flöthe2019; Klüver Reference Klüver2012). Whereas advantages in informational lobbying capacities are typically understood to be a function of traits inherent to each interest group, such as their ‘resource endowment and organisational structures’ (Klüver Reference Klüver2012, 491; see also Albareda and Braun Reference Albareda and Braun2019; Flöthe Reference Flöthe2019; Yackee and Yackee Reference Yackee and Yackee2006), I argue that the ability of corporate stakeholders to provide sought-after information, specifically of a technical kind, is contingent on sectoral targeting and hence on policy strategies. As Junk and colleagues reason, regulators ‘weigh the potential contribution of different organizations for the case at hand’ and this increases the usefulness of inputs from ‘heavily affected’ interest groups in that specific situation (Junk et al. Reference Junk, Crepaz, Hanegraaff, Berkhout and Aizenberg2022, 1379 emphasis added). In other words, informational advantages arise when a corporate actor possesses sector-specific technical knowledge and regulators pursue their policy goals through interventions targeting these specific sectors and technologies.
The credible transmission of technical knowledge requires an intimate understanding of sectoral features such as production processes, realised and forthcoming product innovations, market structure, cost curves, and so forth. It is not impossible for sectoral outsiders to acquire this kind of information, but direct regulatory targets have a natural informational advantage in this regard. As De Bruycker notes, ‘a business association has, because of its economic activities, inside information on a particular economic sector’ (De Bruycker Reference De Bruycker2016, 602). This kind of ‘technological power’ gives targeted stakeholders privileged access to policymakers and ‘the edge over other actors in shaping the regulatory discourse’ (Falkner Reference Falkner, David and Newell2005, 129). Hence, when a policy proposal targets a competing sector in ways that affect this business association indirectly, its narrow informational advantage loses (much of) its significance, forcing it to rely on more general argumentation. Through this mechanism, the real and perceived cost of effective mobilisation decreases for corporate actors targeted by proposed regulations relative to other corporate actors with strong but indirect material interests in that regulatory proposal. Consequently, mobilisation propensities rise for a corporate actor from a given sector when that sector is directly targeted.
Observable implications
In summary, I expect that policy strategies can affect the balance of mobilisation between competing corporate interests because regulatory targeting creates one set of sectors, the directly targeted, with superior knowledge and clearer incentives to lobby, and another set of sectors, the indirectly affected, whose informational capacity is less relevant and whose motivation to lobby is weaker. Two primary observable implications follow from this theoretical argument. The first concerns the underlying theoretical dynamics of regulatory targeting. It should apply generally across issue areas and in any polity characterised by intersectoral business conflict and substitutable policy strategies. Specifically, if the underlying theoretical logic of regulatory targeting holds, then we should observe that:
Targeted mobilisation hypothesis: Corporate stakeholders that are directly targeted by a policy proposal are more likely to mobilise and lobby compared to indirectly affected stakeholders.
Since the immediate aim of this paper is to investigate the effect of climate policy strategies on corporate climate lobbying, I derive a second observable implication concerning the relation between substantive climate policy types and lobbying by high- and low-carbon corporate sectors. Climate policies inescapably create winners and losers (Colgan et al. Reference Colgan, Green and Hale2021; De Bruycker and Colli Reference De Bruycker and Colli2023, 522–23). But, because this policy area is also characterised by the availability of alternative policy strategies that differ in terms of regulatory targeting (Genovese et al. Reference Genovese, Kern and Martin2017; Meckling Reference Meckling2021), the nature of these costs and benefits is not given. Green industrial policies directly benefit low-carbon interests and threaten high-carbon incumbents indirectly (Stokes Reference Stokes2020). Traditional regulatory or tax-based climate policies, which I term fossil fuel phaseout policies, threaten high-carbon interests directly and visibly and provide more indirect benefits to their low-carbon challengers.
To illustrate, consider carbon pricing policies such as the EU ETS. Directly affected actors are those that fall under the scope of the regulation, typically electric utilities and large manufacturing firms in select sectors. They incur a direct and well-defined cost by having to pay taxes or purchase emissions permits. However, other corporate actors are indirectly affected. Renewable energy manufacturers and project developers, wind- and solar-reliant independent power producers, and manufacturers of other low-carbon technologies all compete to replace incumbent fossil fuel technologies in these sectors and therefore gain a price-competitive advantage. In contrast, green industrial policies that drive down the cost or support the uptake of low-carbon technologies directly benefit these sectors but also threaten incumbent fossil fuel-reliant actors indirectly through increased competition. The existence of winners and losers is an unavoidable feature of decarbonisation policy, but policy strategies determine the nature of these costs and benefits.
The logic of regulatory targeting can therefore be applied to climate politics. Green industrial policies should generate a relative increase in lobbying by corporate stakeholders from renewable energy and other low-carbon sectors. Fossil fuel phaseout policies should generate a relative increase in lobbying by corporate stakeholders from the incumbent fossil fuel production, industrial, and transport sectors. Since these implications concern the relative mobilisation of stakeholders from each sector across policy strategies, I merge them into one overarching hypothesis:
Climate policy strategy hypothesis: Compared to fossil fuel phaseout policy proposals, green industrial policy proposals are associated with a relatively higher mobilisation of low-carbon stakeholders compared to high-carbon stakeholders.
This hypothesis is formulated as a simultaneous comparison across policies and sectors because comparisons of absolute sectoral mobilisation propensities separately for each policy strategy could be misleading given systematic differences between high- and low-carbon stakeholders (eg, their lobbying resources). In addition, I expect mixed policy packages (MPPs), which combine elements of both policy strategies, to strongly mobilise high- and low-carbon stakeholders.
The climate policy strategy hypothesis sets up a more indirect test of the underlying theoretical logic because these policy and sectoral categories do not always perfectly map onto regulatory targeting. Still, it is the primary focus of the empirical analysis because of its more direct relevance to the literature on climate policy strategies and corporate climate lobbying.
Research design
To investigate the ability of climate policy strategies to affect mobilisation propensities across sectors, I analyse the activity of corporate stakeholders in European Union climate policymaking using a novel data set of all corporate submissions to every open online consultation (OOC) organised by the EC in relation to its climate and energy policy proposals between 2017 and 2022. In this section, I first reflect on the choice of the EC as my case, then describe my data collection and coding procedure in detail, before finally laying out my analytical strategy.
The case of European Commission climate and energy consultations
The EC is a suitable case for this study for substantive, practical, and theoretical reasons. Substantively, the EU is an important factor in the global fight to mitigate climate change, both in terms of its share of global emissions and its leadership position. The EC plays a central role in this regard because of its right of initiative, which is especially relevant in relation to corporate lobbying, since early lobbying is more consequential (Crepaz et al. Reference Crepaz, Hanegraaff and Marie Junk2023).
Practically, the EC allows me to test my core propositions because (i) its transparent stakeholder engagement enables large-scale data collection across lobbying channels (Binderkrantz et al. Reference Binderkrantz, Blom-Hansen and Senninger2021), (ii) its use of a diverse mix of climate and energy policy approaches provides variation on my main explanatory variable (Oberthür and von Homeyer Reference Oberthür and von Homeyer2023; Skjærseth Reference Skjærseth2021), and (iii) the existence of regions in the EU with diverse stakes in decarbonisation – industrial heartlands, fossil fuel-rich regions, low-carbon technology frontrunners, and automobile manufacturing hubs – ensures sufficient (potential) representation of all relevant sectors.
Theoretically, the EC is a most-likely case for observing informational lobbying since it is a relatively bureaucratic executive governmental branch which is commonly viewed as oriented towards output legitimacy (Albareda, Saz-Carranza, et al. Reference Albareda, Saz-Carranza, Acoleyen and Coen2023; De Bruycker Reference De Bruycker2016). At the same time, EU climate politics since 2017 is a most-likely case for observing broad and encompassing lobbying (ie no differences across policy types). This is because it is one of the polities furthest along the ‘climate policy sequence’ (Leipprand et al. Reference Leipprand, Flachsland and Pahle2020). It has, in other words, already developed strong low-carbon industries and a high awareness of the disruptive potential of GIP. A focus on this recent time period does mean, however, that this analysis cannot trace the long-term dynamics of policy feedback from GIP to low-carbon industry growth and mobilisation. Instead, this study provides a valuable snapshot of the short-term ability of climate policies to determine climate politics.
Data collection and coding
To measure corporate mobilisation in EU climate and energy policy, I collect a novel data set consisting of all corporate responses to OOCs organised by the EC from 2017 to 2022 in relation to relevant policy proposals. OOCs in the EU and elsewhere have been the focus of a large body of literature because they allow researchers to transparently observe a form of unrestricted lobbying (eg Chalmers Reference Chalmers2017; Klüver et al. Reference Klüver, Mahoney and Opper2015; Pagliari and Young Reference Pagliari and Young2020; Yackee and Yackee Reference Yackee and Yackee2006). Submissions to these consultations are equivalent to the mobilisation stage of lobbying (Binderkrantz et al. Reference Binderkrantz, Blom-Hansen, Baekgaard and Serritzlew2022). Compared to other measures of lobbying, OOCs have the advantages of (i) unambiguously identifying exactly what policies stakeholders lobby, (ii) capturing stakeholder decisions to lobby free of any regulator gatekeeping, and (iii) providing a more inclusive view of lobbying because of the low effort required to mobilise. The main concern with this indicator is its shallowness and potential incompleteness (Binderkrantz et al. Reference Binderkrantz, Blom-Hansen, Baekgaard and Serritzlew2022; Joosen Reference Joosen2020). To alleviate this, I conduct a supplementary analysis of EC expert group memberships, which are considered highly influential but offer a more limited and exclusive perspective (see online Appendix E). Expert group memberships are granted by the EC and therefore represent the conceptually distinct access stage of lobbying (Binderkrantz, Blom-Hansen, and Senninger Reference Binderkrantz, Blom-Hansen and Senninger2021). This analysis is thus also an opportunity to ascertain whether regulators counteract any biases observed at the mobilisation stage.
Forthcoming consultations are announced on EC webpages in advance and typically last a month. I use web-scraping tools to collect the entire population of consultation responses that were submitted to consultations available on the EC’s ‘Have Your Say’ webpage, categorised under either the ‘climate action’ or ‘energy’ topic (n = 14,746). The raw data cover the years 2017 to 2022 and include 172 consultations across 143 policies. Policy proposals that are unrelated to decarbonisation policy, receive no corporate responses, or are duplicates are omitted. A list of the 114 included policies (corresponding to 142 consultations) is available in the online Appendix A.
Restricting the data to submissions from stakeholders that self-declare as either a ‘corporation’ or ‘business association’ leaves 6,134 submissions after accounting for joint submissions. After extensive data cleaning, 1,682 unique stakeholders are identified among 2,731 different stakeholder names. This represents the total population of active corporate stakeholders.
To investigate the sectoral patterns of corporate climate lobbying and test the climate policy strategy hypothesis, I then manually code both the sectoral affiliation of every stakeholder and the policy strategy represented by each policy proposal. This is necessary because neither of these two core aspects of my theoretical framework can be extracted from the raw data. Since I conceptualise corporate interests vis-à-vis climate and energy policy at the sectoral level in line with much existing work (eg Cory et al. Reference Cory, Lerner and Osgood2021; Genovese and Tvinnereim Reference Genovese and Tvinnereim2019), I devise a coding scheme for classifying all stakeholders into sectoral categories that are substantively meaningful in relation to climate policy.Footnote 2 I code all corporate actors into 75 subsector categories and eight sector categories: industry (ie manufacturing and construction), fossil fuel supply, transport, electric utilities, renewable energy technologies, other low-carbon technologies (such as hydrogen and heat pumps), agriculture, and other. This coding procedure relied on a coding manual developed specifically for this task (full codebook in Appendix H), and decisions were based on information from corporate websites, EU Transparency Register (EUTR) entries, consultation submission texts, and other online sources. After omitting the two residual sectoral categories of ‘not classified’ and ‘no data’, I am left with 1,551 coded stakeholders.
Finally, these codes are used to construct a Camp variable that distinguishes a ‘High-carbon camp’ from a ‘Low-carbon camp’ as well as a residual ‘Others’ category (for details, see Appendix Tables A3 and A4). This distinction is made at the sectoral level, except that the utilities sector is divided based on subsector codes into a high-carbon and a low-carbon segment in accordance with existing work on this sector (Kelsey and Meckling Reference Kelsey and Meckling2018; Kennard Reference Kennard2020; Kim et al. Reference Kim, Urpelainen and Yang2016). The high-carbon camp consists of all industry, fossil fuel supply, and transport stakeholders, as well as fossil fuel-reliant utilities. The low-carbon camp includes all renewable energy and other low-carbon technology stakeholders as well as low-carbon utilities (those relying predominantly on renewable energy or operating electricity networks).
I employ two validation approaches, one using sector codes from the Orbis corporate database and another recoding 100 randomly chosen stakeholders after 16 months, to ensure that the manual coding achieved satisfactory levels of reliability (for details, see Appendix G). Panel A in Figure 1 illustrates the distribution of sectoral and camp affiliations. Industry is the dominant sector by a wide margin, with a relatively even distribution among most other sectors. Although my focus is not on policy positions, it is reassuring that a recent study, which manually coded stakeholder support and opposition to a sample of EU climate policies, found that these positions ‘almost perfectly overlap’ with the sectoral distinctions I make here (De Bruycker and Colli Reference De Bruycker and Colli2023, 522).
Distribution of manually coded sectors, camps, and policy types in the open online consultations data. Note: Ecodesign and energy labelling policies are highlighted here because they are excluded in some robustness checks.

To classify all policy proposals according to the policy strategy they represent, I code them into three overall types: GIP, fossil fuel phaseout policy (FFP), and MPPs. In distinguishing these policy types, I draw on a large literature distinguishing ‘industrial’ or ‘supportive’ from ‘environmental’ or ‘restrictive’ climate policy types (Green and Denniss Reference Green and Denniss2018; Hughes and Urpelainen Reference Hughes and Urpelainen2015; Meckling Reference Meckling2021). The coding decision is based on whether a proposed policy will directly incentivise low-emissions technologies, disincentivise high-emissions technologies, or a combination of both. Incentives need not be economic but also include regulatory measures and monitoring mechanisms. Policies that aim to set overall targets for the share of some low-carbon technology are also coded as MPPs because they create concurrent low-carbon incentives and high-carbon disincentives. Importantly, these categories are independent of and distinct from the policy type (economic, regulatory, informational, etc.) and the type of EU legal instrument (directive, regulation, etc.). While it is clearly not the case that EC officials make a discrete, strategic decision to assign a policy type to each proposal, the use by EU policymakers of all three policy types in pursuit of their climate policy objectives neatly represents the theoretical distinction between the contrasting policy strategies of green industrial versus fossil fuel phaseout policies.
These coding decisions follow the coding manual enclosed in Appendix H and are based on information published by the EC in relation to the consultations (such as calls for evidence, inception impact assessments, roadmaps, draft acts, and final impact assessment reports), supplemented, where necessary, with information from official EU websites, news media, or stakeholders.
As Panel B in Figure 1 shows, a clear majority of consultations concern fossil fuel phaseout policies (even if a group of minor energy labelling and ecodesign regulations are omitted), with 25 green industrial policies and even fewer MPPs. However, the two latter policy types attract a higher number of consultation responses on average.
In addition, to test the underlying targeted mobilisation hypothesis, I develop a more direct and granular indicator of which sectors and/or subsectors are targeted by a policy. This is based on a two-step coding process of (i) inductively identifying direct regulatory targets as mentioned in the policy proposal and (ii) matching these inductive codes to the 75 subsectoral categories into which corporate stakeholders are classified. These matches are imperfect and inflate the number of direct targets in some instances, particularly where the policy targeting is so specific that no subsector category exists to match it (for example, a policy targeting TV monitors is assigned the subsector category ‘Industry: other’). Overestimating the number of direct targets should produce a bias against finding an effect and, therefore, increase confidence in a positive result. Still, in most cases, the inductive codes match one or more subsectors well. The resulting binary indicator of whether a stakeholder is Directly targeted (1) or indirectly affected (0) has a mean of just 0.12 and is substantially different from the categorical Camp variable used to test the climate policy strategy hypothesis.
Finally, I collect data for and code a range of potential confounders at the stakeholder, consultation, policy, and dyad levels. These are factors that may correlate with the two key explanatory variables and that have previously been identified as key predictors of mobilisation and access in similar contexts (Chalmers, Reference Chalmers2014; Van Ballaert, Reference Van Ballaert2017). Most control variables are obtained directly from the OOC data. These are the number of Prior responses from a given stakeholder, Consultation stage (early or late), Corporate mobilisation (log number of submissions by corporate actors, a measure of overall salience), and Stakeholder type (corporation or business association). In addition, I manually code the Instrument type (economic, regulatory, procedural/informational, or mixed/strategy) of each policy proposal and the Geographical reach of each stakeholder (grouped into sub-European or European/global). For a subset of actors that list an EUTR identification number in at least one of their submissions or can be matched to the EUTR by name, I obtain data on Lobby staff (measured as staff in full-time equivalents, FTE).
Analytical strategy
For the main statistical analysis, this data is set up dyadically so that each stakeholder-consultation dyad represents the decision by a specific stakeholder (i) to lobby (1) or not (0) by submitting a response to a specific consultation (j). With a total of 5,421 consultation responses in the final dyadic dataset of 220,242 observations (1,551 stakeholders × 142 consultations), the mean value of the main outcome variable, Mobilisation, is 0.0246, which implies a 2.46 per cent baseline mobilisation probability.Footnote 3
To model the ability of policy strategies to affect lobbying propensities across sectors and test the climate policy strategy hypothesis, I use the two manually coded nominal categorical measures, Camp and Policy type, as explanatory variables. Camp categorises all stakeholders into a low-carbon camp and a high-carbon camp (plus a residual ‘Others’ category), and Policy type classifies each policy as a GIP, FFP, or a MPP. By interacting these two explanatory variables, an estimate of the mobilisation propensity of each camp separately across the three policy types is obtained. The resulting statistical model can be represented in a stylised fashion as in Equation 1:
 $$logit\left( {{\rm{Pr}}\left( {{\rm{Mobilisatio}}{{\rm{n}}_{i,j}}{\rm{\;}} = {\rm{\;}}1} \right)} \right) = {\rm{Cam}}{{\rm{p}}_i} + {\rm{Policy\;typ}}{{\rm{e}}_j} + {\rm{Cam}}{{\rm{p}}_i} \times {\rm{Policy\;typ}}{{\rm{e}}_j} + {\varepsilon _{i,j}}\;$$
In the main specifications, I include the control variables described above. Additional control variables are included in robustness checks as described in the results section. Full summary statistics are presented in Appendix Table B1. I cluster standard errors by stakeholder and consultation. Even though the outcome, Mobilisation, is rare in percentage terms, its occurrence is so common in absolute terms that bias should be minimal (King and Zeng Reference King and Zeng2001).
The primary underlying causal mechanism is tested through the targeted mobilisation hypothesis. Its veracity is tested using the same data structure but replacing the Camp and Policy type variables and their interaction with a simple binary indicator, Directly targeted, distinguishing whether a given stakeholder (i) is directly targeted (1) or indirectly affected (0) by a given policy proposal (j). Equation 2 summarises this empirical strategy:
 $$logit\left( {{\rm{Pr}}\left( {{\rm{Mobilisatio}}{{\rm{n}}_{i,j}}{\rm{\;}} = {\rm{\;}}1} \right)} \right){\rm{\;}} = {\rm{\;Directly\;targete}}{{\rm{d}}_{i,j}} + {\varepsilon _{i,j}}$$
This statistical analysis also includes the control variables described above. Together with the additional analyses of expert group memberships and of information provision presented in Appendices D and E and summarised below, these empirical strategies provide a comprehensive test of my theoretical argument and the core hypotheses derived from it.
Findings
In this section, I present the results of my analyses. I first document that, observationally and inferentially, sectoral lobby mobilisation varies systematically across policy types in line with my expectations. I then show that this is driven by the direct targeting of specific sectors. Finally, I describe additional analyses that extend the findings to expert group access and provide evidence that stakeholders supply more technical information to regulators when they are directly targeted.
Descriptive patterns of sectoral mobilisation
As a first step in the analysis, I investigate descriptively how each camp allocates its lobby efforts across policy types. Figure 2 shows the total number of consultation responses per policy type across the two overall camps. This describes the allocation of total lobbying efforts by each camp without accounting for differences in camp size or number of policy proposals.
Sectoral allocation of lobbying efforts across policy types in open online consultations. Note: This figure shows the total number of open online consultation responses that stakeholders from each camp have submitted to consultations coded into each of the three policy types. This does not adjust for differential number of stakeholders in each camp or differential number of policies of each type.

In line with my expectations, corporate stakeholders from the high-carbon camp mobilise more on policies that aim to reduce emissions by disincentivising fossil energy use, whereas low-carbon sector stakeholders are relatively more mobilised on green industrial policies that instead support alternative, low-carbon technologies. On FFP, the high-carbon camp outnumbers its low-carbon counterpart by more than 6-to-1 in number of submissions. Despite its much smaller size (40 per cent as many actors and 32 per cent as many submissions as the high-carbon camp), the low-carbon camp produced 67 per cent as many submissions in response to GIP proposals. Even though MPPs are few in number, this policy type attracts a significant share of total mobilisation from both camps and every sector, as we would expect given the broad targeting and high salience of these proposals.
This indicates descriptively that when EC policymakers rely on a policy type that penalises fossil fuel use, they mobilise actors from those sectors likely to be directly targeted and to be policy losers. An alternative policy strategy that aids low-carbon technologies tilts corporate climate lobbying away from high-carbon sectors and towards low-carbon sectors, the direct winners that such a strategy generates. Yet it is apparent from the descriptive evidence presented here that there are limits to how much the use of different policy strategies can disengage the more indirectly affected sectors. Both camps and all underlying sectors show a significant interest in all three policy types.
The effect of policy type on sectoral mobilisation
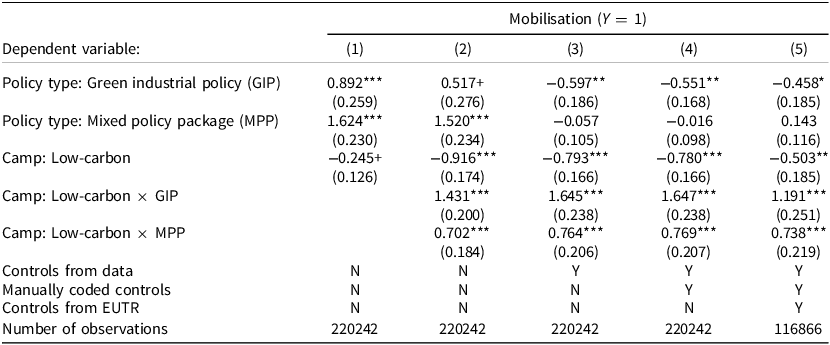
To estimate the statistical significance of these observed patterns and account for differential numbers of consultations and stakeholders as well as confounding factors, I next fit logistic regression models that estimate the interaction effect of camps and policy types in dyadic stakeholder-consultation data. The main coefficient estimates of interest are reported in Table 1 (full results in Appendix Table B2). Model 1, which does not include the main interaction term, shows that green industrial policies and MPPs have typically generated higher lobby propensities compared to fossil fuel phaseout policies and that the low-carbon camp is not much less likely to mobilise overall.
Main results: policy types and sectoral lobby mobilisation

+ p < 0.1, * p < 0.05, ** p < 0.01, *** p < 0.001.
Logistic regression models. Dependent variable is Mobilisation. Standard errors clustered by stakeholder and consultation are in parentheses. Reference categories are ‘Policy type: Fossil fuel phaseout policy (FFP)’ and ‘Camp: High-carbon’. Control variables, intercept, and ‘Camp: Others’ not shown. Full model results presented in Appendix Table B2. GIP = Green industrial policy, MPP = Mixed policy package, EUTR = European Union Transparency Register.
When the main interaction term is added in Model 2, the climate policy strategy hypothesis is strongly supported at all conventional levels of significance. First, the negative coefficient of Camp: Low-carbon shows that stakeholders from this camp are less likely than stakeholders from the high-carbon camp to mobilise on FFP. Second, the positive coefficient of Camp: Low-carbon × GIP shows that low-carbon camp stakeholders are more likely to lobby on GIP compared to high-carbon camp stakeholders. Third, these two coefficient estimates jointly confirm that low-carbon camp stakeholders mobilise more on GIP compared to FFP. These findings are robust to the inclusion of controls in the following model specifications.
Looking at the coefficient estimate of Policy type: GIP in Model 2 in isolation, there is no evidence that high-carbon camp stakeholders lobby less on GIP compared to FFP proposals. Yet the addition of relevant control variables reveals this to be due to underlying differences between FFP and GIP consultations, the latter of which attract more corporate responses on average. In Models 3, 4, and 5, the expected drop in mobilisation propensities among high-carbon camp stakeholders when moving from FFP to GIP proposals is present and statistically significant.
These results are robust to controlling for additional control variables, including the Type of act, Lead Directorate-General, Civil society mobilisation, self-reported Stakeholder size, or Consultation end date (see Appendix Table B3). They also remain substantially unchanged when a large number of very narrowly targeted ‘ecodesign’ and ‘ecolabelling’ policies are excluded (Appendix Table B4), when alternative measures of stakeholder resources are used (Appendix Table B5), or when linear probability models are fitted (Appendix Table B6). They also hold at the more disaggregated sector level, the analysis of which reveals additional insights (see Appendix Tables B7 and Appendix Figures B2 and B3). In summary, I find strong support for the proposition that climate policy strategies affect sectoral corporate mobilisation.
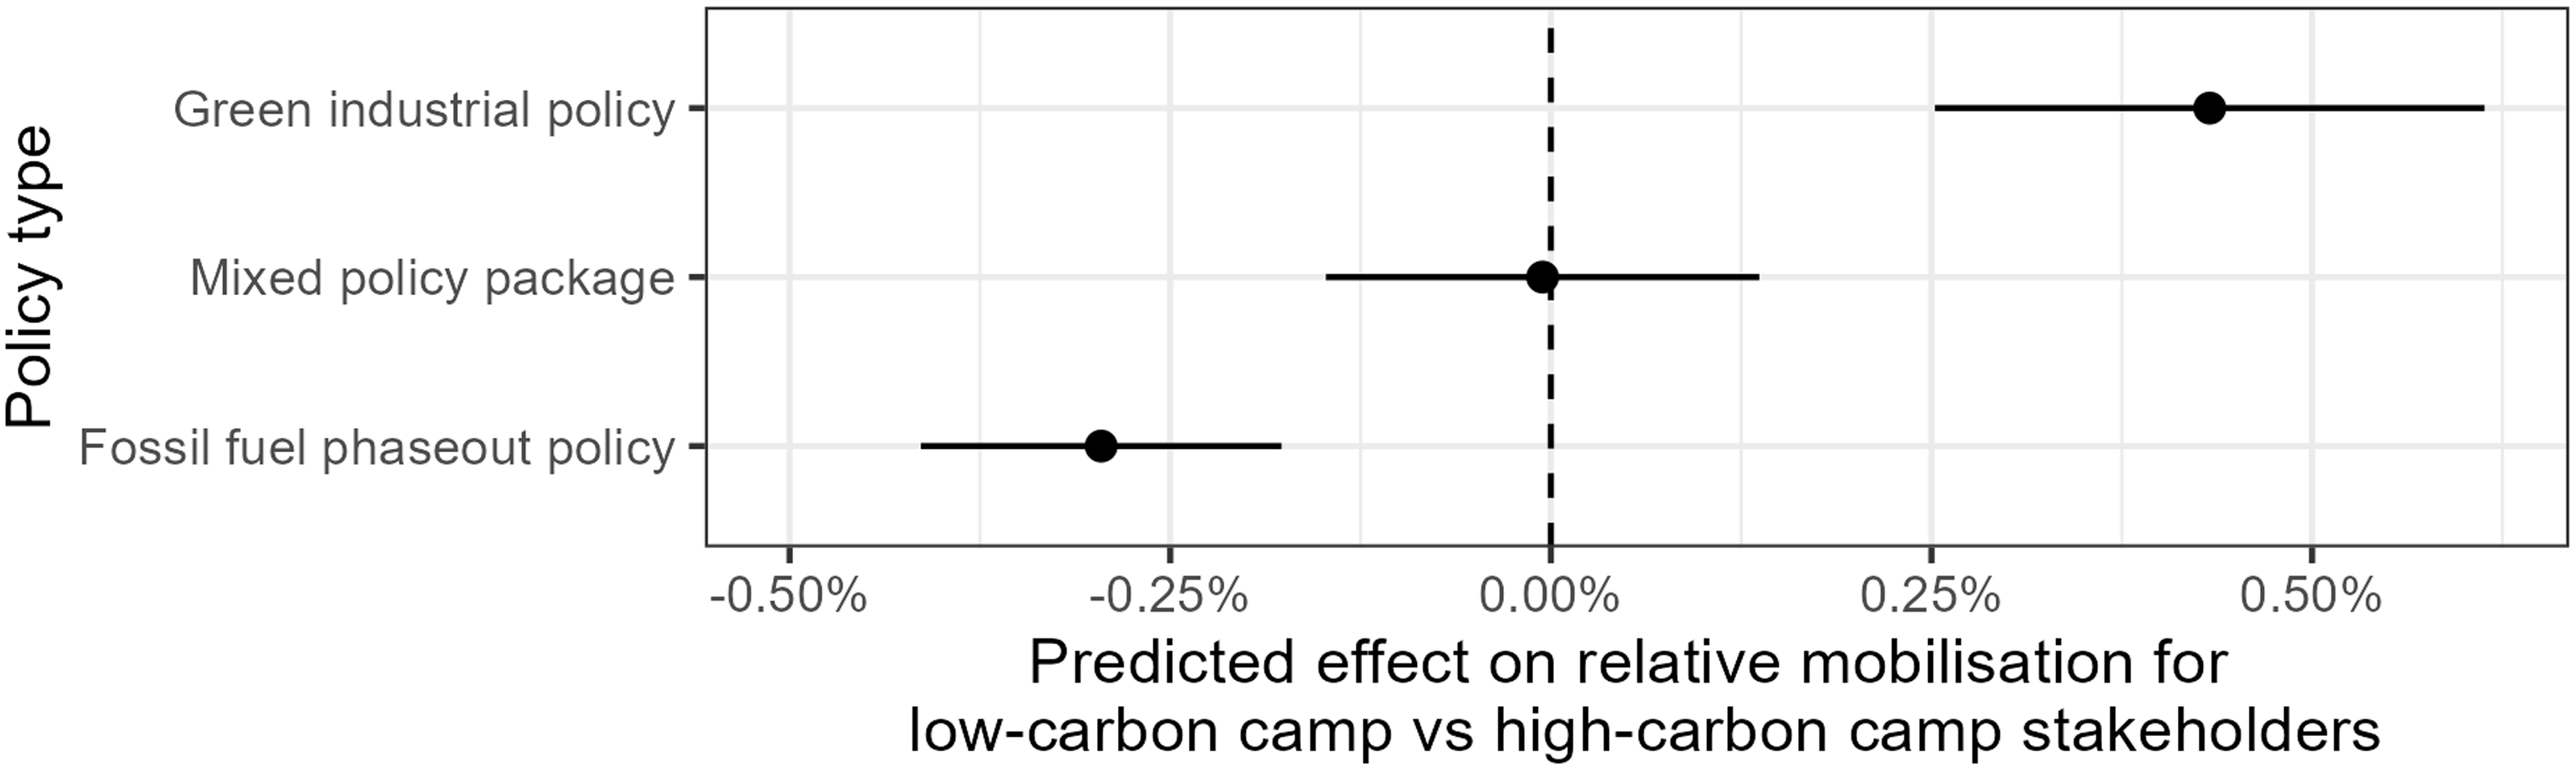
To illustrate the findings more clearly and ease substantive interpretation of the logistic regression models, Figure 3 summarises the main results graphically as conditional marginal effects controlling for Corporate mobilisation, Consultation stage, Previous consultation responses, Stakeholder type, Instrument type, and Geographic reach. This shows that the relative mobilisation of low- versus high-carbon interests is increased substantially by GIP proposals and reduced, albeit somewhat less strongly, by FFP proposals while MPPs mobilise both camps equally.
Conditional marginal effects of policy type on the relative mobilisation of the low- and high-carbon camps. Note: Horizontal lines represent 95 per cent confidence intervals calculated based on standard errors clustered by stakeholder and consultation. Positive (negative) values indicate a relative increase (decrease) in the mobilisation of low- compared to high-carbon camp stakeholders. Calculated based on Model 4 in Appendix Table B2 and using the marginaleffects R package (Arel-Bundock et al. Reference Arel-Bundock, Greifer and Heiss2024). See replication code for details.

To further decompose the sectoral mobilisation behaviour driving these effects, Figure 4 plots the predicted probabilities that stakeholders from each camp mobilise on each type of policy controlling for the same set of factors. This reveals an important nuance. The overall ability of policy strategies to affect sectoral mobilisation is driven in particular by the low-carbon camp’s rather narrow mobilisation and, to a lesser extent, by the high-carbon camp’s somewhat more balanced lobby behaviour (the supplementary expert group analysis described below and presented in Appendix E reveals a similar difference). Whereas the ratio of predicted probabilities of mobilisation on FFP relative to GIP is less than 2-to-1 in the high-carbon camp, that ratio is about 1-to-3 among low-carbon camp stakeholders. Although it is important to note that this analysis does not measure policy positions, this finding appears to go against core propositions from the climate policy sequencing thesis, stating that green industrial policies demobilise incumbent fossil fuel interests, but low-carbon interests extend their mobilisation to all aspects of climate policy (Meckling et al. Reference Meckling, Kelsey, Biber and Zysman2015). Instead, it accords better with the notion that incumbent sectors remain more consolidated, experienced, and well-organised than their emerging challengers, and that the ‘fog of enactment’ (Stokes Reference Stokes2020) has lifted and revealed to incumbents in the EU what is at stake for them in the new climate politics of GIP.
Predicted probability of mobilisation across camps and policy types. Note: Vertical lines represent 95 per cent confidence intervals calculated based on standard errors clustered by stakeholder and consultation. Calculated based on Model 4 in Appendix Table B2 and using the marginaleffects R package (Arel-Bundock et al. Reference Arel-Bundock, Greifer and Heiss2024). This figure shows the average adjusted predicted probability of mobilising for each camp across the three policy types, calculated as marginal means by averaging adjusted predictions across all combinations of unique values of categorical control variables and mean values of continuous variables. See replication code for details.

The effect of regulatory targeting on mobilisation
The focus on sectoral camps and climate policy types in the above analysis is of substantive interest. Yet it is equally important to test the underlying and more general theoretical proposition that the effect of policy strategies on mobilisation propensities is driven by regulatory targeting. As explained above, I conduct a more direct test of this by regressing the outcome variable Mobilisation on the binary measure of Directly targeted, which distinguishes all stakeholder-consultation dyads more precisely by whether a policy proposal directly targets or indirectly affects a given stakeholder.
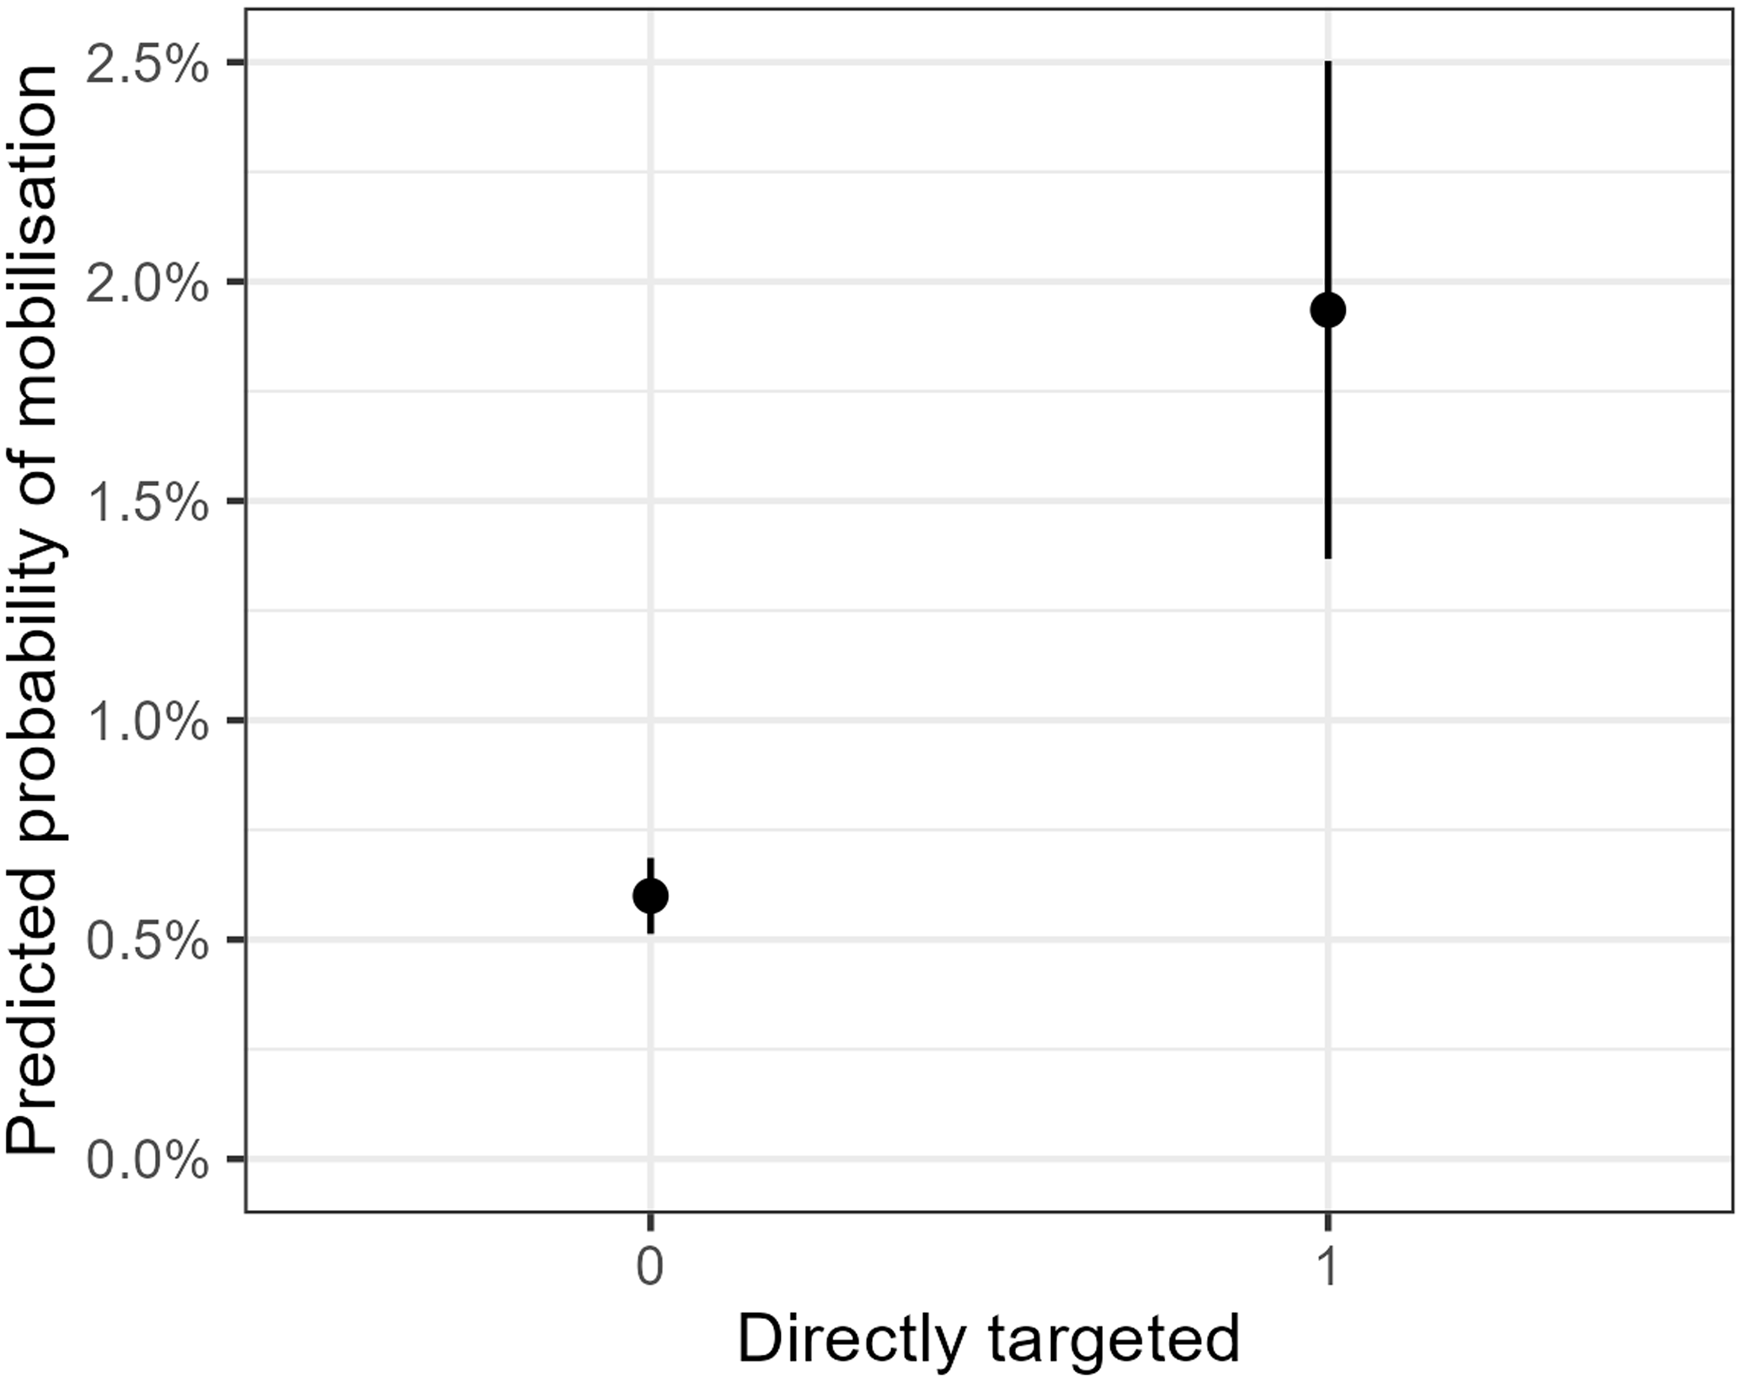
As reported in Appendix Table C2, the positive coefficient estimate of Directly targeted is substantively large and statistically significant across model specifications with and without control variables (p < 0.001). In Figure 5, the main result is presented graphically as predicted probabilities based on a specification that controls for Corporate mobilisation, Stakeholder type, Prior responses, Consultation stage, Geographic reach, and Instrument type. The predicted probability of mobilisation averaged across all combinations of categorical control variables and with continuous controls at their mean is estimated to be 1.9 per cent for direct targets and 0.6 per cent for indirectly affected corporate actors.Footnote 4
Predicted probability of mobilisation among directly targeted and indirectly affected stakeholders. Note: Vertical lines represent 95 per cent confidence intervals calculated based on robust standard errors clustered by stakeholder and consultation. Calculated from Model 3 in Appendix Table C2 using the marginal means approach from the marginaleffects R package, which calculates and averages adjusted predictions across all combinations of categorical control variables and mean values of continuous variables (Arel-Bundock et al. Reference Arel-Bundock, Greifer and Heiss2024). See replication code for details.

The effect is robust to including only what could be considered the ‘core’ sectors in relation to climate and energy policy (see Appendix Table C3). In addition, models that interact Directly targeted with either Camp or Policy type also reveal that this effect holds within each camp and for GIP and FFP consultations (see Appendix Table C4 and Appendix Figure C2).
This finding underlines that regulatory targeting is a key mechanism driving the ability of climate policy strategies to shape patterns of sectoral corporate mobilisation, lending strong support to the targeted mobilisation hypothesis. At the same time, these results show that non-targeted actors also mobilise. Based on the predicted probabilities presented here, lobbying from indirectly affected stakeholders is in fact expected to make up a majority of total climate and energy lobbying until more than 31 per cent of corporate stakeholders are directly targeted by a policy proposal.Footnote 5 In this data set, the share of directly targeted averages just 12 per cent.
Additional analyses
To further strengthen confidence in the theorised mechanisms, I probe whether stakeholders submit more technical information to regulators when they are directly targeted compared to when they are indirectly affected. This is the key observable implication of my argument regarding informational advantages. As described in detail in Appendix D, I use four different indicators to measure the information provided in each consultation response: The number of words, the number of multidigit numbers, the mean word rarity, and the number of terms matching a subject-specific dictionary. Ordinary least squares regression analyses (n ≤ 4,275) provide consistent evidence that information provision is higher in responses submitted by direct targets even when using consultation and stakeholder fixed effects and controlling for submission reuse (see Appendix D).
One limitation of the main analyses is that submitting a response to an OOC is a relatively shallow and low-cost lobbying activity that may provide little influence (Binderkrantz et al. Reference Binderkrantz, Blom-Hansen, Baekgaard and Serritzlew2022; Joosen Reference Joosen2020). To mitigate this, Appendix E extends the analysis to memberships of EC expert groups. Expert groups provide substantial policy influence for a select group of stakeholders who get access to repeated interactions with regulators in closed fora (Binderkrantz et al. Reference Binderkrantz, Blom-Hansen, Baekgaard and Serritzlew2022; Chalmers Reference Chalmers2014). Descriptive, inferential, and qualitative analyses lend further support to the climate policy strategy hypothesis and show that expert group access is particularly narrow for low-carbon camp stakeholders. It follows that regulators’ gatekeeping of interest group access does not counteract the uneven corporate mobilisation patterns observed in this case (cf. Arras and Beyers Reference Arras and Beyers2020).
Conclusion
This paper has provided the most comprehensive and systematic micro-level investigation of sectoral climate policy lobby patterns to date and investigated the ability of climate policy strategies to shape these patterns in the context of European Commission (EC) stakeholder consultations.
The results document that climate policies do indeed determine climate politics. More specifically, I show that firms and business associations from incumbent high-carbon sectors mobilise relatively more on traditional fossil fuel-restrictive climate policies compared to their counterparts from renewable energy and other low-carbon sectors, who mobilise mostly on green industrial policies, and that mobilisation on mixed policy packages is high across all sectors. The empirical evidence also supports the theoretical argument that policy strategies mobilise and demobilise relevant corporate actors through regulatory targeting, which advantages directly targeted over indirectly affected sectors through more certain and short-term impacts and policy-specific informational advantages. This shows that in addition to the procedural political strategies that policymakers use to try to shape interest group politics (see eg Fraussen et al. Reference Fraussen, Albareda and Braun2020; Meckling and Nahm Reference Meckling and Nahm2022; Van Ballaert Reference Van Ballaert2017), they may also use substantive policy strategies to this end, at least in polities and policy areas where substitutable policy approaches are available.
These results illuminate important debates over policy feedback and sequencing strategies in one of the most important public policy problems of our time, the energy transition. My results lend support to the notion that policymakers can use GIP strategies to reduce incumbent high-carbon sector lobbying and stimulate low-carbon sector lobbying as part of a process of ‘positive reinforcement’ (Aklin and Urpelainen Reference Aklin and Urpelainen2013; Urpelainen and Zhang Reference Urpelainen and Zhang2022). However, the more ambitious proposition that increasingly powerful ‘green’ industries become ‘political allies in the development of more stringent climate policy that subsequently penalises incumbent polluters’ (Meckling et al. Reference Meckling, Kelsey, Biber and Zysman2015, 1170) is weakly corroborated, even in this most-likely case. If anything, these analyses reveal the opposite sectoral asymmetry in the narrowness of issue prioritisation; not that low-carbon interests extend their pro-climate lobbying to all aspects of climate policy, but that incumbent industries dominate debates over traditional climate policy and retain a strong voice in GIP development. Schattschneider’s (Reference Schattschneider1935) classic insight that prior lobbying successes yield persisting resource advantages and institutional privileges could suggest that this asymmetry might eventually flip in favour of the low-carbon camp, but it seems that it still works better as an explanation of the continuing dominance and breadth of high-carbon camp lobbying.
Besides offering an important qualification of existing accounts of climate policy sequencing, these findings point to two alternative avenues for strategic climate policy. First, high levels of low-carbon mobilisation on mixed policy packages show that they can be mobilised more broadly by proposals that combine ‘carrots’ and ‘sticks’. It seems that such a policy strategy can draw pro-climate corporate interests into policy debates concerning fossil fuel phaseouts from which they are otherwise relatively disengaged and to which they lack access. Second, the continued dominance of high-carbon corporate interests underscores the inevitable importance of policy strategies that, rather than focusing on strengthening challengers, convert a significant fraction of already powerful incumbents into genuine policy supporters (Kelsey Reference Kelsey2018; Kupzok and Nahm Reference Kupzok and Nahm2024; Meckling and Nahm Reference Meckling and Nahm2022; Meckling and Strecker Reference Meckling and Strecker2023).
In addition, this study generates insights of relevance to the literature on interest groups and stakeholder consultations in the EU and beyond. First, my theorising and results regarding regulatory targeting add to recent work showing that the degree of ‘affectedness’ shapes interest group mobilisation and access (Junk et al. Reference Junk, Crepaz, Hanegraaff, Berkhout and Aizenberg2022) by indicating that the kind of affectedness, ie whether it is direct or indirect, also shapes lobbying. Secondly, this paper illustrates the value of thinking about stakeholders’ informational resources in lobbying not only as static, determined by organisational characteristics, and something that therefore varies across actors or issue areas (eg Flöthe Reference Flöthe2019, 163; Klüver Reference Klüver2012), but also as dynamic, activated by policy strategies, and therefore varying across specific policy contexts within each issue area. Third, these insights from climate politics speak to the important literature on the causes of interest group bias and diversity (eg Beyers and Arras Reference Beyers and Arras2020; Binderkrantz et al. Reference Binderkrantz, Blom-Hansen and Senninger2021; Coen and Katsaitis Reference Coen and Katsaitis2013; Hanegraaff and Berkhout Reference Hanegraaff and Berkhout2019). Specifically, my findings underscore that we obtain a partial picture of interest group diversity and its causes if we only consider the overall dominance of corporate mobilisation without accounting for its sectoral composition (see also De Bruycker and Colli Reference De Bruycker and Colli2023). In policy areas featuring business conflict, not taking this into account means overlooking a fundamental dimension of disagreement and diversity that varies across policy strategies. Even laudable studies that disaggregate business interests using standard industry classifications (Arras and Beyers Reference Arras and Beyers2020; Pagliari and Young Reference Pagliari and Young2016) risk overlooking this aspect of interest group plurality when business conflict does not follow standard classifications, such as in climate and trade policy (see Kim Reference Kim2017).
Finally, it is worth reflecting on the limitations of this study and how these point to the need for further research. First, more work in other country contexts is needed to ascertain the generalisability of these findings. If the EC is a particularly informational lobbying context, are the barriers to broader and more encompassing low-carbon sector lobbying lower in more openly confrontational, pressure-based institutional contexts such as the United States?
Second, by only studying climate lobbying inside the EC ‘consultation regime’, I ignore other ‘inside’ lobby venues, including the European Parliament, the Council, and national governments (Ydersbond Reference Ydersbond2014), as well as ‘outside’ lobbying channels such as the media. This not only means that I provide a partial picture of corporate climate lobbying in the EU, but this also raises questions about generalisability across institutional settings. If the bureaucratic nature of EC stakeholder consultations produces different dynamics compared to more overtly political channels such as the Parliament (Bouwen Reference Bouwen2002), my results and theory, particularly regarding the relevance of informational advantages, may not apply more broadly. Relatedly, if it is considered inappropriate for corporate stakeholders to lobby on policies that indirectly affect them, they may limit such activities to venues where the precise content of lobbying is unobservable, such as expert groups and meetings.
A third key limitation is that I do not study corporate policy positions. Previous hopes of automated measurement of lobby positions, even for single consultations (Klüver Reference Klüver2009), have proven elusive (Bunea and Ibenskas Reference Bunea and Ibenskas2015). Doing so for more than 5,000 responses across 142 consultations, each containing many policy provisions, using either automated text-as-data methods or manual coding, appears infeasible. Still, we cannot infer directly from my concrete results to the balance of corporate support for and opposition to EU climate policy. This would require an implausible assumption that corporate climate policy preferences are only structured by sectoral divisions and always pit high-carbon sector opposition against low-carbon sector support. In truth, climate politics is structured by inter- and intra-sectoral business conflict (Kennard Reference Kennard2020; Kim et al. Reference Kim, Urpelainen and Yang2016), and some fossil fuel-reliant industries do support certain types of climate policy (Meckling Reference Meckling2011; Vormedal et al. Reference Vormedal, Gulbrandsen and Birger Skjærseth2020). Future studies could move us closer to a comprehensive understanding of corporate climate policy lobbying in the EU by expanding the focus from mobilisation and access to include overlapping positions and actual coalitions that can emerge vis-á-vis specific policies, such as between the manufacturing and renewable energy sectors over certain aspects of GIP.
These are ultimately empirical questions. The comprehensive data collected and coded for the purposes of this study are freely available in the replication materials and could serve as a starting point for more answers.
Supplementary material
The supplementary material for this article can be found at https://doi.org/10.1017/S1475676525100273
Data availability statement
Replication materials to access the raw data and reproduce all figures and tables in the main article and the appendices are available in an OSF repository accessible via the following link: https://osf.io/y2kwh/?view_only=b5bd89623793492e80b7890eca7cd89b.
Acknowledgements
For helpful comments and suggestions, I wish to thank the three anonymous reviewers, as well as Robert Falkner, Wiebke Junk, Michael Lerner, Helle Ørsted Nielsen, Stefano Pagliari, Christoffer Green Pedersen, Henrik Seeberg, Peter Wyckoff; participants at the 2023 Graduate Environmental Politics Workshop at King’s College London; audiences at the 2024 Comparative Agendas Project Annual Conference; and members of the Section of Comparative Politics at the Department of Political Science, Aarhus University.
Funding statement
The author received no financial support for the research or authorship of this article.
Competing interests
The author declares that there is no conflict of interest.


 Open access