


1. Introduction
Digital trade is increasingly shaping the global economy,Footnote 1 yet the regulatory landscape governing it remains complex and fragmented. This paper introduces the Digital Trade Integration (DTI) database, which is designed to systematically compile and analyse regulations and practices affecting digital trade across 146 jurisdictions.Footnote 2 By providing structured and up-to-date information, this database aims to support policymakers, researchers, and businesses in understanding and navigating the regulatory environment for digital trade integration. The paper presents the database's structure, methodology, and potential applications, highlighting its importance in promoting transparency, regulatory coherence, and informed decision-making in digital trade governance.
The remainder of this paper is structured as follows. Section 2 provides a conceptual foundation for understanding digital trade integration. It begins by exploring definitions of digital trade before introducing the concept of digital trade integration, which entails the lack of restrictions coupled with the implementation of enabling policies. We examine the key components relevant to the analysis of digital trade integration, which include Information and Communication Technology (ICT) goods, digital services, investment in sectors relevant to digital trade, and data.
Section 3 outlines the methodology underpinning the DTI database and highlights its value added. It explains how the definition of digital trade integration guided the selection of 65 indicators across 12 policy pillars included in the database. This section details the scope of the database, the qualitative information it contains, the data collection process, and the methodology adopted to translate qualitative insights into quantitative data. Additionally, this section discusses the database's relationship with complementary initiatives, and reflects on key challenges and limitations.
Section 4 presents the main findings derived from the database, focusing on global and regional trends. The analysis indicates a clear correlation between policies that facilitate digital trade and higher levels of economic development. Conversely, a significant number of restrictive measures is often associated with broader constraints on political and civil liberties. The regional analysis highlights significant disparities, with high-income economies, particularly in Europe, exhibiting more advanced and supportive regulatory frameworks, whereas low-income countries generally encounter substantial challenges in implementing enabling measures. These findings provide insights to investigate further the determinants of regulatory heterogeneity for digital trade across different economic and political contexts.
Finally, Section 5 concludes the paper and suggests avenues for future research.
2. Conceptualizing Digital Trade Integration
2.1 Definitions of Digital Trade
Despite the growing importance of what is commonly referred to as digital trade, there is currently no universally accepted definition of this concept. This is probably connected to the fact that digital trade itself keeps evolving as a concept. Yet, over the past years, the definition provided by the International Monetary Fund (IMF), Organization for Economic Cooperation and Development (OECD), United Nations Conference on Trade and Development (UNCTAD), and World Trade Organization (WTO) in the latest version of their ‘Handbook on Measuring Digital Trade’ has emerged to become the primary reference,Footnote 3 despite the measurement challenges connected to the lack of comprehensive and comparable (official) digital trade statistics.Footnote 4
According to the Handbook, digital trade encompasses ‘all international trade that is digitally ordered and/or digitally delivered’ involving consumers, businesses, governments, and non-profit organizations. Although the role of platforms is not explicitly acknowledged in the definition, the Handbook recognizes their role as enablers of digital trade and accounts for them in measuring the value of digital trade.Footnote 5
Digitally ordered trade refers to all those goods and services ordered through computer networks ‘by methods specifically designed for the purpose of receiving or placing orders’, therefore excluding orders done manually by email. This includes digitally ordered goods that are delivered physically, including through marketplaces,Footnote 6 and digitally ordered services that can be delivered digitally or physically, such as streaming services or booking accommodations through a matching application.
Digitally delivered trade includes all international trade transactions delivered remotely over computer networks. Unlike digital ordering, digital delivery pertains exclusively to trading services and digital products, such as e-books, downloadable music, downloadable software, and mobile apps.Footnote 7 These services may extend over a longer timeframe and entail significant interpersonal interaction, especially in large-scale transactions that can involve in-person negotiations with the service provider. Therefore, digitally delivered services can be ordered via video calls, emails, voice calls, and other communication devices. These services have recorded an almost fourfold increase in value since 2005, rising by 8.1% on average per year over the period 2005–2022, outpacing goods and other services exports to account for 54% of total services exports.Footnote 8
Overall, digital trade has grown from USD 1.1 trillion in 1995 to USD 5.1 trillion in 2018, representing 24% of global trade, growing faster than ‘non-digital’ trade by a factor of about 1.3.Footnote 9 When ICT goods are included, the value of digital trade rises to USD 6.5 trillion in 2018, representing almost 30% of global trade.Footnote 10 Notably, ICT goods are not included in the definition adopted by the IMF, OECD, UNCTAD, and WTO, although their role is implicitly recognized in the definition of digital trade. ICT goods are essential enablers of electronic transactions and digital services that form the backbone of modern digital commerce.Footnote 11 This also emerges clearly from other definitions of digital trade, such as that of the United Nations Economic and Social Commission for Asia and the Pacific (UN-ESCAP), where digital trade is defined as ‘the use of digital technologies to facilitate business activities’ going beyond online sales or purchases.Footnote 12 For this reason, as shown in the next subsection, we include ICT goods in our analysis of digital trade integration.
2.2 Defining Digital Trade Integration
Balassa defined economic integration as a process and a state of affairs.Footnote 13 As a process, it implies the implementation of measures aimed at eliminating any form of discrimination between the economic units of different nation states. When considered as a consolidated state of affairs, economic integration is represented by the absence of discrimination between national economies. Starting from the elimination of economic frontiers between two or more economies, this process is expected to lead to broader economic interdependence and, in turn, to greater economic stability, growth, and convergence of economic performance among countries.Footnote 14
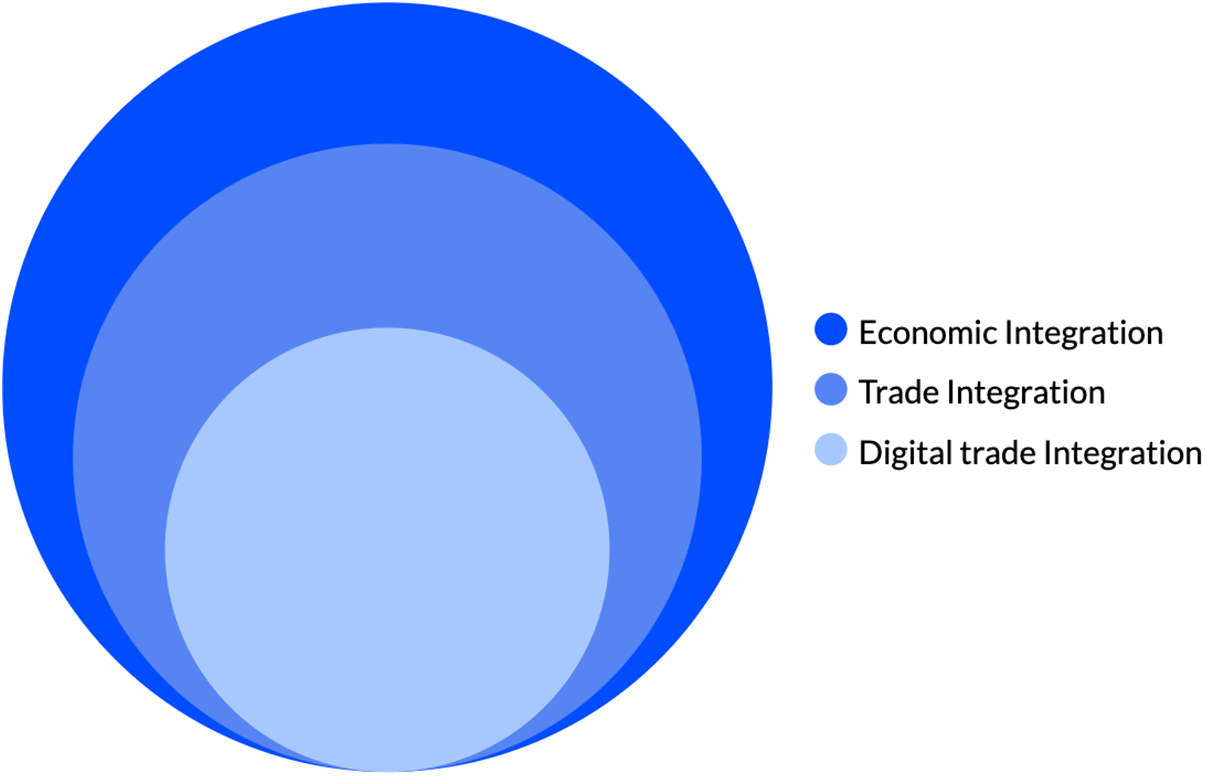
Trade integration can be considered a subset of economic integration, focusing on removing cross-country discrimination in markets for goods and services, so that foreign products are ultimately treated as equivalent to domestic ones (Figure 1). This process would start with the disappearance of trade costs (tariff and non-tariff barriers), leading then to the intensification and expansion of trade and greater interconnection and interdependence between markets for goods and services.Footnote 15
Conceptualizing digital trade integration

Trade integration is usually measured through indicators such as trade liberalization between and within regions, tariff reduction, and participation in global value chains (GVCs).Footnote 16 As tariffs keep decreasing over time, non-tariff measures and trade facilitation have become more important in supporting trade integration. Within this framework, digitalization has emerged as an important enabler of trade integration, as it helps firms overcome traditional obstacles to participation in GVCs.Footnote 17 At the same time, digitalization poses new challenges for the government, resulting in new regulations and regulatory heterogeneity between countries, which can negatively impact trade integration.Footnote 18
The notion of digital trade integration, which is the focus of the DTI database, pertains specifically to integration for digital trade, and it is, therefore, a subset of trade integration (Figure 1). This concept has been defined by Mitchell and Mishra as the unhindered cross-border flow of digital services, products, and technologies, in addition to the cross-border flow of manufactured goods facilitated by Internet platforms alongside data, capital, intellectual property, skilled labour, and the provision of integrated physical and virtual infrastructure.Footnote 19 As such, digital trade integration is seen as a multifaceted process covering regulatory frameworks, policy formulations, digital technologies, and operational protocols across the global or regional digital value chain, requiring not only the removal of barriers to digital commerce but also the comprehensive alignment of technological, legal, and policy frameworks. They identify five foundational elements, namely (i) reduction of barriers to digital trade, (ii) digital trade facilitation, (iii) digital trade regulatory frameworks and digital trust policies, (iv) digital development and inclusion, and (v) institutional coordination.
In the DTI database, we adopt a more targeted definition of digital trade integration that constitutes a first step towards ‘perfect’ digital trade integration, which, as stated by Mitchell and Mishra in their paper, is unachievable because of different policy preferences as well as political and economic aims. We define digital trade integration as a process aimed at promoting the cross-border flow of ICT goods, digital services, and data, alongside investment in sectors relevant to digital trade, by removing regulatory restrictions and implementing enabling measures. This definition focuses on lifting restrictions to digital trade while promoting trust in the digital economy, taking into account key enabling policies.
As such, our definition of digital trade integration focuses on four main components for analysis, namely (i) ICT goods, (ii) digital services, (iii) investment in sectors relevant to digital trade, and (iv) data. Although ICT goods, investment, and data are not explicitly included in the definition of digital trade, their role as enablers of digital trade has been evident since the onset of the digital revolution, and therefore, they represent key elements to assess the regulatory environment for digital trade integration.Footnote 20 In the next subsection, we further clarify the definition of these four components and the scope considered in our analysis.
2.3 Main Components for the Analysis of Digital Trade Integration
2.3.1 ICT Goods
ICT goods play a crucial role in enabling consumers, companies, and the government to engage in digital trade. For our analysis, we define ICT goods comprehensively to include not only final goods but also all intermediate inputs crucial for their manufacture. These include smart phones, computers, network equipment, storage media, semiconductors, electrical parts, electronics, sensors, processors, rare earths, and cables. For our study, we refer to the ‘ITA 3.0’ list proposed by the Information Technology & Innovation Foundation (ITIF).Footnote 21 This list incorporates all items in the 1996 WTO Information Technology Agreement (ITA),Footnote 22 its 2015 expansion (ITA II),Footnote 23 and additional goods recommended for future expansion. The ITA plurilateral agreement and its expansion have been pivotal in eliminating duties for key ICT goods for 84 WTO members, which together account for approximately 97% of world trade in IT goods.Footnote 24 The ITA 3.0 list includes several emerging technologies identified by the private sector, which are not currently part of the ITA lists. These technologies, such as next-generation semiconductors and digital manufacturing innovations like industrial robots and 3D printers, are driving the ongoing digital revolution.
2.3.2 Digital Services
Digital services are a key component of digital trade. Official statistics tend to include all digitally deliverable services, given the difficulty in distinguishing those services that could potentially be delivered online from those that are actually delivered online. Digitally deliverable services include financial, educational, and various professional services such as architectural, engineering, scientific, and other technical services. In our analysis, we focus specifically on services that are delivered online, including cloud computing, social networking, communication services, and marketplace platforms. Digitally deliverable services are not included in our analysis except for regulations that specifically pertain to their online delivery. For instance, we exclude licensing requirements for financial sector operators from the list of relevant regulations for digital trade integration, but we include limits on online payments. This approach allows us to identify policies that directly impact the online delivery of services while excluding sector-specific regulation that applies regardless of the mode of delivery. Additionally, we categorize digital products, such as e-books, downloadable music, software, and mobile applications, as a subset of digital services.Footnote 25
2.3.3 Investment in Sectors Relevant to Digital Trade
Foreign direct investment (FDI) is crucial in enhancing digital trade and building the capabilities and infrastructure needed to thrive in the digital era. Relevant sectors for analysing digital trade integration include those that contribute to developing digital connectivity infrastructure, such as broadband networks, data centres, and 5G technology, which provide a critical foundation for enabling digital trade.Footnote 26 This infrastructure facilitates data transmission, which is essential for digital transactions, e-commerce, and remote service delivery. Additionally, relevant sectors for our analysis include those where companies tend to rely on commercial presence to engage in the provision of digital services, such as cloud computing and e-retail.Footnote 27 It is important to notice that governments can require commercial presence for companies to be able to provide digital services, especially in sectors such as social media and online news.Footnote 28 Our analysis examines policies that may restrict FDI across all these sectors.
2.3.4 Data
Underpinning digital trade is the use and movement of data, which is the fourth component of our analysis. As a ‘network of networks’, the Internet relies fundamentally on the ability to transfer data across these interconnected systems.Footnote 29 Data serve as the means through which digital trade occurs, a means of production, and an asset that can be traded itself.Footnote 30 It is also the core of new ‘information industries’ such as cloud computing, big data analytics, and artificial intelligence, while contributing to nearly all sectors as an input into R&D, product design, production processes, logistics, marketing, sales, and customer engagement.Footnote 31 Therefore, cross-border data transfer has become increasingly essential for international business transactions.Footnote 32
3. Methodology and Value-Added of the DTI Database
3.1 Scope of the DTI Database
Within the conceptual framework presented in Section 2, the DTI database aims to provide an overview of policies and practices relevant to digital trade integration. The DTI database covers regulatory restrictions on ICT goods, digital services, data, and investment, as well as the presence of enabling policies for a conducive policy environment for digital trade. The entries are organized into 12 pillars, covering 65 indicators.Footnote 33 The database is not meant to be an exhaustive list of all the policies implemented in a country but rather a tool to identify key measures expected to impact digital trade integration.
The selection of indicators covering the restrictions is based on the original list of policies included in the Digital Trade Restriction Index (DTRI),Footnote 34 that has been updated through expert meetings and interviews with the private sector. Moreover, the list has been complemented with an additional set of indicators covering enabling policies to promote a conducive environment for digital trade integration, also informed by meetings and seminars with experts in the field.Footnote 35 Several considerations drove the selection of the indicators: to cover the most significant regulations that impact digital trade integration,Footnote 36 to reflect the most recent regulatory developments on digital trade, to enable the update of entries over time, and to facilitate the retrieval and interpretation of information by the users.
The list includes both traditional trade policies, such as tariffs and investment regulation, and more recent types of regulations related to digital trade, such as policies on intermediary liability and data flows, which are often found in recent trade agreements. While for some types of policies included in the database there is clear empirical evidence confirming their effect on digital trade, this is not the case for all indicators.Footnote 37 Most indicators reflect regulatory policies, including laws and regulations on public procurement, FDI, intellectual property rights (IPRs), telecommunications, data protection, electronic transactions, electronic communications, and consumer protection, among others. In addition, a subset of entries is based on observed practices relevant to the integration of digital trade, such as cases of content blocking, internet shutdowns, practical restrictions related to the application process and enforcement for patents, complaints about the lack of transparency in public procurement, and import procedures. These practices are not regulatory policies, but they can nevertheless be considered non-tariff measures that impact digital trade.Footnote 38
3.2 Qualitative Information Available in the DTI Database and Data Collection
The DTI database allows users to browse through over 6,600 measures that were found in the 146 economies selected for the DTI project.Footnote 39 These include 50 high-income economies, 31 upper-middle-income economies, 42 lower-middle-income economies, and 22 low-income economies.Footnote 40 In terms of regional coverage, the database includes 18 countries from the East Asia and the Pacific (EAP) region, 36 countries from Europe and Central Asia (ECA) including the 27 Member States of the European Union, 28 countries from Latin America and the Caribbean (LAC), 11 countries from the Middle East and North Africa (MENA), two countries from North America (NA), three countries from South Asia (SA), and 48 countries from Sub-Saharan Africa (SSA).
When consulting the DTI database, users find an intuitive menu that allows filtering measures by country, pillar, indicator, and type of measure (namely, an enabling or restrictive measure). Search results are organized as a list of measures, each presented in the format shown in Figure 2. Each entry includes the type of measure (restrictive or enabling), the relevant pillar and indicator, the name of the law (both in English and, when available, in the original language) or the type of practice, the sectoral coverage, a description of the regulation or practice, the timeframe, and links to the regulatory text and additional relevant sources.
Format of search results

The data collection has been conducted by over a hundred practitioners engaged by project partners, alongside Master's, PhD, and Post-Doctoral researchers from various partner universities.Footnote 41 In most cases, the researchers were either nationals of the countries they analysed or had strong connections to them. To ensure coherence and consistency across countries, each researcher received comprehensive training and detailed guidelines. The DTI project's team at the European University Institute and Teesside University thoroughly reviewed and verified the collected data. Wherever possible, datasets were shared with national authorities for feedback and review.
The primary sources for the analysis are official gazettes of laws and regulations. Secondary sources, such as official guidelines, government resources, publications, legal reviews, news articles, corporate blogs, and regulatory databases, are used to guide the identification of measures, which are then validated through a review of the primary sources. When the source of the analysis is not a regulatory text, we rely on secondary sources, including official company complaints and news articles.
The DTI database is updated annually by the DTI project team. At the end of each year, the team releases the data related to the previous year. Therefore, as of December 2024, users can consult the regulatory information related to the year 2023, which is summarized in Section 4 of this paper.
3.3 Turning Qualitative Information into Quantitative Data
Transforming the qualitative information in the DTI database into quantitative data involves a compromise in information granularity, but it can also provide valuable applications. For each entry listed across the 65 indicators, we adopt a consistent methodology for assessment across countries. The general criteria for categorizing an entry as restrictive or enabling are the following: a measure is categorized as restrictive if it (i) implies a differential treatment between domestic and foreign providers, (ii) implies a more restrictive treatment of online trade versus offline trade, or (iii) is particularly trade-distortive in achieving its economic objective. A measure is categorized as enabling if it (i) encompasses domestic policies that enhance trust in digital trade, or (ii) involves international agreements that enhance transparency and cross-border interoperability. The lack of an enabling policy is also categorized as a restriction.Footnote 42
To calculate the total number of restrictions and enabling policies, we simply sum the number of entries in each category. This transparent and straightforward methodology to aggregate entries is particularly suitable when there is a lack of an empirical basis for deciding which indicator is more important than another. Yet, an unweighted approach brings certain weaknesses, as the total count does not consider each measure's peculiarity.
The total count of policies provides only a rough estimate of the overall policy environment for digital trade integration, treating all policies equally without considering their varying scope and impact. Nonetheless, past research indicates that counting these measures from the DTI database still yields valuable insights for the empirical assessment of digital trade integration.Footnote 43 In addition to supporting empirical research, this approach facilitates visual summaries and comparisons between the regulatory environments of different countries, as illustrated in Section 4. Even basic metrics can reveal significant patterns in how countries regulate digital trade. Yet, to gain a comprehensive understanding, these metrics should be supplemented with a qualitative assessment of the policies’ content. A forthcoming output of the DTI project will be a comprehensive digital trade integration index, based on a more refined method of weighting and combining policies.
3.4 Relation with Complementary Initiatives
The DTI database builds upon the Digital Trade Estimates (DTE) database developed by the European Centre for International Political Economy (ECIPE). The DTE database was the first attempt to systematically categorize restrictions on digital trade imposed by 64 countries and to develop an index for digital trade restrictiveness (DTRI).Footnote 44 While the DTI initiative is a continuation of the DTE database, it takes a significant step forward by refining the methodology, shifting the focus from restrictiveness to integration, and expanding the coverage of countries included in the analysis.
Several other databases compile regulatory information that may be relevant to the analysis of digital trade, even though they do not specifically target this area. One example is the Global Trade Alert (GTA) initiative by the St. Gallen Endowment for Prosperity through Trade (SGEPT), which lists a wide variety of policy actions but lacks a specific focus on digital trade.Footnote 45 Another relevant example is the Services Trade Policy Database (STPD), which can be consulted in the World Bank (WB) Integrated Trade Information Portal (I-TIP). It covers a wide range of regulatory policies related to services and investment across all sectors, but it does not have a specific focus on digital services nor does it include policies related to ICT goods.Footnote 46 Similarly, the WTO Trade Policy Review Mechanism (TPRM)Footnote 47 and the United States Trade Representative (USTR) National Trade Estimates (NTE) ReportsFootnote 48 do not have a specific focus on digital trade. In addition, the information in these extensive reports is not compiled in a structured database, making it challenging to conduct comparisons across countries.Footnote 49
There is another group of databases that include initiatives that relate more directly to digital trade but focus specifically on certain sectors or policy areas. These include the International Telecommunication Union (ITU) DataHub,Footnote 50 the OneTrust Data Guidance database,Footnote 51 Stanford Law School's World Intermediary Liability Map (WILMap),Footnote 52 Freedom House's Freedom on the Net initiative,Footnote 53 the UNCTAD Global Cyberlaw Tracker,Footnote 54 and the University of Lucerne's Trade Agreement Provisions on Electronic-commerce and Data (TAPED) dataset.Footnote 55 While all these datasets are valuable tools for tracing regulatory developments, their coverage is limited to a certain regulatory dimension relevant to digital trade. For example, TAPED assesses commitments in trade agreements, the ITU DataHub maps policies that apply to the telecom sector, and Data Guidance tracks regulations that apply to data processing and data transfers.
There are two initiatives whose focus is more clearly connected to the DTI, namely the OECD's DSTRI databaseFootnote 56 and the SGEPT's Digital Policy Alert (DPA).Footnote 57 The DSTRI database identifies and catalogues a wide range of restrictions that affect digital services trade and data, key components of analysis for digital trade integration. Yet, it lacks information related to ICT goods and investment, and it does not include a series of restrictive practices, such as online censorship and internet shutdowns, despite their negative effect on the provision of online services. Compared to the DSTRI, the DTI database offers wider country coverage and a broader focus on integration, moving beyond the concept of restrictiveness. In addition, an important value added of the DTI is that there is a descriptive summary for each entry, which is missing in the DSTRI.
The DPA is a database focused on tracking policy changes in the digital space, containing over 32,400 events related to policy and regulatory developments. Its coverage is extensive; however, most of the information pertains to the US, the UK, and the 27 Member States of the EU, which constitute the top 30 countries in terms of tracked events and account for over three-quarters of the data in the database. In contrast, the DTI database reviews the regulatory environment of each country across its 65 dimensions. Another advantage of the DTI compared to the DPA is its format, which allows for direct comparisons between countries for each indicator. Additionally, the DTI clearly indicates the expected impact of each policy on digital trade (restrictive or enabling) which the DPA does not provide.
To summarize, while there are several complementary databases, reports, and initiatives aimed at tracking regulatory actions relevant to digital trade, the DTI has certain unique features. This database has a specific focus on digital trade, covering policies that impact trade in ICT goods, digital services, investment in sectors relevant to digital trade, and the use and transfer of data. The DTI database goes beyond the concept of restrictiveness by including both restrictive and enabling policies expected to impact economic integration in the context of digital trade. The information is structured to facilitate cross-country comparison across selected pillars and indicators. Moreover, it contains detailed and comparable information for 146 countries (with 10 additional countries that will be added by the end of 2025), making it a unique source of regulatory information for countries usually excluded or underrepresented in similar initiatives.
3.5 Challenges and Limitations
The DTI database aims to track regulatory developments in an area that recently witnessed a surge in regulatory activity. This exponential growth makes it inherently difficult to monitor all the new policies enacted across a wide array of countries. The DTI's commitment to including countries from all income levels makes it especially challenging to track policy changes, as lower-income economies do not always publish all the regulatory texts online. Regulatory information about these countries is also frequently sparse or inaccurate in secondary sources, such as reports, databases, and legal reviews.
The increasing technicality and complexity of regulatory policies that affect the four components studied in the DTI further complicate this endeavour by requiring reliance on skilled researchers who can keep pace with the evolving complexity of the issues and who can also analyse the relevant information to make it readily available for the database users. The absence of a universally agreed-upon definition of digital trade exemplifies the challenges in assessing regulatory texts and consistently categorizing information across countries. This situation creates a trade-off between relying on local researchers, who may have better access to regulatory texts and a deeper understanding of the local language, and experienced researchers more familiar with digital trade and the methodology for assessing and categorizing entries in the DTI database.
These challenges in tracking regulatory changes in digital trade highlight the complexity of developing and maintaining an initiative like the DTI over time, while also underscoring its value. To address these challenges, we will explore several strategies. One approach is to leverage contributions and feedback from users by creating incentives for them to participate. Specifically, companies and chambers of commerce could play a significant role in identifying relevant policy changes. Another approach is to utilize technology to detect, translate, and potentially assess new regulatory changes.Footnote 58
4. Main Findings from the Digital Trade Integration Database
In this section, we highlight global trends emerging in the regulation of digital trade. We first showcase aggregate statistics on restrictive and enabling policies for all countries. Next, we zoom in on developments related to regulations for the four components assessed, namely ICT goods, digital services, investment in relevant sectors, and data. We then present regional trends for restrictive and enabling policies.
4.1 Global Trends
Figure 3 provides a snapshot of the variety of information contained in the latest edition of the DTI database, which includes over 5,000 unique measures expected to restrict digital trade integration (summarized in the upper figure) and 1,600 measures expected to enable integration (lower figure).Footnote 59 The policies and practices included reflect the regulatory environment in 146 countries in 2023.
Distribution of restrictive and enabling policies, 2023

A simple plot, shown in Figure 4 below, indicates no clear relation between income per capita and the number of restrictions, although economies with a higher number of restrictions appear to be relatively big in size – which is represented by the circle for each country. However, enabling policies are clearly positively correlated with income per capita. That is, higher-income economies tend to implement more enabling measures.
Number of measures and level of development, 2023

Figure 5 presents the relationship between the number of measures in the DTI dataset for each country and the Freedom in the World Index published by Freedom House.Footnote 61 This index encompasses several indicators of political rights and civil liberties, including the electoral process, political pluralism and participation, functioning of government, freedom of expression and belief, associational and organizational rights, rule of law, personal autonomy, and individual rights.
Number of measures and level of political and civil freedom, 2023

A clear correlation emerges between countries’ Freedom Scores and both components of the DTI dataset. Countries that implement more enabling policies for digital trade tend to exhibit higher levels of freedom in political rights and civil liberties. Conversely, countries that impose more restrictions on digital trade tend to limit political rights. In fact, it is also possible that, in these countries, the Internet is used to restrict people's freedom, with inevitable costs for digital trade. This correlation represents an interesting angle that should be explored in future research.
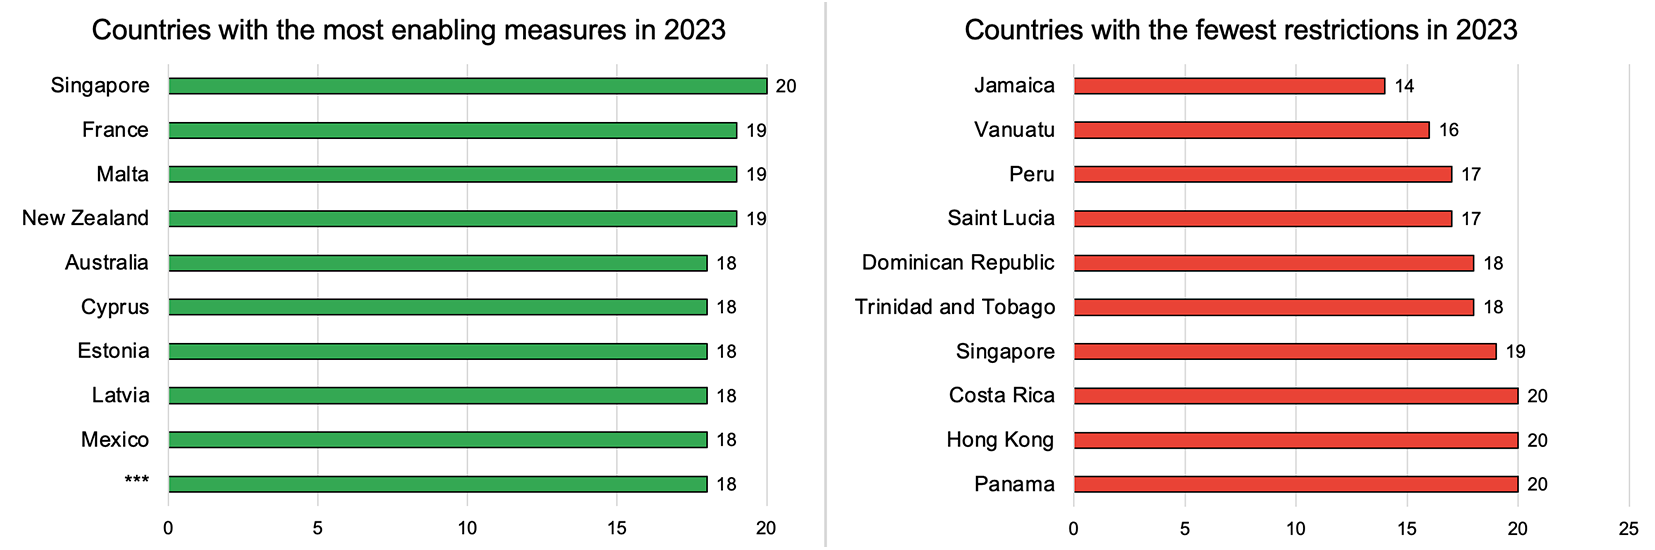
Figure 6 provides more granular information about the ranking of the best-performing countries for digital trade integration, that is, those countries that have enacted the highest number of enabling policies (shown on the left) and the lowest number of policies anticipated to restrict digital trade (shown on the right). In line with the trends presented in Figure 4, high-income economies tend to impose more enabling policies. Singapore leads the list with 20 enabling measures, closely followed by France, Malta, and New Zealand, each with 19 measures. Several European countries, including Cyprus, Estonia, Latvia, Slovakia, Slovenia, and the UK, have implemented 18 enabling measures. In addition to adopting numerous enabling policies, these countries share similarities in the types of policies enacted, reflecting the EU's role in harmonizing intra-regional regulations. Australia, Mexico, and the US have also implemented 18 enabling measures.
Best-performing countries for digital trade integration, 2023

When examining instead countries with the fewest restrictive measures, the ranking changes significantly. Singapore is the only country that remains among the top performers. This is unsurprising given Singapore's proactive role in promoting digital trade through preferential trade agreements and in the context of the WTO.Footnote 62 In addition, we find a notable presence of countries from the Caribbean, Central America, and the East Asia and Pacific (EAP) region. The types of measures implemented reflect varying policy priorities and regulatory environments across regions, as will be further explored in the next subsection. In Latin America, more attention is paid to public procurement (Pillar 2), while in the EAP region, the restrictions are predominantly target data (Pillars 6 and 7).
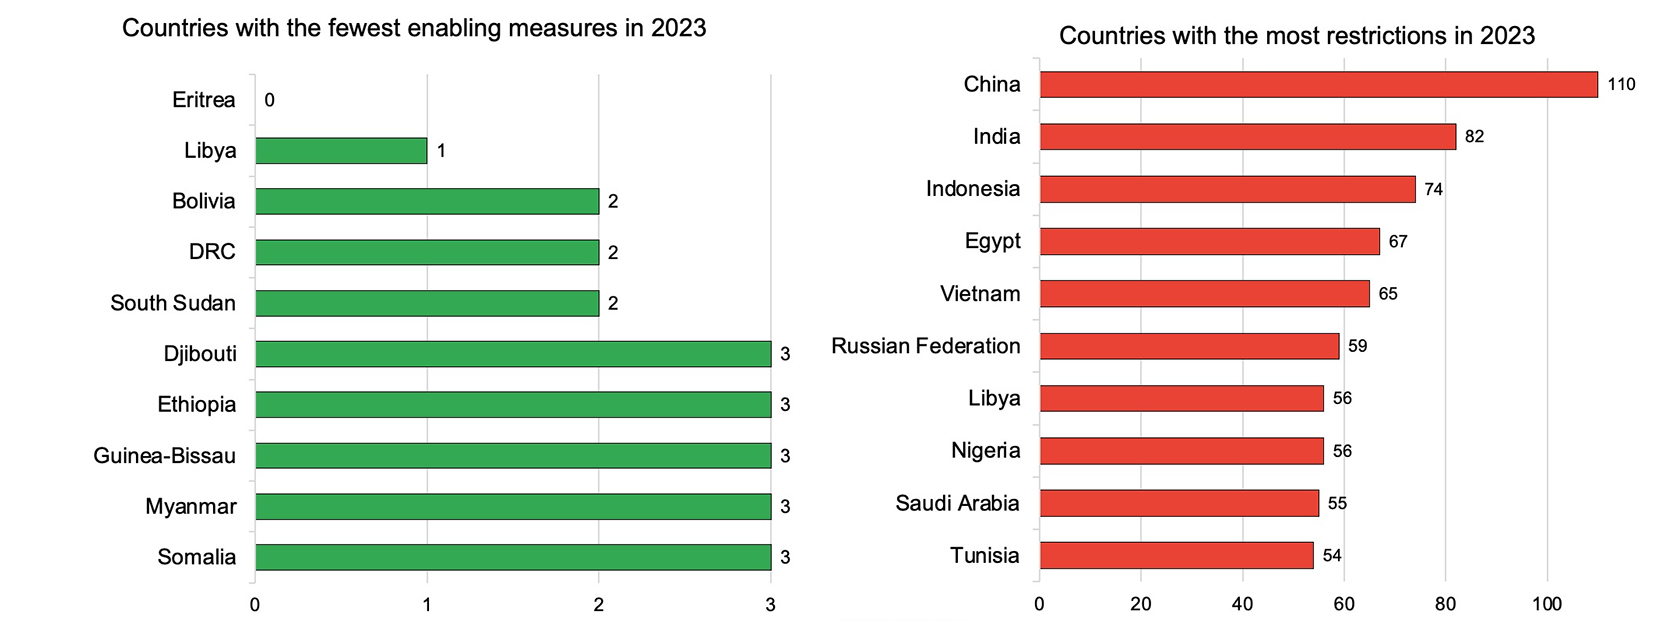
Figure 7 illustrates the opposite side of the rankings, listing countries that impose the fewest enabling policies (left-hand) and the highest number of restrictive policies (right-hand). Eritrea is the only country in the DTI database that has not implemented any enabling policies. Except for Libya, all countries that have enacted three or fewer enabling policies are low-income or lower-middle-income economies, in line with the trend shown in Figure 4.Footnote 63 In addition, most of these countries are located on the African continent. This highlights the need for greater support and strategic initiatives to boost digital trade facilitation for lower-income economies.
Worst performing countries for digital trade integration, 2023

With 110 measures, China leads the ranking of countries with the highest number of restrictive policies. The country is especially active in regulating digital services, investment, and data, while it has implemented fewer policies related to trade in ICT goods. This contrasts with the second country in this ranking, India, whose 82 policies primarily target ICT goods, but also, more recently, public procurement and data. Indonesia, the third-ranked country, stands out for its stringent regulation on data use (Pillar 7) and transfer (Pillar 6), as well as public procurement (Pillar 2). This heterogeneity reflects each country's unique regulatory priorities, resulting in a fragmented regulatory framework that companies must navigate when engaging in digital trade.
4.1.1 Policies Applied to ICT Goods
Regarding trade in ICT goods, the database reveals that more than half of the countries (85 out of 146 countries) analysed apply tariffs on ICT goods lower than 5% when considering the weighted average of the effectively applied tariffs (Indicator (Ind.) 1.1). Moreover, 45 countries impose tariffs below the global average of 0.93% for the year 2023. Additionally, 56 countries have a zero-tariff coverage rate exceeding 70% for ICT goods (Ind. 1.2). This trend is linked to the widespread adoption of the Information Technology Agreement (ITA I) (Ind. 1.3), with 69 countries in the dataset having implemented it, thereby removing tariffs on a variety of ICT goods. In addition, 47 countries in our sample signed ITA II (Ind. 1.3), an expansion of ITA I, which further extended the list of goods traded tariff-free.
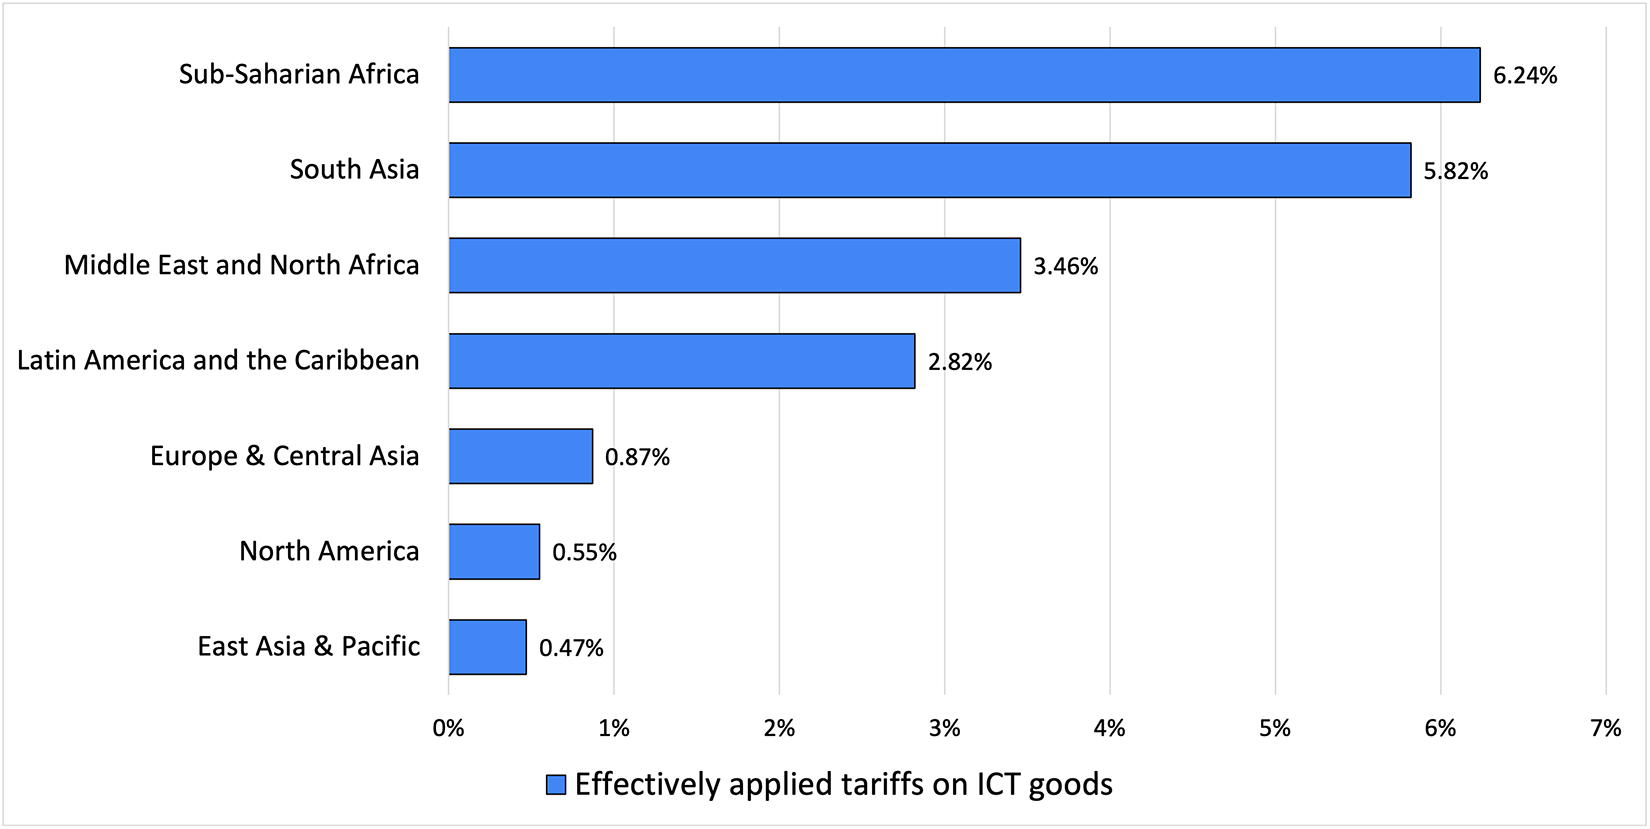
We observe significant heterogeneity in the level of tariffs applied across regions, with the three regions of Europe and Central Asia (ECA), North America (NA), and East Asia and the Pacific (EAP) applying effective tariff rates below 1% on average. In contrast, the average goes above 5% in South Asia (SA) and Sub-Saharan Africa (SSA) (Figure 8).
Effectively applied tariffs on ICT goods (weighted average) by region, 2023

In addition, 106 countries in our sample have implemented a de minimis threshold, which is a level below which duties are not charged at the border (Ind. 12.5). The threshold levels vary greatly in our sample, with only 26 countries adopting a value above the USD 200 value recommended in the International Chamber of Commerce (ICC) guidelines to facilitate e-commerce transactions.Footnote 64 Conversely, 80 have implemented a de minimis threshold below this value or have introduced some conditions to benefit from this regime.
The DTI database contains a diverse array of additional measures that affect trade in ICT goods, including import bans (Ind. 10.1), product screenings (Ind. 11.3), and complaints about the lack of transparency for import procedures (Ind. 10.2). Noteworthy is the rising trend in policies pertaining to telecom equipment, including product screening, non-automatic licensing procedures, and import bans.
4.1.2 Policies Applied to Digital Services
Among the policies likely to restrict the delivery of digital services, the DTI database includes two indicators related to blocking of commercial web content (Ind. 9.1) and internet shutdowns (Ind. 9.2). As many as 54 countries have restricted access to certain commercial web content in 2023. Although these policies are less restrictive than Internet shutdowns, they nevertheless create uncertainty for online service providers. Services that are more commonly blocked include social media, VPNs, and online news. Furthermore, 48 countries have restricted the availability of the Internet in 2023. This is a worrying trend as these measures entail a shutdown of the Internet, resulting in the impossibility of providing any digital services in the affected areas. Figure 9 offers an overview of the frequency of government-led Internet shutdowns in 2023 for the countries in the DTI database, showing that this practice is particularly prevalent in specific regions. The highest levels of activity are observed in SSA, the MENA region, and SA. The countries where domestic internet shutdowns were especially frequent in 2023 include Eritrea, Guinea, Myanmar, South Sudan, Sudan, Tajikistan, and Turkmenistan.
Presence of internet shutdowns in 2023

Platforms serve as critical gatekeepers and enablers of digital trade; therefore, several indicators of the DTI database cover policies related to platforms. One of these is the presence of a safe harbour regarding their liability for the user activities (Inds. 8.1 and 8.2). The DTI database indicates that 92 countries apply a safe harbour for intermediaries for copyright infringement (Ind. 8.1), while 79 countries have implemented a safe harbour framework that goes beyond copyright infringement to cover other user activities (Ind. 8.2). The presence of a safe harbour provides legal certainty for internet intermediaries by ensuring that they will not subject to civil or criminal penalties for user activities as long as they comply with the takedown procedures for illegal content set out in the law.
The IPRs regime is also considered a critical enabler for digital trade. The DTI shows that there is widespread adoption of copyright regulation, with only two countries in the sample lacking any regulation related to copyright. Yet only 45 countries adopted exceptions that follow the fair-use or fair-dealing models that provide some flexibility for using copyrighted material (Ind. 4.4). However, 92 countries have adopted both the WIPO Internet Treaties (Inds. 4.6 and 4.7). Policies that require source code disclosure in certain circumstances are becoming more common (Ind. 4.8). In 11 countries, these requirements are accompanied by a commitment of the countries not to disclose further the sensitive information provided by companies. However, in 40 countries, such safeguards are absent, posing a potential operational restriction for businesses. Additionally, 31 countries regulate the use of encryption (Ind. 11.4).
The DTI database also contains information about the adoption of international legal frameworks for electronic communications and commerce, which can enhance interoperability for the provision of digital services across the globe. The United Nations Convention on the Use of Electronic Communications in International Contracts, which provides a legal framework to facilitate the use of electronic communications in international contracts, has been signed and ratified by 11 countries in the database (Ind. 12.9). Furthermore, the UNCITRAL Model Law on Electronic Commerce, adopted by 64 countries in our sample, provides a set of internationally recognized standards to harmonize and modernize laws concerning electronic commerce (Ind. 12.10). It addresses various aspects such as the formation and validity of contracts, the use of electronic records, and the legal recognition of electronic signatures. Lastly, the UNCITRAL Model Law on Electronic Signatures, which establishes guidelines for the legal recognition and use of electronic signatures to ensure their reliability and equivalence to handwritten signatures, has been adopted by 25 countries in the database (Ind. 12.11).
4.1.3 Policies Applied to Foreign Direct Investment
Over half of the economies covered in the DTI database (77 countries) permit full foreign ownership for investment in all sectors relevant to digital trade (Ind. 3.1). The most commonly restricted sectors include telecommunications and media. Restrictions are more prevalent in the MENA and EAP regions, whereas Europe and SSA exhibit fewer restrictions on average. The DTI database also indicates that investment screenings are becoming increasingly common, with only 44 economies in our sample not implementing any screening mechanisms for foreign investment (Ind. 3.4).
As the backbone of the digital economy, a competitive and transparent regulatory environment in the telecom sector is paramount for promoting digital trade. According to the DTI database, 104 economies mandate passive infrastructure sharing (Ind. 5.1), which can reduce network deployment costs, especially in rural areas or marginal markets, stimulate migration to new technologies and mobile broadband deployment, and enhance competition among mobile operators and service providers. Moreover, 48 countries mandate functional separation for operators with significant market power (SMP) (Ind. 5.4). Another noteworthy trend in the telecom sector is that 111 countries have established a telecom authority that is fully independent (Ind. 5.7).
Regarding access to public procurement, often conducted through foreign affiliates, the DTI shows that only 73 countries have a regulatory framework that does not exclude foreigners from public procurement related to ICT goods and digital services (Ind. 2.1). While most policies apply horizontally across all sectors, the DTI database also lists recent regulations specifically targeting digital trade, such as the prohibitions on using foreign software in local tenders and cloud services certification requirements for participation in public tenders. Furthermore, only four countries in our sample are signatories of the WTO Government Procurement Agreement (GPA) and have fully covered the three most relevant service sectors: telecommunication services (CPC 752), telecommunication-related services (CPC 754), and computer and related services (CPC 84) (Ind. 2.4).
4.1.4 Policies Applied to Data
The DTI database provides evidence of the diverse policies that countries impose on the use (Pillar 7) and cross-border transfer of data (Pillar 6). These measures are implemented to respond to different policy priorities, including privacy, security, law enforcement, and digital sovereignty, and can create costs for digital trade.
Figure 10 provides an overview of the restrictions to data flows listed in the DTI database (Inds. 6.1, 6.2, 6.3, and 6.4).Footnote 65 As illustrated, although these restrictions are not a recent development, their prevalence has markedly increased since 2010.
Number of restrictions to cross-border data transfers (2000–2023)

The DTI database categorizes data flow restrictions into four types: (i) bans on transfer and local processing requirements include cases where companies must process data locally (Ind. 6.1); (ii) local storage requirements are policies mandating to store a copy of certain data within the borders of the country (Ind. 6.2); (iii) infrastructure requirements encompass policies that require the use or construction of specific data centres or servers within the country (Ind. 6.3); and (iv) conditional flow regimes under which data transfers abroad are prohibited unless certain conditions are fulfilled (Ind. 6.4). The most prevalent type of data flow restriction in the database are conditional regimes, often resembling the European Union's General Data Protection Regulation (GDPR), which exerted significant influence across the globe. The database contains 141 conditional flow regimes, 106 local processing requirements, 44 local storage requirements, and 18 infrastructure requirements.
A limited number of countries in our sample (15 countries) do not regulate data transfers, while two-thirds of the countries implemented one or two policies restricting data transfers across borders. Only eight countries have implemented more than six restrictive policies on data transfers: China (18 policies), Indonesia (11 policies), Saudi Arabia (nine policies), India (eight policies), the Republic of Korea (seven policies), Turkey (seven policies), Algeria (six policies), and New Zealand (six policies). These policies are diverse, and their impact on trade varies depending on several factors, including the type of restriction, the nature of the data affected, and the sectors covered by the measure. Additionally, the availability of alternative data processing services within the country influences the impact of these restrictions. Figure 11 provides an overview of the number of data flow restrictions implemented by each country.
Number of restrictions to cross-border data transfers by country (2023)

The DTI database also tracks binding commitments regarding data flows undertaken in free trade agreements (FTAs) (Ind. 6.5). In our sample, 51 countries have entered into some form of agreement with binding commitments to facilitate open transfers of data across borders. In addition to the EU’ binding commitments with the UK, the database reveals that 10 countries in the LAC region, 10 in EAP, and both Canada and the United States in North America had made these commitments as of December 2023. In contrast, no countries in the SA, MENA, or SSA regions have undertaken binding commitments.
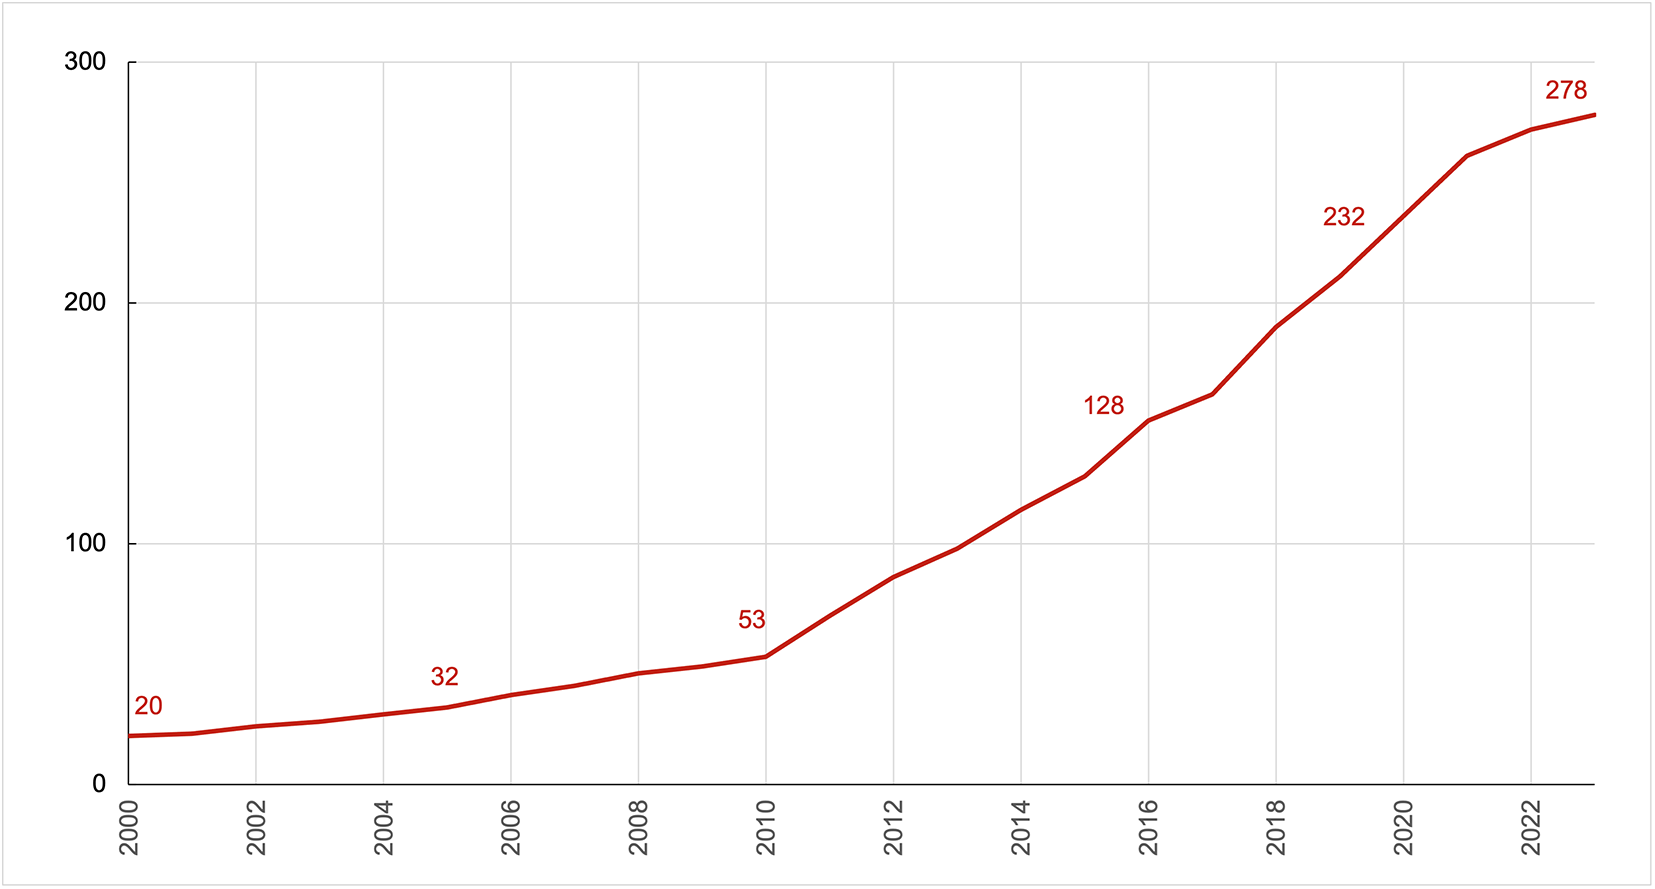
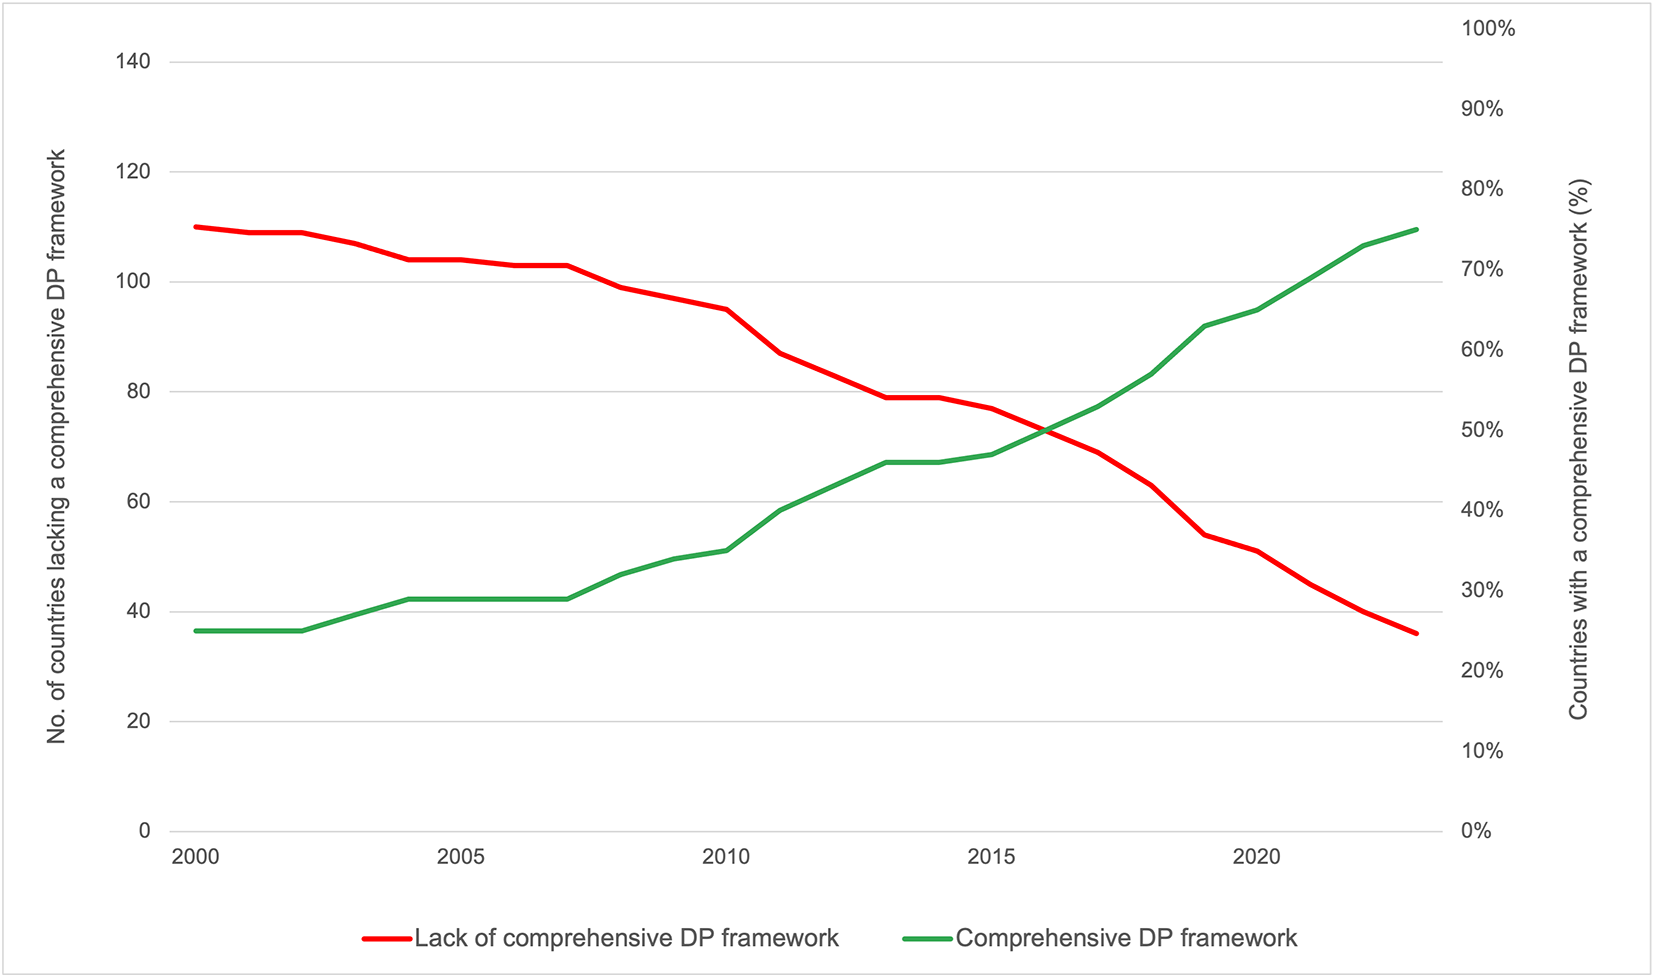
Turning to domestic policies that regulate data usage (Pillar 7), the DTI database shows that 138 have established some rules to regulate personal data, with 107 of these countries implementing a comprehensive data protection regime characterized by extensive data subject rights (Ind. 7.1). Figure 12 illustrates a clear trend of a gradual increase in the number of countries adopting comprehensive data protection regimes over time, which is expected to enhance trust in the digital economy and support digital trade.
Countries with a comprehensive data protection regime (2000–2023)

Another key indicator of the DTI database related to data policies is the presence of requirements that mandate companies to provide the government with access to collected personal data without a court order (Ind. 7.4). This requirement is particularly common in the EAP region and is expected to undermine the trust of online users, thereby affecting the ability of firms to engage in digital trade.
4.2 Regional Trends
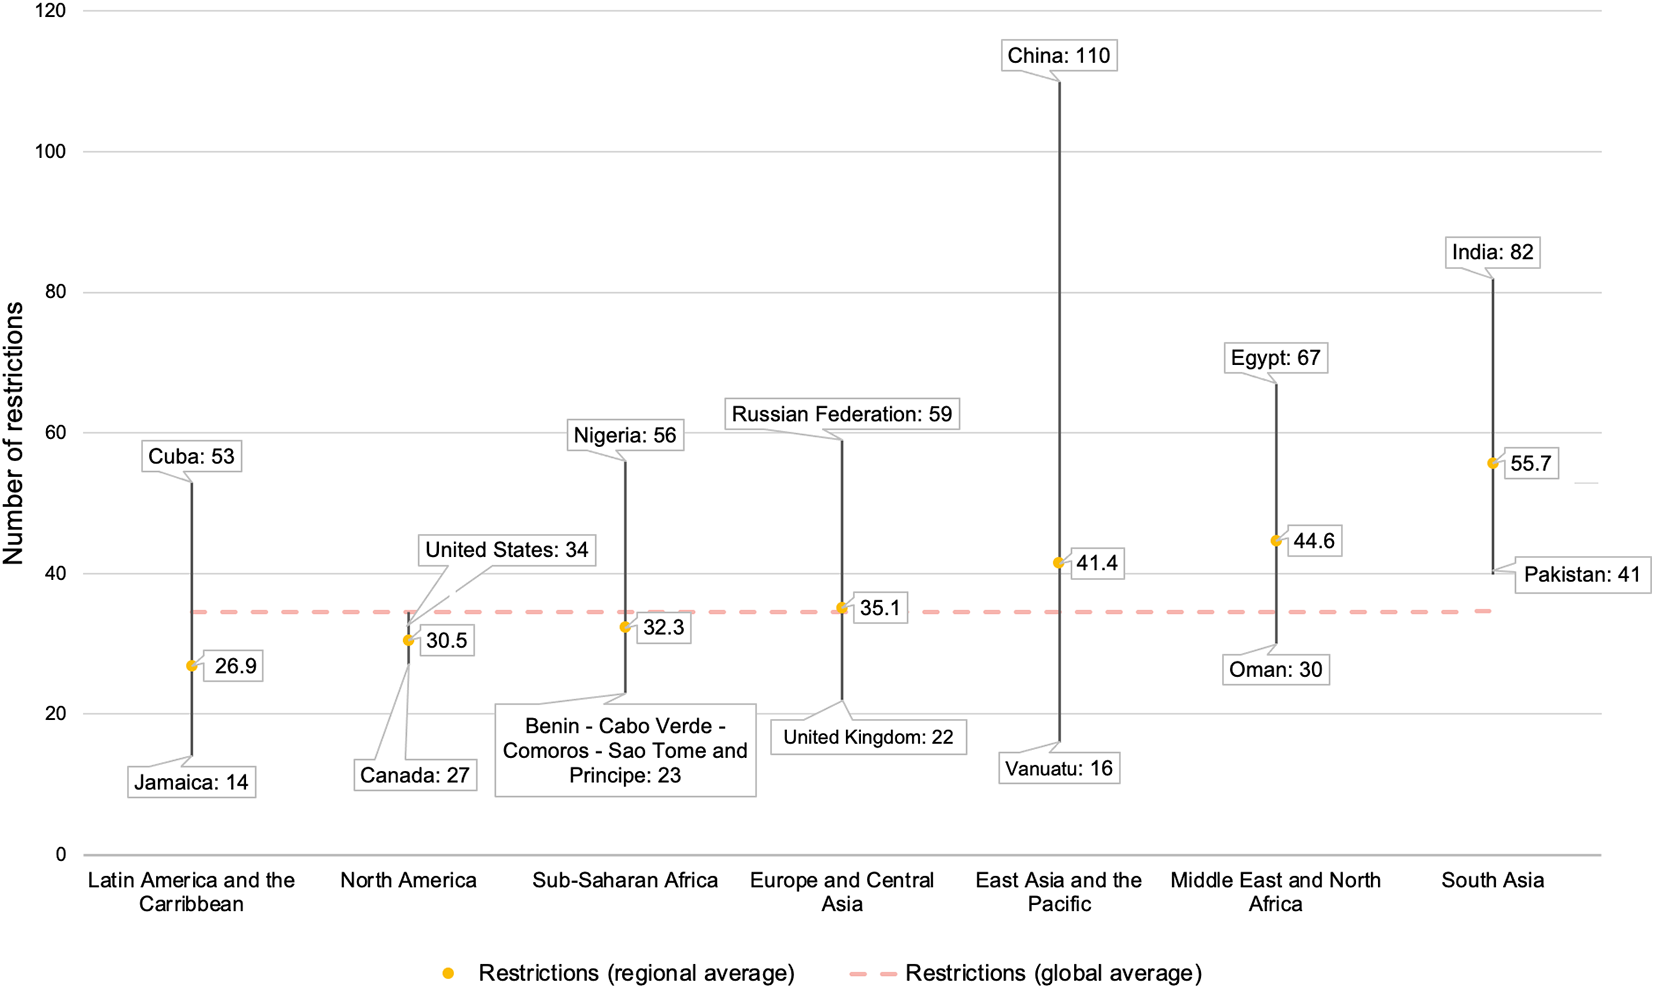
A regional analysis of the DTI measures that are expected to restrict digital trade shows extensive heterogeneity within and across regions (Figure 13). Countries in the LAC region implement, on average, fewer restrictions, with a regional average of 26.9 restrictions per country, well below the global average of 34.5 policies.Footnote 66 The only five countries in the region that exceed the global average in the number of restrictions are Cuba (53 policies), Brazil (43 policies), Venezuela (42 policies), Argentina (40 policies), and Bolivia (35 policies). Most of the regulatory activity in the LAC region occurs in public procurement and the telecom sector, which remains not fully open to competition in several countries. Additionally, the DTI database shows that the region is characterized by high levels of copyright piracy.
Average number of restrictions by region (2023)

The North American region also exhibits a limited number of restrictive policies, with an average of 30.5 restrictive policies implemented by the two countries included in the DTI database, namely Canada and the United States. The United States has the highest number of restrictions (34 restrictions), while Canada implemented 27 restrictive policies. Several of these policies apply to public procurement, and neither country is a signatory to the WTO Agreement on Government Procurement (GPA).
Another region characterized by fewer restrictions on digital trade is the SSA region, where countries implement an average of 32.3 policies expected to restrict digital trade.Footnote 67 Nigeria stands out with the highest number of restrictions in the region, with its 56 policies, significantly above the global average. Countries in this region tend to impose restrictions on ICT goods and public procurement. Additionally, these countries have yet to make binding commitments to facilitate cross-border data transfers in preferential trade agreements.
On the opposite side of the spectrum, we find the South Asian region, with 55.7 restrictive policies implemented on average by the three countries in the DTI database: India, Pakistan, and Nepal. India has the highest number of restrictions (82 restrictions), double the number imposed by Pakistan (41 restrictions). The countries in this region exhibit a restrictive environment for ICT goods, marked by several import restrictions and high tariffs. They also tend to limit foreign participation in public procurement, and none are signatories to the WTO GPA. Furthermore, none of these countries effectively enforce copyright online. Lastly, in all three countries, the government holds shares in certain telecom companies, including the incumbent provider.
The second most restrictive region is the MENA region, with 44.6 restrictive policies per country on average,Footnote 68 Egypt imposes the highest number of policies in the region, with 67 policies, while Oman is the country in the region with the fewest restrictions (30 policies). The restrictions primarily affect foreign participation in public procurement, data movement, and the regulation of the telecom sector.
Another region with an average number of restrictions exceeding the global average is the EAP region, which has an average of 41.4 restrictive policies.Footnote 69 This region exhibits the highest heterogeneity, with China implementing 110 potentially restrictive policies, while Vanuatu has only 16. China is a clear outlier in the dataset, as it enforces significantly more policies than Indonesia, the second most restrictive country in the region, with 74 policies. Countries in this region frequently enforce stringent data-related regulations and impose restrictions on foreign participation in public procurement and investment.
Finally, countries in ECA implement an average of 35.1 restrictive measures, slightly above the global average.Footnote 70 There is significant heterogeneity across country groupings within this region. The UK and Norway show a relatively open regulatory environment, with only 22 and 23 restrictive policies, respectively. The countries in the European Union impose on average 33.8 policies. As expected, there is not much heterogeneity within the EU, with restrictions ranging from 28 policies implemented by Slovakia to 43 policies by France. All EU countries impose certain limitations on foreign participation in public procurement, and almost none have adopted the UNCITRAL Model Laws on Electronic Commerce and Electronic Signature. We record significant regulatory activity in the Russian Federation (59 policies), Turkey (49 policies), and certain Central Asian economies, with 48 policies implemented by Kazakhstan, 47 by Turkmenistan, and 43 by Uzbekistan. These countries lack regulatory independence in the telecom sector, implement measures that block access to commercial web content, and lack a comprehensive legal framework addressing intermediary liability.
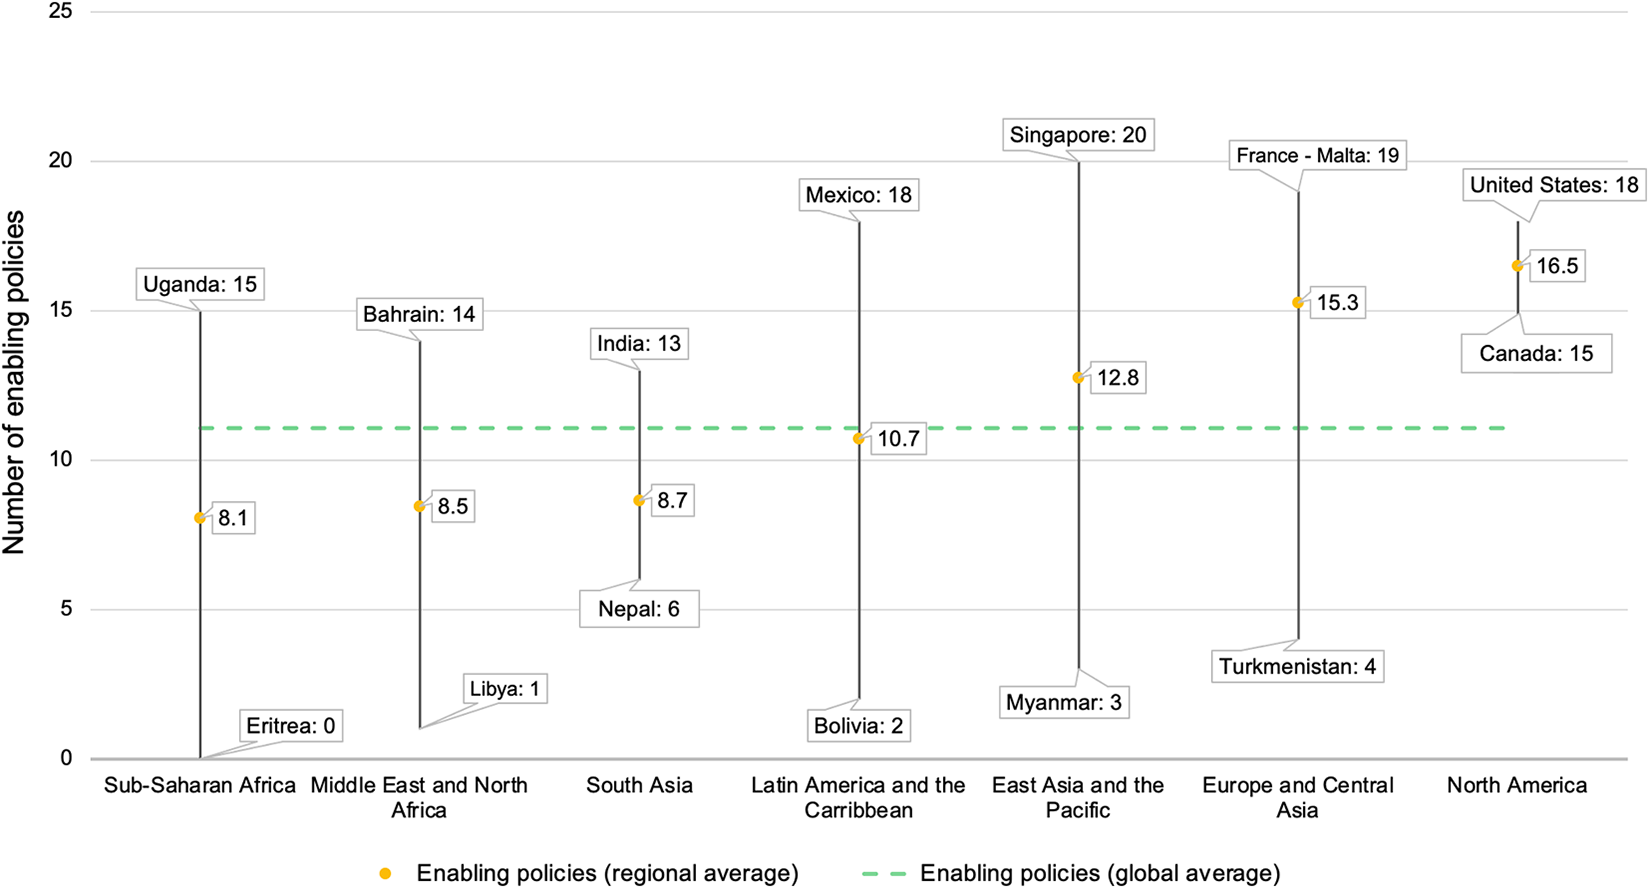
Figure 14 provides a similar regional overview but with a focus on enabling policies. The North American region ranks first, with an average of 16.5 enabling policies per country, well above the global average of 11.1 policies. Both the United States and Canada have implemented policies that create an enabling environment for online sales, including a framework for consumer protection applicable to online commerce, safe harbour mechanisms for intermediaries, and effective protection of IPRs.
Average number of enabling policies by region (2023)

As previously mentioned, the EU has actively implemented enabling policies with 17.1 policies on average, driving the ECA region's regional average up to 15.3 measures. EU Member States, along with the UK and Norway, are largely aligned in adopting enabling measures. Each of these countries has implemented a comprehensive data protection regime and a legal framework that extends consumer protection to online transactions. Furthermore, they all maintain a safe harbour regime for intermediaries and have joined the Patent Cooperation Treaty (PCT), as well as the WTO ITA I and ITA II. In the region, France and Malta are the countries with the highest number of enabling measures, while all Central Asian economies are at the bottom of the ranking. Turkmenistan implemented four enabling measures, followed by Uzbekistan with six measures, Tajikistan with seven, Kazakhstan with eight, and the Kyrgyz Republic with nine measures. Immediately after, we find the two countries between Europe and Asia: the Russian Federation with 10 measures and Turkey with 11 measures.
This region is closely followed by the EAP region, which has an average of 12.8 enabling policies, and the LAC region, which has an average of 10.7 enabling measures. Similarly to the ECA region, the EAP and LAC regions have implemented several enabling policies concerning IPRs. Notably, the four economies in the DTI dataset that joined the WTO GPA with coverage of the most relevant services sectors (CPC 752, 754, 84) are all located in the EAP region: Australia, Hong Kong, New Zealand, and the Republic of Korea. Overall, Singapore, New Zealand, Australia, and Mexico are the best-performing countries in these regions.
The SA, MENA, and SSA regions exhibit the lowest averages for enabling policies. The best-performing economies in these regions are India (13 measures), Bahrain (14 measures), and Uganda (15 measures). Only one country in these three regions has joined both the WTO ITA I and ITA II, namely Mauritius. The ITA I, however, has been joined by the Seychelles in the SSA region, India in the SA region, and most of the countries in the MENA region except for Algeria, Libya, and Tunisia.
5. Conclusions
As digital connectivity increases, and more services become tradable online, international trade is rapidly digitalizing. Consequently, the regulatory environment that facilitates digital trade has emerged as a central aspect of trade policy. Empirical research is essential for informing the design, implementation, and reform of state interventions relevant to digital trade. However, such research heavily relies on the availability of up-to-date regulatory information across various countries. The DTI database contributes to filling the existing gap in the availability of policy information on digital trade to support empirical and policy research in this area. By cataloguing restrictive and enabling measures across 146 countries, the database provides a solid foundation for policymakers and researchers to navigate and assess digital trade policies effectively.
The DTI database offers significant applications for academic research, particularly in analysing regulatory heterogeneity between countries and its impact on trade integration. The literature suggests that regulatory heterogeneity has a negative effect on trade, which adds to the restrictive effects of regulatory policies.Footnote 71 This is particularly relevant for countries with more open regulatory regimes. However, empirical evidence on the impact of regulatory heterogeneity in digital trade regulation remains scarce.Footnote 72 The comprehensive nature of the DTI database can enable scholars to explore how variations in digital trade policies across countries influence global value chains, cross-border data flows, and the development of digital economies. Furthermore, the extensive coverage of countries of the Global South included in the database provides opportunities to investigate challenges specific to these regions. This focus can help identify tailored policy solutions to bridge digital divides and enhance participation in digital trade.
Global trends revealed by the DTI database demonstrate a clear correlation between enabling digital trade policies and higher levels of economic development, while a high number of restrictive measures is often associated with broader limitations on political and civil liberties. This relationship warrants further investigation to identify the international political economy determinants driving digital trade governance. Regional analyses highlight stark disparities, with high-income economies, particularly in Europe, showcasing progressive regulatory environments, whereas many low-income countries face significant challenges in adopting enabling measures.
The findings call for a dual approach: fostering international cooperation to harmonize digital trade regulations and prioritizing capacity-building initiatives in lower-income economies to bridge the digital divide. Our future work will focus on refining the aggregation of measures and keep the methodology up to date to capture the dynamic landscape of digital trade. As the reality of trade evolves, we hope that initiatives like the DTI database can contribute to shaping an equitable and integrated global digital economy.
Acknowledgement
We would like to thank Prof. Andrew Mitchell and the participants of the conferences Mapping and Governing the Online World (June 2024), the European Trade Study Group (September 2024), and the Empirical Investigations in Services Trade (October 2024) for their valuable comments. We are grateful for the support of three additional universities in the CIVICA alliance (Bocconi University, London School of Economics and Political Science, and Hertie School). We would also like to highlight the partnership with the United Nations (UN) Economic and Social Commission for Asia and the Pacific (UN-ESCAP), the UN Economic Commission for Africa (UN-ECA), the UN Economic Commission for Latin America and the Caribbean (UN-ECLAC), the European Center for International Political Economy (ECIPE), the US Department of Commerce, the Trade and Investment in Services Associates (TIISA), and the Digital Cooperation Organization (DCO). Finally, we thank the 87 researchers worldwide who contributed to the data collection over the past four years.
Supplementary material
The supplementary material for this article can be found at https://doi.org/10.1017/S1474745625100955.


 Open access