

1 Introduction
Ideological polarization is a conspicuous but peculiar feature of American democracy. No one is surprised when conservatives and liberals fight over tradeoffs between wealth and equality or between “law and order” and civil liberties. Differences in the value attached to such goods define those political outlooks.
Much more perplexing, however, are the ubiquity and ferocity of ideological conflicts over facts that turn on empirical evidence. Democrats (by and large) fervently believe that human activity is responsible for global warming, Republicans (by and large) that it is not (Pew Research Center, 2012). Conservatives are confident that the wastes generated by nuclear power plants can be safely disposed of by deep geologic isolation; liberals dispute that (Reference Jenkins-Smith, Silva, Nowlin and deLozierJenkins-Smith, Silva, Nowlin & deLozier, 2011). People who value equality and community believe that vaccinating schoolgirls against the human papilomavirus is essential to protecting women’s health—and that permitting private citizens to carry concealed hand guns increases crime. Those who value hierarchy and individualism, in contrast, reply that universal HPV vaccination will undermine young girls’ health by lulling them into unprotected sex, and that gun control increases crime by making it harder for law-abiding citizens to protect themselves (Reference Kahan, Braman, Cohen, Gastil and SlovicKahan, Braman, Cohen, Gastil & Slovic, 2010; Reference Kahan, Braman, Cohen, Gastil and SlovicKahan, 2010).
Political polarization on empirical issues like these occurs not only despite the lack of any logical connection between the contending beliefs and the opposing values of those who espouse them. It also persists despite apparent scientific consensus on the answers to many of these disputed questions (Reference Lewandowsky, Gignac and VaughanLewandowsky, Gignac, & Vaughan, 2012; Reference Kahan, Jenkins-Smith and BramanKahan, Jenkins-Smith & Braman, 2011).
Decision science suggests a range of potential explanations for why dueling assertions of fact occupy frontline positions in U.S. culture wars. It is well established that members of the public rely on heuristics or mental shortcuts that can generate systematic biases in their perceptions of risk and similar facts. They also tend to seek out and assess evidence in biased patterns that reinforce the positions that they, or those who share their ideological predispositions, already hold. Some psychologists maintain, too, that these effects are intensified by dogmatism, aversion to complexity, and like traits that correlate with political conservativism and that make politically conservative individuals distinctively resistant to revising their beliefs based on empirical evidence.
All of these positions are firmly rooted in empirical study, but relatively little testing has been done on how they relate to one another. More than one plausible account exists of how the various dynamics that connect ideology and factual perceptions interact. Empirical testing of these competing surmises is necessary, not only to advance understanding of ideological polarization over policy-relevant facts but also to guide practical action aimed at mitigating it.
This paper reports the results of a study designed to contribute to the necessary testing process. Using both observational and experiment methods, the study examined alternative hypotheses relating to how three psychological dynamics—dual process reasoning, the cognitive style associated with conservativism, and motivated cognition—combine to generate polarization over risks and other policy consequential facts.
2 Empirical and theoretical background
Scholars have identified three important influences that contribute to public controversy over factual questions that turn on scientific and related forms of empirical evidence. This part briefly describes these influences and identifies alternative conjectures about how they interact with one another.
The first dynamic associated with public controversy over policy-relevant facts is heuristic-driven information processing. Long prominent in the study of psychology, dual-process theories posit two modes of information-processing: a “fast, associative” one “based on low-effort heuristics”, and a “slow, rule based” one that relies on “high-effort systematic reasoning” (Reference Chaiken and TropeChaiken & Trope, 1999, p. ix). Many scholars attribute controversy over societal risks to the disposition of members of the public to over-rely on the heuristic-driven, “System 1” (Reference Stanovich and WestStanovich & West, 2000; Reference KahnemanKahneman, 2003) reasoning style. The centrality of visceral, emotion-guided modes of perception can cause laypeople to overestimate the incidence and harm associated with more sensational risks—such as terrorist acts and gun accidents—relative to more remote, less gripping hazards such as climate change and swimming pools. Expert opinion does not reliably correct these distortions because members of the public too often lack the time or ability to engage in the more effortful, more dispassionate “System 2” style of reasoning suited to understanding the technical evidence that experts use to assess risks (Reference Loewenstein, Weber, Hsee and WelchLoewenstein, Weber, Hsee & Welch, 2001; Reference SunsteinSunstein, 2003, 2006a, 2007; Reference WeberWeber, 2006).
The second dynamic that generates conflict over risk issues is motivated reasoning. Motivated reasoning refers to the tendency of people to conform assessments of information to some goal or end extrinsic to accuracy (Reference KundaKunda, 1990; Balcetis & Dunning, 2008; Reference DunningDunning, 1999; Reference Ditto, Pizarro, Tannenbaum and BrianDitto, Pizarro & Tannenbaum, 2009).
The goal of protecting one’s identity or standing in an affinity group that shares fundamental values can generate motivated cognition relating to policy-relevant facts (Reference Cohen, Cohen, West and AikenCohen, 2003; Reference Sherman and CohenSherman & Cohen, 2006). Even among modestly partisan individuals, shared ideological or cultural commitments are likely to be intertwined with membership in communities of one sort or another that furnish those individuals with important forms of support—emotional and psychic as well as material (Reference Green, Palmquist and SchicklerGreen, Palmquist & Schikler, 2002). If a proposition about some policy-relevant fact comes to be commonly associated with membership in such a group, the prospect that one might form a contrary position can threaten one’s standing within it. Thus, as a form of “identity self-defense,” individuals are unconsciously motivated to resist empirical assertions—that the death penalty deters or does not deter murder, for example (Reference Lord, Ross and LepperLord, Ross & Lepper, 1979), or that gun control reduces or does or does not reduce crime (Reference Taber and LodgeTaber & Lodge, 2006)—if those assertions run contrary to the dominant belief within their groups (Reference Cohen, Bastardi, Sherman, Hsu, McGoey and RossCohen, Bastardi, Sherman, Hsu, McGoey, & Ross, 2007; Reference Liu and DittoLiu & Ditto, 2013; Reference Munro and DittoMunro & Ditto, 1997).
The third influence linked to such controversies is the association between ideological or cultural values and cognitive-reasoning styles. Refining the 1950s “authoritarian personality” theory of Adorno and his collaborators (1950), a substantial body of empirical study generated in the last decade has revived interest in, and compelled respectful scholarly engagement with, the hypothesis that right-wing ideology is a manifestation of settled intellectual traits such as dogmatism, aversion to complexity, and a craving for certainty or “closure” in argumentation. The cognitive style that comprises these dispositions, it is surmised, generates reflexive closed-mindedness toward empirical evidence hostile to the factual premises of policies that reflect ideologically conservative values or policy preferences (Reference Jost, Glaser, Kruglanski and SullowayJost, Glaser, Kruglanski & Sulloway, 2003; Reference Jost, Nosek and GoslingJost, Nosek & Gosling, 2008; Reference Feygina, Jost and GoldsmithFeygina, Jost & Goldsmith, 2010).
While all of these positions are amply supported by empirical evidence, how they interact to generate polarization over empirical evidence relevant to societal risks and like facts has not been systematically explored (Reference Jost, Hennes, Lavine and CarlsonJost, Hennes & Lavine, in press). Multiple alternative relationships are all plausible.
It would not be surprising, for example, to discover that the impact of heuristic-driven reasoning is the most decisive one. The predominance of System 1 reasoning among members of the general public, on this view, would account for the failure of democratic institutions to reliably converge on the best available scientific evidence on issues like climate change. Dynamics of motivated cognition would in turn help to explain the ideological character of the resulting public controversy over such evidence. Many of the emotional associations that drive System 1 risk perceptions, it is posited, originate in (or are reinforced by) the sorts of affinity groups that share cultural or ideological commitments (Reference LeiserowitzLeiserowitz, 2005; Reference SunsteinSunstein, 2007). Where the group-based associations that attach to putative risk sources (guns, say, or nuclear power plants) vary, then, we can expect to see systematic differences in risk perceptions across members of ideologically or culturally uniform groups (Reference Weber and SternWeber & Stern, 2011; Reference Lilienfeld, Ammirati and LandfieldLilienfeld, Ammirati, & Landfield, 2009; Reference SunsteinSunstein, 2006b; Reference Marx, Weber, Orlove, Leiserowitz, Krantz, Roncoli and PhillipsMarx, Weber, & Orlove, Leiserowitz, Krantz, Roncoli, & Phillips, 2007; Reference Westen, Blagov, Harenski, Kilts and HamannWesten, Blagov, Harenski, Kilts, & Hamann, 2006). For expositional convenience, this account of how heuristic information processing, ideological predispositions, and motivated reasoning interact will be referred to as the “Bounded Rationality Position” (BRP).
An alternative position might see the reasoning-style correlates of right-wing ideology as the most consequential for disputes over decision-relevant science. Like BRP, this position would regard motivated cognition as a heuristic-driven form of reasoning. The mental dispositions that researchers have identified with conservative ideology—dogmatism, need for closure, aversion to complexity, and the like—are understood to indicate a disposition to rely predominantly on System 1 rather than more effortful System 2 forms of information processing (Stanovich, 2011, pp. 34-35). Accordingly, the impact of ideologically motivated cognition, even if not confined to conservatives, would be disproportionately associated with that ideology by virtue of the negative correlation between conservativism and the traits of open-mindedness and critical reflection that would otherwise check and counteract it (Reference Jost, Hennes, Lavine and CarlsonJost, Hennes, Lavine, in press; Reference Nam, Jost and BavelNam, Jost & van Bavel, 2013).
Because it predicts that motivated reasoning will be uneven across the ideological spectrum, this account can, for expositional convenience, be referred to as the “Ideological Asymmetry Position” (IAP). Relatively little experimental work specifically testing IAP exists at this point. It is mixed, with some scholars reporting results that suggest conservative subjects display greater resistance to engaging counter-attitudinal evidence than liberals do (Reference Nam, Jost and BavelNam et al., 2013), but others finding that motivated reasoning can skew perceptions—including ones formed on the basis of brute sense impressions (Reference Kahan, Peters, Wittlin, Slovic, Ouellette, Braman and MandelKahan, Hoffman, Evans, Rachlinski, & Braman, 2012)—symmetrically across groups of diverse cultural and political orientations (Reference Crawford and XhambaziCrawford & Xhambazi in press; Reference CrawfordCrawford, 2012).
Finally, another position might treat identity-protective motivated reasoning as primary in significance. When individuals display identity-protective cognition, their processing of information will more reliably guide them to perceptions of fact that are congruent with their membership in ideologically or culturally defined affinity groups than to ones that reflect the best available scientific evidence (Reference Kahan, Jenkins-Smith and BramanKahan et al., 2011). Nevertheless, this form of information processing, when applied to the sorts of facts at issue in polarized policy disputes, will often make ordinary individuals better off, in terms of self-interest (Reference Kahan, Peters, Wittlin, Slovic, Ouellette, Braman and MandelKahan, Peters, Wittlin, Slovic, Ouellette, Braman, & Mandel, 2012). Any mistake an individual makes about the science on, say, the reality or causes of climate change, the disposal of nuclear wastes, or the effectiveness of an assault-rifle ban in deterring mass shootings will not affect the level of risk for her or for any other person or thing she cares about: Whatever she, as a single individual, does and can do—as consumer, as voter, as participant in public discourse—will be too inconsequential to have an impact (Reference DownsDowns, 1957). But, insofar as competing positions on these issues have come to express membership in and loyalty to opposing social groups, a person’s formation of a belief out of keeping with the one that predominates in hers could mark her as untrustworthy or stupid, and thus compromise her relationships with others (Reference Cohen, Cohen, West and AikenCohen, 2003). These consequences could substantially diminish her welfare—materially and psychically (Reference Sherman and CohenSherman & Cohen, 2002; Reference Akerlof and KrantonAkerlof & Kranton, 2000; Reference HillmanHillman, 2010).
If we imagine that socially adaptive pressures will favor reasoning styles that maximize this form of “expressive utility” (Reference GigerenzerGigerenzer, 2000), we might, on this account, expect the use of more effortful, System 2 forms of information processing to magnify, not mitigate, ideological differences. Individuals disposed to resort to heuristic-driven, System 1 cognitive processing should not have too much difficulty fitting in: Conformity to peer influences, receptivity to elite cues, and sensitivity to intuitions calibrated by the same will ordinarily guide them reliably to stances that cohere with and express their group commitments (Reference ZallerZaller, 1992; Reference Gastil, Braman, Kahan and SlovicGastil, Braman, Kahan & Slovic, 2011). But if individuals are adept at using more effortful, System 2 modes of information processing, then they ought to be even better at fitting their beliefs to their group identities. Their capacity to make sense of more complex forms of evidence (including quantitative data) will supply them with a special resource that they can use to fight off counterarguments or to identify what stance to take on technical issues more remote from ones that that figure in the most familiar and accessible public discussions (Reference Chen, Duckworth and ChaikenChen, Duckworth & Chaiken, 1999). More importantly still, it will make them more likely to understand the significance of competing claims, and related forms of evidence, for the status of their group, and thus be more likely to experience unconscious motivations to form identity-congruent assessments of them.
This account—which for convenience can be labeled the “Expressive Utility Position” (EUP)— inverts the relationship that BRP posits between motivated cognition and dual-process reasoning. Whereas BRP views ideological polarization as evidence of a deficit in System 2 reasoning capacities, EUP predicts that the reliable employment of more effortful, conscious information processing will magnify the polarizing effects of identity-protective cognition (Reference Kahan, Peters, Wittlin, Slovic, Ouellette, Braman and MandelKahan, Peters et al. 2012).
EUP also is inconsistent with IAP. Both BRP and IAP assume motivated reasoning reflects a deficit in the capacity or disposition to engage in effortful information processing of the sort characteristic of System 2. EUP (like BRP) is agonistic on whether reliance on heuristic, System 1 reasoning dispositions will be correlated with ideological or other values. But because EUP asserts that the more effortful, conscious forms of reasoning characteristic of System 2 magnify identity-protective cognition, EUP does not see the correlations featured in IAP as implying that motivated reasoning should be disproportionately concentrated in conservatives.
3 Study: sample, design, and hypotheses
A study was designed to investigate how heuristic-driven information processing, the reasoning-style correlates of conservativism, and motivated cognition interact. The study included both an observational component, which measured the cognitive reasoning dispositions of subjects of diverse ideologies; and an experimental one, which assessed the interaction between cognitive-reasoning dispositions, subjects’ ideologies, and their display of ideologically motivated reasoning. The design of both components was crafted to pit hypotheses distinctive of BRP, IAP, and EUP against one another.
3.1 Sample
Subjects for the study consisted of a nationally diverse sample of 1750 U.S. adults. The subjects were recruited by YouGov, a firm that uses on-line sampling methods suited for academic, political, and commercial public opinion research. The sample was stratified to reflect demographic characteristics, including political outlooks and affiliations, representative of the United States general population. The sample was 54% female, and the average age of the subjects was 52 years. Seventy-six percent of the subjects were white, and 11% African-American. Twenty-eight percent of the sample self-identified as Republican, 36% as Democrat, and 30% as independent. Twenty-five percent identified themselves as either “Liberal” or “very Liberal”: 37% as “Conservative” or “very Conservative”; and 29% as “Moderate.” The mean education level was “some college”; the mean annual income was $40,000 to $49,000. The study was administered in July 2012.
3.2 Observational component
a. Measures.
Subjects furnished standard demographic data. Party self-identification (“dem_repub”) was measured with a seven-point item (“Strong Democrat, Democrat, Independent Lean Democrat, Independent, Independent Lean Republican, Republican, Strong Republican”). Political ideology (“libcon”) was measured with a five-point item (“Very liberal”; “Liberal”; “Moderate”: “Conservative”; “Very Conservative”).
Responses to these two items (standardized and summed (Reference Smith, Reis and JuddSmith, 2000)) formed a reliable aggregate scale (α = 0.82). The scale was constructed so that its center was equivalent to a “neutral” political orientation. This was accomplished by centering the standardized scale components at their ordinal midpoints (“4” for dem_repub, and “3” for libcon) rather than their means and centering the composite scale formed by their sum at its midpoint as opposed to its mean. Labeled “Conserv_Repub,” the scale was centered at “0” to facilitate ease of interpretation, and oriented so that negative values denoted a disposition toward Democratic Party affiliation, and liberal ideology and positive values a disposition toward Republican Party affiliation and conservative ideology.
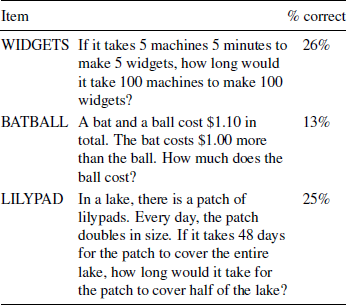
Subjects also completed the Cognitive Reflection Test (CRT). The CRT is a three-question test that is designed to measure the disposition to engage in the conscious and effortful form of information processing associated with System 2 as opposed to the heuristic-driven form associated with System 1 (Reference FrederickFrederick, 2005). A performance-based measure, the CRT has been shown to be a strong predictor of cognitive biases associated with over-reliance on heuristics (Reference Hoppe and KustererHoppe & Kusterer, 2011)—indeed, a stronger one than numerous self-report measures of critical reasoning (Reference Toplak, West and StanovichToplak, West & Stanovich, 2011; Reference Liberali, Reyna, Furlan, Stein and PardoLiberali, Reyna, Furlan & Pardo, 2011).
The CRT is a demanding test, and it is not unusual for a high proportion of a general population sample to answer none of the questions correctly (Reference Weller, Dieckmann, Tusler, Mertz, Burns and PetersWeller, Dieckmann, Tusler, Mertz, Burns & Peters, 2012; Reference Campitelli and LabollitaCampitelli & Labollita, 2010). The mean score for subjects in this study was 0.65 (SD = 0.95).
b. Hypotheses.
As will be explained presently, results from the observational component of the study furnish maximum insight in conjunction with those of the experimental component. However, IAP suggests one fairly straightforward hypothesis relating to the observational study considered alone: that a “right-wing” outlook should be associated with a lower CRT score.
IAP is based on survey correlations between self-identifying as “Republican” or “conservative” and traits such as dogmatism, fear of complexity, and need for closure (Reference Jost, Glaser, Kruglanski and SullowayJost et al., 2003). Because these reasoning traits are opposed to reflection and related forms of critical thinking, one might expect a right-wing disposition to be negatively correlated with performance on the CRT. Indeed, researchers who study cognition routinely treat CRT scores as a performance-based alternative to or “behavioral” corroborator of the same self-report measures featured in research that identifies conservative ideology as distinctively hostile to reflective engagement with counter-attitudinal evidence (Reference Stanovich, West, Toplak, Evans, Manktelow, Over and ElqayamStanovich, West & Toplak, 2011, p. 348 n.5; Reference Pennycook, Cheyne, Barr, Koehler and FugelsangPennycook Cheyne, Barr, & Koehler, 2013; Reference Boschetti, Richert, Walker, Price and DutraBoschetti, Richer, Walker, Price, & Dutra, 2012; Reference Iyer, Koleva, Graham, Ditto and HaidtIyer, Koleva, Graham, Ditto, & Haidt, 2012; Reference Pennycook, Cheyne, Seli, Koehler and FugelsangPennycook, Seli, Koehler, & Fugelsang, 2012).
Researchers investigating parallel claims about religiosity—that it is either a consequence or a cause of aversion to complexity, fear of uncertainty, and resistance to reflectively engaging with counter-attitudinal evidence—have reported finding that religiosity is negatively correlated with CRT (Reference Pennycook, Cheyne, Barr, Koehler and FugelsangPennycook et al., 2013; Reference Shenhav, Rand and GreeneShenhav, Rand & Greene, 2011; Reference Pennycook, Cheyne, Seli, Koehler and FugelsangPennycook Cheyne, Seli, Koehler & Gugelsang, 2012; Reference Gervais and NorenzayanGervais & Norenzayan, 2012). A finding that conservative ideology is negatively associated with CRT as well would thus help corroborate the literature on which IAP is based.
Only a modest amount of work exists on the relationship between CRT and political ideology, but it is consistent with the IAP hypothesis. Two studies report finding CRT scores to be slightly lower in self-identified conservatives than in self-identified liberals (Reference Iyer, Koleva, Graham, Ditto and HaidtIyer et al., 2012; Reference Pennycook, Cheyne, Seli, Koehler and FugelsangPennycook et al., 2012).
Both of these studies, however, were based on non-representative samples. The subjects in the study reported in Reference Iyer, Koleva, Graham, Ditto and HaidtIyer et al. (2012) were recruited from visitors to a web site that features research on the relationship between political outlooks and cognitive styles. As an incentive to participate, subjects were told they would be supplied with a permanently maintained moral personality “profile” that would enable them to compare their scores on various measures to those of other participants, past and future. One might expect subjects visiting such a site and responding to such an offer to overrepresent highly reflective individuals. Indeed, study subjects of all ideologies achieved remarkably high mean CRT scores (Reference Iyer, Koleva, Graham, Ditto and HaidtIyer et al., 2012, Table 3)—ones that not only exceeded those observed in general population samples but that matched or exceeded those recorded among students at elite universities such as Carnegie Mellon, Princeton, and Harvard (Reference FrederickFrederick, 2005, Table 1). Thus, one could reasonably question whether data from a sample this distinctive supports inferences about the relationship between cognitive style and political outlooks in the public at large.
The sample in Reference Pennycook, Cheyne, Seli, Koehler and FugelsangPennycook et al. (2012) consisted of members of Amzaon.com’s “Mechanical Turk” workforce. Such samples, which are assembled without any recruitment or stratification procedures to assure representativeness, have been reported to be highly skewed toward liberal respondents (Reference Richey and TaylorRichey & Taylor, 2012). The sample in Reference Pennycook, Cheyne, Seli, Koehler and FugelsangPennycook et al. (2012, p. 5) reflected such a skew.Footnote 1 It is at least possible that a sample drawn from this source, members of whom engage in myriad highly routinized tasks for an average wage of $1.40 per hour (Reference JaquetJaquet, 2011), might underrepresent reflective conservatives. Researchers have also reported that many Mechanical Turk study subjects have been exposed to objective performance measures like those featured in CRT on multiple occasions (Reference Chandler, Mueller and PaolacciChandler, Mueller, & Paolacci, 2013), an experience that might render their scores unreliable. Finally, there is reason to believe that Mechanical Turk workers routinely misrepresent their nationality: Researchers report that “substantial” numbers of Mechanical Turk workers recruited for studies open only to U.S. “workers” nevertheless participate in them through foreign internet service providers (Reference Shapiro, Chandler and MuellerShapiro, Chandler & Mueller, 2013). For these reasons, one might also reasonably question whether studies based on Mechanical Turk workers support reliable inferences about cognitive style and ideology in the U.S. general population.
In sum, the negative correlations between CRT and conservativism reported in Reference Iyer, Koleva, Graham, Ditto and HaidtIyer et al. (2012) and Reference Pennycook, Cheyne, Seli, Koehler and FugelsangPennycook et al. (2012) are definitely plausible and very much consistent with the reported correlations between conservativism and cognitive style in the scholarship that supports IAP. But it remains useful to explore the relationship between CRT and ideology in samples recruited and stratified to assure national representativeness. The absence of such a finding would be surprising and would complicate interpretation of the finding that conservativism is negatively associated with various subjective measures of heuristic information processing.
A finding that CRT scores correlate with conservative ideology in the general population would have inconclusive significance for BRP and EUP. BRP does not suggests any basis to expect an ideological asymmetry in the dynamics that result in political conflict over policy-consequential facts, but does not necessarily rule it out. EUP, in contrast, does assert that such dynamics should be symmetric. However, it does not identify the source of ideological conflict over fact with the predominance of heuristic-driven, System 1 forms of information processing.
3.3 Experimental component
a. Stimuli and measures.
In the experimental component of the study, subjects reported their own perceptions of the validity of the CRT upon completion of it. They did so by indicating (on a six-point item) their level of agreement or disagreement with the statement “I think the word-problem test I just took [i.e., the CRT test] supplies good evidence of how reflective and open-minded someone is” (CRT_valid).Footnote 2
Subjects responded to this item after being assigned to one of three experimental conditions. In the “control” condition, subjects were advised simply that “psychologists believe the questions you have just answered measure how reflective and open-minded someone is.” In the “skeptic-is-biased” condition, subjects were told in addition that “in one recent study, a researcher found that people who accept evidence of climate change tend to get more answers correct than those who reject evidence of climate change,” a “finding [that] would imply that those who believe climate change is happening are more open-minded than those who are skeptical that climate change is happening.” In contrast, in the “believer-is-biased” condition, subjects were advised that “in one recent study, a researcher found that people who reject evidence of climate change tend to get more answers correct than those who accept evidence of climate change,” a “finding [that] would imply that those who are skeptical climate change is happening are more open-minded than those who believe that climate change is happening.”
b. Hypotheses.
Because open-mindedness is a positive characteristic, individuals presumably have an emotional stake in believing that people who subscribe to their own ideology are more open-minded and reflective, or at least not less, than those who subscribe to an opposing one. Here subjects were presented evidence relevant to that issue: the respective performance on an “open-mindedness test” of people who either accepted or rejected a position strongly associated with membership in the subjects’ own ideological groups. The subjects were in fact supplied relatively spare information about the validity of CRT: only the representation that psychologists view it as valid, plus the subjects’ own experience in having just taken it. The prospect that they would engage in motivated reasoning, though, supplied a basis for believing they would treat that evidence as establishing the test’s validity conditional on whether doing so would gratify or disappoint their stake in believing that members of their ideological group were more open-minded than members of an opposing one (Reference Cohen, Cohen, West and AikenCohen, 2003).
At a very concrete level, this design can be viewed as a model of how ordinary people process information about studies of the ideological correlates of cognitive reasoning styles (e.g., Reference MooneyMooney 2012). Such readers will have little to go on besides scholars’ or commentators’ representations that the tests of open-mindedness featured in such studies are valid. If such readers are inclined to credit such representations only when the studies’ results gratify their interest in forming and maintaining the belief that people who share their own ideology are more open-minded, then their assessments of that research will itself be biased by ideologically motivated reasoning.
But, abstracting from the particulars, the study design can be also thought of as modeling how ideologically motivated reasoning might bias considerations of empirical evidence generally. On policy debates over matters as diverse as climate change, gun control, the death penalty, and fiscal policy, ordinary citizens are presented with evidence, often in the form of second-hand characterizations of the findings of “scientific studies”. If their assessments of the validity of such evidence is conditional on its fit with their ideological predispositions, then citizens will not converge on the best available evidence but rather will polarize on policy-relevant facts (Reference Lord, Ross and LepperLord, Ross & Lepper 1979; Reference Kahan, Jenkins-Smith and BramanKahan, Jenkins-Smith & Braman, 2011).
BRP, IAP, and EUP all predict motivated reasoning in this study. They generate different hypotheses, however, about the form that such reasoning will take.
IAP predicts that the observed motivated reasoning should be stronger in conservative subjects. Reflecting their disposition toward dogmatism and closed-mindedness, relatively right-wing subjects should be more inclined to see CRT as a valid test in the believer-is-biased condition than in the skeptic-is-biased condition. Scholars who have presented evidence of the cognitive-style correlates of ideology depict more liberal or left-wing individuals as more open-minded and reflective and thus less subject to motivated cognition. Accordingly, in the study, this work would predict that relatively left-wing subjects’ assessments of the validity of CRT should be comparable in both the skeptics-biased and believer-is-biased condition. This finding would be a particularly compelling affirmation of IAP, moreover, in conjunction with a finding in the observational component of the study that right-wing dispositions correlate with a lower CRT score.
BRP understands motivated reasoning to be an artifact of the disposition to use low-level, System 1 information processing. Unlike IAP, BRP does not (or does not necessarily) predict that motivated reasoning will be ideologically asymmetric. But BRP does predict that it will be higher among subjects who score relatively low in CRT than it will be in those who score relatively high. On this account, any ideological polarization observed in the skeptic-is-biased and believer-is-biased conditions should dissipate as CRT increases.
EUP supports predictions strikingly different from those of either IAP or BRP. Not only does EUP fail to predict ideological asymmetry in motivated reasoning. It predicts that the tendency of both right-wing and left-wing subjects to form ideologically congruent assessments of the “validity” of CRT will increase with their CRT scores. All subjects, EUP posits, will experience psychological pressure to fit their perceptions of the CRT’s validity to their interest in believing that members of their group are more open-minded about evidence on climate change. Nevertheless, their success in achieving this end will depend on their comprehension of the questions being posed and their appreciation of what differing answers signify about the open-mindedness of individuals who share their ideologies. Because subjects who are high in CRT assess information more methodically and reflectively, they are less likely to misunderstand the question, and thus less likely to avoid the unconscious pressure to fit their assessments of the evidence at hand to the conclusion that fits their expressive interests.
3.4 Statistical power and missing data
Certain of the competing hypotheses associated with BRP, IAP, and EUP turned on whether or not an observational correlation or experimental effect would be observed. The strength of inferences drawn from “null” findings depends heavily on statistical power. The large size of the sample furnished adequate power to detect even small effect sizes (e.g., r = 0.10) with a probability well over 0.80 at p ≤ .05 (Reference CohenCohen, 1988). As a result, findings of nonsignificance could be equated with lack of effect with low risk of Type II error (Reference StreinerStreiner, 2003). To assure full exploitation of the power associated with the large sample size, missing data were replaced by multiple imputation (King, Honaker, Joseph & Scheve, 2001; Reference RubinRubin, 2004).Footnote 3
4 Results
4.1 Observational component
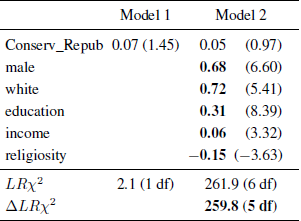
Subjects’ CRT scores were regressed (Table 2) against political orientations and other individual characteristics known to be associated with CRT performance, including gender, race, education, income, and religiosity (which was measured with a composite scale that aggregated self-reported church attendance, frequency of prayer, and perceived importance of God, α = 0.82). The coefficient for Conserv_Repub was positive—indicating that CRT scores increase as subjects become progressively more right-wing in their orientation—but nonsignificant both when treated as a zero-order predictor (b = 0.07, p = 0.15) and when included in a model that controlled for other characteristics (b = 0.05, p = 0.33). The other characteristics, in contrast, all showed significant, independent effects on CRT scores (Table 2).
The Conserv_Repub scale is a more reliable measure of the subjects’ ideological dispositions than either of its components alone, and thus supports more reliable inferences about the relationship between political outlooks and CRT scores (Reference Gliem and GliemGliem & Gliem, 2003). Nevertheless, to promote comparability of the results reported in this study and ones that use only a single political orientation measure, the relationships between subjects’ scores and aspects of each component of Conserv_Repub were also examined.
The correlation with self-reported liberal-conservative ideology (libcon) was negative—indicating a decline in score as conservativism increases. The size of the effect, however, was only trivially different from zero and statistically nonsignificant (rs = -0.02, p = 0.45). When the subjects who self-identified as “Moderates” were excluded, and the remainder split into groups who identified as either “Very liberal” or “Liberal,” on the one hand, or “Very conservative” or “Conservative,” on the other, there was a slightly larger but still statistically nonsignificant difference (ΔM = 0.09, t = 1.41, p = 0.16) in the mean scores of “liberals” (M = 0.75, SEM = 0.05) and “conservatives” (M = 0.67, SEM = 0.04).
The correlation with self-reported party affiliation (rs = 0.08, p < 0.01) was positive and significant, indicating that CRT scores increased with the strength of subjects’ identification with the Republican party on dem_repub, the 7-point measure of partisan identification. When subjects who self-identified as either “Independents” or “Independents” who “lean” either Democrat or Republican were removed, and the remainder split into ones who identified as either “Democrat” or “Republican,” the difference in the mean score of “Republicans” (M = 0.66, SEM = 0.04) and “Democrats” (M = 0.52, SEM = 0.03) was also statistically significant (ΔM = 0.14, t = 2.48, p < 0.05). The gap between “Republicans” (M = 0.71, SEM = 0.04) and “Democrats” (M = 0.59, SEM = 0.03) remained statistically significant (Δ M = 0.13, t = 2.54, p < 0.05) when the scores of subjects who identify as “Independents” but “lean” toward one or the other of the major parties were treated as partisans (Reference PetrocikPetrocik, 2009).
Based on work relating personality-trait and self-reported measures of cognitive style to ideology, IAP predicted that CRT scores would be negatively correlated with right-wing ideology. This hypothesis was not confirmed.
4.2 Experimental component
a. Ideologically motivated reasoning generally.
Consistent with BRP, IAP, and EUP, subjects displayed ideologically motivated reasoning in their assessments of the validity of the CRT (Figure 1, Panel (A)). In the control condition, right-wing and left-wing subjects (identified by their scores relative to the mean on Conserv_Repub), formed comparable judgments of the validity of the CRT as a measure of how “reflective and open-minded” people are (M = 3.0, SEM = 0.2, for both; ΔM = 0.08, t = 0.59, p = 0.56). Those assigned to the “skeptic-is-biased” condition, in contrast, divided on ideological lines: right-wing subjects were less inclined to treat the CRT as valid (M = 2.4, SEM = 0.2), and left-wing ones more inclined to do so (M = 3.5, SEM = 0.2), when told that climate-change skeptics generally score lower on the test. This effect was reversed in the “believer-is-biased” condition: told that climate skeptics generally score higher on the test, relatively right-wing subjects were now more inclined (M = 3.1, SEM = 0.2), and relatively left-wing ones less, to judge the CRT to be valid (M = 2.6, SEM = 0.2).
Graphical summary of experimental results. Locally weighted regression, applied separately for each experimental condition, plots the relationship between the political outlooks and responses to CRT_valid. Panel (A) plots responses for all study subjects. Panels (B), (C), and (D) plot results only for study subjects with CRT scores of 0, 1, and 2 or 3, respectively. Conserv_Repub, the scale used to measure the subjects’ political outlooks, is centered at the point corresponding to a subject who self-identified as a “moderate” on the 5-point liberal-conservative ideology scale and as an “Independent” (who declined when “pushed” to “lean” toward either party) on the 7-point partisan-self-identification scale. Individuals who identified themselves as either “liberal” and “Democrat” or as “conservative” and “Republican” would have scored -0.95 and 0.95 on Conserv_Repub, respectively. The extreme values on the scale— -1.65 and 1.65, respectively—correspond to the scores of individuals who identified themselves as “Very liberal” and “Strong Democrat” and “Very conservative” and “Strong Republican,” respectively.

b. Symmetry.
Figure 1 plots subject responses using a locally weighted regression smoother. This technique, which traces the profile of the data in detail without making any particular assumptions about their distribution, is an appropriate device both for graphical summary assessments of the raw data and for determining the appropriate form (linear or curvilinear) of the statistical model to apply in analyzing them (Reference JacobyJacoby, 2000).
Visual inspection of Figure 1 does not suggest that the observed motivated-reasoning effect increased as subjects became more right-wing. Indeed, liberal Democratic subjects were inclined to discount the validity of the CRT in the “believer-is-biased” condition relative to the “skeptic-is-biased” condition (ΔM = 0.86, t = 6.37, p < 0.01) by an amount slightly but nonsignificantly larger (ΔM = 0.11, t = 0.57, p = 0.57) than the amount by which conservative Republican ones were inclined to discount it in “skeptic-is-biased” condition relative to the “believer-is-biased” one (ΔM = 0.75, t = 5.39, p < 0.01).Footnote 4
c. Interaction with CRT.
The final experimental hypotheses were BRP’s prediction that ideological polarization should abate as individuals become more disposed to use System 2 processing and EUP’s prediction that motivated reasoning would instead increase. As is evident in Panels (B)−(D) of Figure 1, the tendency of subjects (varying in political dispositions) to form ideologically congenial assessments of the validity of the Cognitive Reflection Test became progressively more pronounced as subjects’ CRT scores increased. The effect appears most dramatic in the “believer-is-biased” condition.
To confirm and test the statistical significance of this effect, a regression model reflecting the interaction of CRT and subjects’ ideological dispositions was fit to the data. The results are reported in Table 3, Model 2. This model fit the data significantly better than one lacking terms reflecting the hypothesized interaction (ΔLR χ2 = 12.64(6), p = 0.01). The coefficient for the interaction term added to assess the relationship between CRT scores and assignment to the “believer-is-biased” condition (Con_Rep_x_zCRT_x_believer), was positive and significant (b= 0.30, p < 0.01). Thus, in the “believer-is-biased” condition, subjects of opposing ideologies polarized to a greater extent as their CRT scores increased. The coefficient for the interaction term added to assess the relationship between CRT scores and assignment to the “skeptic-is-biased” condition (Con_Rep_x_zCRT_x_skeptic) was only trivially different from zero and nonsignificant (b = −0.03, p = 0.76). Thus, in the “skeptic-is-biased” condition, the degree of ideological polarization did not meaningfully vary in relation to subjects’ CRT scores.

Graphic illustration enables practical assessment of this interaction effect. Figure 2 plots the predicted probability that subjects of opposing political outlooks with either “low” or “high” in CRT scores would agree (either slightly, moderately, or strongly) that the CRT is a valid measure of open-mindedness in each of the experimental conditions. The estimates were formed using regression Model 2 in Table 3. For “Liberal Democrat” and “Conservative Republican,” the value assigned to Conserv_Repub was set at the level a subject would have scored had she selected either “liberal” and “Democrat” or “conservative” and “Republican” on the 5-point liberal-conservative ideology and 7-point partisan self-identification items, respectively. For “low CRT,” the value assigned to the CRT predictor was 0 correct, a score that would place those individuals in the bottom 60% within the sample. For “high CRT,” the predictor was set at 2 correct, a score matched or exceeded by 20% of the sample.
Interaction between CRT and experimental treatment. Derived via Monte Carlo simulation (Reference King, Tomz and WittenbergKing, Tomz & Wittenberg, 2000) from regression model reported in Table 3, Model 2. Point estimates indicate predicted probability of agreeing either “slightly,” “moderately,” or “strongly” with CRT_valid. The predictor values for “Liberal Democrat” and “Conservative” Republican are -0.95 and +0.95 respectively on Conserv_Repub. The predictor values for “low” and “high CRT” are 0 and “2,” respectively. CIs reflect 0.95 level of confidence.

As can be seen, the impact of CRT performance on motivated reasoning is concentrated in the “believer-is-biased” condition. The difference in predicted probability of judging the CRT to be “valid” in that condition is 28 percentage points (± 19%, CL = 0.95) greater for high-CRT partisans than it is for low-CRT partisans, whose likelihoods of judging the CRT to be “valid” do not meaningfully differ in that condition. Both high-scoring and low-scoring partisans are highly likely to disagree about the validity of the CRT in the “skeptic-is-biased” condition. The likelihood that high-scoring ones will disagree is higher than is the likelihood that low-scoring ones in that condition will, but the difference is modest and not significant at 0.95 level of confidence (8%, ± 11%).
These results are more consistent with EUP than BRP. Whereas the former predicted that motivated reasoning would abate as CRT increases, the latter predicted that it would not but would instead intensify. Such intensification did occur, but only in one of the experimental conditions.
5 Discussion
5.1 Summary of results
The motivation (consciously, at least) for this study was to assess three dynamics understood to be relevant to political contestation over facts that turn on scientific or related forms of empirical evidence: heuristic-driven reasoning, the cognitive-style correlates of political conservativism, and motivated cognition. For that purpose, the study measured the cognitive reflection of individuals of diverse ideologies and also tested how willing they were to entertain evidence that those who disagreed with their ideological group’s position on a charged issue—climate change—were themselves open-minded and reflective.
The study considered three conjectures about how heuristic-driven reasoning, ideological predispositions, and motivated reasoning relate to one another. The first—the “Bounded Rationality Position” or BRP—asserts that public conflict over risk and other policy relevant facts is a consequence of the predominance of heuristic-driven, System 1 information processing, which interferes with the public’s understanding of complicated evidence and motivates it to assess evidence consistently with cultural or ideological predispositions (e.g., Reference Marx, Weber, Orlove, Leiserowitz, Krantz, Roncoli and PhillipsMarx et al. 2007; Reference Weber and SternWeber & Stern, 2011).
The study did not support BRP. On the contrary, the experimental component of the study demonstrated that the disposition to engage in conscious and effortful System 2 information processing—as measured by the Cognitive Reflection Test (CRT)—actually magnifies the impact of motivated reasoning.
The study results were also inconsistent with the “Ideological Asymmetry Position” or IAP. IAP attributes public conflict over policy-relevant facts to an affinity between conservative ideology and traits such as dogmatism and aversion to complexity, which fuel the motivated rejection of evidence incompatible with conservative policy aims (Reference Jost, Glaser, Kruglanski and SullowayJost et al., 2003).
The study findings pose two distinct challenges to IAP. First, the study found no meaningful correlation between right-wing ideology and CRT performance, an objective measure of reflection that has been shown to be one of the strongest predictors of conscious, effortful information processing. The CRT is routinely treated as a “stronger” performance-based alternative to (Reference Pennycook, Cheyne, Barr, Koehler and FugelsangPennycook et al. 2013) or “behavioral” corroborator of (Reference Iyer, Koleva, Graham, Ditto and HaidtIyer et al., 2012) Need for Cognition, Need for Closure, dogmatism, fear of complexity and like measures (Reference Stanovich, West, Toplak, Evans, Manktelow, Over and ElqayamStanovich, West & Toplak, 2011; Reference Boschetti, Richert, Walker, Price and DutraBoschetti et. al., 2012), which are the basis of the research that finds conservatives to be distinctively resistant to counter-attitudinal evidence. The CRT has been used to test and generate evidence supportive of the parallel claim that religiosity is associated with resistance to scientific and other forms of empirical evidence. It is thus puzzling that CRT did not correlate negatively with conservativism (and indeed correlated positively with self-identification with the Republican Party) in the large nationally representative sample used in this study. This result is at odds with those based on nonrepresentative samples.
Second, this study used an experimental design and a statistical-testing strategy specifically fitted to evaluating the assumption that the force of ideological motivated reasoning varies in intensity across the right-left political spectrum. It found that, when assessing evidence of the other group’s propensity to consider evidence in an open-minded and reflective way, liberals and conservatives were uniformly prone to ideologically motivated reasoning. This result reinforces those observed in other studies that have reported finding that motivated reasoning is symmetric across groups of opposing political and cultural outlooks.Footnote 5
The study also examined one other account of political polarization over risk and related policy-relevant facts: the “Expressive Utility Position” or EUP. The study results were largely in accord with this view.
EUP alone predicted both that ideologically motivated reasoning would be symmetric and that it would be amplified by higher CRT scores. Those hypotheses reflect a theory that sees ideologically motivated cognition not as a reasoning deficiency but as a reasoning adaptation suited to promoting the interest that individuals have in conveying their membership in and loyalty to affinity groups central to their personal wellbeing. Because individuals make use of this form of information-processing to protect their stake in all manner of groups—including ones not connected to politics (Reference Sherman and CohenSherman & Cohen, 2006; Reference Hastorf and CantrilHastorf & Cantril, 1954)—there is no reason to expect it to be more pronounced among people who subscribe to any particular ideology. In addition, because this dynamic reliably guides individuals to assign information the significance that advances their personal ends (albeit not their collective ones (Reference KahanKahan, 2012b)), there is good reason to expect it to be used with even greater precision and accuracy by individuals disposed to engage in conscious, effortful forms of information processing.
The only discrepancy between the study results and EUP was the limited scope of the interaction between cognitive reflection and motivated reasoning. Higher CRT scores meaningfully amplified motivated reasoning in only one of the two experimental conditions that presented evidence that was expected to polarize (and did polarize) subjects of opposing political outlooks.
While not hypothesized, this result is not incompatible with EUP. The charge that “climate-change skeptics” are “closed minded” and “biased” is likely more familiar to people than the charge that “climate-change believers” are. The wording of the information furnished to subjects was in fact fairly dense. If subjects low in CRT had difficulty with it or were reluctant to expend the mental effort to parse it, they would have been more likely to misunderstand it when it conveyed the less familiar claim (“believers are closed minded”) than when it conveyed the more familiar one (“skeptics are closed minded”). Subjects with higher CRT scores were more likely to grasp the surprising meaning conveyed by the instruction in the “believer-is-biased” condition, making them more prone than low-scoring ones in that condition to form an appraisal of the test’s validity that conformed to their ideological predispositions.
5.2 Implications for ongoing study of dual-process and motivated reasoning
The status of motivated reasoning within dual process reasoning theories has not been studied extensively by social psychologists. Many commentators have assumed—not implausibly—that ideologically motivated cognition is a manifestation of unconscious, heuristic-driven reasoning processes amenable to being overridden by dispositions that promote reflection and critical engagement with counter-attitudinal evidence (e.g., Reference Lilienfeld, Ammirati and LandfieldLilienfeld et al. 2009; Reference SunsteinSunstein, 2006b; Reference Westen, Blagov, Harenski, Kilts and HamannWesten et al., 2006). The results of this study cast doubt on this claim.
It should be stressed, however, that this result is not in tension with dual-process reasoning theories generally, but only with a particular surmise about how a particular cognitive dynamic should be assimilated to such theories. Indeed, in work that actually predates the adaptation of the now-familiar “System 1/System 2” framework, at least some dual-process theorists took the position that motivated reasoning should be expected to characterize higher-level, systematic forms of cognition as well, particularly when the motivated use of conscious and effortful processing could be expected to advance an agent’s ends in maintaining his or her connection to an identity-defining group (Reference Cohen, Cohen, West and AikenCohen, 2003; Reference Chen, Duckworth and ChaikenChen & Chaiken, 1999; Reference Chaiken and MaheswaranChaiken & Maheswaran, 1994; Reference Giner-Sorolla and ChaikenGiner-Sorrolla & Chaiken, 1997). The current study, by generating evidence that the disposition to engage in effortful information processing can amplify motivated reasoning, is more consistent with the latter position.
Indeed, these findings informed the “expressive utility position” tested in the study. That same hypothesis, moreover, figured in a previous observational study, which found that cultural polarization over climate-change and nuclear-power risks are greatest among individuals who are higher in scientific literacy and in numeracy, a technical-reasoning measure of which CRT is a subcomponent (Reference Kahan, Peters, Wittlin, Slovic, Ouellette, Braman and MandelKahan, Peters et al. 2012). The experimental results of the present study help corroborate the inference that the correlations reported in that earlier study are property attributed to the power of motivated cognition to penetrate the forms of information processing associated with Kahneman’s “System 2” form of reasoning.
Of course, the findings of this single study do not conclusively demonstrate that the disposition to engage in reflective rather than heuristic-information processing invariably magnifies ideologically motivated reasoning. Empirical studies, when valid, merely supply more evidence to believe or disbelieve a hypothesis, the truth of which must be assessed on the basis of all the valid evidence at hand and thereafter reassessed on the basis of any evidence generated by future valid studies (Reference PopperPopper, 1959).
Specific to this particular study, there are many reasons not to consider the issue of ideologically motivated reasoning and reflective information-processing to be “closed”. The most important of these is continuing debate over the adequacy of existing measures of reflective information-processing and critical-thinking dispositions generally. One issue concerns the relative validity of self-reporting measures (such as “Need for Cognition” and “Need for Closure”), on the one hand, and objective measures such as the CRT, on the other.
Another concerns the strength of CRT relative to alternative objective measures. Because CRT is such a demanding test—because it is not uncommon, in a general population sample, for over a third of the sample to get zero answers correct, and for less than 10% to answer all three questions correctly—CRT is of limited value in explaining variance among a large portion of the population. Numeracy is superior to CRT in this respect, and is a stronger predictor of vulnerability to cognitive biases, likely for this reason (Reference Liberali, Reyna, Furlan, Stein and PardoLiberali et al., 2011; Reference Weller, Dieckmann, Tusler, Mertz, Burns and PetersWeller et al., 2012). But as indicated, numeracy too has been found to predict greater, not diminished, political polarization over risks like the ones associated with climate change and nuclear power (Reference Kahan, Peters, Wittlin, Slovic, Ouellette, Braman and MandelKahan, Peters et al., 2012).
Exactly what both CRT and numeracy measure, however, is also contested (Reference Liberali, Reyna, Furlan, Stein and PardoLiberali et al., 2011). In particular, whether either measures critical reflection directly or instead only indirectly—as a correlate of a more general proficiency in mathematical computation or even a general form of intellectual capacity—continues to be debated. Some researchers have concluded that CRT is diagnostic of all manner of critical thinking (Reference Toplak, West and StanovichToplak, West & Stanovich, 2011), including the motivation to re-examine existing beliefs (Reference Campitelli and LabollitaCampitelli & Labollita, 2010; Reference Stanovich, West, Toplak, Evans, Manktelow, Over and ElqayamStanovich, West & Toplak, 2011) associated with the Actively Open-minded Thinking construct (AOT; Reference AdornoBaron, 2008) or reflection/impulsivity (Reference Baron, Badgio, Gaskins and SternbergBaron, Badgio & Gaskins, 1986). But whether CRT indeed measures willingness to revise strongly held beliefs, or does so as well as a measure specifically geared toward AOT, is not resolved. Necessarily unresolved, too, then, is whether a study of motivated reasoning that investigated its interaction with a suitable AOT scale (e.g., Haran, Ritov & Mellers, 2013) would find that the form of critical thinking that scale measures likewise magnifies ideologically motivated reasoning in the manner that CRT, numeracy, science literacy (Reference Kahan, Peters, Wittlin, Slovic, Ouellette, Braman and MandelKahan, Peters et al., 2012), and political knowledge (Reference Arceneaux and JohnsonArceneaux & Johnson, 2013; Reference Taber and LodgeTaber & Lodge, 2006) all do or instead diminishes it (Reference BaronBaron, 1995).
It thus makes sense to continue intensive study of the relationship between ideological polarization and information processing using a variety of measures, a strategy that recognizes the role that convergent validity always plays in insuring against the necessary imperfection of any single measure or method in the social sciences. Indeed, if a variety of measures and methods do converge on the conclusion that ideologically motivated reasoning is impervious to the habits of mind most strongly associated with valid, evidence-based inference, such a program of study is the one most likely to broaden insight into how the conditions that generate an influence this inimical to reason might be counteracted (Reference Fernbach, Rogers, Fox and SlomanFernbach, Rogers, Fox & Sloman, 2013; Reference Lavine, Johnston and SteenbergenLavine, Johnston & Steenbergen, 2012).
5.3 Implications for counteracting ideologically motivated reasoning
The goal of empirically investigating the sources of political conflict over risk and other policy-consequential facts is not merely to explain this phenomenon but also to aid in discovery of devices for mitigating it. The study described in this paper makes a contribution to that end as well.
It does this primarily by helping to inform hypotheses about how such dynamics might be combated. Many scholars have suggested “debiasing” strategies aimed at correcting the distorting effect of System 1 reasoning on public perceptions of risk (Reference Lilienfeld, Ammirati and LandfieldLilienfeld et al., 2009; Reference Jolls and SunsteinJolls & Sunstein, 2006). Because such distortions are real—and substantially interfere with human wellbeing in myriad domains—pursuit of System 1 debiasing techniques is unquestionably important. Nevertheless, if, as the present study implies, ideologically motivated cognition is not a consequence of an over-reliance on heuristic reasoning, then System 1 debiasing strategies should not be expected to abate polarization over climate change, nuclear power, gun control, the HPV vaccine or like issues (Reference Kahan, Slovic, Braman and GastilKahan, Slovic, Braman & Gastil, 2006).
What is needed instead are interventions that remove the expressive incentives individuals face to form perceptions of risk and related facts on grounds unconnected to the truth of such beliefs (Reference LessigLessig, 1995). Extending the analysis of previous papers, this one has suggested that ideologically motivated reasoning is in fact expressively rational at the individual level, because it conveys individuals’ membership in and loyalty to groups on whom they depend for various forms of support, emotional, material, and otherwise (Reference HillmanHillman, 2010; Reference Akerlof and KrantonAkerlof & Kranton, 2000).
This account, however, presupposes that beliefs on risks and related facts bear social meanings—that they are, in fact, generally understood (tacitly, at least) to convey that the individuals who espouse them are committed to one group rather than another (Reference Cohen, Cohen, West and AikenCohen, 2003). Not all risks and policy-relevant facts have this quality; indeed, relatively few do, and on the vast run of ones that do not (e.g., that pasteurization removes infectious agents from milk; that fluoridation of water fights tooth decay; that privatization of the air-traffic control system is inimical to air safety), we do not observe significant degrees of ideological or cultural polarization.
There is little reason to believe, moreover, that the meanings of highly contested facts are insusceptible of revision in a manner that would disconnect particular positions on them from membership in identity-defining groups. One can understand the historical shift in public opinion toward the risks posed by cigarettes (including third-party ones from passive smoke exposure or from the societal expenditures necessary to treat individuals with lung cancer) as having been mediated by informational campaigns aimed at altering the positive meanings that dismissing evidence of the health hazards of smoking expressed in certain subcommunities (United States Public Health Service, 2000; Reference Gusfield, Rabin and SugarmanGusfield 1993).
The expressive account of ideological polarization, then, underscores the value of forming and testing hypotheses about how to regulate the social meaning of risks and related policy-relevant facts. Indeed, research focusing on forecasting techniques for identifying technologies vulnerable to polarizing meanings, on governmental processes for protecting the “science communication environment” from influences that cause such meanings to take hold, and on framing and other strategies for cleaning up that environment once it has been contaminated with polarizing meanings (Reference KahanKahan, 2012b), is already well underway (Reference Corner, Whitmarsh and XeniasCorner, Whitmarsh & Xenias, 2012; Reference Druckman, Bolsen and DanaDruckman & Bolsen, 2012, 2011, Reference Nisbet and ScheufeleNisbet & Scheufele, 2009).
5.4 Conclusion: The tragedy of the science communications commons
What might be characterized as the “expressive rationality” of ideologically motivated reasoning (Reference Kahan, Peters, Wittlin, Slovic, Ouellette, Braman and MandelKahan, Peters et al., 2012) is intrinsic to a collective action problem (Reference LessigLessig, 1995). When societal risks become suffused with antagonistic social meanings, it is (often if not always, and with respect to many if not all issues) individually rational for ordinary members of the public to attend to information in a manner that reliably connects them to the positions that predominate in their identity-defining groups. Nevertheless, if ideologically diverse individuals all follow this strategy simultaneously, they will be collectively worse off, since under these conditions, democratic institutions are less likely to converge, or to converge as rapidly as they otherwise would, on policies that reflect the best available evidence on how to protect everyone from harm. But because what any ordinary individual believes about policy will not make a difference, the collective irrationality of ideologically motivated reasoning does not by itself create any reliable pressure or mechanism to induce individuals to process information in a different, and morally and politically superior, way.
Overcoming ideological polarization over societal risks and related facts thus demands collective action specifically geared at dissolving this “tragedy of the science communications commons” (following Reference HardinHardin, 1968). Supplying the knowledge needed to guide such action is a contribution that decision science is uniquely poised to make.
Appendix. Experimental stimuli
A. RANDOMLY ASSIGN to condition 1 or 2 or 3.
1. Control condition
Psychologists believe the questions you have just answered measure how reflective and open-minded someone is.
2. Skeptic-is-biased condition
Psychologists believe the questions you have just answered measure how reflective and open-minded someone is.
In one recent study, a researcher found that people who accept evidence of climate change tend to get more answers correct than those who reject evidence of climate change. If the test is a valid way to measure open-mindedness, that finding would imply that those who believe climate change is happening are more open-minded than those who are skeptical that climate change is happening.
3. Believer-is-biased condition
Psychologists believe the questions you have just answered measure how reflective and open-minded someone is.
In one recent study, a researcher found that people who reject evidence of climate change tend to get more answers correct than those who accept evidence of climate change. If the test is a valid way to measure open-mindedness, that finding would imply that those who are skeptical that climate change is happening are more open-minded than those who believe climate change is happening.
B. ALL CONDITIONS CRT_valid
How strongly do you agree or disagree with this statement? [strongly Disagree, moderately disagree, slightly disagree, slightly agree, moderately agree, strongly agree]
I think the word-problem test I just took supplies good evidence of how reflective and open-minded someone is.


 Open access