
8.1 Introduction
Volcanism and metamorphism are the principal geologic processes that drive carbon transfer from the interior of Earth to the surface reservoir.Reference Kump and Barley1–Reference Mason, Edmonds and Turchyn4 Input of carbon to the surface reservoir through volcanic degassing is balanced by removal through silicate weathering and the subduction of carbon-bearing marine deposits over million-year timescales. The magnitude of the volcanic carbon flux is thus of fundamental importance for stabilization of atmospheric CO2 and for long-term climate. It is likely that the “deep” carbon reservoir far exceeds the size of the surface reservoir in terms of mass;Reference Dasgupta and Hirschmann5, Reference Wood6 more than 99% of Earth’s carbon may reside in the core, mantle, and crust. The relatively high flux of volcanic carbon to the surface reservoir, combined with the reservoir’s small size, results in a short residence time for carbon in the ocean–atmosphere–biosphere system (~200 ka).Reference Berner7 The implication is that changes in the flux of volcanic carbon can affect the climate and ultimately the habitability of the planet on geologic timescales. In order to understand this delicate balance, we must first quantify the current volcanic flux of carbon to the atmosphere and understand the factors that control this flux.
The three most abundant magmatic volatiles are water (H2O), carbon dioxide (CO2), and sulfur (S), with CO2 being the least soluble in silicate melts.Reference Symonds, Rose, Bluth, Gerlach, Carroll and Holloway8 For this reason, it is not only Earth’s active volcanoes that are a source of magmatic CO2, but also numerous inactive volcanoes with magma bodies present at depth in the crust that contribute to the carbon emissions (Figure 8.1). Emissions from active volcanoes are released through crater fumaroles and open vents to form visible volcanic plumes, but diffuse degassing and degassing through springs on the volcano flanks also contribute to the total flux of carbon from a volcano. Plume gas emissions typically dominate over flank gas emissions and are highest during periods of eruptive activity.Reference McCormick, Edmonds, Mather and Carn9 Due to the hazard associated with eruptions and the value of volcanic gas monitoring to aid in eruption forecasting, much of our knowledge about the degassing of volcanic systems comes from active volcanoes, and typically during periods of unrest.
Conceptual models showing typical CO2 emission patterns from volcanic and magmatic systems. CO2 may be sourced from magma bodies deep in the crust, whereas other volatiles may remain largely dissolved in magma until much shallower depths. Visible plumes are typical for active volcanoes, whereas CO2 degassing from dormant/inactive volcanoes and hydrothermal systems is less obvious. Low-temperature degassing may or may not result in a visible plume even when CO2 is present. Significant quantities of CO2 are emitted from areas of diffuse degassing, and CO2 also reacts with groundwater.

At less active and dormant (i.e. inactive) volcanoes, magmatic emissions of CO2 are less obvious. CO2 emissions are typically highest in thermal areas where gases are emitted through small fumaroles, soils, and fractures as diffuse degassing and through hot and cold springs. Occasionally, older volcanic areas can also exhibit cold degassing of CO2.Reference Gal, Leconte and Gadalia10 CO2 is denser than air, and therefore an asphyxiation hazard can exist in low-lying areas. Visual indicators of CO2 release include thermally perturbed or bare ground and the odor of H2S. Atmospheric plumes of CO2 can also form in such areas, even if a region is not thermal,Reference Gerlach, Doukas, McGee and Kessler11 and these emissions may not be visible. Additional contributions of volcanic carbon can be found in groundwaters,Reference James, Manga and Rose12, Reference Caliro, Chiodini, Avino, Cardellini and Frondini13 but globally this contribution is less well studied compared to gas emissions.
In this chapter, we review recent advances in our understanding of the flux of CO2 emitted in subaerial volcanic areas and how these emissions vary in space and time. Carbon released through mid-ocean ridges (MORs) and other oceanic environments is reviewed in Chapter 9. Through the focused efforts funded by the Deep Carbon Observatory and the Deep Earth CArbon DEgassing (DECADE) research initiative,Reference Fischer14 there is now greater global coverage of subaerial volcanic areas emitting CO2 compared to previous efforts.Reference Burton, Sawyer, Granieri, Hazen, Jones and Baross15 CO2 emission rates have now been quantified for many of the most active volcanoes, and some in real time. New observations reveal how the volcanic carbon flux varies through time and between different volcanic settings. Here, we discuss the nature of these emissions in terms of their magnitude, relationship to eruptive activity, and temporal variability, as well as how such measurements may enhance our ability to forecast eruptive activity.
Techniques to quantify diffuse and plume CO2 emissions (in the absence of SO2) were only developed in the mid-to-late 1990s;Reference Chiodini, Cioni, Guidi, Raco and Marini16, Reference Gerlach17 we are now approaching two decades of routine measurements for some of the world’s volcanic areas. Where monitoring has been frequent, data allow decadal-scale evaluations of the output from a number of the most prolific carbon-emitting volcanic regions. We discuss the magnitude of emissions from some of the largest diffuse degassing regions and the challenges in extrapolating diffuse measurements globally.
We review the advances in understanding the sources of carbon outgassing from volcanoes, showing how the isotopic signature of carbon and other species has allowed distinction of the carbon contribution from subducting slabs, the crust, and mantle sources on arc scales. These insights into magmatic–tectonic controls on carbon outgassing then allow us to begin to link the modern volcanic carbon outgassing picture to that which might have existed in the geological past.
8.2 Methods for Measuring Volcanic CO2: Established Techniques and Recent Advances
The principal challenges in the measurement of CO2 from volcanic regions are related to the detection of volcanic CO2 over the atmospheric background, logistical difficulties associated with accessing gas plumes, and technical issues that accompany deployment of instruments in the field. Techniques to measure CO2 emission rates from different types of sources and the related uncertainties in these measurements have been reviewed previously.Reference Burton, Sawyer, Granieri, Hazen, Jones and Baross15 Here, we expand on aspects of these methods as they pertain to information presented here and review emerging techniques and measurement biases.
8.2.1 Measurements of CO2 Emissions in Volcanic Plumes
Volcanoes that are most active display persistent gas emissions during either frequent eruptions or as “passive” degassing of shallow magma bodies.Reference Shinohara18 These volcanoes typically produce a volcanic plume, measurable with either direct or indirect techniques. The indirect or ratio technique underpins much of the recent progress in the measurement of volcanic CO2 emission rates. Here, the SO2 emission rate is measured using ultraviolet (UV) spectroscopy either from the ground,Reference McGonigle, Oppenheimer, Galle, Mather and Pyle19 airborne,Reference Galle20, Reference Allard21 or space-based platforms,Reference Carn and Bluth22 and then multiplied by the C/S mass ratio determined by fumarole sampling,Reference Symonds, Rose, Bluth, Gerlach, Carroll and Holloway8 Fourier-transform infrared (FTIR) spectroscopy,Reference Allard, Burton, Sawyer and Bani23 or Multi-GAS measurementsReference Shinohara24, Reference Aiuppa, Federico, Giudice and Gurrieri25 and the plume speed. Indirect techniques rely on reliable and representative SO2 emissions and C/S data. Uncertainties in the SO2 flux (e.g. due to in-plume light scattering) can produce a bias to lower SO2 fluxes by a factor of two or more.Reference Kern, Werner, Elias, Sutton and Lübcke26, Reference Mori27 Uncertainties in the C/S ratio of the gas arise from calibration of the Multi-GAS at a different altitude from the measurements, variable sensor response times to CO2 and SO2,Reference Kelly28–Reference Moussallam30 low plume concentrations (close to detection limits), and poorly mixed plumes.Reference Gerlach, McGee, Elias, Sutton and Doukas31
Direct measurements of CO2 plumes use an airborne platform to measure the vertical profile of CO2 concentration in the atmosphere downwind of the volcanic vent. The volcanic CO2 (in excess of atmospheric background) is multiplied by the plume speed to derive an emission rate.Reference Gerlach17, Reference Werner, Christenson, Hagerty and Britten32, Reference Werner33 Uncertainties in plume speed affect both measurement types and vary greatly depending on whether the speed is estimated from radiosonde or weather models or is measured on site. Direct CO2 measurement is the only option for the quantification of plume emissions where SO2 is not present.Reference Werner, Evans, Poland, Tucker and Doukas34 In-plume concentrations of 2–5 ppm above background are typically needed, depending on the CO2 analyzer used, and ~10-50 t/d is a reasonable detection limit for airborne measurements depending on the aircraft, plume speed, and distance from the vent. Emissions less than this range or in areas where airborne measurements are not feasible are challenging to quantify and represent a recognized gap in current budgets. Future approaches to such challenging field measurements will include use of miniaturized IR (and other) sensors on dronesReference McGonigle35–Reference Shinohara37 and ground-based light detection and ranging (LIDAR).Reference Aiuppa38, Reference Queisser, Granieri and Burton39
8.2.2 Diffuse CO2 Emissions and Groundwater Contributions
Many volcanic systems support areas of diffuse degassing often associated with hydrothermal activity due to magmatic intrusions at depth. A common method of quantifying diffuse emissions through soils is the accumulation chamber technique,Reference Chiodini, Cioni, Guidi, Raco and Marini16, Reference Werner, Brantley and Boomer40 where a chamber is set on the ground and the concentration of the accumulated CO2 is measured with time. Here, point measurements of the flux of CO2 are made over an area of interest and total emissions are quantified by applying geostatistical techniques (see Refs. Reference Chiodini, Cioni, Guidi, Raco and Marini16, Reference Cardellini, Chiodini and Frondini41 and references therein). The same chamber technique can be applied to lakes.Reference Mazot, Bernard, Rouwet, Christenson, Tassi and Vandemeulebrouck42, Reference Pérez43 Eddy covariance (EC) is an aboveground technique that has been used successfully to measure the flux of CO2 derived from diffuse, fumarole, and pool sources in regions with relatively low topographic relief.Reference Werner44–Reference Lewicki, Hilley, Dobeck and Marino47 The EC footprint (the source area on the ground contributing to the measured EC CO2 flux) varies with atmospheric conditions such as wind speed and direction and is typically smaller than most degassing regions. Thus, to determine the CO2 emission rate from a region of interest requires assumptions about the representativeness of the average EC flux to the larger area.Reference Lewicki, Kelly, Bergfeld, Vaughan and Lowenstern48 Alternatively, months-long deployments and inverse modeling have also been used to determine emission rates,Reference Lewicki, Hilley, Dobeck and Marino47, Reference Lewicki and Hilley49 though such models also have inherent uncertainty. While promising for long-term hazard monitoring, more work is needed for utilizing the full potential of EC for determining emission rates.
In volcanic areas, CO2 also dissolves into groundwaters and can emit through springs as a dissolved constituent. This flux can be quantified through chemical sampling and stream gauging,Reference James, Manga and Rose12, Reference Rose, Lee Davisson and Criss50 or through mass balance of the aquifer (i.e. coupling hydrogeological and hydrogeochemical data). For instance, using this technique, the amount of CO2 transported by Vesuvio groundwaters was estimated at about 150 t/d, or in the same order of magnitude as the diffuse emission of CO2 in the crater area.Reference Caliro, Chiodini, Avino, Cardellini and Frondini13
8.2.3 Significant Recent Advances: Continuous and Remote Techniques
One major advance toward producing robust long-term records of volcanic CO2 emissions has arisen from the advent of autonomous Multi-GAS instruments.Reference Aiuppa51 When combined with independent SO2 flux time series,Reference Galle52 measurements from these instruments have refined the CO2 output for several volcanoes, characterizing the variability of emissions on temporal scales of days to years for the first time.Reference Aiuppa53–Reference Shinohara57 Multi-GAS stations are being adapted for deployment at high-latitude volcanoesReference Kelly28, Reference Moussallam30, Reference Ilyinskaya58 and can perform automated calibrations for improved accuracy.Reference Kelly28, Reference Lewicki, Kelly, Bergfeld, Vaughan and Lowenstern48 Multi-GAS has recently been used on manned airborne missions and on unmanned aerial vehicles (UAVs).Reference McGonigle35, Reference Shinohara37, Reference Werner59 Overall, these measurements are fundamentally changing the way volcanic hazard is evaluated at active volcanoes.
Techniques to quantify CO2 remotely and from smaller features have also developed in recent years. Tunable diode laser spectrometerReference Pedone60–Reference Pedone62 measurements have shown that the CO2 output from fumaroles is significant (hundreds of t/d) at some volcanoes, illustrating a nontrivial contribution to the volcanic CO2 flux from this largely unquantified source at a global scale. In addition, LIDAR, specifically differential absorption LIDAR,Reference Aiuppa38, Reference Fiorani63 the smaller CO2 differential absorption LIDAR,Reference Queisser, Granieri and Burton39 and miniaturized light laser sensing spectrometers,Reference Queisser, Burton, Allan and Chiarugi64 have been used to determine path-integrated CO2 concentrations over kilometer scales. While these studies offer new prospects for quantifying CO2 flux, further work is required to standardize and widen their potential applications.
Advances have been made with satellite remote sensing of CO2, although CO2 is among the most challenging volcanic gases to detect due to high atmospheric concentrations (~400 ppm and rising due to anthropogenic contributions) that dominate the signal of column-average measurements. Even at some of the strongest volcanic gas sources (e.g. Etna, Italy), the volcanic CO2 signal may be only up to tens of ppm above background,Reference Allard21, Reference Werner65 requiring high precision and accuracy for detection from space. NASA’s Orbiting Carbon Observatory 2 (OCO-2), with a small footprint size (1.3 × 2.3 km) and <0.2% accuracy, permitted the first reported satellite detection of volcanic CO2 emissions at Yasur volcano in 2015.Reference Schwandner66 However, neither OCO-2 nor the Japanese Greenhouse Gases Observing Satellite (GOSAT) provide sufficient temporal resolution or spatial coverage to be effective volcano monitoring tools. The future of volcanic CO2 monitoring from space is inextricably linked to the politics of greenhouse gas measurements and climate change. Several planned or proposed satellite missions (NASA’s OCO-3, JAXA’s GOSAT-2, and ESA’s CarbonSat) offer the potential for volcanic CO2 detection, but it is unlikely to ever become as routine as volcanic SO2 measurements, and will likely be restricted to “spot” measurements of the strongest persistent volcanic CO2 sources.
8.3 Estimating Global Emission Rates of CO2
Quantifying global emissions of volcanic CO2 is an area of ongoing research that will continue to evolve as more measurements become available. Some of the first estimates of global volcanic CO2 degassing, published in the 1990s, were based on only seven to nine measurements of passive CO2 degassing;Reference Gerlach67, Reference Brantley and Koepenick68 our understanding of CO2 degassing in volcanic areas has progressed greatly since then. Here, we review methodologies from recent studies quantifying global volcanic CO2 and how our new understanding may allow us to reduce some of the uncertainties in these estimates.
Until recently, most estimates of global CO2 emissions were determined by proxy where volcanic CO2 was scaled globally by a tracer (e.g. SO2 or 3He). Work focused on determining the C/S ratio of fumaroles based on level of activityReference Williams, Schaefer, Calvache and Lopez69 or on an arc-wide basisReference Hilton, Fischer and Marty70 and combining these data with global SO2 emission rate compilations.Reference Andres71, Reference Stoiber, Williams and Huebert72 While seemingly straightforward, numerous uncertainties exist in these methods. First, C/S is not constant in time, and it is challenging to discern whether variations in C/S reflect changing mixtures of sources (magmatic vs hydrothermal) or progressive degassing of a single magmatic source due to gas loss or decompression (Figure 8.1).Reference Aiuppa, Fischer, Plank, Robidoux and Di Napoli73, Reference Fischer74 Second, SO2 emission rate data are skewed toward easily accessible locations and volcanoes experiencing unrest. Progress has been made with satellite remote sensing data that, when averaged over long time periods, are sensitive enough to measure lower emission rates of SO2, thereby reducing some measurement bias. For example, recent work used Ozone Monitoring Instrument (OMI) satellite dataReference Carn, Fioletov, McLinden, Li and Krotkov75 to calculate a global passive volcanic SO2 flux of 23 ± 2 Tg SO2/yr during the decade 2005–2015 from 91 volcanoes, half of which also have the C/S ratio measured. However, 91 volcanoes only represents 16% of the 570 volcanoes active in historic time, and 6% of the volcanoes active in the Holocene,Reference Siebert, Simkin and Kimberly76 many of which might be passively degassing CO2, but not emitting SO2 over the satellite detection limit. Some previous global estimates of CO2 emissions have assumed that the strongest emitters of SO2Reference Shinohara57 also produce the most CO2, but the time frame of measurement is important to consider, as is the number of degassing systems. The temporal distribution of volcanic CO2 outgassing could be very different from that of SO2,Reference Carn, Clarisse and Prata77 which is dominated by a relatively small number of erupting and persistently degassing volcanoes. Further clarity on this issue may be provided in the near future with the recently launched Tropospheric Ozone Monitoring Instrument (TROPOMI) sensor (www.tropomi.eu), which has 12-times higher spatial resolution than the earlier OMI sensor, and may reveal weaker plumes.
Global 3He fluxes have also been used to estimate global arc CO2 fluxes.Reference Torgersen78, Reference Sano and Williams79 The estimated 3He flux from arcs is based on the well-constrained 3He flux from MORs and the assumption that 80% of volcanic activity on Earth is associated with MORs and the remainder mainly from volcanic arcs.Reference Crisp80 Intra-oceanic arc magma fluxes were revisedReference Dimalanta, Taira, Yumul, Tokuyama and Mochizuki81 and show a factor of approximately two times higher rates compared to the early studies.Reference Crisp80, Reference Reymer and Schubert82 While MOR 3He fluxes appear to be quite well constrained within a factor of approximately two,Reference Bianchi83 work on global arc-magma production rates is still sparse, and therefore arc 3He fluxes are likely associated with uncertainties that remain challenging to quantify. The most recent volcanic CO2 flux from arcs is estimated to be 22 × 1011 mol/yr or 95 Tg CO2/yr,Reference Kagoshima84 based on the CO2/3He ratio of volcanic gases with outlet temperatures of >200°C, although variability in the mantle CO2/3He adds considerable uncertainty to such calculations.
A third approach has been to extrapolate CO2 data based on actual measurements.Reference Burton, Sawyer, Granieri, Hazen, Jones and Baross15, Reference Shinohara57 The latest budget calculationReference Burton, Sawyer, Granieri, Hazen, Jones and Baross15 separated emissions based on the source (plume degassing, diffuse degassing from historically active volcanoes, hydrothermal and inactive areas, volcanic lakes, and MORs) and extrapolated them based on the number of similar systems globally. Roughly 50% (271 Tg CO2/yr) of the total global subaerial emission of CO2 (540 Tg CO2/yr) was estimated to come from ~150 passively degassing volcanoes, based on the average CO2 emissions measured at 33 active volcanic systems. An additional 20% was estimated by extrapolating observed diffuse emissions to the ~550 historically active volcanoes. CO2 emissions from hydrothermal systems were treated separately, as were volcanic lakes and MORs.
The two main quantification challenges in extrapolating empirical data include the determination of a representative flux and the estimation of the total number of degassing volcanoes. The Global Volcanism Program (GVP) Volcanoes of the World catalog has been used to assess the number of volcanoes degassing globally, but it is important to note that the catalog quantifies the number of degassing volcanoes (i.e. “fumarolic” volcanoes) only where there has been “no (other) explicit evidence for Holocene eruptive activity.” Thus, of the 1545 volcanoes with known or inferred eruptive activity in the Holocene, it is unclear how many are degassing other than those defined as “fumarolic” or “solfataric.” In the latest volume, this category has been reduced from over 100 to 64 as more systems now have other data indicating Holocene activity.
Burton et al.Reference Burton, Sawyer, Granieri, Hazen, Jones and Baross15 suggested ~150 volcanoes were degassing today, or 10% of the ~1500 volcanoes active in the Holocene.Reference Siebert and Simkin85 Satellite measurements showReference Chiodini, Cioni, Guidi, Raco and Marini16 instead that 91 systems have emitted significant amounts of SO2 (and thus CO2) between 2005 and 2015, yet these data are representative of eruptive periods only, as higher-altitude plumes are more readily detected from space. As satellite surveillance of SO2 emissions improves, the number of degassing sources measurable from space will likely increase. Our compilation shows there are now 201 Holocene volcanic systems associated with some form of CO2 degassing observations (Supplemental Tables 8.1 and 8.2) and an additional 22 where the last eruptive activity was in the Pleistocene (Supplemental Table 8.3). Thus, future attempts to estimate global CO2 degassing from volcanic areas should not assume that only historically active or Holocene volcanoes are actively degassing, but also consider the 1325 Pleistocene volcanoes.Reference Siebert, Simkin and Kimberly76
8.4 Current State of Knowledge of CO2 Degassing from Volcanoes
8.4.1 CO2 Emissions from Earth’s Most Active Volcanoes
Earth’s most active volcanoes are those that are best studied due to the hazards they pose. Over decadal timescales, many of the most active volcanoes alternate between periods of strong degassing, typically associated with periods of eruptive activity, and phases of reduced (or arrested) degassing, with the former preferentially targeted by observations. Global CO2 compilations calculate average emissions based on all published estimates of CO2 flux,Reference Burton, Sawyer, Granieri, Hazen, Jones and Baross15, Reference Gerlach67 yet many of these are spot measurements acquired during periods of heightened activity that may span decades. It is therefore likely that combining sparse measurements collected over several decades may lead to an overestimation of the real time-averaged global volcanic CO2 output.
In an attempt to reduce the above uncertainty, the average CO2 fluxes for some volcanoes in Burton et al.Reference Burton, Sawyer, Granieri, Hazen, Jones and Baross15 were revised (Supplemental Table 8.1) using more recent observations that have been obtained in the last decade (2005–2017) where available, and including both eruptive and quiescent periods whenever possible. Our revised average fluxes are lower than previously publishedReference Burton, Sawyer, Granieri, Hazen, Jones and Baross15 for all of the major volcanic CO2 sources (Supplemental Table 8.1). For example, recent observations of CO2 emissions from Nyiragongo volcano are lower by approximately a factor of ten (i.e. ~9300 t/d,Reference Bobrowski86, Reference Sawyer, Carn, Tsanev, Oppenheimer and Burton87 compared to ~95,000 t/d collected during the 1950s–1970sReference Burton, Sawyer, Granieri, Hazen, Jones and Baross15, Reference Le Guern88). Similarly, we report a new time-averaged CO2 flux for Miyakejima volcano in Japan (1070 t/dReference Shinohara57) based on nearly two decades of systematic observations. This longer data set yields one order of magnitude lower CO2 emissions than implied by the intense degassing unrest of early 2000.Reference Kazahaya89, Reference Shinohara, Kazahaya, Saito, Fukui and Odai90 Likewise, emission rates from Augustine and Mount Spurr volcanoes are considerably lower than previously estimated when quiescent periods are considered as well as the unrest/eruptive periods that occurred between 2005 and 2015 (Supplemental Table 8.1).Reference Werner65, Reference Doukas and McGee91–Reference Kelly, Werner, Kem, Clor and Doukas93
Our compilation also includes new results for more than 50 volcanoes whose volcanic CO2 fluxes have been quantified for the first time since 2013 (Supplemental Table 8.1), mostly due to the DECADE initiative.Reference Fischer14 While the number of volcanoes with a measured CO2 plume has more than tripled since 2013 (33Reference Burton, Sawyer, Granieri, Hazen, Jones and Baross15 vs. 102), the total (cumulative) CO2 emitted is roughly two-thirds of the previous estimate (44 Mt CO2/yr, or Tg/yr, vs 59.7;Reference Burton, Sawyer, Granieri, Hazen, Jones and Baross15 Supplemental Table 8.1), largely due to the diminished estimates for the top volcanic CO2 emitters by including inter-eruptive periods.
Given that our data set, by necessity, includes a number of spot measurements, the relative contribution of the most active volcanoes might continue to diminish as longer records are obtained at more volcanoes. As a first-order test, we compare the data set from direct measurements (many of which are spot measurements) with the CO2 flux estimated from global compilations of the most active volcanoes that represent longer time frames. We utilize the 2005–2015 OMI volcanic SO2 flux measurementsReference Carn, Fioletov, McLinden, Li and Krotkov75 and combine these with CO2/SO2 ratios from Aiuppa et al.Reference Aiuppa, Fischer, Plank, Robidoux and Di Napoli73 and elsewhere where available to estimate CO2 emissions from these sources (Supplemental Table 8.1). At the time of writing, 49 of the 91 volcanoes in the OMI data setReference Carn, Fioletov, McLinden, Li and Krotkov75 have their volcanic gas CO2/SO2 ratio signatures characterized (Supplemental Table 8.1), leaving a sizable gap in our knowledge. If only the CO2 emissions from these 49 volcanoes are summed, the OMI-based data result in a total CO2 emission of only 27 Tg/yr, compared to the 44 Tg/yr CO2 by direct measurements (Supplemental Table 8.1). Overall, a reasonable correlation exists between the two data sets, with scatter about the 1:1 line (Figure 8.2a), but each data set is associated with significant variability over the decadal period. The variability in the decadal average CO2 flux is mirrored by the spread of the SO2 annual averages over a decadal period (Figure 8.2b), pointing to inherently large temporal variability in the emission rates from active volcanoes over multiyear periods (see also Section 8.6.1) and suggesting that the spread in CO2 data could be related to different observation periods. This lies in contrast to variability in SO2 emission on an annual basis from the open-vent volcanoes; where frequent measurements have been made, variability is low and data cluster around the 1:1 line. This suggests that OMI-derived estimates of CO2 emissions are accurate when the C/S ratios of volcanic gases are measured frequently. Future work should focus on a rigorous, systematic inter-comparison study between satellite and ground-based SO2 flux data sets and on capturing the temporal variability in volcanic gas chemistry.
(a) Decadal average of CO2 emissions from direct measurements for the period 2005–2017 (as available; see Supplemental Table 8.1) compared to that calculated from decadal average SO2 emission from OMI and C/S ratio estimates. (b) Annual average SO2 measurements from direct measurements for the years 2005–2015 when available (Redoubt,Reference Werner65, Reference Doukas and McGee91, Reference Kelly, Werner, Kem, Clor and Doukas93 White Island,Reference Werner33, Reference Christenson94, Reference Kilgour95 and KilaueaReference Elias and Sutton96 compared to annual OMI estimatesReference Carn, Fioletov, McLinden, Li and Krotkov75). Error bars show one standard deviation over the period of observations in both (a) and (b), and uncertainties in OMI-derived values are propagated. Note that annual variability is low at open-system volcanoes.

Given the importance and potential further use of the long-term OMI SO2 data setsReference Carn, Fioletov, McLinden, Li and Krotkov75, Reference Carn, Clarisse and Prata77 for estimating global CO2 emission rates, it is important to note that many of the “passive” degassing measurementsReference Carn, Fioletov, McLinden, Li and Krotkov75 in fact represent eruptive periods. For instance, the OMI decadal data set omits eruptive emissions using a threshold SO2 amount,Reference Carn, Fioletov, McLinden, Li and Krotkov75 which excludes large-scale explosive emissions, but here we show that the data set includes emissions from eruptive and inter-eruptive periods. If we consider passive degassing to be degassing in the absence of eruption, we can compare the GVP volcanic eruption database97 with the OMI SO2 degassing data set. On an annual basis, 10 of the 91 volcanoes (11%) reflect true passive degassing such that the volcanoes did not experience an eruption between 2005 and 2015. Furthermore, 24% of the volcanoes erupted at least once every year; and, in any given year, at least half of the volcanoes experienced an eruption during this decade (the minimum number was 45 volcanoes erupted in a given year). For comparison, on average of 83 (±1.6) volcanoes experienced a non-zero SO2 flux in a given year, suggesting that roughly half of the volcanoes might be considered to be passively degassing on an annual basis.
It is also important to note that the OMI SO2 data set almost exclusively represents volcanoes with predominantly basaltic or basaltic–andesite compositions and is thus not globally representative of Earth’s more silicic systems. Basaltic systems have been shown to have the shortest repose periods (averaging <1 year), whereas basaltic–andesite systems can show much longer periods of repose (averaging roughly 20 years),Reference Passarelli and Brodsky98 with the latter approaching the length of time that the volcanic gas community has been making CO2 emission rate measurements. Thus, we suggest that future work should also focus on analyzing time series data that span eruptive cycles at the more silicic of this set of dominantly mafic volcanoes to understand how emissions vary over multi-decadal time periods that include both periods of repose and open-vent degassing.
8.4.2 CO2 Emissions during Explosive Eruptions
Our present knowledge of CO2 emissions from large, explosive eruptions is limited owing to both proximal hazards and instrumental challenges in measuring volcanic gases during such events. Direct assessment of CO2 emission rates during explosive eruptions has been achieved on rare occasions, either from airborne plume measurements (e.g. during the 2009 Redoubt eruption,Reference Werner65 though here the most explosive events were not captured) or by coupling real-time FTIR spectroscopy of CO2/SO2 ratios in eruptive gases with the UV-sensed SO2 flux (e.g. during the 2010 Eyjafjallajökull eruptionReference Allard, Burton, Oskarsson, Michel and Polacci99). In other cases, bulk CO2 emissions from explosive eruptions have been estimated by combining CO2/SO2 data from in situ measurements with satellite-based SO2 data or by modeling the pre-eruptive vapor-phase composition.Reference Gerlach, Westrich, Symonds, Newhall and Punongbayan100–Reference Scaillet and Pichavant102 Such techniques yield, for instance, estimates of ~10 and ~50 Mt CO2 for the 1980 Mount St Helens and 1991 Pinatubo eruptions, respectively.Reference Gerlach103 These estimates imply CO2/SO2 mass ratios of ~3–10 in the eruptive emissions, although higher ratios cannot be excluded.Reference Gerlach, Westrich, Symonds, Newhall and Punongbayan100 Indeed, mass budgets for these and other explosive eruptions of silicic magmas strongly suggest pre-eruptive accumulation of a CO2-rich vapor phase.Reference Gerlach, Westrich, Symonds, Newhall and Punongbayan100, Reference Holloway104 Gas accumulation in silicic magma reservoirs between eruptions can result from the second boiling of vapor-saturated crystallizing magma and/or volatile supply from basalt underplating.Reference Christopher105 Magmatic vapor may migrate to the roof zones of reservoirs via gas transport through channelized flow in crystal-rich mush.Reference Parmigiani, Faroughi, Huber, Bachmann and Su106 Because of its low solubility, CO2 becomes preferentially enriched in the accumulating vapor phase. Therefore, high CO2/SO2 ratiosReference Burgisser, Alletti and Scaillet107 and high CO2 and SO2 fluxesReference Kilbride, Edmonds and Biggs108, Reference Wallace109 can be expected during the initial phases of explosive eruptions that tap the gas-rich upper levels of magma reservoirs.
Measuring volcanic CO2 emissions during explosive eruptions will continue to be challenging regardless of whether one is using in situ or satellite techniques. In situ measurements of explosive eruption plumes are hampered by proximal volcanic hazards and high atmospheric ash loadings,Reference Hobbs, Tuell, Hegg, Radke and Eltgroth101 and spaceborne CO2 measurements will also be hindered by volcanic ash. However, UAV (or drone) technology and improved satellite SO2 instruments (e.g. TROPOMI) hold great promise to improve measurements of explosive volcanic CO2 emissions in the coming decade.
8.4.3 CO2 Emissions from Dormant Volcanoes
It has been recognized for some time that volcanoes that are dormant (defined here as not erupting but likely to erupt again) emit significant amounts of CO2.Reference Kerrick110, Reference Morner and Etiope111 These volcanoes may support smaller CO2 plumes that may or may not contain SO2 derived from fumarolic emissions, or they may host large regions of diffuse degassing (Supplemental Table 8.3) related to silicic volcanism that have long repose times typical of caldera settings. Below we review each source separately.
8.4.3.1 Small Volcanic Plumes: Fumarolic Contributions
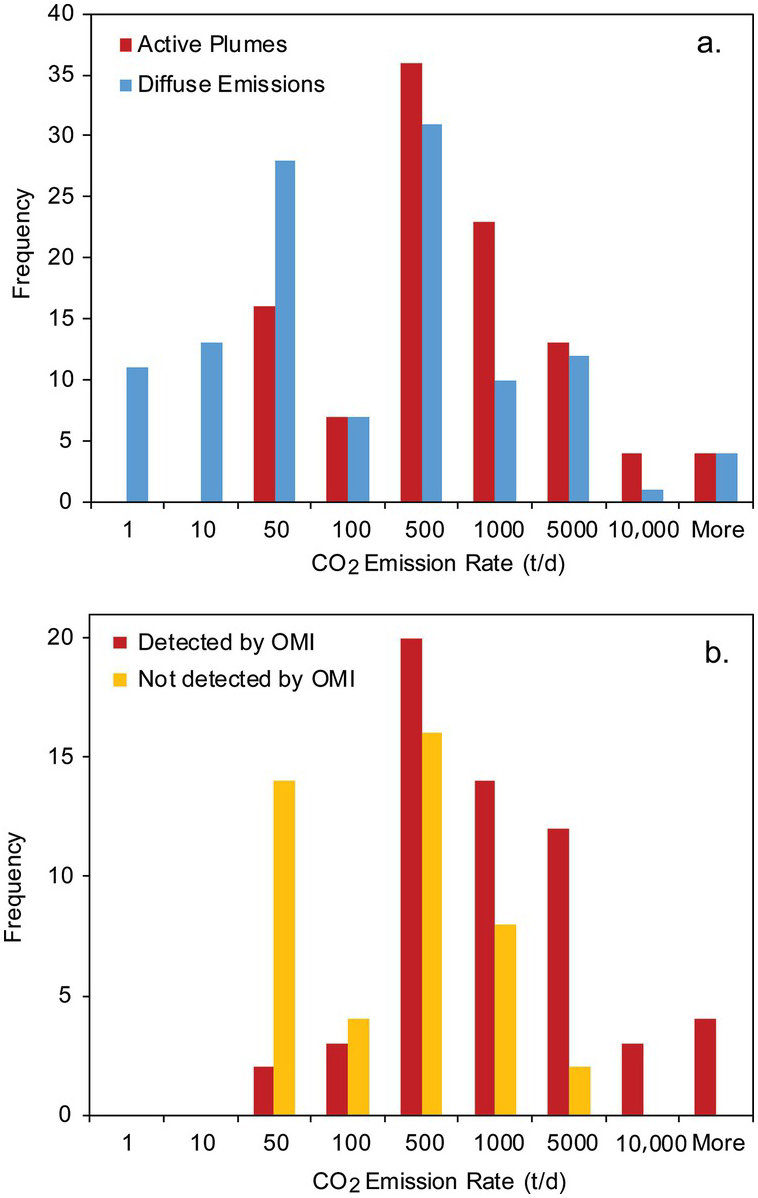
Volcanoes that produce small plumes, or CO2 plumes in the absence of significant SO2 emission, are more difficult to characterize for their CO2 emission rate than those that have strong SO2 plumes. Roughly 40%44 of the 102 direct CO2 flux measurements listed in Supplemental Table 8.1 are from volcanoes where the volcanic plume was not detected by OMIReference Carn, Fioletov, McLinden, Li and Krotkov75 and thus fall in this category (we refer to these as “small plumes,” although some do not have low CO2 emissions). The CO2 emissions associated with these volcanoes range from 13 to nearly 1500 t/d, with an average of 300 t/d (1σ = ±360) and a median of 147 t/d, excluding the large emission from Oldoinyo Lengai (Tanzania). Some of the largest CO2 emissions are from active volcanoes that host crater lakes (e.g. Taal and Pinatubo, Philippines; Ruapehu, New Zealand; Supplemental Table 8.1) and from better-studied sections of arcs in the United States (Cascades and Alaska), Central and South America, and Indonesia (Supplemental Table 8.1). Where airborne methods and easy access have allowed for measurements, the data show that such emissions are common and are likely widespread in many arcs globally (Figure 8.3a). If we simply sum the CO2 emissions from these “small” volcanic plumes, they amount to only 5 Tg CO2/yr of the ~44 Tg/year in Supplemental Table 8.1, demonstrating the dominance of strongly emitting volcanoes in the data set. However, if we take the volcanoes that have erupted in the last 100 years (n = 407) minus the 83 volcanoes that are shown to be degassing each year (Section 8.4.1), resulting in 324 volcanoes globally, and assume that each outputs on average 300 t/d, this equates to ~35 Tg CO2/yr. If we use the median (147 t/d) instead of the average, this results in 17 Tg CO2/yr. This exercise suggests that the emissions from volcanoes with small plumes (or in the absence of SO2 emission) could potentially emit a similar order of magnitude of CO2 globally as volcanoes whose SO2 plumes were detected by satellite. This result, if robust, would potentially stand in contrast to recent regional studies in JapanReference Shinohara57, Reference Mori112 that suggest that the global volatile budget is dominated by the high SO2-emitting volcanoes, although this studyReference Shinohara57 recognized that the data set lacked comprehensive measurements for the less active, diffusely degassing volcanoes. While challenging, more work is needed to verify the global contribution of CO2 emissions from volcanoes that do not emit satellite-detectable SO2.
Measured CO2 emissions from (a) active volcanoes (plume emissions; Supplemental Table 8.1) and (b) diffuse degassing sources (Supplemental Table 8.2). All plume emissions are from Holocene volcanoes. Diffuse emissions are from volcanic sources with a broader period of activity; hydrothermal locations are often colocated with active volcanoes (i.e. Holocene volcanoes). Volcano locations from Ref. 97, top 20 SO2 producers from Ref. Reference Carn, Fioletov, McLinden, Li and Krotkov75, and hydrothermal system locations from a modified version of the database from Ref. Reference Stimac, Goff, Goff, Sigurdsson, Houghton, McNutt, Rymer and Stix113.


8.4.3.2 Diffuse Emission of CO2: Hydrothermal Systems, Calderas, and Continental Rifts
Our understanding of the magnitude of the diffuse CO2 flux from volcanic and magmatically active regions on Earth continues to evolve with each year of new measurements, and we now understand this to be a significant outgassing source. What we show here is that diffuse CO2 outgassing from calderas and dormant volcanic regions can rival outgassing from actively erupting volcanoes (Figures 8.3, 8.4, and 8.5). Quantification of such fluxes on global scales, however, remains a great challenge. Available flux data for diffuse gas emissions have been gathered, together with data from active volcanoes, into a database (the MaGa web database: www.magadb.netReference Cardellini114). The data show that there are large regions where measurements have not yet been made (e.g. South America, Kamchatka, and Southeast Asia; Figure 8.3b). As new discoveries of large emission sources have been made in the last 10 years in areas with large magmatic intrusions and concentrations of hydrothermal systems (e.g. the East African Rift (EAR) and the Technong volcanic province, China), we expect that additional important areas will be located in the future.
Cumulative CO2 emissions for some of the best-studied volcanoes in the world showing the comparison of vent emissions (triangles) to diffuse emissions (squares and dotted lines). (a) Emissions from Redoubt volcano and those of Mammoth mountain are roughly equal over 20-year time frames. Redoubt data from Refs. Reference Werner65, Reference Doukas and McGee91, Reference Kelly, Werner, Kem, Clor and Doukas93, and Reference Casadevall, Doukas, Neal, McGimsey and Gardner115 and Mammoth data from Ref. Reference Werner116. (b) Solfatara data from Ref. Reference Cardellini117, Stromboli data from Ref. Reference Aiuppa118. (c) White Island data from Refs. Reference Werner33 and Reference Christenson, White, Britten and Scott119, Ruapehu data from Refs. Reference Werner, Christenson, Hagerty and Britten32, Reference Christenson94, and Reference Kilgour95, Taupo Volcanic Zone diffuse degassing data from Refs. Reference Bloomberg120–Reference Werner and Cardellini123.

Distribution of CO2 emission rate data for (a) active volcanic plumes (Supplemental Table 8.1) and diffuse emissions (Supplemental Table 8.2) and (b) the active volcano plumes that were detected for passive degassing by OMIReference Carn, Fioletov, McLinden, Li and Krotkov75 and those volcanoes that were not.
If we compare the distribution of measured diffuse emissions of CO2 (Figure 8.5a and Supplemental Table 8.3) with plume emissions from active volcanoes (Supplemental Table 8.1), we find significant overlap and similarity in the emission rates, especially at higher rates. The diffuse emission data tend to be bimodal, with a larger population at low emission rates (Figure 8.5a), but the lack of measurements at low CO2 emissions for active volcanoes may simply reflect a sampling bias due to method limitations (e.g. fumarolic contributions and plumes below SO2 satellite detection limits). Volcanic systems that have diffuse emission rates between 100 and 500 t/d are most common, representing 30% of the data, with an additional 20% falling between 500 and 5000 t/d. The highest CO2 emission rates are for large magmatic systems (e.g. Yellowstone in the United States, the Tengchong Volcanic Field in China, the Tuscan Roman degassing structure (TRDS) and Campanian degassing structure (CDS), and the EAR system; Supplemental Table 8.3). Although estimates for these systems have large uncertainties, high emission rates are consistent with high heat fluxes and voluminous magmatism. As run-up time, or period of unrest prior to an eruption, is positively correlated with the repose period between eruptions,Reference Passarelli and Brodsky98 it should not be surprising that some of the largest and longest-lived volcanic systems (e.g. silicic calderas systems) can produce some of the largest CO2 emissions globally (e.g. Yellowstone, Campi Flegrei, and Rotorua; Supplemental Table 8.3).
Unrest in caldera systems is common,Reference Acocella, Di Lorenzo, Newhall and Scandone124, Reference Newhall and Dzurisin125 and thus using unrest catalogs may allow us to understand and constrain this likely significant CO2 source better. Globally, there are 446 caldera systems, of which 225 have erupted in the Quaternary and 97 in the Holocene.Reference Acocella, Di Lorenzo, Newhall and Scandone124, Reference Newhall and Dzurisin125 At caldera systems, unrest is understood to be driven by the influx of mafic, volatile-rich magma to the base of relatively shallow reservoirs containing vapor-saturated magma (Figure 8.1). In a recent study of the best-monitored caldera systems in the world, such episodes of magma intrusion were found to be the fundamental driver of unrest,Reference Acocella, Di Lorenzo, Newhall and Scandone124 and 71% exhibited changes in degassing with unrest. At mafic calderas, unrest often proceeded to eruption, whereas felsic systems were thought to have a higher capacity to accommodate magmatic intrusions without leading to an eruption.Reference Acocella, Di Lorenzo, Newhall and Scandone124 The hydrothermal systems and gas reservoirs that often lie above such intrusions act as buffers, such that changes in gas emission at the surface are often delayed by some time (sometimes years) from the time when fresh magma is intruded.Reference Werner116, Reference Acocella, Di Lorenzo, Newhall and Scandone124, Reference Chiodini126 However, the time-averaged release of CO2 from these systems is roughly similar to that of many active volcanoes (Figure 8.4). The main difference may then be the contrast in available pathways for gas release: active (and often mafic) volcanoes maintain open conduits with high permeability (Supplemental Table 8.1) and dormant (often silicic) volcanoes and caldera systems release gas along faults and fracture networks with lower permeability than open conduits, resulting in regions of diffuse emissions (Supplemental Table 8.3).
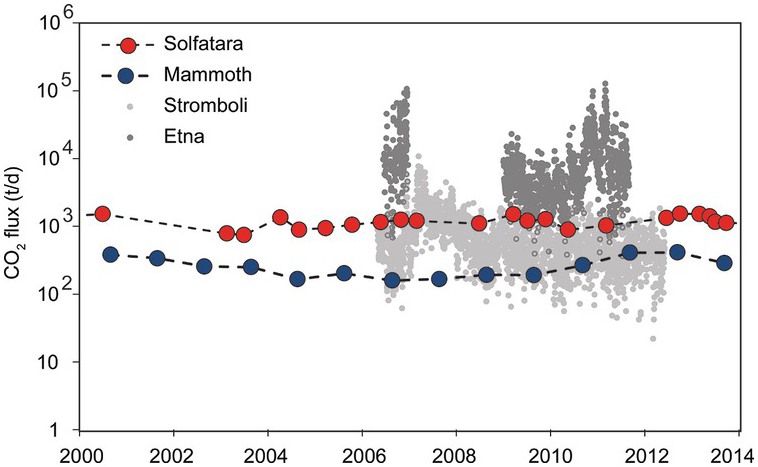
Here, for the first time, we show that net release of CO2 over time (decades) from areas of diffuse degassing for several well-studied systems that have not erupted in recent history (e.g. Mammoth Mountain, USA; Solfatara, Italy; Rotorua, New Zealand) can rival that of active volcanoes that have experienced an eruption recently (Etna and Stromboli, Italy; Redoubt, USA; White Island, New Zealand). The active volcanoes are all on the list of top SO2-producing volcanoes in the world.Reference Carn, Fioletov, McLinden, Li and Krotkov75 For example, the CO2 emission from Mammoth Mountain (last eruption 70 kaReference Werner116) over ~20-year timescales is similar to that of Redoubt Volcano (Figure 8.4a). In this case, the long-term average emission is fundamentally controlled by the period of observation (e.g. note that the 2005–2015 average emission is an order of magnitude higher in Supplemental Table 8.1 than the average over two decades portrayed in Figure 8.4a). Another example is the long-term cumulative emission from Solfatara in Campi Flegrei, Italy, which exceeds that of Stromboli Volcano (Figure 8.4b). And finally, the emission from White Island is dwarfed by the sum of the cumulative CO2 emissions from dormant volcanoes in New Zealand (Figure 8.4c).
It is not known how many hydrothermal systems exist on Earth, but the majority are associated with areas of either present or past volcanism. Our current summation of the extent of diffuse degassing from dormant volcanoes is ~64 Tg/yr (Supplemental Table 8.3), which is similar to that published previously,Reference Burton, Sawyer, Granieri, Hazen, Jones and Baross15 but our estimate does not include large-scale extrapolated values for Indonesia–Philippines and the Subaerial Pacific Rim.Reference Seward and Kerrick127 Our data highlight the importance of several large regions of localized hydrothermal activity. While work in several areas has already begun and has yielded valuable initial data (Yellowstone, USA;Reference Werner and Brantley128,129 Campi Flegrei, Italy;Reference Cardellini117, Reference Chiodini130 the TRDS and CDS, central Italy;Reference Chiodini131, Reference Frondini132 the EAR;Reference Lee133, Reference Hunt, Zafu, Mather, Pyle and Barry134 and the Taupo Volcanic Zone (TVZ), New ZealandReference Bloomberg120, Reference Rissmann122, Reference Werner and Cardellini123), we expect several other areas will also be globally important for their CO2 emissions. Guidance for where these areas might be located can be gleaned from global assessments of geothermal energy reserve. In a 2016 review by the World Energy Council,135 the five nations with the highest potential geothermal generating capacity were the USA, the Philippines, Indonesia, Mexico, and New Zealand. Several of these countries have had very few CO2 surveys to date. On the other hand, countries such as Italy and Japan (ranked 6th and 10th, respectively, on the list of top nations) have had considerably more studies.
Here, we attempt to estimate the number of hydrothermal areas worldwide by building on a list of geothermal systems capable of power production,Reference Stimac, Goff, Goff, Sigurdsson, Houghton, McNutt, Rymer and Stix113 adding in hydrothermal areas located in Alaska, Kamchatka, and Peru. This results in ~670 hydrothermal regions worldwide (Figure 8.2). The average of all diffuse emissions from localities that have not experienced eruptive activity since 2000 is 340 ± 628 t/d, demonstrating a positive skew in the population. We omitted hydrothermal areas on volcanoes with eruptions since 2000 because we did not want to include anomalous data due to recent volcanism. This average also does not include large-scale magmatic emission estimates (Supplemental Table 8.4) because these areas are also anomalous on a global scale and are not representative of individual hydrothermal regions. While admittedly simplistic, applying this average to the 670 hydrothermal regions worldwide would result in 83 Tg CO2/year, or an additional 30% over the current summation of the diffuse data. We consider it likely that this estimate is conservative given: (1) that our data only represent ~135 of 670 localities; (2) these data largely do not include groundwater contributions that may be similar in magnitude to diffuse emissions (see Ref. Reference Shinohara57 and references therein); and (3) the discovery of other large systems globally (such as Yellowstone) could add significantly to the budget (currently, large magmatic provinces sum to 75 Tg CO2/yr; Supplemental Tables 8.3 and 8.4).
The TVZ is a region that deserves extra attention given its unique tectonic setting and high heat flow and because arc-scale extrapolations based on studies from the TVZReference Seward and Kerrick127 continue to be used for global compilations and comparisons of CO2.Reference Burton, Sawyer, Granieri, Hazen, Jones and Baross15, Reference Hunt, Zafu, Mather, Pyle and Barry134 The TVZ is an intra-arc rift zone that hosts over 20 separate hydrothermal regions with heat flux greater than 20 MW,Reference Bibby, Caldwell, Davey and Webb136 and many of these regions are exploited for geothermal energy. Previous estimates of the CO2 output of the TVZ as a whole have been extrapolated based on the heat flux and the CO2 content of upwelling fluids. However, diffuse CO2 flux at the surfaceReference Bloomberg120, Reference Rissmann122, Reference Werner and Cardellini123 for many of these systems greatly exceeds previous CO2 emission estimates for these areas, without including fumarolic contributions. As an example, the emission rate estimated for the Rotorua hydrothermal system alone (estimated at ~1000 t/d, including sub-lacustrine degassing;Reference Werner and Cardellini123 Supplemental Table 8.3) is nearly equal to that previously estimated for the whole TVZ (~1200 t/dReference Seward and Kerrick127). To date, 7 of the 18 hydrothermal systems have been measured for CO2; together, they equal a total of ~2000 t/d. Further investigation is required to determine why the previous estimates for the TVZ hydrothermal systems were low, but likely this results from underestimating the CO2 content of the deep hydrothermal fluids or degassing from gas reservoirs at depth.Reference Cardellini117, Reference Chiodini137 In any case, arc-scale estimates for other regions on Earth should not be based on TVZ data,Reference Seward and Kerrick127 and continued effort should be placed on measuring the total diffuse CO2 output from typical arcs and high-heat-flow regions around the world.
The EAR, also deserving of extra attention due to its high global output, is a series of rift valleys that extend 4000 km from the Afar region in the north to Beira in Mozambique in the south.Reference Omenda138 The system is split into an eastern branch, which hosts the Main Ethiopian Rift (MER) in the north and the Kenyan rift in the south. In these two sectors alone, there exist 36 volcanoes and 28 hydrothermal areas. The western branch of the EAR is characterized by a lack of recent volcanism relative to the eastern branch, but still hosts a number of geothermal prospects as well as Nyiragongo, a major emitter of CO2. Several recent studies attempted to estimate the diffuse CO2 flux from the EAR. One study focused on the centers of volcanic activity in the MER and extrapolated that to between 3.9 and 33 Tg CO2/yr for the EAR.Reference Hunt, Zafu, Mather, Pyle and Barry134 A second study focused on tectonic degassing away from active volcanic centers and estimated 38–104 Tg CO2/yr for the EAR, not including focused degassing through the active centers.Reference Lee133 For our estimate, we use the midpoint of the range presented by Hunt et al.Reference Hunt, Zafu, Mather, Pyle and Barry134 because our aim is to estimate volcanic degassing; this value is one-third of the total CO2 emissions from all diffuse sources in our compilation (Supplemental Table 8.3). While the estimates of EAR fault-related degassingReference Lee133 are not volcanic per se, isotopic evidence suggests there exists a significant flux of mantle-derived CO2 to the atmosphere through these structures, and using these data would increase significantly the global contribution of the EAR. We caution that both studies found relatively few measurements of modest to high CO2 flux in faulted or hydrothermal areas and that these results were then extrapolated over extensive regions. Significant uncertainty is associated with such large-scale extrapolations, particularly when diffuse CO2 flux can vary on meter scales. However, it is clear the EAR is a very important region for global CO2 emissions, and more work is needed to quantify the flux of CO2 from this and other areas of continental rifting/extension that support volcanism and hydrothermal activity, such as the Rio Grande Rift in New Mexico and the Rhine Graben and the Eger Rift in Central Europe. Such areas could potentially add 30–40 Tg CO2/yr (or 8–11 Tg C/yr) to global budgets, and potentially be on the same order as global arc fluxes.
8.5 The Next Iteration of Global Volcanic CO2 Emissions
As our understanding of the distribution and magnitude of volcanic and magmatic CO2 degassing evolves, so will our ability to estimate accurately the present-day global CO2 emission from these areas. As a culmination of the DECADE program, scientists came together in May 2018 to constrain better the total global CO2 flux from volcanic regions, as well as corresponding uncertainties. Here, we follow simple methods based on the extrapolation of measured data to determine a global subaerial volcanic CO2 budget (Supplemental Table 8.4). Our methods are similar – and thus comparable – to previous studies,Reference Burton, Sawyer, Granieri, Hazen, Jones and Baross15, Reference Shinohara57 but future work should focus on a rigorous statistical analysis of the data and more complex extrapolation procedures that lie beyond the scope of this chapter.
We break down the subaerial volcanic budget into three main categories: (1) passive degassing for active volcanoes, dividing these into those that have been detected by OMI and those that have not; (2) diffuse emissions from both active and dormant volcanoes, with groundwater contributions (not estimated) and large degassing provinces as separate categories; and (3) eruptive emissions. We first calculate the average of the measurements of CO2 flux from the volcanoes that have been measured using ground-based or airborne techniques (i.e. measured directly) that were detected by OMIReference Carn, Fioletov, McLinden, Li and Krotkov75 (58 of 91 volcanoes in Supplemental Table 8.1) and apply the average emission from these volcanoes (1730 ± 440 t/d, mean and standard error) to the 83 volcanoes (Section 8.4.1) that were degassing and detected by OMI globally on an annual basis between 2005 and 2015, yielding 52 ± 13 Tg CO2/yr (Supplemental Table 8.4) for this set of volcanoes. Multiplying the average of the remaining 33 volcanoes from Supplemental Table 8.1 (i.e. those that do not emit SO2 in large enough quantities to be detected by OMI – the average CO2 output of these volcanoes is 300 ± 68 t/d; Supplemental Table 8.4) to 324 volcanoes results in 35 ± 8 Tg CO2/yr. The sum of these results in 88 ± 21 for passive degassing from active volcanoes (Supplemental Table 8.4). How the value of 324 volcanoes was determined is discussed in Section 8.4.3. The uncertainty in this number is difficult to quantify without global arc-wide assessments of the numbers of expected degassing volcanoes that have not been detected by OMI. To put this number in context, there are 169 active volcanoes in the United States, and 81 (47%) have notable degassing as determined through visual surveys.Reference Moran139 Of these, 28 (17%) are thought to have plumes large enough for airborne measurements, but only 8 (4%) were detected by OMI.Reference Carn, Fioletov, McLinden, Li and Krotkov75 Thus, 90% of the US volcanoes that emit CO2 and 71% of the US volcanoes that have plumes large enough for airborne surveying were not detected for passive degassing of SO2 by OMI. Similarly, of the 19 persistently degassing volcanoes in JapanReference Mori112 during the period of OMI measurements, only 7 were detected by OMIReference Carn, Fioletov, McLinden, Li and Krotkov75 (i.e. 63% were not detected by OMI). If this relationship were to hold globally (i.e. that 63–71% of volcanoes with significant CO2 emissions are not detected by OMI), this would suggest that 245–313 volcanoes with notable plume emissions worldwide remain undetected by OMI, which is similar to the value we used. We suggest that completing a global assessment of which volcanoes are degassing, and the nature of that degassing, based on visual assessment and documented activity in the GVP database would lead to a much more accurate estimate of the number of degassing volcanoes globally than the methods used here. However, it must be considered that additional invisible or nearly invisible emissions of CO2 may also exist.Reference Poland, Miklius, Jeff Sutton and Thornber140–Reference Ilyinskaya142
As discussed above, the CO2 contribution from explosive eruptions is poorly constrained. Here, we estimate eruptive emissions of CO2 (Supplemental Table 8.2) by combining recent decadal-scale (2005–2018) SO2 fluxes derived from satellite measurements of eruptionsReference Carn143 with the most representative CO2/SO2 ratios measured at corresponding volcanoes, and separate these data into explosive and effusive events (Supplemental Table 8.2). In previous estimates, CO2/SO2 ratios were assumed to have uniformly high values of 10 and 7 in the pre-eruptive vapors of silicic and basaltic magmas, respectively.Reference Shinohara57 Such an assumption is reasonable for initial phases, but is not necessarily valid for the whole eruption length. The figure we obtain by using measured ratios (0.6 Tg/yr; Supplemental Table 8.2) is much lower than previously estimated based on theoretical ratios (7 Tg/yrReference Shinohara57). We anticipate that our value is likely underestimated and that the true answer may lie between these two values. Regardless, the estimates show that explosive emissions are minimal compared to the passive degassing estimates. CO2 emissions from effusive eruptions in the same period (Supplemental Table 8.2) are inferred by subtracting explosive CO2 emissions from the total CO2 load from all eruptions. In this case, the calculated contribution is similar to previous estimates (1.3 compared to 1 Tg/yr CO2 for effusive eruptionsReference Shinohara57), and again the contribution is a small fraction of the total subaerial budget.
Our calculations suggest that diffuse degassing of CO2 from volcanoes is only slightly lower than that from active volcanic vent emissions, with diffuse emissions estimated at 83 ± 15 Tg/yr. However, combined contribution of 170 Tg/yr CO2 from diffuse degassing from all volcanic–hydrothermal systems, including groundwater contributions and degassing related to large regions of intrusive magmatic activity is higher (Supplemental Table 8.4). This value is likely an underestimate given that fumarolic contributions (focused venting/small fumaroles) in regions of diffuse degassing are often not quantified as part of the estimation of degassing across such regions, and because groundwater contributions are largely unquantified. Furthermore, we anticipate the discovery of additional large emission sources as many of the countries with the highest potential for geothermal power generation have few measurements.
In total, we conservatively estimate global subaerial volcanic CO2 emissions to lie between ~220 and 300 Tg CO2/yr, and between ~280 and 360 Tg CO2/yr including the contribution of MOR (Supplemental Table 8.4), based on currently known sources. Our estimates are lower than those published by Burton et al.,Reference Burton, Sawyer, Granieri, Hazen, Jones and Baross15 but higher than previous estimates for global subaerial sources.Reference Morner and Etiope111, Reference Marty and Tolstikhin144
8.6 Temporal Variability of Volcanic Degassing
8.6.1 Comparison of the Temporal Variability of CO2 Emission from Active and Less Active Volcanoes
Most of what we now know about the temporal evolution of CO2 emissions from volcanoes has been learned in the last two decades. Advances in instrumental techniques now permit continuous, real-time monitoring.Reference Aiuppa51, Reference de Moor56, Reference Aiuppa145 The trends emerging from these data show that emissions vary dramatically with volcanic setting (Figure 8.1) and that timescales of observation are important for understanding the relative contributions from different systems. Active volcanoes with open-vent degassing such as Stromboli and Mount Etna (Italy) show orders of magnitude variability over very short time frames (Figure 8.6) correlating with magma supply and eruptive activity.Reference Aiuppa53, Reference Aiuppa54, Reference Aiuppa146 In such active, often mafic systems, volatiles reach the atmosphere via magma convection, permeable gas flow, or bubble rise through low-viscosity melts.Reference Shinohara18, Reference Kazahaya, Shinohara and Saito147 Despite short-term variability, the long-term average output at these volcanoes stays relatively constant over multiyear periods (Figure 8.4). In some cases, paroxysmal-type activity will increase emissions for over a year before returning to the long-term average (see Stromboli, 2006; Figures 8.4b and 8.6). Minor eruptive activity, on the other hand, can be difficult to discern in long-term trends. For instance, White Island and Ruapehu (New Zealand) demonstrate steady emissions over decadal periods during which eruptive activity is barely detectable (Figure 8.4c).
Temporal variability of CO2 emissions from some of the best-studied volcanoes in the world. Emissions from open-vent volcanoes vary dramatically in time, whereas diffuse emissions are buffered and show less variability. Solfatara data from Ref. Reference Cardellini117, Mammoth data from Ref. Reference Werner116, Stromboli data from Ref. Reference Aiuppa118, and Etna data from Ref. Reference Aiuppa148.
Closed-system volcanoes, or volcanoes that oscillate between closed- and open-vent degassing, can show dramatic variability in emissions over periods of years related to magma intrusion and variations in conduit permeability. Increases in CO2 emission rates are typically associated with eruptive activity (Redoubt; Figure 8.4a) and sometimes when intrusions occur without eruption.Reference Werner, Doukas and Kelly92 Periods of unrest can last months to years and are often accompanied by increases in emissions that then decrease exponentially following eruptive activity. Such behavior has been better documented for SO2 emissions,Reference Kazahaya89, Reference McGee149 but is mirrored by CO2 emissions where measured (e.g. Redoubt in 1989 and 2009;Reference Werner65 Figure 8.4a).
Over an entire arc, the dominant volcanic CO2 producers may vary over decadal timescales, with some volcanoes becoming more or less active. A recent compilation of data for the Central American Arc estimated an arc-scale CO2 output one order of magnitude higher (22,500 ± 4900 t/dReference de Moor56) than previous estimates, owing to the reactivation of Turrialba Volcano, as well as an increase in CO2 flux from Momotombo and Masaya volcanoes over the previous decade. Other arc segments have had similar changes to the overall degassing budget due to the reactivation of particular volcanoes (e.g. Miyakajima in JapanReference Mori112).
Finally, large-caldera systems are thought to be underlain by silicic magma bodies, and in turn underplated by mafic magma.Reference Wallace109 The CO2 emissions from such volcanoes, often modulated by large hydrothermal systems, show much less variability over annual or even decadal scales than emissions from active volcanoes (Figures 8.4 and 8.6). Where long-term measurements are available, small variations in the CO2 output in these systems often follow a geophysical manifestation of magma movement at depthReference Werner116, Reference Chiodini150 whereby the transport of the gas to the surface is buffered by the overlying crust.
8.6.2 Using the Temporal Variability of CO2/SO2 in Volcanic Gas for Eruption Forecasting
It has been shown that the relative proportions of C and S change prior to and during eruptive activity.Reference Giggenbach151, Reference Fischer, Arehart, Sturchio and Williams152 Owing to the low solubility of CO2 in silicate melts,Reference Dixon and Stolper153 the magmatic vapor phase typically has a high molar C/S ratio at depths of >~5 km in the crust,Reference Scaillet and Pichavant102 and then C/S decreases with magma ascent as more S exsolves from the magma.Reference Werner141, Reference Aiuppa146 With more frequent monitoring of pre-eruptive volcanic gas using Multi-GAS, we now know that an elevated C/S in gas emissions is common prior to the onset of eruptions.Reference Aiuppa51, Reference de Moor55, Reference Aiuppa154 In Figure 8.7a, we show variability of C/S over various timescales for 12 episodes at 7 volcanoes. One can observe that C/S ratios increased to between 15 and 43 in the months to hours preceding eruption at five well-monitored basaltic volcanoes, whereas the long-term C/S signature of shallow degassing at these volcanoes typically lies between 2 and 7 (Figure 8.7a to j). Such trends are often interpreted as the migration of deeply sourced gas bubbles prior to magma ascent.Reference Aiuppa53, Reference Aiuppa155
(a to j) Trends in C/S ratio observed at basaltic volcanoes monitored with Multi-GAS instruments, with elevated C/S documented in the months to hours prior to eruption. (k and l) Observations of elevated high C/S ratios in the years prior to eruption. Decreasing trends in C/S ratios were observed in the last 100 days prior to eruption. Both the symbol size and color scale with C/S ratio, with larger and warmer symbols relating to higher C/S ratios. Data from Refs. Reference Aiuppa118, Reference Poland, Miklius, Jeff Sutton and Thornber140, Reference Werner141, Reference Aiuppa148, Reference Aiuppa155, and Reference de Moor156. At Masaya, the volcano (e) did not erupt, but rather experienced the opening of a new lava lake. At Redoubt, three values in excess of 80 related to a period of SO2 scrubbing in the month prior to eruption were removed – see Ref. Reference Werner141 for details.

A second set of C/S ratio observations has been made over somewhat longer timescales and is related to degassing of deep-seated magmas prior to ascent (Figures 8.7k and l). Months- to years-long trends in C/S were observed at both RedoubtReference Werner141 and KilaueaReference Poland, Miklius, Jeff Sutton and Thornber140 volcanoes prior to eruption (Figure 8.7b). In both cases, the C/S ratio was very high compared to the data observed at the other volcanoes, reaching values between 80 and 200, and both were associated with no visible plume (Figure 8.8). Documentation of this type of degassing is rare, but the occurrence is likely not rare. In the case of Redoubt, the pre-eruptive degassing of CO2 only amounted to roughly 15% of the total budget,Reference Werner65 but for Kilauea nearly 30 Mt of gas escaped prior to eruption. Similar patterns of pre-eruptive gas release might be inferred, for instance, from the Holuhraun/Bárðarbunga eruption, where a total of 9.6 Mt SO2 and 5.1 Mt CO2 was emitted over the course of the eruption.Reference Pfeffer157 The low bulk C/S ratio (0.7) compared to most high-temperature volcanic gasesReference Aiuppa, Fischer, Plank, Robidoux and Di Napoli73 might imply that substantial amounts of CO2 degassed before monitoring began. In fact, a new study discovered significant degassing from glacially covered Katla volcano (~37 kt/d CO2) in the absence of a visible plume, unusual geophysical unrest, or S gas emission.Reference Ilyinskaya142 These studies highlight a gap in our ability to detect CO2 degassing from volcanoes without dedicated airborne surveys downwind of potentially degassing volcanoes.
Images of volcanoes emitting significant quantities of volcanic CO2 in the absence of a visible plume.

8.7 Sources of Carbon Outgassed from Volcanoes
Carbon outgassed at subduction zone volcanoes is sourced from the mantle, the subducted slab, and the overlying lithosphere (including the crust),Reference Allard158–Reference Marty, Jambon and Sano162 whereas CO2 released from MORs and hot spots is dominated by mantle carbon.Reference Marty and Tolstikhin144, Reference Marty and Jambon161 The carbon isotopic composition (δ13C) of the depleted MOR mantle (DMM) is –5 ± 1Reference Cartigny, Jendrzejewski, Pineau, Petit and Javoy163, Reference Marty and Zimmermann164 and that of plumes is documented as –3.1 ± 1.9 (high-temperature fluids from IcelandReference Barry, Hilton, Füri, Halldórsson and Grönvold165) and –3.4‰ (Kilauea summit gasReference Gerlach and Taylor166), whereas the subcontinental lithospheric mantle likely contains carbon of composition between –3.5‰Reference Lee133, Reference Fischer167 and –6‰.Reference Barry168 Research on CO2 sources in subduction-zone volcanic gases has emphasized the role of carbon release from subducted sediments and carbonates and has shown that the type of material subducted imprints a carbon isotopic and C/3He signature on the discharging gases. This approach, combined with CO2 fluxes from volcanoes, led to the development of volatile budgets in subduction zones and implies that more carbon is subducted than what is currently released by volcanoes, leading to the transfer of carbon into the deeper mantle and beyond the zones of arc magma generation.Reference Hilton, Fischer and Marty70, Reference Sano and Williams79, Reference de Leeuw, Hilton, Fischer and Walker169, Reference Shaw, Hilton, Fischer, Walker and Alvarado170 Accumulation of subducted carbon below the arc crust or continental lithosphere has been suggested as a mechanism for long-term carbon storage, removing the requirement for carbon subduction into the deeper mantle to balance the input versus output budgets at arcs.Reference Kelemen and Manning171 The extent to which this process occurs globally is poorly constrained, but it could significantly affect the carbon isotope composition of the mantle wedge and therefore the mantle component sampled by arc volcanic gases. Recently, researchers have highlighted, in addition to the subducted carbon source, the potential significance of carbon assimilation from the overlying crust in continental arc magmas as a major source of CO2 degassing from volcanoes, both today and in the geologic past.Reference Mason, Edmonds and Turchyn4, Reference Lee172, Reference Troll173 In particular, this crustally sourced carbon can have profound effects on the generation of arc magmas,Reference Carter and Dasgupta174 the explosive activity of a volcano,Reference Troll173, Reference Deegan175 and long-term climate change resulting from CO2 release into the atmosphere.Reference Lee172
The approach most commonly taken when assessing the contribution of volatiles from the crust is to use helium isotopes, which range widely in volcanic gases from values that approach pure crustal sources of ~0.02 Ra, where Ra is the 3He/4He ratio of air at 1.4 × 10⁻⁶, to 29 Ra in fluids discharged from hot spot hydrothermal systems and volcanoes.Reference Sano, Fischer and Burnard176 In subduction-zone settings, 3He/4He ratios of gas discharges range from the crustal value to 10 Ra,Reference Sano, Fischer and Burnard176 with an unweighted average of 5.4 Ra.Reference Hilton, Fischer and Marty70 A recent compilation of maximum 3He/4He ratios of arc gases shows a global average of 7.4 ± 1.5 Ra,Reference Sano, Fischer and Burnard176 overlapping with the mid-ocean ridge basalt (MORB) value (Figure 8.9). The main process that lowers 3He/4He in arc gases is the contribution of 4He from crustal sources through either magma assimilation of crustal rocks or interaction of magmatic fluids with crustal fluids at shallow depths.Reference Sano, Fischer and Burnard176 Such processes may also affect the carbon isotopic signature. Plotting the δ13C and 3He/4He of arc gases shows that: (1) very few samples plot in the DMM range for both helium and carbon, implying that subducted and/or crustal carbon affects the isotopic composition and the amount of CO2 at arc volcanoes; (2) samples where 3He/4He is 7 ± 1 Ra have δ13C values ranging from +2‰ to –12‰, implying that if the source of CO2 is from the subducted slab, it is sourced from both carbonates and organic carbon. Alternatively, the wide δ13C range for samples with Ra > 7 could be the result of modification of the mantle beneath arc volcanoes due to prior subduction events that affected carbon, but not helium; and (3) gases with 3He/4He values <7 Ra show an equally wide distribution of δ13C as those >7 Ra, implying that both carbonate and organic carbon derived from the overlying crust (as implied by low 3He/4He) may contribute to the degassing CO2.
(a) Helium and carbon isotope signatures for volcanic and hydrothermal gas discharges and (b) data from discharges with vent temperatures >200°C. Data from Refs. Reference Hilton, Fischer and Marty70 and Reference Evans179–Reference Symonds182. The field for DMM is from Refs. Reference Marty, Jambon and Sano162 and Reference Cartigny, Jendrzejewski, Pineau, Petit and Javoy163. The global data for arcs are from Ref. Reference Hilton, Fischer and Marty70 and represent a non-weighted global average. The maximum global average for arcs is from Ref. Reference Sano, Fischer and Burnard176 and represents the average of the maximum 3He/4He ratios measured at a given locality.

Most helium and carbon isotope data are from low-temperature (<100°C) bubbling springs and fumaroles, which can be affected by low-temperature carbon isotope fractionation in the crust and shallow hydrothermal systems.Reference Ray, Hilton, Munoz, Fischer and Shaw177, Reference van Soest, Hilton and Kreulen178 If we only consider >200°C gases (Figure 8.9b), which are more likely to reflect their source, the range in δ13C remains from –12‰ to 0‰ for both gases with 3He/4He values >7 and <7 Ra, with the same implications as stated above.
Recently, a different approach has been used to evaluate the sources of carbon in volcanic emissions, using the C/S ratio of volcanic gases in crater plumes and high-temperature (>450°C) fumaroles.Reference Aiuppa, Fischer, Plank, Robidoux and Di Napoli73 Selection of only high-temperature samples ensures that secondary hydrothermal processes do not affect the data set. The advantage of this approach is that many more data are available for C/S ratios than for isotope systematics, allowing for a more complete global coverage. Correlations with petrologic indicators of slab-derived fluids such as the Ba/La ratios of erupted materials allows distinction between emissions that have predominantly crustally derived CO2 and emissions that show a strong subducted slab carbon component.Reference Aiuppa, Fischer, Plank, Robidoux and Di Napoli73 This global data set further reveals that only some gases with high C/S ratios (>4) are from locations where volcanoes sit on upper-plate carbonates. The data set further shows that volcanoes with low C/S ratios (<2) are in locations where the subducting sediments contain only <10% CO2. This study shows that the carbon contribution from assimilation in the overriding crust may be significant in some localities (Italy, Indonesia, Central America, Lesser Antilles), but an important factor affecting the C/S ratio and CO2 source in arc volcanoes is the subducting slab. As with the isotope approach, more work is needed since the C/S ratio in volcanic gas discharges is also significantly affected by volcanic activity, the presence of accumulated carbon-rich exsolved vapor in magma reservoirs,Reference Burgisser, Alletti and Scaillet107 and degassing processes. Long-term records are thus needed to constrain the average and representative C/S ratio of a particular volcano.
8.8 Volcanic Release of CO2 over Geologic Time
The modern-day volcanic carbon flux is a snapshot in time. We have shown that the modern-day flux of volcanic carbon could be dominated by the diffuse degassing of volcanic regions and large calderas (Figure 8.3b). Equally important for the global volcanic flux are a number of large volcanic point sources that represent Earth’s most active volcanoes (Figure 8.3a); these volcanoes are in a range of geologic settings (arc, ocean island/mantle plume, continental rift).
Over 1‑Ma timescales, the flux of volcanic carbon to Earth’s surface is counteracted by the drawdown of CO2 by silicate weathering and the associated precipitation of marine carbonates, as well as the burial of organic carbon. Perturbations to carbon outgassing are compensated for by changes in the rate of silicate weathering (which is enhanced under conditions of high pCO2 and atmosphere temperature), keeping the surface reservoir approximately in balance. There have been periods through Earth history, however, when volcanism has been enhanced, causing perturbations to atmospheric CO2 that have persisted for a range of timescales. Although our study of modern volcanic carbon fluxes tells us little about the carbon cycle response to such perturbations in Earth’s past, there are insights to be gained from modern observations of the magnitude of the flux from individual volcanoes and from larger regions, the nature of the flux (direct or diffuse), and its variability with time.
The processes of subduction, deep carbonated eclogite melting,Reference Dasgupta and Hirschmann5 and fluid addition to the subcontinental lithosphere from the convecting asthenosphere over time have led to the subcontinental lithosphere becoming a large carbon sink.Reference Foley and Fischer183 Over Earth’s past, supercontinents have accreted and broken apart. It has been recognized that periods of greenhouse climate correlate with supercontinents in the geological record,Reference Lee133, Reference McKenzie184 and this has been attributed to the prevalence of high-flux continental arc volcanoes, which may capture carbon not only from the downgoing slabs, but also from the devolatilization of carbonate platforms in the overlying continental crust. In the Cretaceous, for example, Gondwana’s breakup led to the closure of the Tethys Ocean, accretion and subduction of marine carbonate platforms and the formation of a long subduction zone that may have been an important source of global volcanic CO2Reference Mason, Edmonds and Turchyn4, Reference Lee172, Reference Lee, Thurner, Paterson and Cao185 (reviewed further in Chapter 11).
The results of our modern-day volcanic CO2 studies have shown, however, that the continental rifts themselves may also be important sources of carbon outgassing, which may in fact be larger than the surrounding continental arcs, certainly enhancing CO2 output and warming during the initial stages of continental breakup and providing a way for short-term tectonics and volcanism to impact climate.Reference Foley and Fischer183
8.9 Synthesis
Considerable progress has been made in the last decade in quantifying CO2 emissions from volcanic areas worldwide. Technological advances, including widespread use of miniturized UV spectometer systems and Multi-GAS instruments, have resulted in a greater number of CO2 measurements. Volcanic CO2 emissions have been measured for a few decades, which is short in terms of the eruptive cycles at many of Earth’s volcanoes. Measurements are heavily biased toward eruptive periods, and average emissions for some active volcanoes are decreasing as longer records become available. Global satellite studies of decadal-scale SO2 emission from Earth’s most active volcanoes, when combined with a complete C/S data set, will allow for an accurate estimate of persistent CO2 degassing in the near future. We suggest the highest 10–20 SO2-emitting volcanoes be prioritized for measurement as these volcanoes may dominate the total CO2 output from active volcanoes. CO2 emissions from volcanoes with SO2 output below satellite detection limits are not as well quantified, yet the emissions from these sources could be significant at a global scale. More work is needed to determine both the magnitude of these emissions and how widespread these volcanoes are globally.
Our knowledge of diffuse degassing at active and dormant volcanoes continues to improve. The distribution of diffuse fluxes is similar to the distribution of CO2 emissions from active volcanoes, and there are several areas worldwide with large, intrusive magma bodies where the diffuse fluxes are globally significant. More effort is needed to quantify emissions in these vast regions, as well as in the biggest 10–20 hydrothermal areas globally.
We summarize two decades of measurements at some well-studied volcanic systems that demonstrate that the slow release of CO2 from inactive or dormant volcanoes rivals that of active volcanoes when considered over long timescales. Regional volcanic CO2 fluxes are heavily influenced by individual volcanoes becoming more or less active, and thus measurements must be maintained over decadal scales to assess this variability quantitatively.
Vent emissions from active volcanoes vary by orders of magnitude over short (days to years) timescales, whereas diffuse emissions are largely buffered and show steadier rates through time. This variability is largely controlled by the plumbing of the volcanic systems. Active mafic volcanoes often host an open vent (with a free magma surface or lava lake) and volatiles are delivered rapidly to the surface, allowing for rapid variability. Larger silicic magmatic systems, sustained by the underplating of basaltic magmas, are characterized by steady diffuse outgassing over time.
Continuous Multi-GAS monitoring has improved eruption forecasting potential by showing that eruptions at mafic volcanoes are often preceded by an increase in the C/S gas ratio in the days to months prior to eruption. Long-term monitoring of some volcanoes shows months-long changes in the C/S ratio prior to eruption, and sometimes in the absence of eruption, which may accompany decompression of magma as it migrates from the lower to the upper crust. These later cases were often accompanied by the lack of a visible plume or SO2 emission, and thus more work is needed to identify when such plumes exist.
A fundamental challenge in carbon science is to constrain the deep global carbon budget and how much of the surface-derived carbon is recycled back into the mantle. In arc volcanoes, the source of volcanic CO2 is a combination of mantle and slab-derived C with a potentially significant crustal component, at least in some locations. A more complete understanding of the carbon balance at subduction zones requires quantification of the amount of carbon in the subducted lithologies. The pathways and fate of subducted carbon beyond the zones of arc magma generation determine where this carbon is ultimately stored and how it could potentially affect processes in different tectonic settings through time. While great progress has been made in terms of the quantification of carbon emissions from volcanic regions, more work is needed to constrain our understanding of the balance between surface and deep carbon through geologic time.
8.10 Limits to Knowledge of Volcanic Carbon
For all of the new data and understanding, significant gaps remain in our knowledge. Some of these gaps may persist, limited by technology or the logistics of measurement. The first gap in knowledge is caused by the lack of data for key volcanic systems. These include important point sources of volcanic SO2, such as Bagana, Tavurvur, and Manam (Papua New Guinea), as well as Aoba/Ambae (Vanuatu). Longer records are needed at most volcanoes globally to assess variability over decadal scales in relation to eruptive cycles and periods of repose. Better quantification of hydrothermal diffuse degassing is needed in areas already identified to be large CO2 emitters, such as Yellowstone (USA), the EAR (Africa), and the TVZ (New Zealand), and more measurements are needed in the vast regions of Southeast Asia and South America, where large hydrothermal systems exist. Further measurements are also needed in rifts such as the Eger Rift (Germany) and the Basin and Range (USA). Many of these targets are accessible, but require dedicated efforts over many years, and they would benefit from further technological development and improved measurement strategies. In this category we include global MORs and submarine back-arcs, for which only limited data exist. These measurements are logistically challenging, and it is unlikely that significant progress can be made without considerable effort and expense. More tractable approaches use primary melt geochemistry (Chapter 9) and geodynamic models to reconstruct CO2 budgets of submarine regions.
A fraction of the CO2 released from the degassing of silicate melts and directly from the mantle or crust may be dissolved into groundwaters and transported through aquifers, delivered to the surface via cold springs. This source of CO2 has not been quantified in most volcanic regions. Studies from central Italy have shown that significant quantities of inorganic carbon are dissolved in aquifers, derived from a mixture of biological sources, carbonate dissolution, and deep carbon sources.
Using the DECADE results thus far, it is possible to relate slab inputs at arc volcanoes to volcanic gas C/S signatures and to identify arcs and individual volcanoes where CO2-rich crustal fluids play a significant role. However, much work remains to be done in linking magma geochemistry to the composition of outgassing fluids and for understanding the fate of devolatilized carbon in the mantle wedge and the behavior and dynamics of magma- and crust-derived fluids in vertically protracted, complex magma reservoirs in the crust. These studies require a range of approaches, including thermodynamic and analog modeling and building detailed databases of magma geochemistry and volcanic gas composition for detailed empirical comparisons. Understanding the amount of carbon returned to the deep mantle is of fundamental importance to the carbon budget of Earth through time. Linking our understanding of the present-day volcanic carbon budget to studies of plate tectonic reconstructions is an aim for the future and is explored further by Lee et al. in Chapter 11 of this book.
Acknowledgments
The work presented here has only been possible thanks to the enormous contributions made by the scientists and technicians in the volcano gas community in recent years. Funding provided by the Alfred P. Sloan Foundation through the Deep Carbon Observatory has enabled a significant amount of new research from many regions around the world. Funding for this chapter was provided by the US Geological Survey Volcano Hazards Program. The authors thank Josh Wood for his contribution in drafting Figures 8.1 and 8.7 and Jake Lowenstern and one anonymous reviewer for valuable reviews. The authors thank the following people for their assistance in obtaining publicly available CO2 emission rate data, hydrothermal location data, and helpful suggestions and refinements of the text: Robin Campion, Bruce Christenson, Maarten deMoor, Tamar Elias, Kohei Kazahaya, Ryunosuke Kazahaya, Peter Kelly, Christoph Kern, Taryn Lopez, Jennifer Lewicki, Agnes Mazot, Chris Newhall, Mitch Owen, Vicentina Cruz Pauccara, Jim Stimac, Jeff Sutton, and Yuri Taran. The research leading to some of the results some of the results presented received funding from the European Research Council under the European Union’s Seventh Framework Programme (FP/2007–2013)/ERC Grant Agreement 279802, and RCUK NERC funding through the DisEqm project (NE/N018575/1).
Questions for the Classroom
1 How can we improve our estimates of volcanic CO2 emissions?
2 How can we quantify the CO2 contribution to the atmosphere from magmatic intrusions that do not lead to eruption and how can we better combine geophysical and geochemical studies to identify when such emissions occur?
3 What methods can advance our estimation of hydrothermal CO2 emissions?
4 How can we improve our knowledge of how many volcanoes are emitting CO2 in the absence of significant quantities of SO2?
5 How significant is CO2 degassing from magmas located at the base of the crust and how would we distinguish this from shallower magma degassing?
6 Can CO2 degas from the mantle without the presence of magma?
List of Online Resources
Eruptions, Earthquakes & Emissions Application Citation: Global Volcanism Program, 2016. Eruptions, Earthquakes & Emissions, v. 1.0 (Mobile application software). Smithsonian Institution. Accessed March 2018, retrieved from http://volcano.si.axismaps.io
Carn, S. A., Fioletov, V. E., McLinden, C. A., Li, C. & Krotkov, N. A. A decade of global volcanic SO2 emissions measured from space. Scientific Reports 7, 44095 (2017). Direct link: www.nature.com/articles/srep44095#supplementary-information
MaGa database: www.magadb.net
EarthChem Library: www.earthchem.org/library
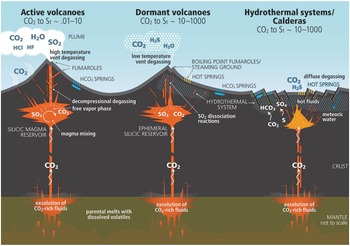
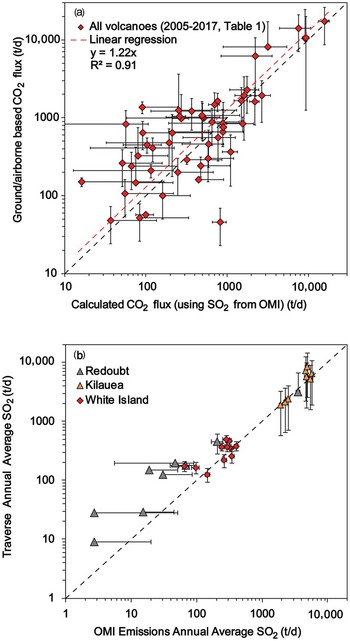
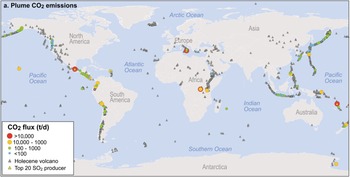
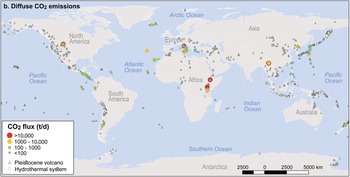
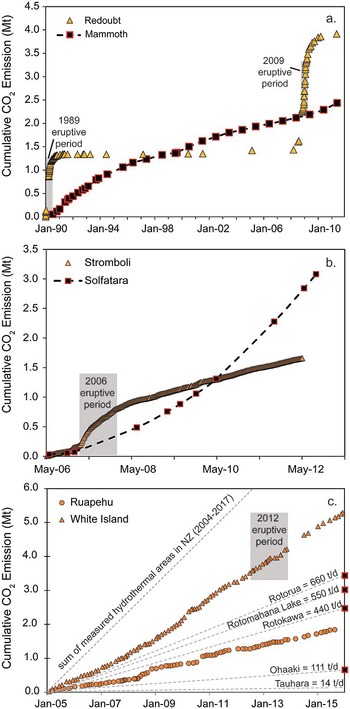


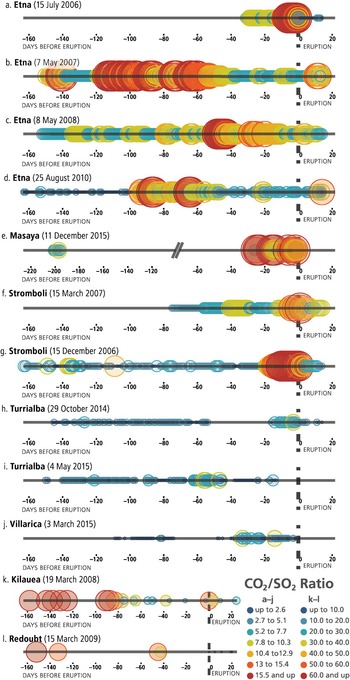
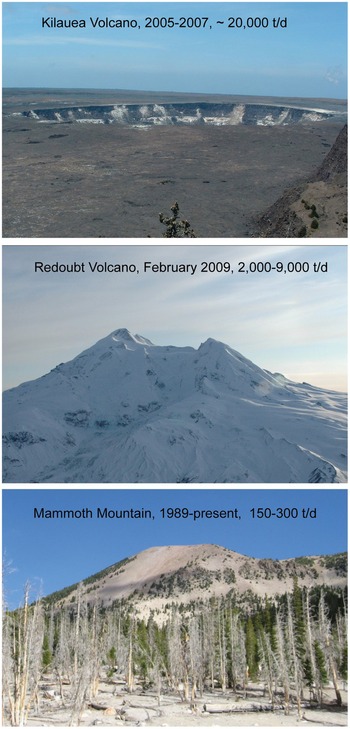
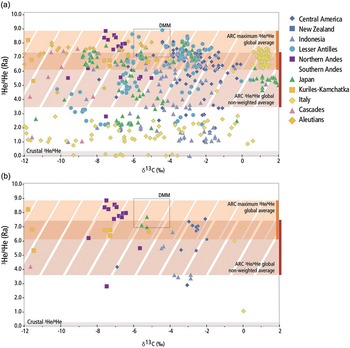

 Open access