


MOBILE GIS IN ARCHAEOLOGY
Geospatial technologies have substantially advanced documentation in archaeological fieldwork. Geographic information systems (GIS) have made it possible to integrate data (geographic and archaeological, alphanumeric, and photographs), regrouping all this information inside a georeferenced digital interface through which it can be integrated, consulted, and analyzed. However, despite the potential of GIS for application to the different phases of work in archaeology (e.g., remote sensing, database queries, mapping), dialogue on the application of GIS in archaeology has focused on spatial analysis such as location patterns of archaeological sites (e.g., Gillings et al. Reference Gillings, Mattingly and van Dalen1999; Grau Mira Reference Grau Mira2006; Lock Reference Lock2000; Mayoral Herrera et al. Reference Mayoral Herrera, Parcero-Oubiña and Fábrega-Álvarez2017). Although spatial analysis has been carried out with GIS for at least two decades, the recording of archaeological information in the field continues to be performed, to a great extent, on paper (cards, notebook, and nondigital maps) or with nonintegrated technologies (e.g., handheld GPS, databases, cameras). This requires a considerable effort in the postprocessing phase to then link all of the different sources of information. Handling so many devices is uncomfortable, and it hinders consultation of the information recorded in real time.
In recent years, GIS applications oriented toward fieldwork have gained ground in archaeology. These applications, known as “mobile GIS applications,” could be defined as GIS software aimed at the registration and consultation of data on mobile devices (e.g., tablets, PDAs). Not many articles have been published on the use of mobile GIS for the archaeological record (see Chyla and Bulawka Reference Chyla, Bulawka, Glover, Moss and Rissolo2020), given that most of the published literature being produced concerns paid software (e.g., Ames et al. Reference Ames, Shaw, O'Driscoll and Mackay2020; Lindsay and Kong Reference Lindsay and Kong2020). If the functional conception of mobile GIS applications is examined, two generations can be distinguished. The first, developed just over a decade ago, was conceived as a simplification of GIS software to be used in field devices, with the most successful application of this generation being ArcPad (Esri Co.). Although its use required no programming skills at all (Tripcevich Reference Tripcevich2004), this first-generation mobile GIS application requires GIS knowledge, both on the part of the administrator and the users of the GIS mobile application. Although the previous statement is debatable, the experience of the first author with these applications throughout 10 years of projects in Chile reveals the problems that users unaccustomed to GIS software may have when using mobile GIS applications (Parcero-Oubiña et al. Reference Parcero-Oubiña, Fábrega-Álvarez, Troncoso, Salazar, Hayashida, Borie and Pino2017). The second generation of mobile GIS applications, developed in recent years, also requires the role of GIS user for administration tasks, although no prior skills are necessary on the part of the field user (Chyla and Bulawka Reference Chyla, Bulawka, Glover, Moss and Rissolo2020) for consulting and recording information tasks. However, the most important change to free the field user of GIS knowledge is the simplification that second-generation mobile GIS applications propose through a simple interface that guides the successive steps of information creation (editing geometry, attributes, and photographs). Second-generation applications could generalize the use of mobile GIS in fieldwork projects “providing an easy and efficient workflow for GIS nonspecialist” as Lindsay and Kong (Reference Lindsay and Kong2020:325; cf. Fee Reference Fee, Averett, Gordon and Counts2016) state for the ArcGIS Collector application. Furthermore, it is important to highlight the fact that new applications can be used directly from smartphones (Android/iOS), reducing project cost (e.g., there is no need to buy tablets for carrying out paperless surveys).
Most field archaeology projects do not use mobile GIS applications. Indeed, their use is anecdotal in Latin America. In general, the use of GIS in Latin American archaeology has only emerged in the last decade (2010–2020). In this sense, the first publications that compile articles regarding GIS and archaeology are revealing; whereas in some countries (e.g., UK, USA) this took place in the 1990s (Allen et al. Reference Allen, Green and Zubrow1990) and in Spain in the first decade of the twenty-first century (Grau Mira Reference Grau Mira2006), in Latin America, this occurred during the 2010s and at different rates in different countries (Figuerero-Torres and Izeta Reference Figuerero Torres and Izeta2013). In fact, the use of GIS in archaeology became common in Mexico and some Central American countries earlier than in South American countries (see Pastor et al. Reference Pastor, Flores and Sanjuán2013). This interest has been confirmed in recent years in Latin America, through the demand for training, both from outside (Mayoral Herrera et al. Reference Mayoral Herrera, Parcero-Oubiña and Fábrega-Álvarez2017) and from inside the continent, with the inclusion of GIS subjects in university teaching plans. Therefore, in archaeology, these second-generation mobile GIS applications present an opportunity to extend their use as a fundamental tool in fieldwork recording. On the other hand, mobile devices have also undergone changes. To date, their use in archaeology has practically only been via specialized field devices (PDAs, tablets). Consequently, prices have been very high. Integrated GNSS (Global Navigation Satellite Systems) have been developed to improve accuracy, whereas cameras, screens, storage, and batteries have expanded their capabilities. This development has been especially notable in smartphones, whose capabilities for use in the field have improved notably, as shall be mentioned below.
The aim of this article is to produce clear, simple, and virtually costless guidelines for implementing mobile GIS. Specifically, a methodological proposal is discussed in such a way that a team of archaeologists (only one of them a GIS user) can carry out archaeological surveys using free software (QGIS, QField application) and use available resources (open data, smartphones) in an area on the limits of technological resources (no phone signal, no high-resolution digital models). Therefore, the adaptation of the methodology to the contextual conditions of the project is discussed, including the geographic context, team logistics, and survey area. The methodology has opened up certain possibilities related to the project approach: (1) the online sharing of updated information by an international team; (2) a framework based on landscape archaeology, the methodologies of which rely heavily on the spatial interaction of archaeological and geographic information; (3) an incipient project with little funding and few possibilities of acquiring paid software or specific devices to be able to undertake fieldwork; (4) access to very large, difficult-to-reach remote areas, with poorly known archaeological features; (5) the implementation of guidelines on Spatial Infrastructure Data (SDI) that integrate heritage information at a national and international level, although there is still less development in AmericaFootnote 1 than in Europe.Footnote 2 Although these characteristics are specific to the project and make it possible to articulate the advantages of developing such a method, it must be pointed out that many of these advantages can be extended to other archaeological projects, especially in Latin America, and to contexts such as Andean archaeology. Therefore, the strategy discussed may be of interest in many other projects.
ARCHAEOLOGICAL AND GEOGRAPHIC CONTEXT
The archaeological project “Differential Use of the Landscape: An Approach to the North of the Hualfín Valley, Catamarca, Argentina” began in 2012 with the main objective of characterizing the dynamics of the Inka expansion, specifically in an area of the southern fringe of Tawantinsuyu (in the province of Catamarca, NW Argentina). The aim was to understand the mechanisms underlying the Inka dominion in this part of the empire and the way this power was sustained over time by investigating the political, economic, cultural, and religious landscapes as mutually dependent elements. The importance of studying conquered territories located far from imperial centers lies in its potential to understand the various relationships established between the local populations (agropastoral societies) and their territories.
The study area extends along the Hualfín Valley, at the center of the Catamarca province, with an area of approximately 200 km2 (Figure 1). Most of the archaeological sites known in this area date from approximately 200 BC to the Spanish conquest, and they are representative of a long period of occupation of the landscape (over 1,000 years; Balesta and Zagorodny Reference Balesta and Zagorodny2010; Lynch Reference Lynch2013; Lynch et al. Reference Lynch, Giovannetti and Páez2013, Reference Lynch, Parcero-Oubiña and Fábrega-Álvarez2020; Sempé et al. Reference Sempé, Salceda and Mafia2005; Wynveldt et al. Reference Wynveldt, Balesta and Lucci2013, among others). Although several archaeological sites have been identified and recorded in the area, the northern sector of the Hualfín Valley has not been intensively explored, with the exception of recent studies carried out on specific sites (Lynch Reference Lynch2013; Lynch et al. Reference Lynch, Giovannetti and Páez2013, Reference Lynch, Parcero-Oubiña and Fábrega-Álvarez2020), which lack general context. Fieldwork in this area involves many practical challenges, mostly related to a rugged topography and a poor superficial visibility of the archaeological sites. Apart from the most monumental sites, some new sites have been discovered in recent years. Most of them are inconspicuous, with few remains of rock buildings visible on the ground. This characteristic, together with an explicit interest in the analysis of historical processes from a landscape perspective, demands a reassessment of the field methodologies used in the area so far, based mainly on the documentation of the remains of buildings and archaeological materials within them on the single-site scale.
Location of the survey area.
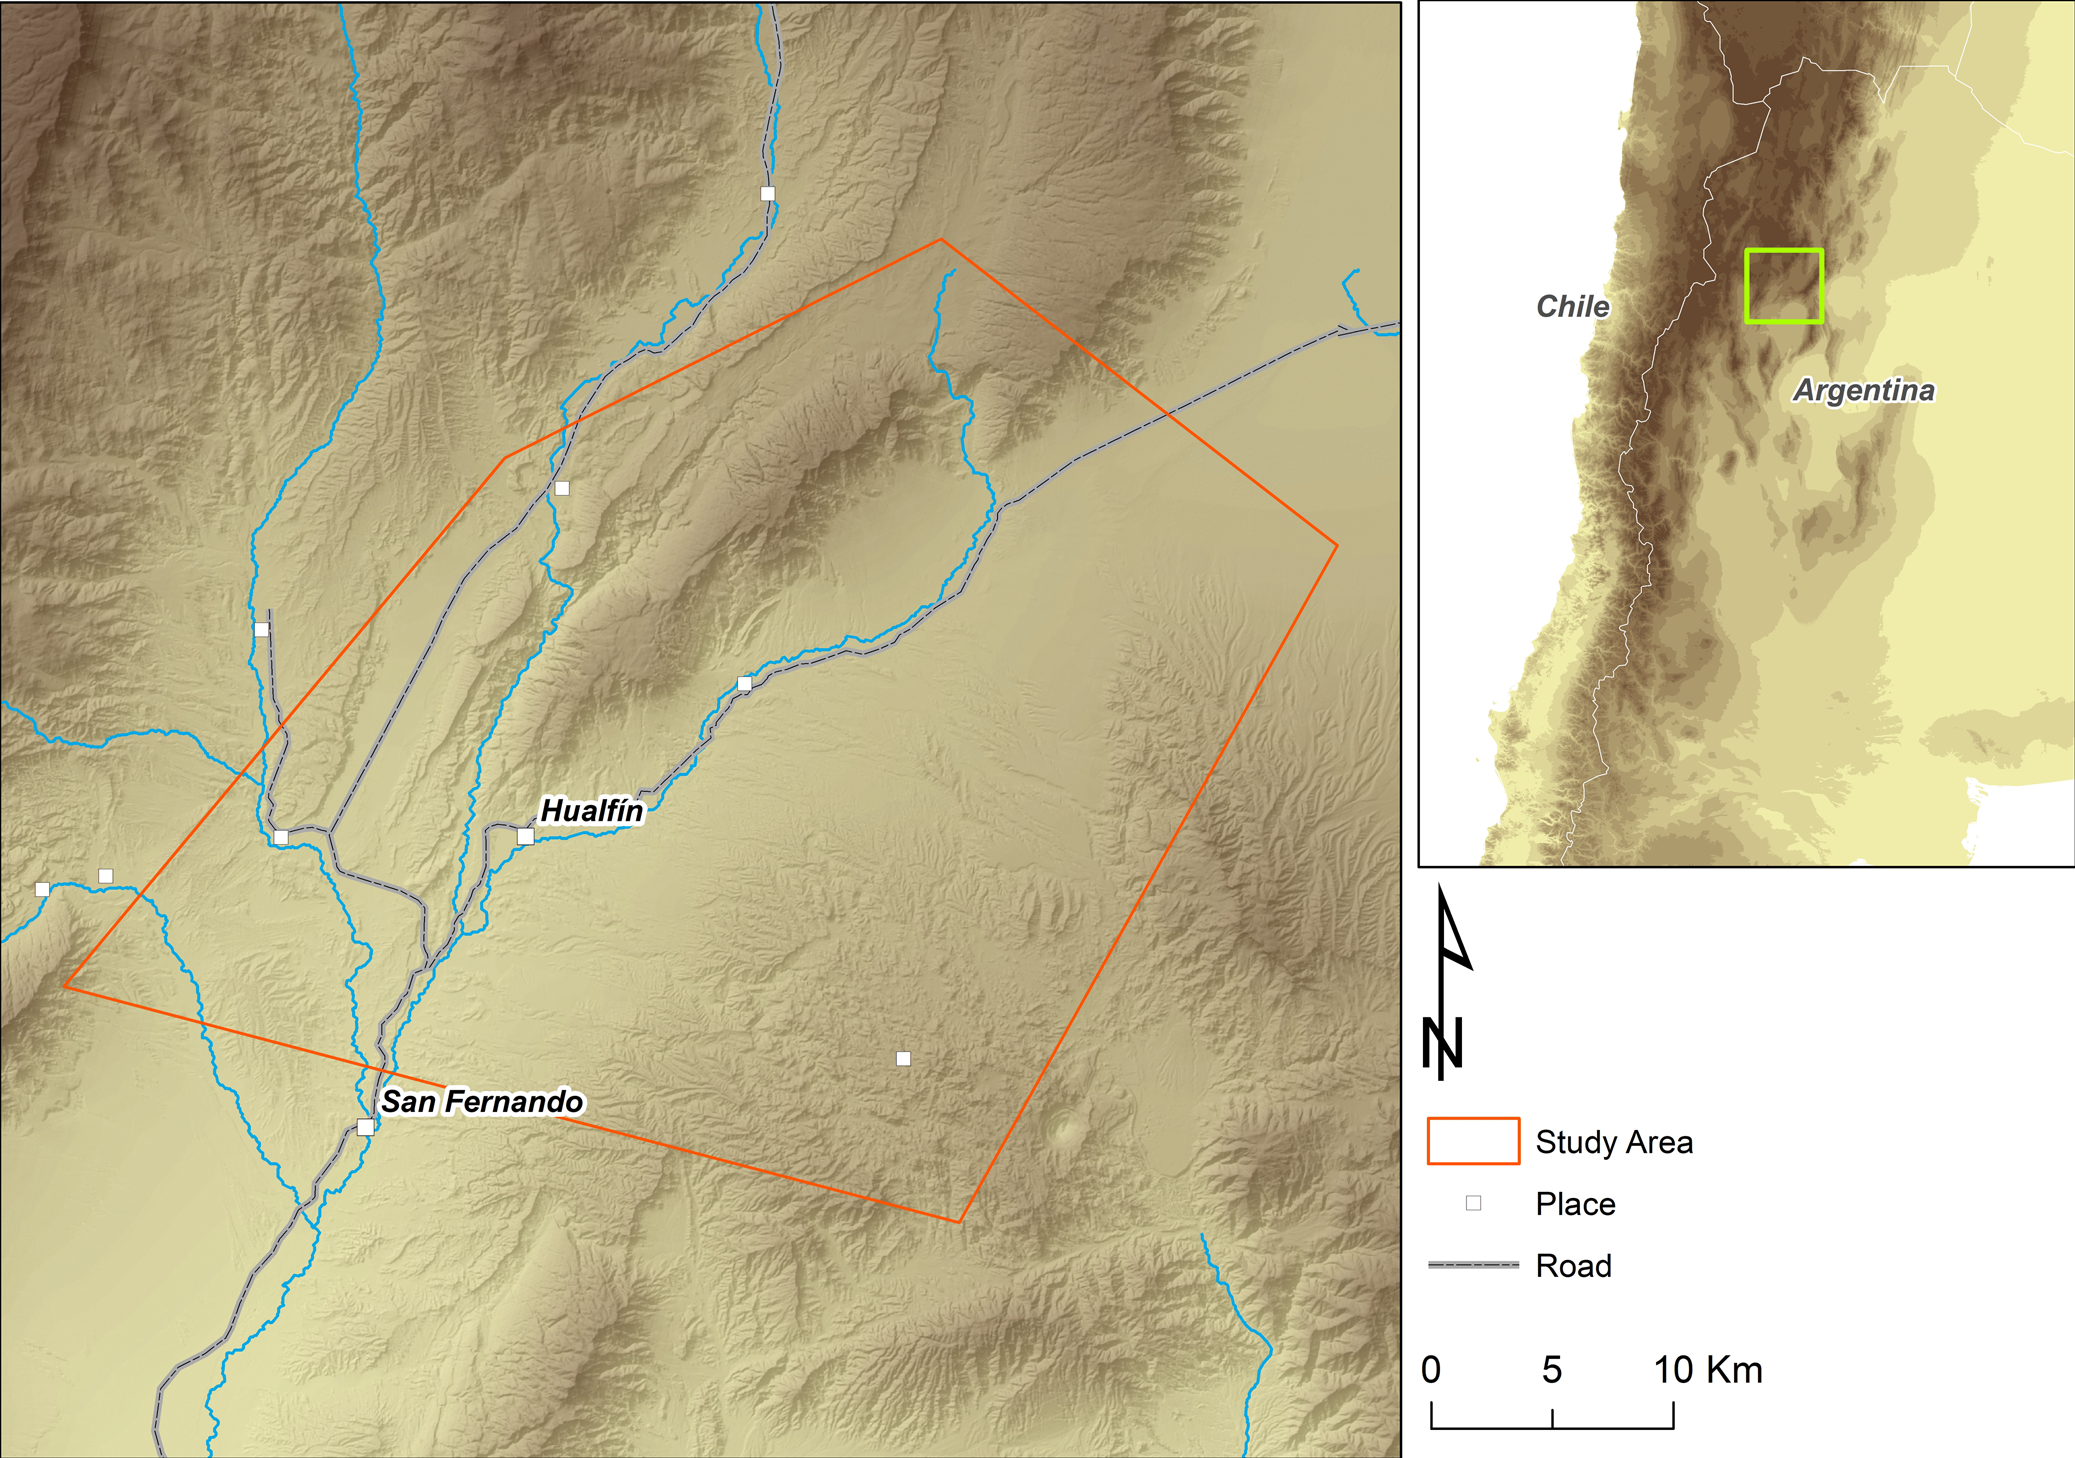
Within this context, in the last few years, we have begun to archaeologically characterize the valley of Hualfín, a sector of the province of Catamarca that, to a great extent, is a good example of the features and challenges of fieldwork and research in this area. Because the topography and geology of the area present a difficult terrain, easy access is impaired, and the perceptibility of the archaeological record in the field is also greatly reduced. On the one hand, the topography is very rugged, with steep slopes both on the edges of the numerous streams crossing the landscape and on the slopes of the highest mountains. The sediment is brittle in many of these areas. The combination of both of these factors makes any fieldwalking strategy based on systematic movements and regular long-distance displacements considerably difficult, given that accessibility is difficult. On the other hand, the appearance of archaeological structures, such as walls or constructions made of rock and sediment, is often confused with the geological materials that make up the surface of the land. These difficulties encountered during fieldwork in the area can be overcome through a strategy based on the selection of survey areas according to their archaeological potential (e.g., their location near rivers, geomorphology, and soils, among other characteristics), the location of possible structures from satellite images (no lidar data is available for the area), and access to each of the selected areas. All these tasks were carried out prior to the fieldwork, making the work more efficient.
MATERIALS AND METHODS
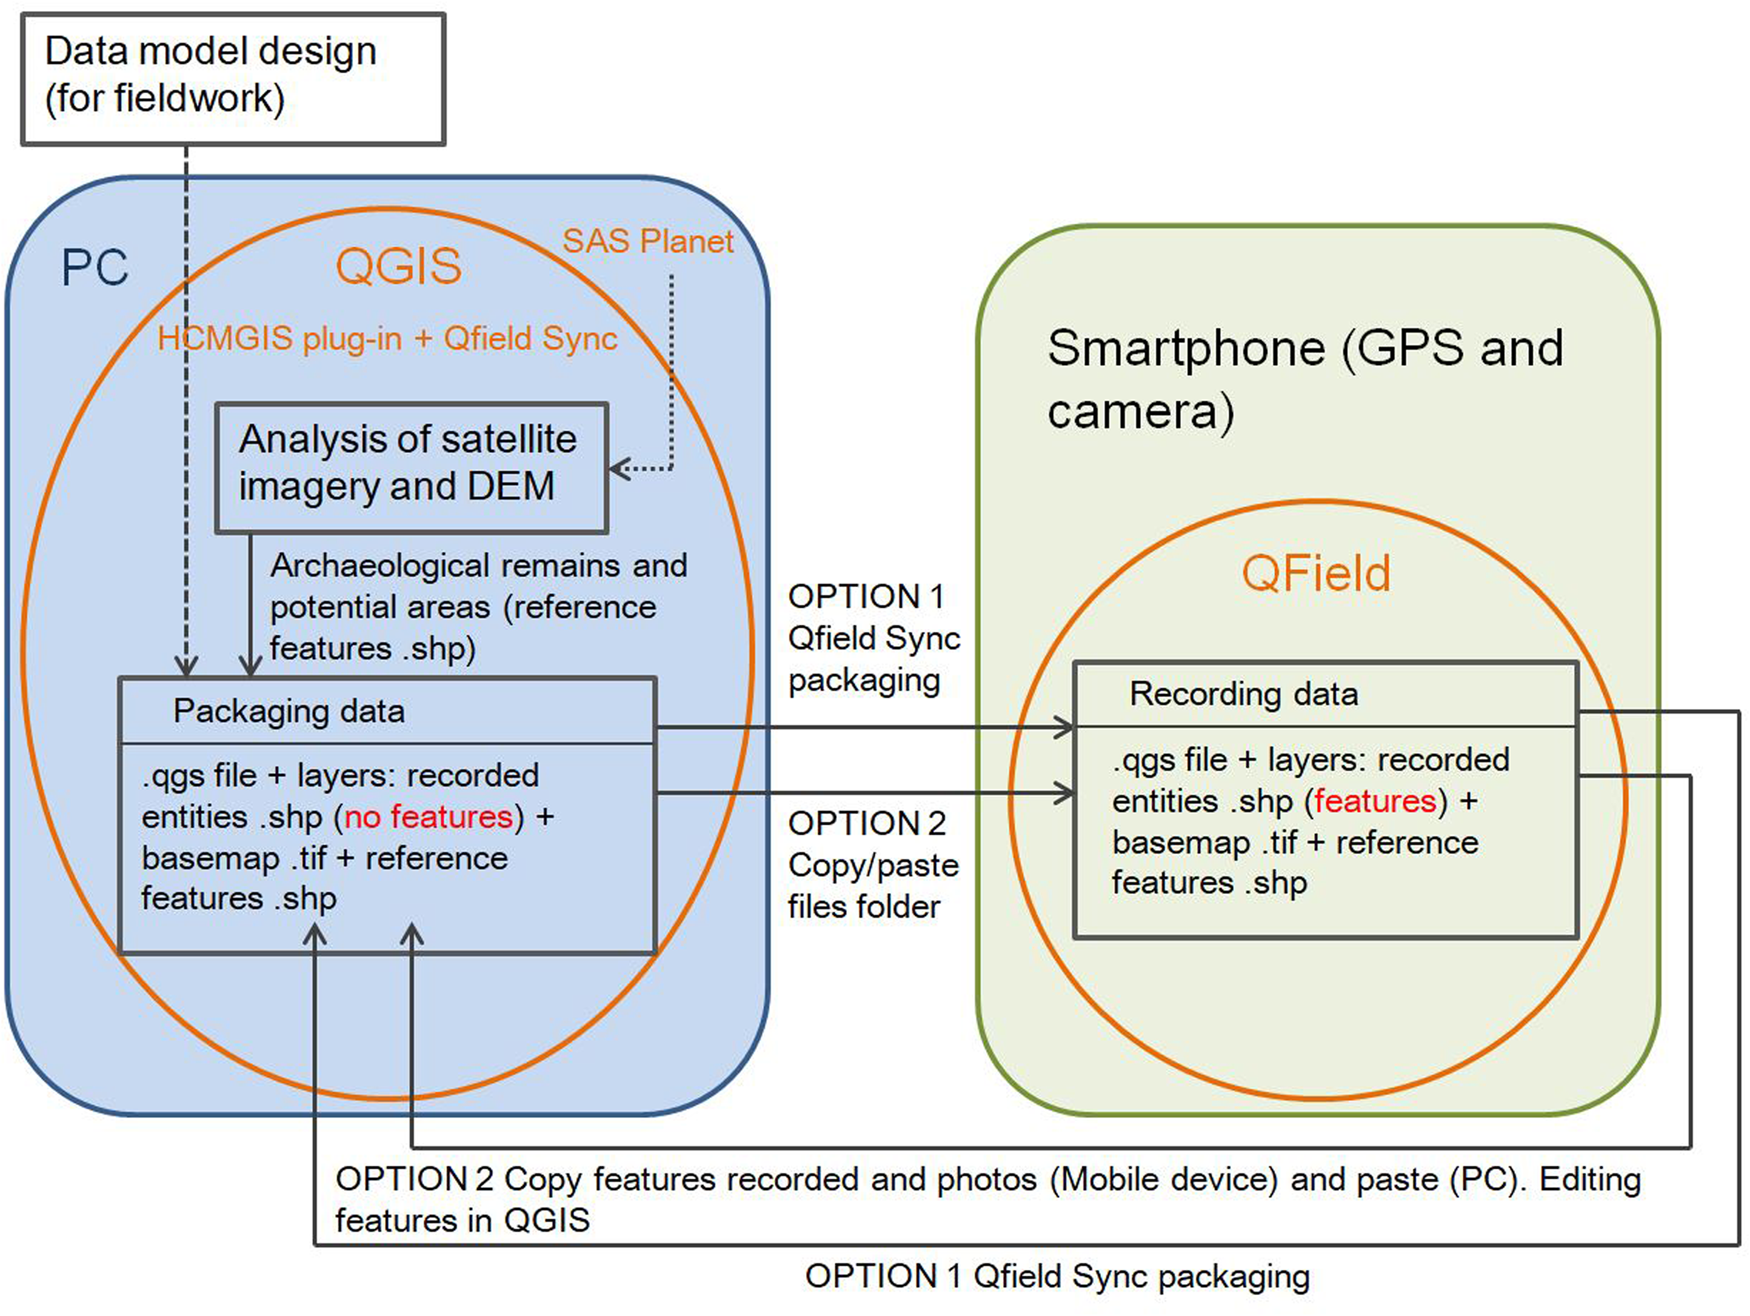
Below, the methodologies and tools used for the fieldwork are described (Figure 2): the design of the data model, how to make a GIS package for use in the QField application, and the recording of the fieldwork. Details are needed to discuss the implications of introducing mobile GIS into fieldwork.
Data flow diagram, software and hardware.
Data Model
Lindsay and Kong (Reference Lindsay and Kong2020) distinguish two types of data collection application according to their predominant conception: “map centric” (spatial) and “form centric” (database). Although mobile GIS is conceived from a “map centric” idea, it must not be forgotten that, in GIS software, each geometry is linked to the attributes that define it. For example, an archaeological site is defined by geometry (polygon) linked to a set of fields (code, description, typology, etc.), with each one being able to store different values. These alphanumeric values also allow the site to be linked to other geometries (e.g., artifacts) or files (e.g., photographs).
The data model designed for the field record must be explicit. In other words, it must integrate the classes of which it is composed and their relationships, attributes, and geometry. It was stated above that second-generation mobile GIS applications are designed for intuitive use. However, it must be stated here that fieldwork problems may be, precisely, due to an inappropriate or excessively complex data model for users who have not been trained in it. It is not easy to provide general recommendations to avoid errors in the definition of the data model, but it is appropriate to record some common errors:
(1) Conceptual vagueness of the classes (e.g., between a structure and an archaeological site if the difference is not clear).
(2) Use of domains (a closed list of values for a field). Domains are easier for fieldwork: they avoid typographical errors compared to free text fields. However, they must incorporate all possible values.
(3) Underrepresentation of information (oversimplification of classes and attributes.
(4) No way is included to record the confidence in the data (e.g., a field to record the probability of the existence of an archaeological site). Quality can be conceptual or spatial. Accuracy and precision are terms that help to record quality.
(5) Incorrect geometric definition of classes (e.g., the definition of a fence as a polygon instead of a closed polyline). When in doubt, the archaeologist can think if the values of the attributes can be applied to the whole space defined by the geometry.
(6) Ambiguity of the spatial reference scale that helps to define positional and geometric accuracy (e.g., coding of an archaeological site as a point when the reference scale is large enough).
Although we do not claim that this is a complete list, these errors are considered to be the most frequent ones from our wide experience (fieldwork, research projects, information systems development, courses, etc.) related to conceptual definition in archaeology.
We based the elaboration of the documentation structure in the field on the data model developed in the CHARM project (Parcero-Oubiña et al. Reference Parcero-Oubiña, González-Pérez, Fábrega-Álvarez, Martín-Rodilla, Dodero, Palomo-Duarte and Karampiperis2012).Footnote 3 This project provides a series of schemes regarding heritage and archaeological information through the definition and relation of classes that constitute the cultural-heritage conceptual universe within which a model for archaeology was developed. This model facilitated the development of the framework for the information that would later be recorded in the field from de facto standard format files (shapefiles) that encode georeferenced information (points, lines, and polygons) linked to a relational database. On the basis of the above, each geometric entity can be characterized from a series of attributes (Table 1).
Feature Classes, Fields, and Attributes Used in the Data Model.
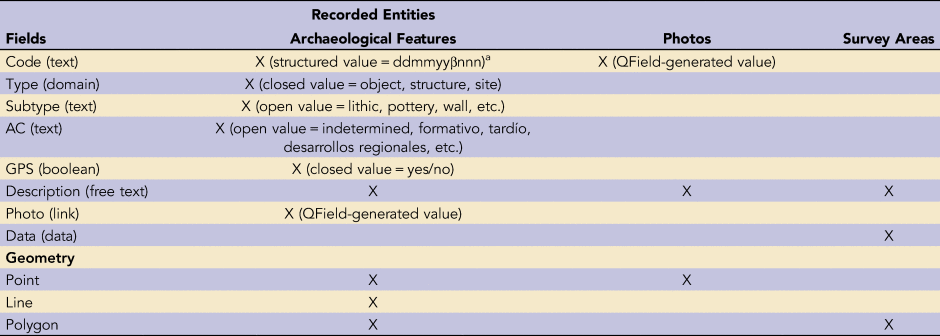
a dd (day) mm (month) yy (year) β (id surveyor) nnn (correlative number).
The archaeological classes registered can be divided into methodological (survey areas) and material (objects, structures, and archaeological sites) classes. This process was developed entirely in QGIS software. QGIS files (.qgs) save a visualization interface established with record layers and geographic information of reference: satellite images, Digital Terrain Models (DTM), hydrography and communication routes, etc.
How to Make a GIS Package in QGIS (PC) for Use in the QField Application
This section describes the steps required to create a field registration system that can be managed from a mobile device—in this case, smartphones. The necessary tools are a PC with QGIS software and a mobile device with the QField application for Android.Footnote 4 Mobile devices must have a GPS and camera. QGIS and QField are free software.
Project Design in QGIS
A project (.qgs) is created in QGIS Desktop with information layers. Style (symbols, labels, etc.) is given to the layers in the project (.qgs). When importing the project (.qgs) into the application, all these settings will be preserved. For specific questions concerning the use of QGIS, see the website (https://docs.qgis.org). Layers are used with information of three types: (1) reference layers such as base maps (.tif; satellite images and cartographic information), possible archaeological sites, and areas of high archaeological potential (shapefile) previously selected from the remote sensing analysis; (2) archaeological record layers, such as objects (shapefile point), structures (shapefile point or polyline), and archaeological sites (shapefile polygon); and (3) methodological record layers, such as delimitation survey areas (shapefile polygon). In addition, a layer was also used to record the locations of general landscape photographs (shapefile point). All these information layers make up the QGIS project (.qgs). The attributes of each layer are unique, although all include a code that identifies the surveyor and the record date, a brief description, and the georeferencing method via which the graphic location was recorded (GPS or reference layer). The archaeological information fields also include type and cultural affiliation. In addition, a field has been included in the table called “photo,” which QField identifies automatically by taking a photograph with a unique code that associates the object that is being recorded. The photograph is automatically georeferenced and stored. It is extremely important that both the project (.qgs) and the layers be stored in the same folder on the PC. Therefore, creating a folder on the hard drive and including this information in it is recommended. Finally, click on the Project/Properties menu and select “General.” Select “save paths/relative path” in the General Settings section. Apply and save the changes in the window. Click on “project/save as” in the main menu. Use of the QField Sync (https:/qfield.org/docs/synchronise/qfieldsync.html) is recommended for advanced packaging and synchronization options.
Store the QGIS Project on the Mobile Device
(1) Install the QField app on the mobile device.
(2) Connect the mobile device to the PC, copy the contents of the folder in which the project and the data (layers) have been saved, create a folder in the internal storage of the device, and paste this content in it. The project (.qgs) must be saved, along with its layers, on the mobile device without changing the names and structure of folders and files coming from QGIS. If all of this information is saved on the internal storage, no problems should be experienced. If saving on an external card (micro-SD) is needed, the data should be saved in the folder with editing permissions. For this purpose, it will be necessary to install the QField application with the card inside the device (QField will automatically create a folder with editing permissions on the card where the project, .qgs, and layers must be saved). Once the file copying has finished, the mobile device can be disconnected from the PC.
(3) Open the QField application on the mobile device. It is possible that, through a guided process, the application must be given permission to access its internal storage. A new screen will appear in which the folder can be selected to load the project (.qgs). Navigate to the folder where the data has been stored, and select the .qgs project. The documentation on the official website can be referred to as necessary (https://qfield.org/).
Update the QGIS Project
Updating collected data (fieldwork data) can be carried out from the QGIS edit toolbar (copy and paste the new features stored in the shapefiles of the field devices). The already updated shapefiles can be replaced on the field devices. If QField Sync has previously been used for packaging, it should also be used for updating and sharing data (https://qfield.org/docs/synchronise/qfieldsync.html).
Fieldwork Assisted by Mobile GIS
As has already been pointed out, the characteristics of our fieldwork (surface, accessibility, perceptibility of archaeological material, etc.) present difficulties and slow down the fieldwork considerably. For this reason, an analysis of the high-resolution satellite imageryFootnote 5 and digital elevation models (DEM ALOSFootnote 6) was previously conducted to make it possible to locate possible archaeological remains (mostly structures) from linear features observed on the image. Different areas were also delimited according to their potential to present archaeological remains located on elevated plains (alluvial plateaus). From this previous mapping, a field strategy was elaborated prioritizing some areas over others in relation to time and available equipment. All of this information was integrated into field data to be reviewed and completed based on the reality observed in the field.
A total of 53 km2 throughout the Hualfín Valley were evaluated during the fieldwork. The areas were previously selected for their high archaeological potential on primary position (Figure 3). Most of them were alluvial plateaus and other areas of the hills that make up the Hualfín Sierras with a maximum altitude of 3,500 m asl. The team was composed of five people, each equipped with a smartphone with a data visualization interface created by the QField application. This application, using the GPS of the smartphone, was employed for three fundamental tasks: (1) to navigate the entire area of the previously selected fieldwork zones; (2) to create, localize, and delimit any archaeological entity in a coordinated space; and (3) to photograph the entities so that the application itself automatically links the location and attributes of the entity with the photograph itself (Figures 4, 5, and 6). The accuracy of a smartphone's GPS varies between approximately 2 and 12 m, depending on the conditions of use (Tomastik et al. Reference Tomastik, Tomastik, Salon and Piroh2016). The above depends on factors such as the connection to a data network (A-GPS) and the number and geometry of the satellites in the visible sky (PDOP). In the context of the project, the accuracy obtained was high because the skies were clear. Therefore, the accuracy is similar to that of the satellite image used as a base (<5 m). A similar level of accuracy was obtained for other unforested spaces (Tomastik et al. Reference Tomastik, Tomastik, Salon and Piroh2016). In addition, the use of the image in the application allows the accuracy to be controlled and even makes it possible to delimit archaeological entities using satellite images.
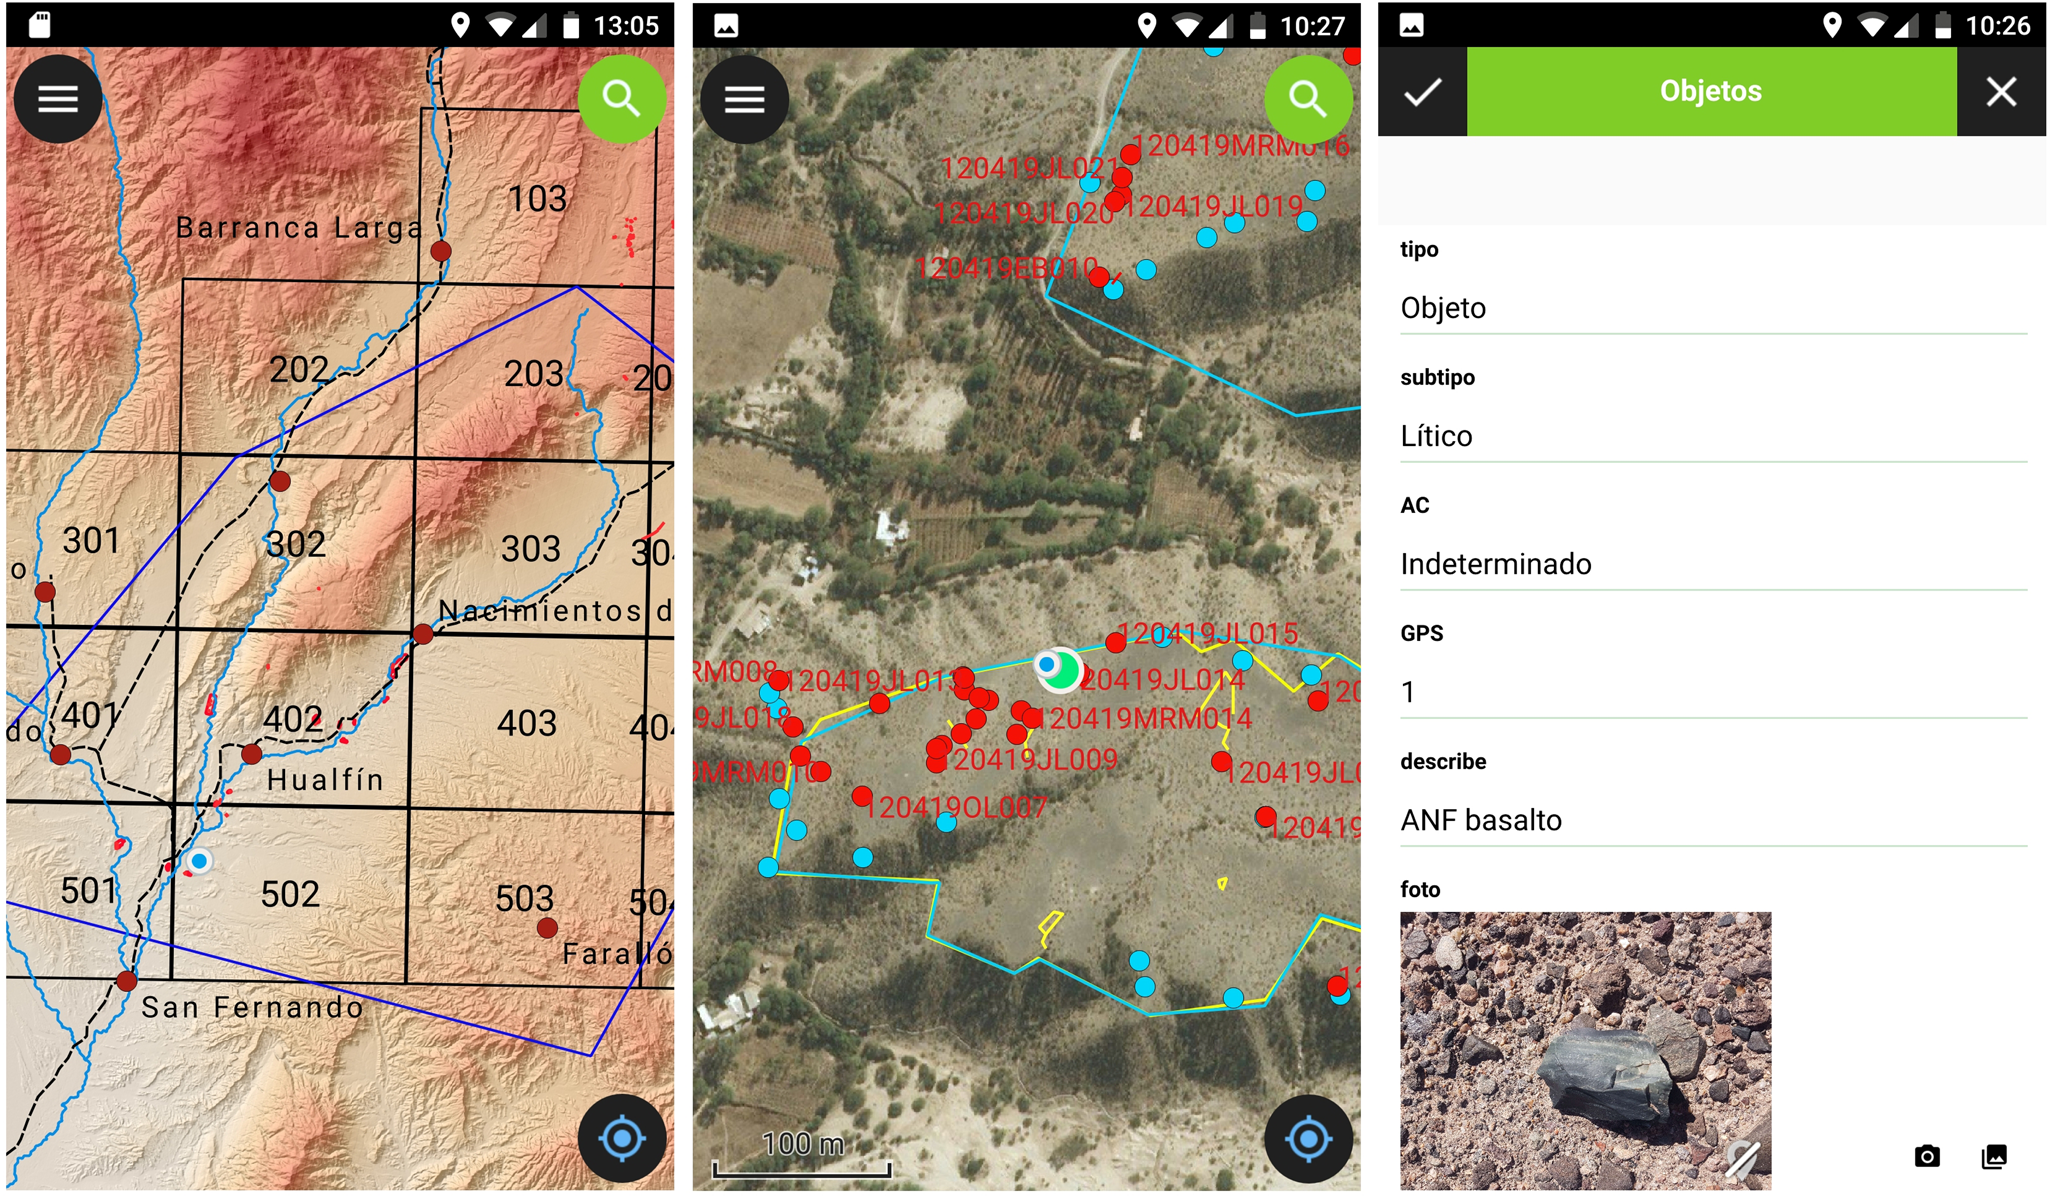
Survey areas selected in the fieldwork and areas of high potential archaeological remains on primary position (HAPA) selected in the remote-sensing work do not match. The highest densities of archaeological features recorded in the field are within the HAPAs. Some potential archaeological structures (PAS) were detected in the satellite image and recorded in the fieldwork later: (a) fieldwork and remote-sensing zoom marked in (b) the total area.

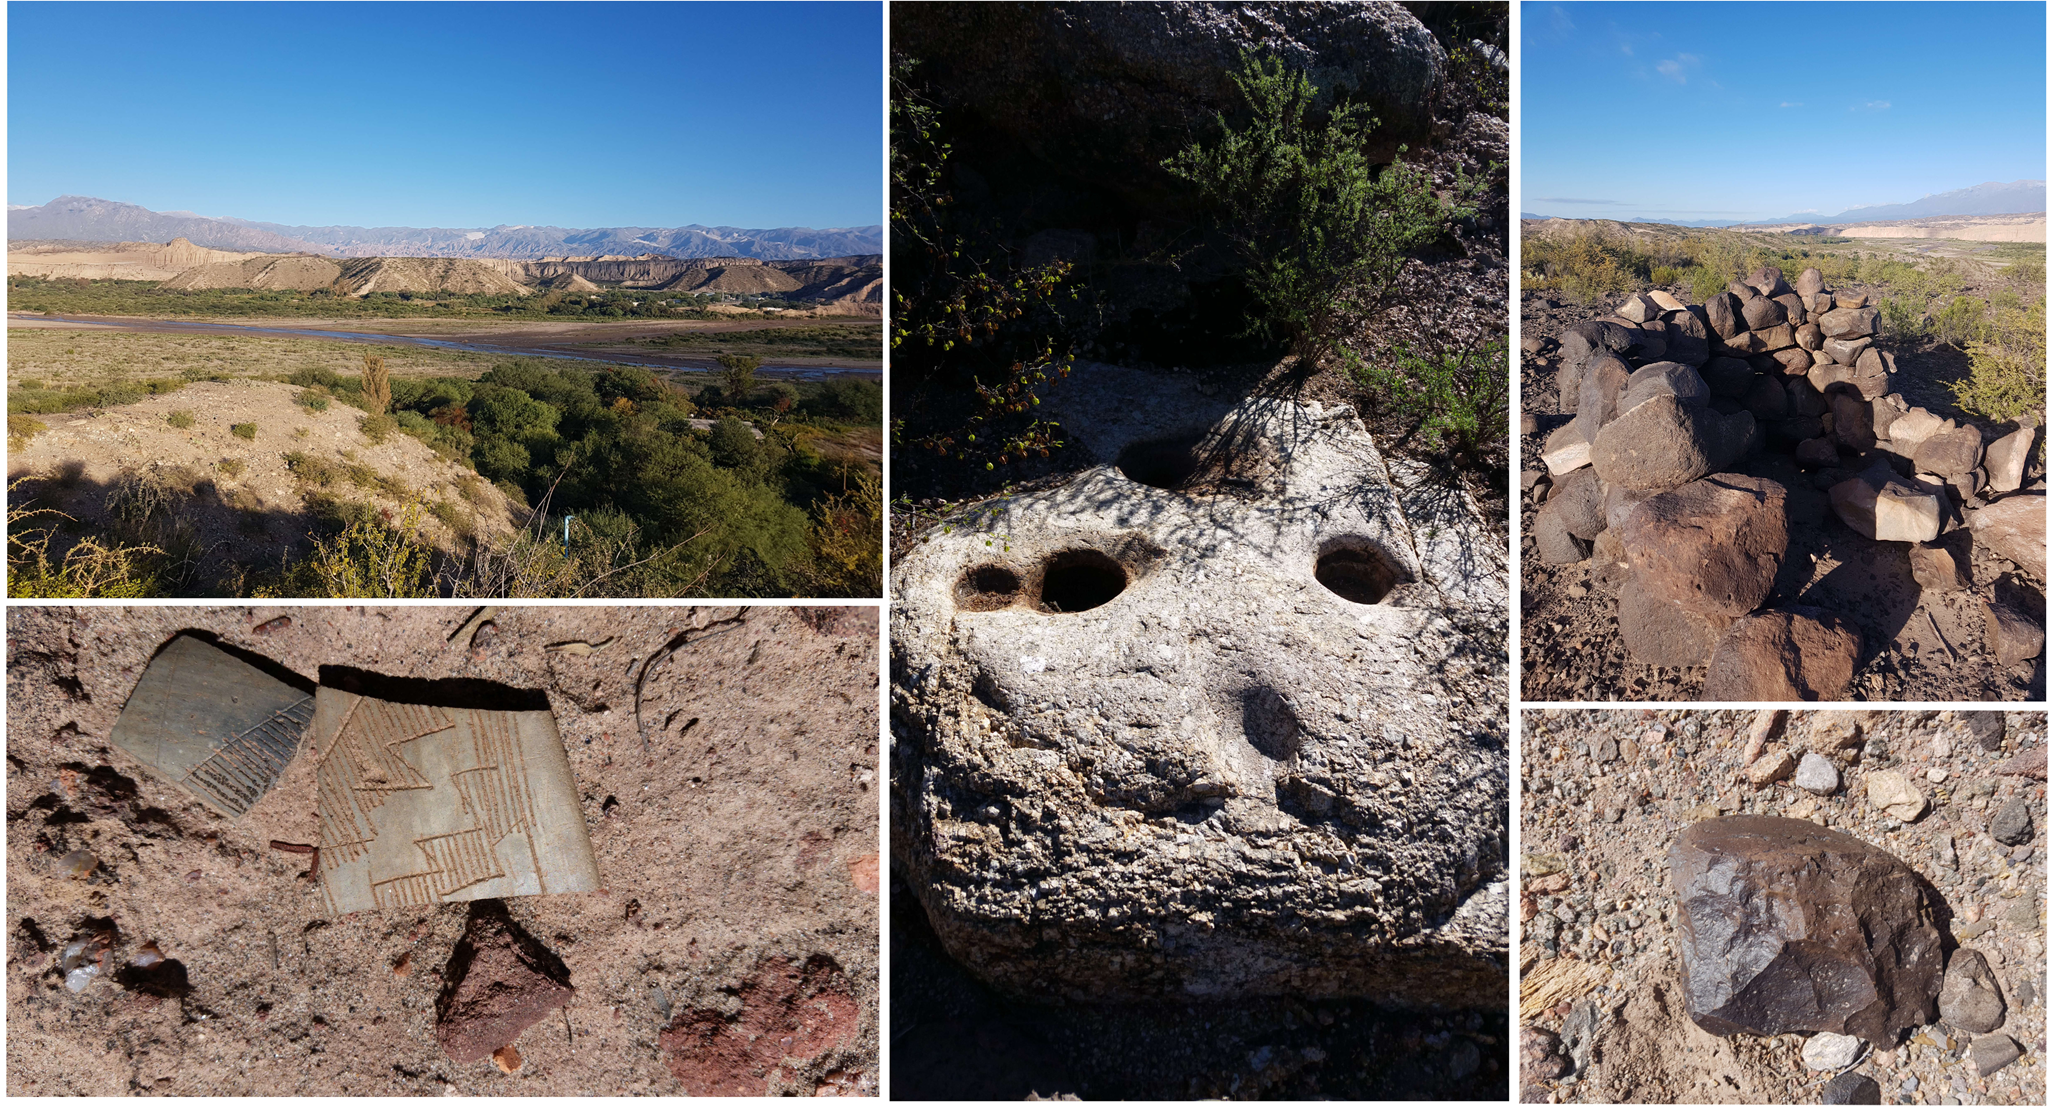
Landscape, archaeological features, and fieldwork. Examples of recorded archaeological entities: rock-mortar, stone structure, ceramic sherds, and lithic tool.
Editing an archaeological feature in the QField app: (a) editing geometry, (b) editing attributes, and (c) taking the photography.
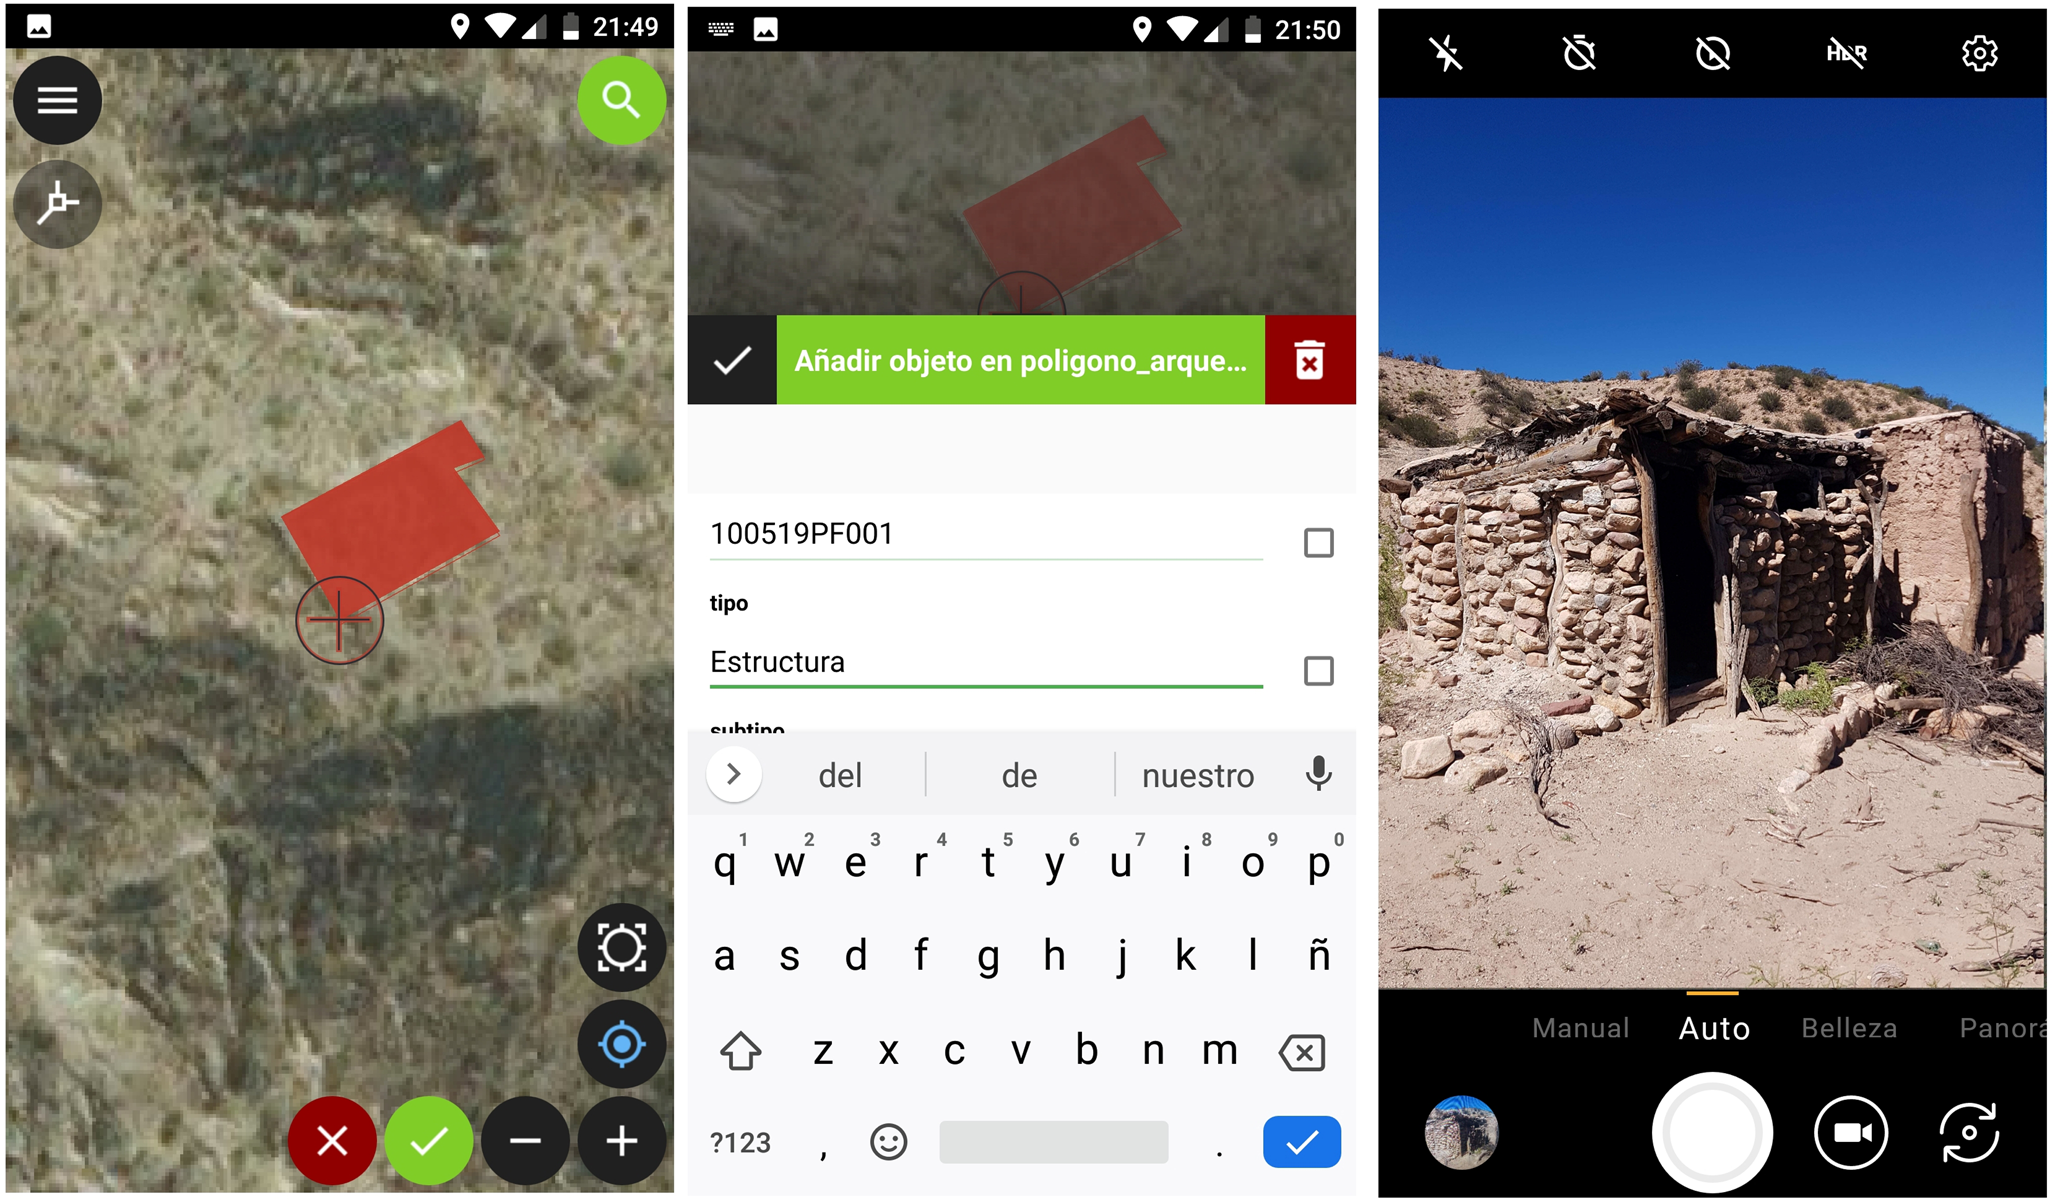
Reviewing information in the QField app: navigation and editing tasks.
All tasks were carried out without a phone signal, given that—much like other remote areas—no data coverage was available in the study area. In addition, this data collection process is assisted; the user creates a new record for each entity and launches a guided and successive process of location, attributes. and photography. The process is not only fast but also avoids creating incomplete information because it allows the mandatory nature of each attribute or photograph to be set, without which the creation of the entity is not possible. It should be remembered that the entire configuration should previously be carried out in QGIS and that the field crew do not have the ability to modify these settings. Updating and integrating information on a day-to-day basis is a simple process that consists of integrating all the information registered on all devices in an editing session using the QGIS software. This enables the immediate updating of the information on all the devices, thereby avoiding repetitions or omissions in the zones or entities that have already been reviewed.
DISCUSSION AND CONCLUSION
The main aim of this article is to produce clear, simple, and virtually costless guidelines for implementing mobile GIS. As has been explained, it is possible to implement a registration system of this type with free software resources that can be used by archaeologists with no prior experience in GIS technologies. However, it is still recommended that there be at least one GIS user to perform the information management tasks. Many of the problems of the archaeological record, whether digital or not, are provided by the data model. The focus is often only on software training and not on understanding the structure and nature of the conceptualization of the information. Other aspects that have previously been assessed must be taken into account: mobile devices (smartphone), steps and workflow for QGIS-QField, GPS accuracy related to the scale, the use of free available basemaps (DTM, satellite image, maps), etc.
The general terms and workflow described in this article for QField are also available for Esri software. As can be seen in Lindsay and Kong (Reference Lindsay and Kong2020) for the use of mobile GIS with ArcGIS Collector (both are second-generation mobile GIS applications), the main difference is that Esri provides a cloud service (ArcGIS Online). Whereas in the Esri environment it is possible to synchronize the data online, in QField only cable sync (desktop) is possible. However, cloud service (beta version) for QField has recently been announced (https://qfield.cloud/). In our case, no mobile signal was available in the study area, so the online data sync would not have been an advantage. The unavailability of a mobile signal is common in many other rural areas of Latin America where archaeological fieldwork is carried out. We consider that the robustness of digital technologies (no unexpected errors caused) is of particular value in these areas. In this sense, our experience with QField has been positive. During the weeks dedicated to fieldwork, no errors occurred. The reliability of QField will reach the proposed objectives within the fieldwork times. It should be noted that stability may be due to a combination of factors that extend beyond the QField application (OS, data files, smartphone hardware, etc.).
It was stated at the beginning of this article that free software was a requirement in our project. In addition to QField, there are other free applications for mobile devices aimed at GPS navigation and data recording. Some of these applications can be considered to be mobile GIS technology: for example, Input (for Android/iOS) allows the customization of forms in QGIS, capturing geometries and linked files (photographs, audio/video), and synchronization. However, it is not possible to enter one's own basemaps. There are other applications that operate outside GIS desktop software, some of which have form customization capabilities, such as SuperSurv, CartoDruid, and Mappt (all for Android), whereas others are designed more for navigation and capturing waypoints, such as OruxMaps (for Android). All of them offer GPS navigation in a map interface (with different possibilities for using basemaps) and the possibility of GPS recording (with or without field-associated and more or less interoperable and normalized files for use in GIS desktop). All of these free applications democratize access to field mapping because they are easy to use, even for non-GIS users. However, we discarded them due to the fact that QField offered more advantages than any other application, especially due to its power to integrate file formats, project customization (layers, symbology, etc.), and integration with desktop software (QGIS) for visualization and analysis.
It should be stressed that the use of mobile GIS allows for the production of digital, geocoded, and standardized information, according to the criteria of international organizations such as the Open Geospatial Consortium (OGC). As territorial and environmental planning policies in Latin America improve, interoperable spatial data infrastructure (SDI) will provide fundamental tools for integrating all spatial data, including archaeological information and relevant heritage information for its protection and conservation. Therefore, the use of a registration method such as ours provides basic tools for the production of compatible, integral, and understandable information to be incorporated into SDI. Our training with smartphones enables these devices to become everyday tools for archaeological fieldwork. For example, the everyday use of smartphone keyboards (e.g., SwiftKey or Gboard) has greatly accelerated the ability to type text beyond what might initially be expected due to their small size. Years ago, the use of the QWERTY keyboard in electronic field devices—in some cases, via the use of pointers—seemed to be the only real possibility to type free text fields. The intensity of backlighting of today's smartphone screens is good enough to work in any context, even in an environment such as Northern Argentina, with high refraction of the ground, clear skies with intense solar radiation, and few shaded areas. The accuracy of the smartphone's GPS is compatible in many cases with the quality of the reference information of archaeological surveys. In our case, the reference basemap is the Worldview satellite image, the absolute accuracy of which is 3.5 m. In any case, to obtain greater accuracy with a registration system identical to ours, it is possible to use an external portable GPS with an RTK system. It is also possible to use tablets or devices with larger screens connected to an external GPS. Portable GPS devices connect via Bluetooth to smartphones and incorporate systems such as real-time kinematic positioning (RTK) to active bases or the possibility of corrections through systems such as the European Geostationary Navigation Overlay Service (EGNOS) or the Wide Area Augmentation System (WAAS). Accuracy can be less than 0.5 m (RTK) or 2 m (EGNOS/WASS). It should be noted that EGNOS/WAAS systems do not have coverage in Latin America. Likewise, there are no open networks of active GPS bases in Latin America, nor is there continuous coverage of these bases throughout the territory. Therefore, the possibilities of high precision, in general, in the Andean territory usually require the use of more complex and expensive positioning systems.
It is important to highlight the efficiency of the method presented in this article in obtaining archaeological information in such a wide and difficult-to-assess area with a small team in a short period of time. In this way, time was dedicated to the recording of archaeological entities in the field and not to the postprocessing of the data. These digital tools allowed us to understand our geographic, archaeological, and landscape environment during fieldwork. In frameworks such as landscape archaeology, this strategy increases the archaeologist's abilities to understand the archaeological landscape. The digital information system, which integrates archaeological and geographic information, can be used to create new information from the GIS spatial analysis. Based on the strategy presented here, new archaeological remains were recorded that had not previously been identified. Our finds (Figure 7) mostly included ceramic sherds (138), lithics (193), and architectural stone features (92). A direct result is an archaeological information system that collects the location, attributes, and photographs of the archaeological entities registered in the field (Figure 8). This information can be managed with any GIS software, although, as previously mentioned, free software (QGIS) has been used in this study. One of the great advantages is that the information system is ready without any data processing. Therefore, there are no digitization processes typical of paper records, nor is there a need to manually link all the information—as is the case with the use of GPS operationally disintegrated from databases and photographic equipment. The potential of GIS to make combined alphanumeric and spatial queries, together with its ability to integrate geographic information, enables an enriched reading of the archaeological record, which is essential in a framework such as landscape archaeology (Figure 9).
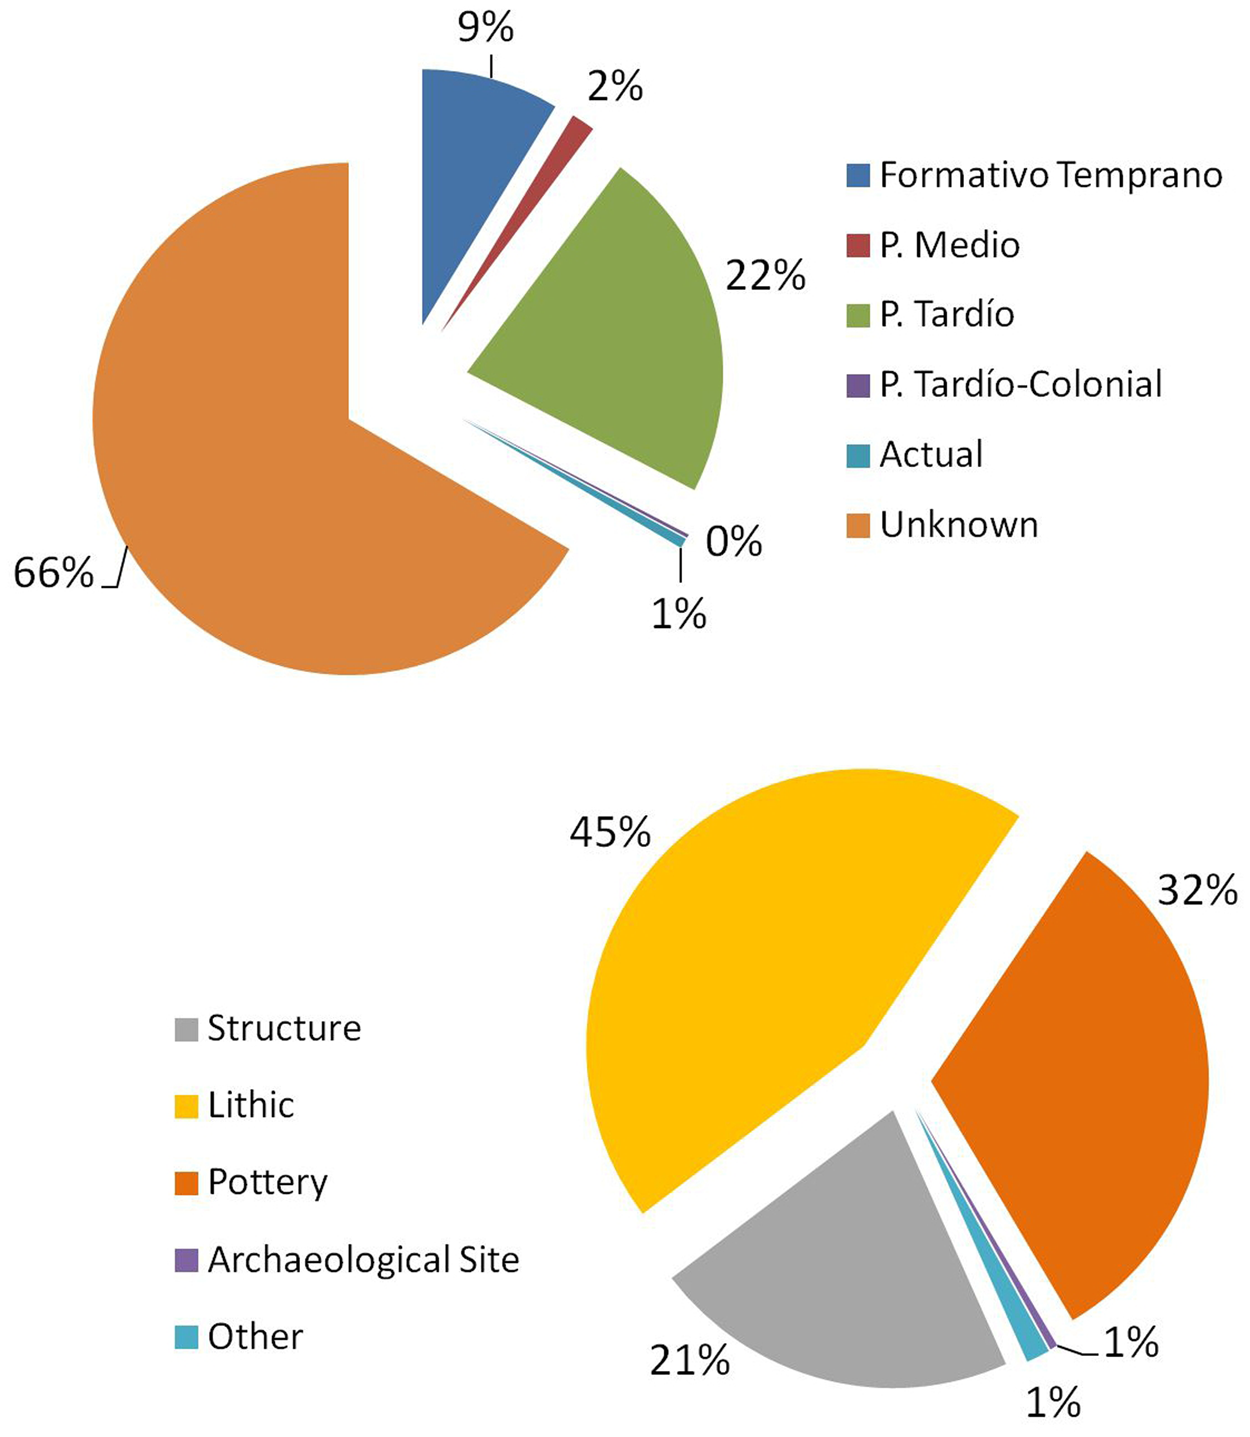
Recorded archaeological features classified by period (above) and type (below).
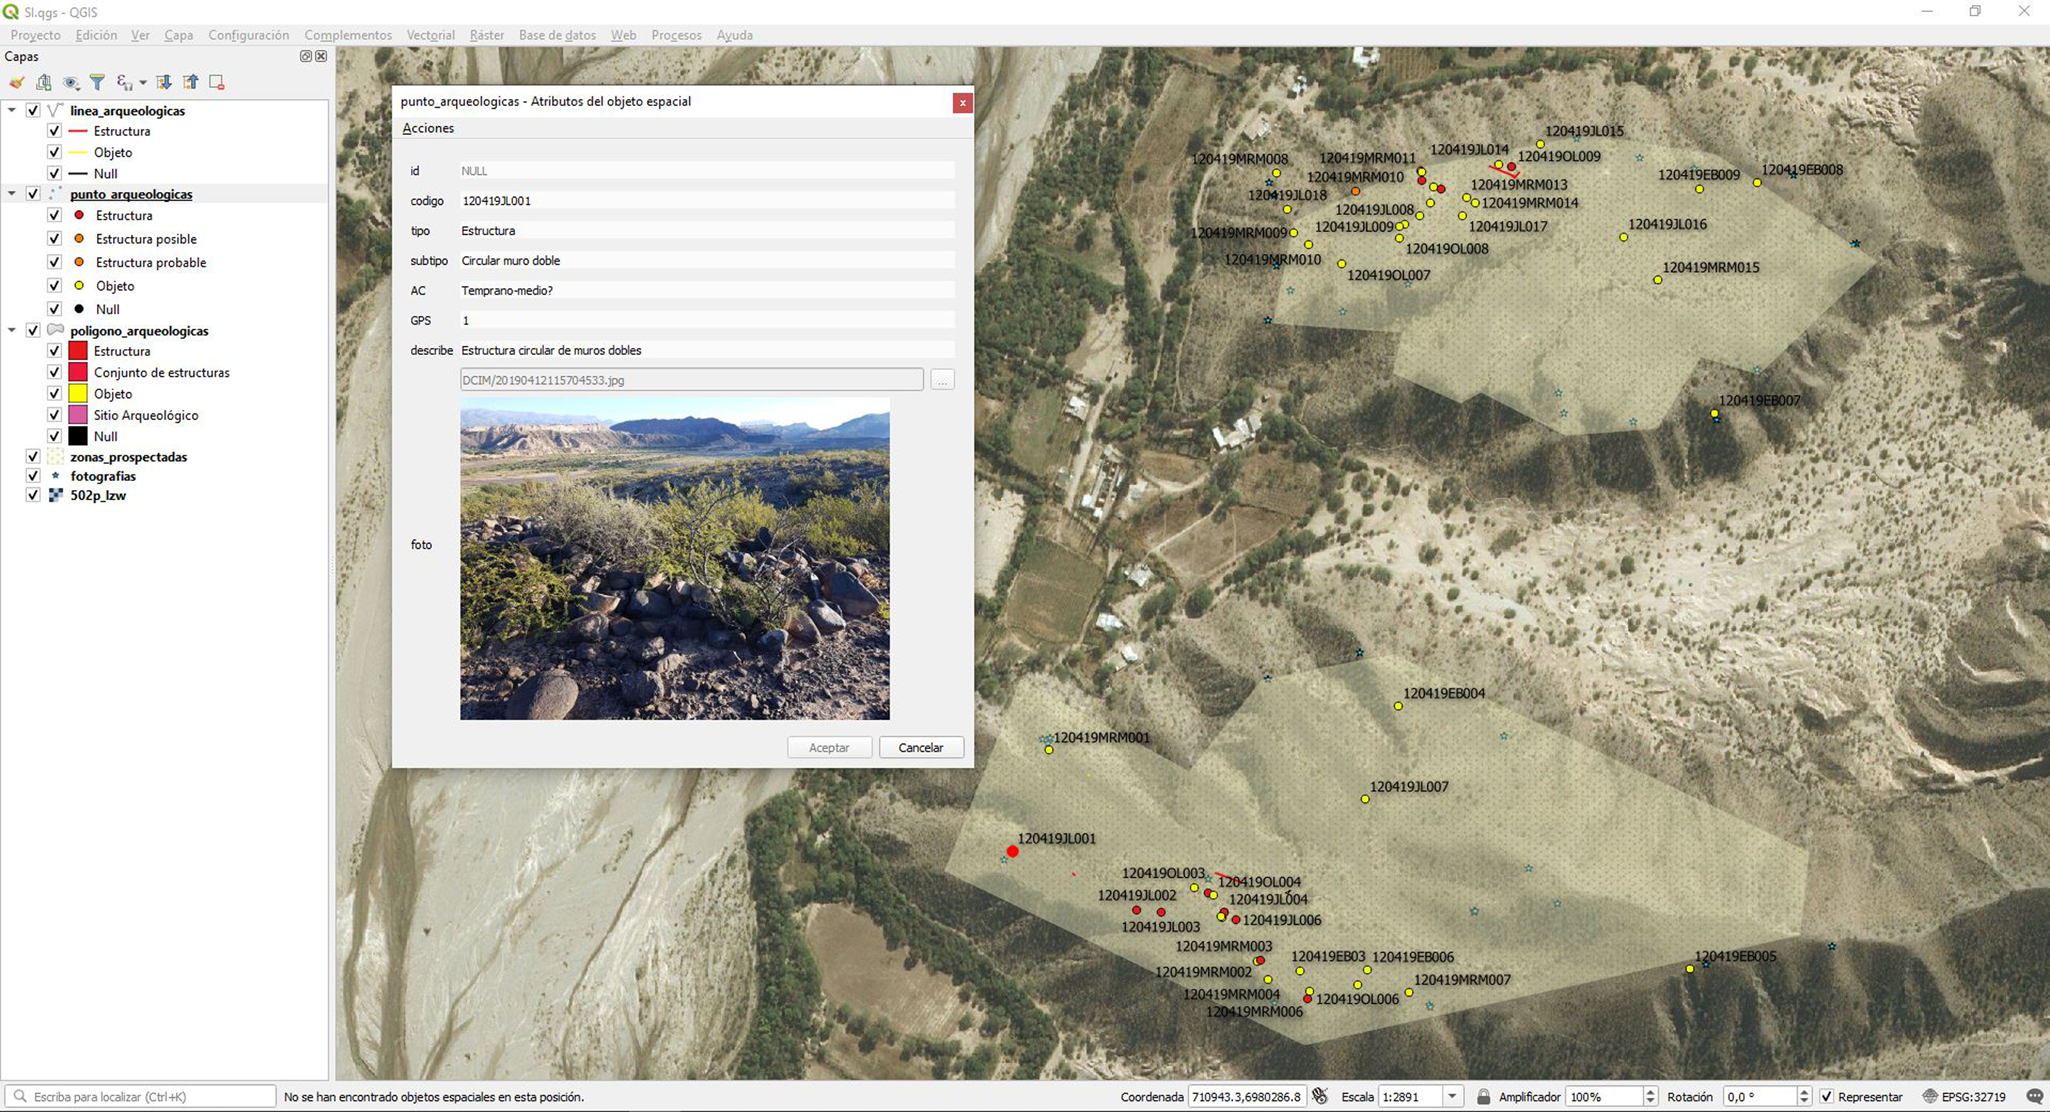
Recorded information displayed in QGIS software. Reviewing an archaeological feature located in the Hualfín Valley.
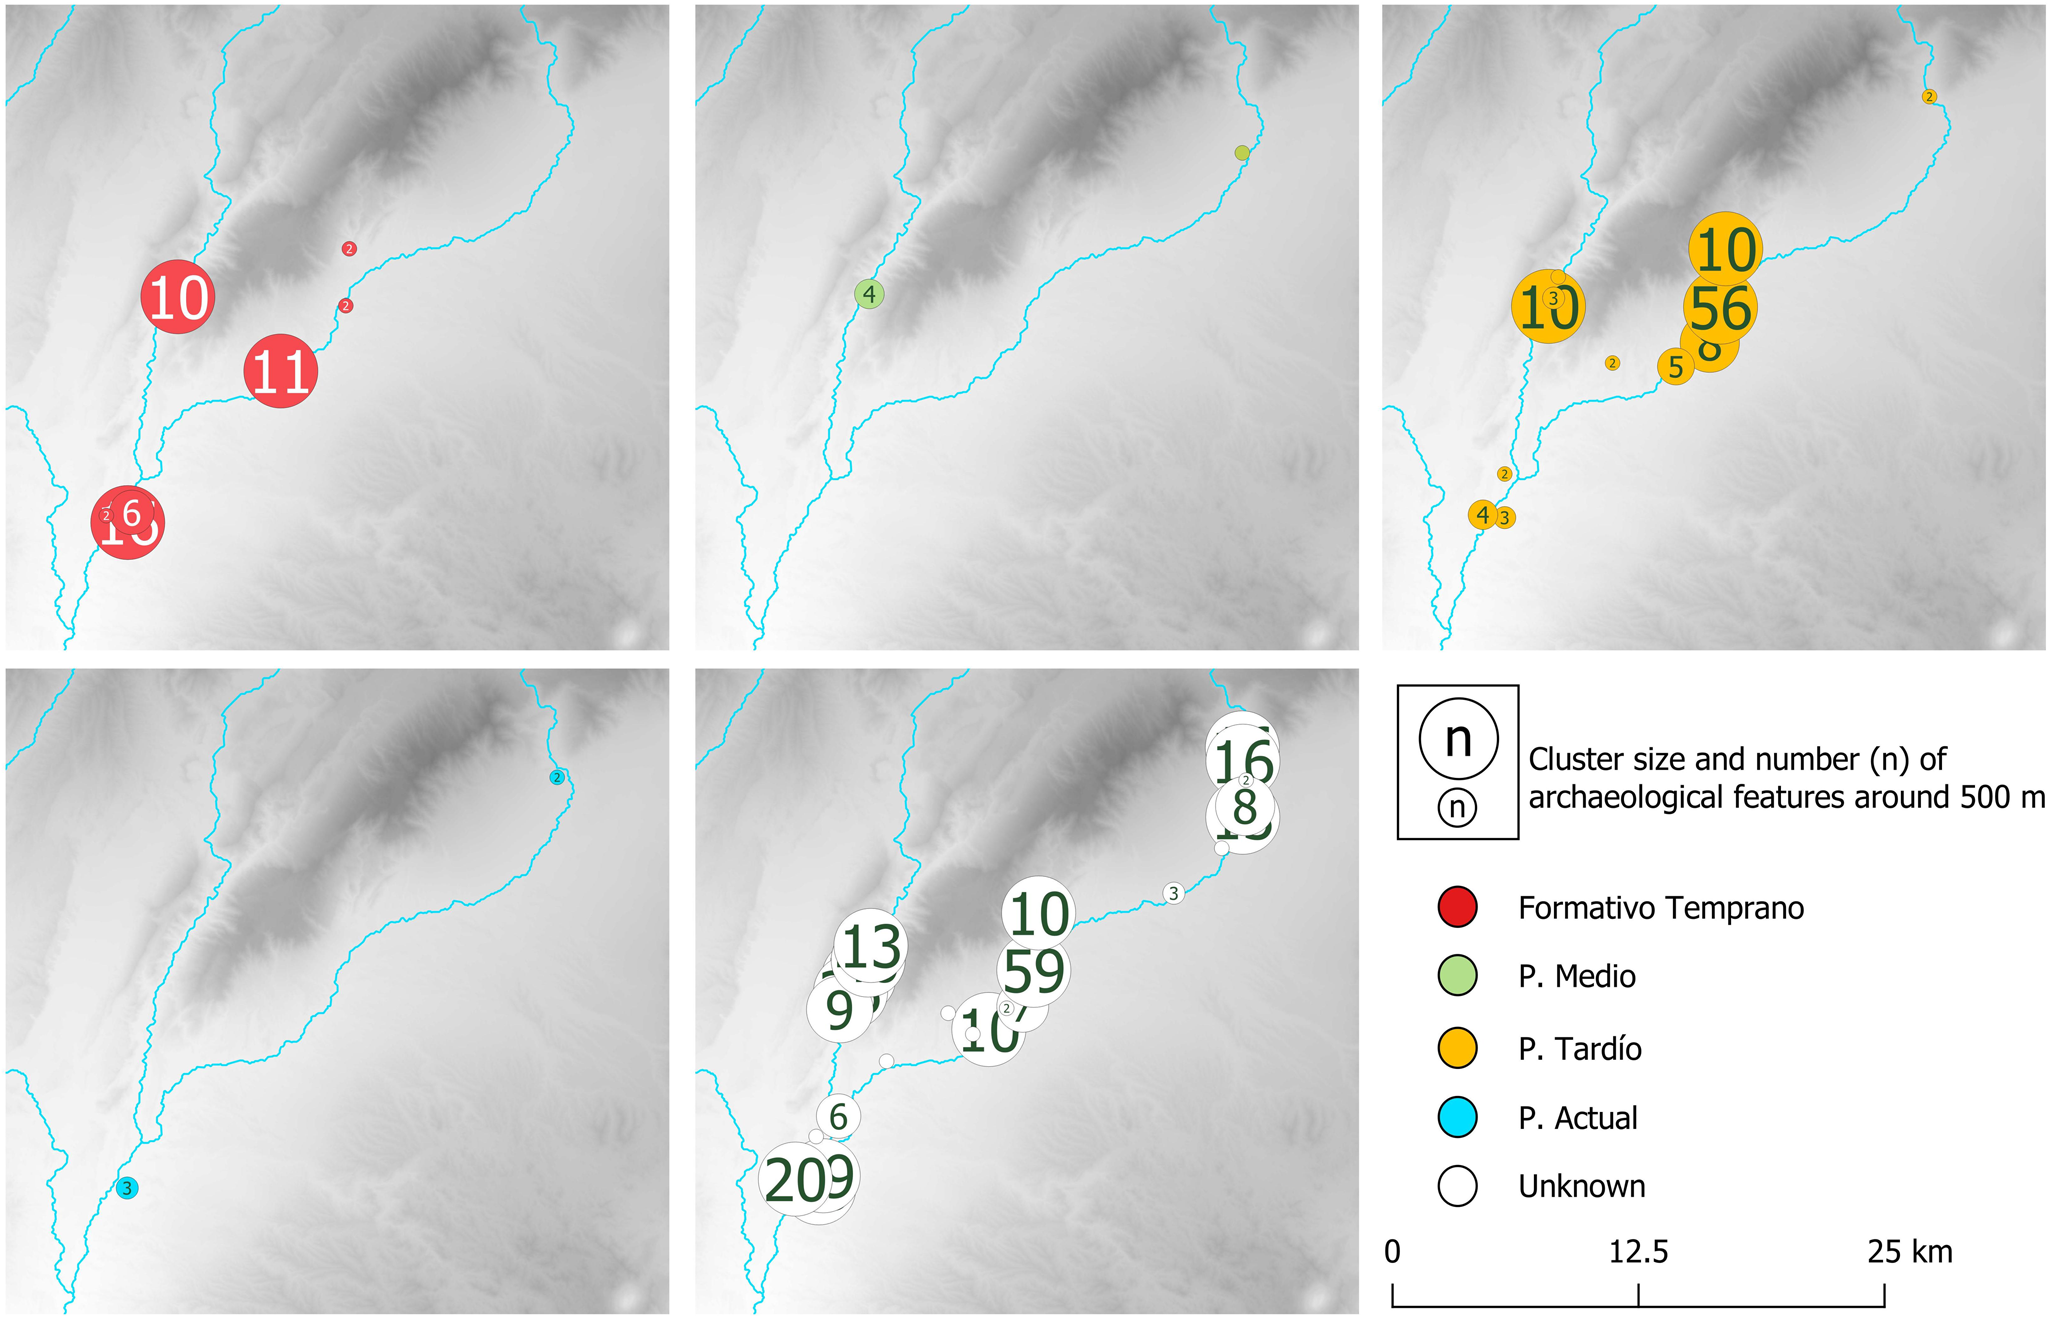
Clusters size of archaeological features recorded by period. The different concentrations can be observed in certain periods located in different areas. These concentrations can be studied to determine activity areas.
Beyond the goal of this article, the work of certain authors regarding the importance of the paperless record and the double cultural perspective (combining emic and etic approaches) beyond GIS technology should be highlighted (e.g., for Mayan archaeology, Jackson et al. Reference Jackson, Motz and Brown2016). This perspective is especially interesting in many Latin American areas in which local societies maintain a special bond of identity with archaeological remains and their interpretation. This not only allows scientists to gain a better understanding of the past but also provides multivocal knowledge.
Acknowledgments
Emiliano Bentivenga, Ophelie Lebrasseur, and Milagros Ríos Malán participated in the fieldwork. Therefore, we thank them for having contributed to this experience though the use of the resources that are explained in the article. This work was supported by the Consejo Nacional de Ciencia y Tecnología of Argentina (CONICET) under grant 11220170100033, and the Institute of Heritage Sciences (Incipit), Spanish National Research Council (CSIC). All images are by the authors.
Data Availability Statement
The archaeological data presented in this article are deposited in the Dirección de Antropología de Catamarca (Gobierno de Catamarca, Argentina). The Dirección de Antropología de Catamarca is a public institution that is competent in the custody of the historical heritage of the area where the archaeological survey was carried out.
Competing Interests
The authors declare none.


 Open access