





Highlights
-
• We study determinants of institutional trust using a multidisciplinary survey with experimental modules in representative samples from six OECD countries.
-
• Both perceived governance quality and political affiliation shape institutional trust; governance quality explains more.
-
• Key predictors are perceived government competence (service satisfaction, responsiveness, and reliability) and values (integrity, openness, and fairness).
-
• The perceived integrity of high-level officials strongly predicts evaluations of public institutions.
-
• Improving governance quality can raise trust in government and other institutions.
Introduction
Trust in public institutions, a key ingredient of social and economic progress (Algan and Cahuc Reference Algan, Cahuc, Aghion and Durlauf2014), has eroded in many countries following major shocks like the 2008 financial crisis and the COVID-19 pandemic (Algan, Guriev, Papaioannou et al. Reference Algan, Guriev, Papaioannou and Passari2017; Cohen, P´eron and Algan Reference Cohen, P´eron and Algan2022; OECD 2017a, 2017b). This decline poses significant challenges for collective action and the effectiveness of policy responses (Bargain and Aminjonov Reference Bargain and Aminjonov2020). The consequences extend far beyond politics, as a robust literature links institutional trust to higher economic growth (Knack and Keefer Reference Knack and Keefer1997; Temple Reference Temple2000), better health outcomes and behaviors (Brown, Scheffler, Seo et al. Reference Brown, Scheffler, Seo and Reed2006; Lochner, Kawachi, Brennan et al. Reference Lochner, Kawachi, Brennan and Buka2003), greater subjective well-being (Boarini, Comola, Smith et al. Reference Boarini, Comola, Smith, Manchin and De Keulenaer2012; Helliwell and Wang Reference Helliwell and Wang2011), and lower crime rates (Buonanno, Montolio and Vanin Reference Buonanno, Montolio and Vanin2009). For these reasons, restoring and fostering trust constitutes a first-order policy priority.
A central challenge for policymakers, however, is whether trust can be rebuilt through deliberate action. Is institutional trust primarily an earned response to government performance, making it policy-actionable? Or is it a reflection of deeply ingrained cultural values and psychological traits, placing it largely beyond the reach of short-term policy interventions? This paper confronts this question by conducting a comprehensive, multidisciplinary ‘horse race’ between competing predictors of trust. This paper adopts a multidisciplinary approach to identify the most robust predictors of institutional trust drawing from various social science fields, such as political science (Citrin and Stoker Reference Citrin and Stoker2018; Marien and Hooghe Reference Marien and Hooghe2011; van der Meer and Ouattara Reference van der Meer and Ouattara2019), economics and behavioral economics (Fehr Reference Fehr2009; La Porta, Lopez-de-Silanes, Shleifer et al. Reference La Porta, Lopez-de-Silanes, Shleifer and Vishny1997), psychology (Stanley, Sokol-Hessner, Banaji et al. Reference Stanley, Sokol-Hessner, Banaji and Phelps2011), sociology (Reimann, Schilke and Cook Reference Reimann, Schilke and Cook2017; Schilke, Reimann and Cook Reference Schilke, Reimann and Cook2015), and neuroscience (Schilke, Reimann and Cook Reference Schilke, Reimann and Cook2013). The question examined in this study is the following: what are the individual values, expectations, social preferences, societal attitudes, political perceptions, and perceptions of public governance that are most linked to trust in institutions? In particular, this study assesses the explanatory power of governance quality (ie perceived government probity, fairness, and competence) relative to other factors such as partisanship, individual preferences, and societal factors identified in behavioral economics and social psychology.
To the best of our knowledge, this is the first study to systematically examine the key correlates of both self-reported and experimental measures of institutional trust, drawing on theories and constructs from multiple social science disciplines. Using representative samples of approximately 1000 respondents per country across six countries, it offers a cross-national perspective rarely found in the literature. The analysis is based on the Trustlab database – the first internationally comparable, nationally representative dataset that combines survey data with behavioral and experimental measures of trust and social preferences. The surveys were fielded in the United States (June–July 2017), Germany (July–August 2017, with an additional 97 respondents in June–July 2018), Italy and the United Kingdom (June–July 2018), Japan (January–February 2020), and Slovenia (March–April 2017). This rich dataset allows us to identify the most robust correlates of trust in government, the judicial system, civil servants, and the police. The paper proceeds as follows: Section Conceptual framework reviews the multidisciplinary literature that motivates our analysis. Section Data, methods, and research question describes the Trustlab survey design and our empirical methods. Section Results presents our findings, and Section Discussion discusses their implications.
Conceptual framework
Political trust has long been described as general support for the political system, separate from short-term approval of specific leaders or policies (Easton Reference Easton1965). Since citizens allow the state to exercise power over them, trust means believing that this power will be used responsibly (Levi and Stoker Reference Levi and Stoker2000). It depends on the belief that government is both capable and well-intentioned (Barber Reference Barber1983).
Public concern over trust intensified in the 1970s, when US surveys recorded sharp declines, and scholars debated the cause. Miller (Reference Miller1974) blamed policy failures, while Citrin (Reference Citrin1974) argued that citizens still supported democratic norms but disapproved of specific outcomes. This distinction introduced two enduring pillars of trust: policy – the perceived effectiveness or competence of government (Citrin Reference Citrin1974) – and process – the perceived fairness of political procedures (Hibbing and Theiss-Morse Reference Hibbing and Theiss-Morse2001, Reference Hibbing and Theiss-Morse2002). Subsequent work confirmed that citizens attend to both dimensions and that sustained failure on either can threaten even the deepest reservoir of trust (Hetherington and Rudolph Reference Hetherington and Rudolph2015; Hibbing and Theiss-Morse Reference Hibbing and Theiss-Morse2002).
Parallel to this debate, two broader theoretical families emerged that offer competing explanations for the origins of trust. Cultural theories see trust as a deeply embedded, ‘exogenous’ trait, socialized early and reinforced by interpersonal trust (Mishler and Rose Reference Mishler and Rose1997, Reference Mishler and Rose2001; Newton and Norris Reference Newton, Norris, Pharr and Putnam2000). High-trust societies, it is argued, spill over their generalized social trust onto political authorities (Putnam Reference Putnam, Crothers and Lockhart2000; Uslaner Reference Uslaner2002), making trust relatively stable and independent of short-term government actions.
In direct contrast, institutional performance theories treat trust as ‘endogenous’ – earned or squandered by what governments actually do (Levi and Stoker Reference Levi and Stoker2000; Newton and Norris Reference Newton, Norris, Pharr and Putnam2000). From this perspective, citizens update their beliefs in a rational fashion: effective, honest, and fair governance breeds trust, while corruption, incompetence, or policy failure breeds distrust. Empirical work has often found strong support for this view. In post-Communist Europe, for instance, satisfaction with current performance and perceived corruption outweighed cultural predispositions in explaining trust (Mishler and Rose Reference Mishler and Rose2001). Similar patterns hold in mature democracies, where economic success and administrative competence bolster trust (Anderson and Tverdova Reference Anderson and Tverdova2003; Chanley et al. Reference Chanley, Rudolph and Rahn2000; van Erkel and van der Meer Reference van Erkel and van der Meer2016). Recent cross-national work reinforces the centrality of economic performance, identifying growth as a crucial determinant of trust in government (Goodhart and Vu Reference Goodhart and Hoang Vu2025). This research, however, also highlights a ‘Trust Paradox’: the relationship between growth and trust is often weaker in mature democracies, and citizens in autocratic states that deliver strong economic results frequently report higher levels of trust (Goodhart and Vu Reference Goodhart and Hoang Vu2025).
Recent work by Tai and Solt (Reference Tai and Solt2024) further refines this distinction using a new cross-national dataset on trust in civil servants from 1986 to 2022 and a model that separates short-term shocks from long-term, structural factors. Their analysis reveals that while positive short-term shifts in outcomes – such as GDP growth and falling unemployment – modestly boost trust, the most powerful and enduring determinant is the long-term quality of governance. Specifically, high levels of government effectiveness have a large and sustained positive effect on trust in civil servants, while chronically high homicide rates have a strong negative impact. These long-run institutional quality effects are substantially larger than the transient effects of economic performance. This distinction reinforces the view that citizens differentiate between temporary outcomes and the stable, underlying competence of state institutions, with the latter being fundamental to sustaining public trust (Tai and Solt Reference Tai and Solt2024).
A more nuanced perspective moves beyond the dichotomy between cultural and institutional performance theories by emphasizing their coevolution. In this view, culture and institutions interact through mutual feedback loops: inherited values shape the demand for particular institutions, which in turn reinforce and transmit those values across generations, leading to self-reinforcing equilibria (Alesina and Giuliano Reference Alesina and Giuliano2015). A striking example of such path dependency is provided by Nunn and Wantchekon (Reference Nunn and Wantchekon2011), who show that the historical intensity of the slave trade strongly predicts lower levels of interpersonal trust in Africa today. The slave trade undermined social cohesion and fostered a pervasive culture of mistrust that has endured over centuries. This legacy highlights how historical shocks can entrench societies in low-trust equilibria, with persistent cultural norms that continue to constrain institutional and economic development.
The empirical challenge is further complicated by evidence suggesting that trust varies across state branches, with distinct drivers for the government, courts, bureaucracy, and police. For elected branches (executive and legislature), studies suggest that trust hinges on output legitimacy – such as economic growth and policy delivery – and can be eroded swiftly by (corruption) scandals (Chang and Chu Reference Chang and Chu2006; Morris and Klesner Reference Morris and Klesner2010). A foundational theory of legitimacy, advanced by Tyler (Reference Tyler1990), posits that the public’s willingness to accept legal authority hinges on procedural justice: the perception that institutional processes are fair, neutral, and respectful. According to this view, the fairness of the process can be more influential than the favorability of the outcome itself. However, the applicability of this theory may be context-dependent. In a study of the European Court of Justice, for instance, Gibson and Caldeira (Reference Gibson and Caldeira1995) found that citizens’ perceptions of procedural fairness had little to no direct effect on their willingness to accept an unpopular ruling. They argue that for a distant, transnational institution, the public may lack the direct experience required to form meaningful judgments about its procedures. Instead, their findings suggest that acceptance is driven by a deeper, more resilient ‘diffuse support’ – a general commitment to the institution’s legitimacy that is independent of its specific actions or processes.
The bureaucracy seems to engender trust by demonstrating impartiality, efficiency, and responsiveness in frontline service encounters. Studies suggest that citizens’ trust in public administration may depend more on these direct interactions than on broad policy outcomes (van de Walle and Bouckaert Reference van de Walle and Bouckaert2003), with bureaucratic impartiality emerging as a particularly critical element of ‘good governance’ that fosters positive public evaluations (Choi Reference Choi2018). Likewise, trust in the police appears to combine process-oriented evaluations with community-specific experiences of fairness and respectful treatment. This work suggests that public assessments of the process of policing – judgments about the fairness and respect with which officers exercise their authority – often overshadow assessments of crime control effectiveness as the primary driver of police legitimacy and public cooperation (Jackson et al. Reference Jackson, Kuha, Bradford and Hough2024; Sunshine and Tyler Reference Sunshine and Tyler2003; Tyler Reference Tyler2005). However, the link between trust and specific cooperative behaviors like crime reporting is not always straightforward. Indeed, empirical work often finds that trust in the police, on its own, does not directly predict a higher likelihood of victims reporting offenses (Kääriäinen and Sirén Reference Kääriäinen and Sirén2011). Instead, its effect appears to be conditional on citizens’ level of generalized social trust. In a study of Finnish crime victims, Kääriäinen and Sirén (Reference Kääriäinen and Sirén2011) find that among citizens who trust their peers, lower trust in the police reduces crime reporting, as expected. Conversely, among citizens with low generalized trust, the relationship is inverted: those who trust neither their fellow citizens nor the police are the most likely to report crimes, suggesting that for this group, formal institutions are the only available recourse, regardless of their perceived quality (Kääriäinen and Sirén Reference Kääriäinen and Sirén2011)
Thus, the literature suggests that while both competence (eg reliability and responsiveness) and values (eg integrity, openness, and fairness) matter universally, their relative weights can vary substantially across institutions (OECD 2017a). Policy performance may be most critical for political bodies, procedural fairness for courts and police, and administrative efficiency for bureaucratic trust, a variation which demands an analytical approach that can distinguish between these various institutional targets.
Moreover, the relationship between citizens’ direct experiences and institutional trust is empirically difficult to pin down. While the ‘micro-performance hypothesis’ – which posits that better quality public services lead to more satisfied users and, in turn, increased trust in government – is intuitive, the causal link is contested (Bouckaert et al. Reference BBouckaert, Van de Walle, Maddens and Kampen2002; van de Walle and Bouckaert Reference van de Walle and Bouckaert2003; Yang and Holzer Reference Yang and Holzer2006). Indeed, broad cross-national analyses have found no statistically significant correlation between indices of governance quality and levels of trust in government, complicating a simple performance-based story (Killerby Reference Killerby2005). Some scholars argue that the causality may be reversed: a citizen’s pre-existing level of trust in government may color their perception of an agency’s performance, rather than the performance evaluation shaping their trust (Bouckaert et al. Reference BBouckaert, Van de Walle, Maddens and Kampen2002; van de Walle and Bouckaert Reference van de Walle and Bouckaert2003). This suggests that trust is not merely a rational response to service delivery but is also shaped by broader attitudes. Further complicating the picture, research in Norway – a country with a high level of government performance – finds that while satisfaction with specific public services does correlate with institutional trust, its effect is significantly weaker than that of broader political-cultural factors, chief among them a general satisfaction with the way democracy functions (Christensen and Laegreid Reference Christensen and Laegreid2005). This implies that in contexts where good performance is largely taken for granted, citizens may rely more on general political attitudes than specific service encounters when forming trust judgments (Christensen and Laegreid Reference Christensen and Laegreid2005).
Furthermore, studies suggest that trust is a general attitude; a high level of trust in one institution tends to be associated with high levels of trust in others, suggesting that citizens do not always differentiate sharply between various state entities (Bouckaert et al. Reference BBouckaert, Van de Walle, Maddens and Kampen2002; Christensen and Laegreid Reference Christensen and Laegreid2005). This shift may be driven by broader social transformations, as evidence from across advanced industrial democracies suggests the erosion of trust has been sharpest among younger and more educated citizens, pointing not to a failure of government performance but to the rise of a more critical citizenry with higher expectations of its political institutions (Dalton Reference Dalton2005).
The literature also emphasizes that the effect of macro-level performance and procedural quality on citizen trust varies systematically across individuals, depending on their personal characteristics. The ‘trust-as-evaluation’ model implies that citizens must both perceive institutional realities accurately and care about them normatively for these factors to influence their trust judgments (van der Meer and Hakhverdian Reference van der Meer and Hakhverdian2017). Political sophistication, often proxied by education, appears to be a key moderator; more educated citizens are better able to evaluate government performance and are more sensitive to procedural violations like corruption, leading to a stronger link between quality of government and trust among this group (Hakhverdian and Mayne Reference Hakhverdian and Mayne2012; Noordzij et al. Reference Noordzij, De Koster and Van der Waal2021). Similarly, ideological congruence – the match between a citizen’s preferences and those of elected elites – also shapes satisfaction. Evidence suggests that citizens are more responsive to ‘egocentric congruence’ (their personal ideological distance from the government) than to ‘sociotropic congruence’ (the distance between the government and the median citizen), particularly among the politically sophisticated (Mayne and Hakhverdian Reference Mayne and Hakhverdian2017). This underscores that the connection between macro-level governance and individual trust is fundamentally a micro–macro interactive relationship.
Bridging these perspectives, our study adopts the comprehensive two-dimensional framework of competence and values (Blind Reference Blind2006; OECD 2017a). Competence – or capacity – concerns the government’s ability to provide reliable services and respond effectively to shocks, while values capture the integrity, fairness, and openness of the policy process (OECD 2017a). These dimensions map neatly onto the foundational ‘policy’ (Citrin Reference Citrin1974) and ‘process’ (Hibbing and Theiss-Morse Reference Hibbing and Theiss-Morse2001) notions, reflecting that citizens reward good outcomes but also care deeply about how those outcomes are produced (OECD 2017a). Various theoretical lenses reinforce this framework. Procedural justice theory, for example, places primary importance on the values dimension, arguing that the public’s trust and the legitimacy they confer upon institutions are shaped more by the perceived fairness of procedures than by the effectiveness of outcomes (Hough et al. Reference Hough, Jackson, Bradford, Myhill and Quinton2010; Sunshine and Tyler Reference Sunshine and Tyler2003). Conversely, performance-based theories emphasize the competence dimension, suggesting that citizens’ trust is an evaluation of the quality and effectiveness of public service delivery (van de Walle and Bouckaert Reference van de Walle and Bouckaert2003). Together, these perspectives – from legitimacy theory’s focus on rightful authority (Tyler and Huo Reference Tyler and Huo2002) to principal–agent models of rational action (Tyler and Huo Reference Tyler and Huo2002) – converge on the idea that trust is a multifaceted judgment, resting on parallel assessments of both effective delivery (competence) and ethical conduct (values).
However, establishing the centrality of this framework does not resolve the deeper empirical challenges of measurement and causality. Traditional explicit surveys – like the World Values Survey items on trust in parliament or the long-standing American National Election Studies (ANES) question, ‘How much of the time do you trust the government in Washington to do what is right?’ – have provided invaluable trend data (Pew Research Center 2024). Yet, while foundational, these self-reports on trust can suffer from interpretation biases, transient political influences, and social desirability effects (Gershtenson and Plane Reference Gershtenson and Plane2007; Mishler and Rose Reference Mishler and Rose2001; Newton and Norris Reference Newton, Norris, Pharr and Putnam2000).
To address this, a growing body of research has turned to implicit measures, such as the Implicit Association Test (IAT), which captures automatic, subconscious attitudes toward institutions. This research reveals a stark disconnect, suggesting that individuals who explicitly report distrust may still hold positive unconscious associations with government (Intawan and Nicholson Reference Intawan and Nicholson2018).Footnote 1
For instance, Intawan and Nicholson (Reference Intawan and Nicholson2018) show that most Americans implicitly trust government even while explicitly professing distrust. They find that these two forms of trust are largely uncorrelated and that implicit trust varies little by partisanship or demographics. Furthermore, it predicts system justification and a willingness to rally behind government in a crisis, though not day-to-day policy preferences, suggesting it captures a distinct psychological construct. Similar findings have emerged from China, where 84 percent of respondents exhibit implicit trust, again uncorrelated with explicit responses (Huang et al. Reference Huang, Intawan and Nicholson2023). There, evaluations of government performance affect only explicit trust, implying that implicit trust is a more stable, affective orientation, perhaps rooted in political socialization (see also Nicholson and Huang Reference Nicholson and Huang2023). Huang et al. (Reference Huang, Intawan and Nicholson2024) also demonstrate that both forms of trust can independently increase susceptibility to state propaganda.
While this work powerfully highlights a critical measurement gap, it remains geographically concentrated and has yet to integrate implicit measures with behavioral data from incentivized economic experiments. Thus, it is largely unknown how these distinct layers of trust – explicit, implicit, and behavioral – relate to one another and to their potential determinants in a broad cross-national context. Our findings align closely with this literature – we too observe a divergence between explicit and implicit trust – but we extend it by examining these relationships across a diverse set of countries. In doing so, we show that while explicit trust is strongly associated with perceived government performance, implicit trust is instead significantly correlated with behavioral preferences like experimentally measured altruism and risk tolerance.
Summing up, the study of institutional trust is characterized by distinct theoretical traditions across the social sciences. Political science often frames trust as a component of political support, distinguishing between specific support for incumbent authorities and diffuse support for the regime itself (Citrin and Stoker Reference Citrin and Stoker2018; Easton Reference Easton1965), with trust levels often seen as an evaluation of governance quality, encompassing both performance and process (van der Meer and Ouattara Reference van der Meer and Ouattara2019). Economics approaches trust through the lens of rational choice and incentives, where citizens, as principals, trust government agents when institutional arrangements provide credible commitments and ensure accountability, thereby lowering transaction costs for economic and social exchange (Algan and Cahuc Reference Algan and Cahuc2010; Arrow Reference Arrow1972); behavioral economics further incorporates psychological factors such as altruism, risk, and betrayal aversion (Fehr Reference Fehr2009). In contrast, sociology views institutional trust as deeply embedded in the social fabric, emerging from a society’s stock of social capital and generalized interpersonal trust rather than from short-term calculation (Putnam Reference Putnam1993; Uslaner Reference Uslaner2002). Finally, public administration focuses on the implementation process, positing that trust is built or eroded through citizens’ direct, ‘street-level’ encounters with the state and their assessment of procedural fairness (Tyler Reference Tyler1990; van de Walle and Bouckaert Reference van de Walle and Bouckaert2003).
This disciplinary specialization, however, leaves existing frameworks vulnerable to omitted variable bias. A robust literature across economics, psychology, and sociology links trust to a wide range of attitudes and behavioral traits often absent from standard political science models. These include underlying preferences and expectations such as risk attitudes (Fehr Reference Fehr2009), beliefs about others (Bouckaert et al. Reference BBouckaert, Van de Walle, Maddens and Kampen2002), and social preferences like altruism, reciprocity, and inequality aversion measured in incentivized experiments (Falk and Fischbacher Reference Falk and Fischbacher2006; Fehr and Schmidt Reference Fehr and Schmidt1999; Kahneman et al. Reference Kahneman, Knetsch and Thaler1986). Psychological mechanisms like system justification (Jost Reference Jost2004), social capital indicators like volunteering or neighborhood cohesion (Bekkers Reference Bekkers2012; Putnam Reference Putnam, Crothers and Lockhart2000; Sivesind et al. Reference Sivesind, Pospíšilová and Friˇc2013), and views on societal issues like diversity (Alesina and La Ferrara Reference Alesina and La Ferrara2002; Alesina and Tabellini Reference Alesina and Tabellini2024; Rothstein and Uslaner Reference Rothstein and Uslaner2005), inequality (Anderson and Singer Reference Anderson and Singer2008), globalization and digitization (Swank Reference Swank2003), religiosity (Schoenfeld Reference Schoenfeld1978), and social mobility (Alesina et al. Reference Alesina, Stantcheva and Teso2018) are all powerful predictors of social attitudes. By failing to account for these factors, studies focusing narrowly on governance perceptions may misattribute the importance of institutional performance.
To address this challenge, our paper adopts a multidisciplinary approach that explicitly integrates these diverse predictors to identify the most robust drivers of institutional trust. From political science, we incorporate standard models that emphasize the primacy of perceived governance quality – decomposed into its core dimensions of competence and values – and the role of partisanship in shaping political attitudes (Citrin and Stoker Reference Citrin and Stoker2018; OECD 2017a; van der Meer and Ouattara Reference van der Meer and Ouattara2019). From sociology, we integrate the aforementioned measures of social capital and societal attitudes (Putnam Reference Putnam, Crothers and Lockhart2000; Reimann, Schilke and Cook Reference Reimann, Schilke and Cook2017). Building on economics and behavioral economics, our framework includes the experimentally measured social preferences and individual risk attitudes highlighted above as potential confounds (Fehr Reference Fehr2009; La Porta, Lopez-de-Silanes, Shleifer et al. Reference La Porta, Lopez-de-Silanes, Shleifer and Vishny1997). Finally, drawing from psychology and neuroscience, we move beyond traditional survey measures by using IATs to capture unconscious attitudes, testing whether these have different predictors than their explicit counterparts (Schilke, Reimann and Cook Reference Schilke, Reimann and Cook2013, Reference Schilke, Reimann and Cook2015; Stanley, Sokol-Hessner, Banaji et al. Reference Stanley, Sokol-Hessner, Banaji and Phelps2011).
This study addresses key limitations in prior frameworks by: (1) contributing to the debate on theoretical fragmentation between institutional and cultural–psychological explanations; (2) improving upon measurement by incorporating multiple types of trust indicators; and (3) mitigating concerns about omitted variable bias by including experimental measures of social preferences to capture unobserved behavioral traits. By leveraging the unique multidisciplinary Trustlab survey, we conduct a comprehensive ‘horse race’ between predictors drawn from across the social sciences. Our combination of self-reports, IATs, and incentivized experiments allows us to dissect the distinct correlates of explicit, implicit, and behavioral trust. This integrated approach enables us to provide one of the most robust tests to date of the determinants of institutional trust, clarifying whether perceived governance quality remains the primary driver after controlling for a vast array of potential individual and societal confounds.
Data, methods, and research question
Data
Trustlab is the most comprehensive cross-national effort to measure trust in both institutions and others. In each country, the survey combines self-reports, behavioral experiments, and IATs to capture trust in institutions (eg government, civil servants, the judicial system, and the police) as well as interpersonal trust. It also collects a wide range of potential determinants, including perceptions of institutions, views on society, and measures of social preferences.
Country selection followed an open call by the OECD to institutions willing to finance data collection and adhere to a standardized methodology, rather than a systematic global sampling strategy. Still, the final sample captures substantial economic and cultural diversity. The six countries together account for roughly 40% of global GDP, underscoring their economic relevance. Culturally, the inclusion of Japan and Slovenia broadens the sample beyond the usual ‘WEIRD’ (Western, Educated, Industrialized, Rich, Democratic) societies highlighted by Henrich, Heine, and Norenzayan (Reference Henrich, Heine and Norenzayan2010). Moreover, the dataset spans four of the eight cultural zones identified by Inglehart and Welzel (Reference Inglehart and Welzel2005): Anglo-Saxon, Protestant Europe, Catholic Europe, and Confucian.
Each survey was administered online to a sample of approximately 1000 respondents, drawn by a private polling firm to be nationally representative by age, gender, and income. Participants received a fixed payment for completing the survey and an additional payoff based on their choices in a randomly selected behavioral module. To ensure data quality, exclusion criteria were applied using predefined validation checks (see Table A3, Online Appendix).
As shown in Table A2 (Online Appendix), the sample provides a broadly representative snapshot of national populations along the targeted variables of gender, education, and income. Gender distributions in particular closely mirror official statistics. Some deviations in socioeconomic composition are expected and typical of online survey samples (see Alesina, Stantcheva and Teso Reference Alesina, Stantcheva and Teso2018; Stantcheva Reference Stantcheva2023). In particular, individuals with higher education levels are overrepresented in several countries, notably Germany and Japan. Unemployed individuals are also somewhat overrepresented relative to official labor force statistics, especially in the United States and the United Kingdom.
Methods
Trustlab comprises three modules. Module 1 includes three incentive-compatible economic games to assess trust and social preferences. Module 2 contains an IAT for implicit trust in government and the judicial system. Module 3 is a survey covering self-reported trust, its determinants, and socio-demographic background. All measures are detailed in the Online Appendix.
The Trustlab survey was reviewed and approved by both the Statistics and Data Directorate and the Governance Directorate of the OECD. It was included in the official 2017–2018 Programme of Work and Budget of the Committee on Statistics and Statistical Policy, which comprises representatives from all OECD member countries. The survey instruments and experimental tasks raise no ethical concerns, as they are adapted from established sources such as the European Quality of Life Survey, European Social Survey, Eurobarometer, and peer-reviewed academic studies (see Online Appendix Table A1). All respondents gave written informed consent through the contracted polling company.
In Module 1’s games, participants interact anonymously and receive monetary payoffs based on decisions, computed post-survey. The Trust Game (Berg, Dickhaut and McCabe Reference Berg, Dickhaut and McCabe1995) pairs participants as first and second movers, each endowed with €10 (or equivalent). The first mover transfers any multiple of €1 from 0 to 10; the second receives triple that amount and decides how much to return (0 to the tripled amount plus their €10). The transfer measures interpersonal trust, as the first mover risks non-reciprocation (Cox Reference Cox2004; Kollock Reference Kollock1994), though altruism (Cetre, Algan, Grimalda et al. Reference Cetre, Algan, Grimalda, Murtin, Pipke, Putterman, Schmidt and Siegerink2024; Kovacs, Dunaiski, Galizzi et al. Reference Kovacs, Dunaiski, Galizzi, Grimalda, Hortala-Vallve, Murtin and Putterman2024) and efficiency concerns (Engelmann and Strobel Reference Engelmann and Strobel2004) may influence it. The return measures trustworthiness (Cox, Kerschbamer and Neururer Reference Cox, Kerschbamer and Neururer2016).Footnote 2 Using the strategy method, second movers decide for all 11 possible transfers (Brandts and Charness Reference Brandts and Charness2011), and first movers report what they expect the second mover would return if they sent €5. All participants play both roles.
The Public Goods Game (Fehr and Gächter Reference Fehr and Gächter2000) measures cooperation in a social dilemma, with simultaneous actions altering its psychology from the Trust Game (Yamagishi and Kiyonari Reference Yamagishi and Kiyonari2000). Trustlab includes both an unconditional version of the Public Goods Game, where respondents are not aware of the contribution of the other players; and a conditional version, where participants are asked to indicate their decisions for each of the possible mean contributions of the other three participants. The Dictator Game (Kahneman, Knetsch and Thaler Reference Kahneman, Knetsch and Thaler1986) isolates pure altruism.
IATs capture implicit institutional trust where self-reports may bias results (Greenwald, Nosek and Banaji Reference Greenwald, Nosek and Banaji2003). IATs have been widely used to measure perceptions, stereotypes, and attitudes toward socially stigmatized groups, including Black individuals, women, and the elderly (Aberson, Shoemaker and Tomolillo Reference Aberson, Shoemaker and Tomolillo2004; Banaji and Greenwald Reference Banaji and Greenwald2013; Dasgupta and Asgari Reference Dasgupta and Asgari2004). More recently, they have also been applied to assess implicit attitudes toward political parties and government institutions (Hawkins and Nosek Reference Hawkins and Nosek2012; Intawan and Nicholson Reference Intawan and Nicholson2018; Nicholson and Huang Reference Nicholson and Huang2023; Raccuia Reference Raccuia2016). Explicit measures suffer from interpretive ambiguity (eg ‘do what is right’ as moral, effective, or preference-aligned) (Gershtenson and Plane Reference Gershtenson and Plane2007), wording asymmetries inflating trust, and social desirability bias (Booth-Kewley, Larson and Miyoshi Reference Booth-Kewley, Larson and Miyoshi2007).
Unlike traditional ‘two-sided’ IATs that contrast opposing categories (eg Black/White, Male/Female), the Trustlab version uses a ‘one-sided’ format (Bluemke and Friese Reference Bluemke and Friese2008; Raccuia Reference Raccuia2016). It presents a single target category – such as ‘Government’ – and pairs it with either ‘Trustworthy’ or ‘Untrustworthy.’ Respondents sort stimulus words into the correct category in both conditions. Faster sorting when ‘Government’ is paired with ‘Trustworthy’ yields a positive D-score, indicating higher implicit trust; faster sorting with ‘Untrustworthy’ yields a negative D-score, suggesting implicit distrust. The D-score reflects the latency of these associations. Respondents are randomly assigned to either the government or judiciary IAT version.
Module 3 surveys self-reported trust and determinants like individual traits, values, governance perceptions, and societal attitudes. Generalized interpersonal trust modifies the Rosenberg question to avoid caution bias – vulnerable groups (eg women, elderly) may report lower trust with the original wording: ‘Generally speaking, would you say that most people can be trusted, or that you can’t be too careful in dealing with people?’ We, focusing on ‘trust’, use: ‘On a scale from zero to ten, where zero is ’not at all’ and ten is ’completely,’ in general, how much do you trust most people?’. Psychological traits associated with prosociality and trust were measured in the Italian and UK samples; a brief analysis of these data is provided in the Online Appendix.
On the methodological front, this study represents a state-of-the-art approach relative to recent high-quality work in the field (see Section Conceptual framework). Our analysis incorporates 40 potential predictors of institutional trust, selected from a comprehensive review of the economics, political science, sociology, and psychology literatures to ensure our models account for the main theoretical drivers identified in prior research. This multidisciplinary selection mitigates the risk of omitted variable bias that might otherwise distort coefficient estimates in more parsimonious models. For expositional clarity, we classify these predictors into three broad categories – individual characteristics, perceptions of institutions, and societal attitudes – as an organizing heuristic; this does not constrain the analysis, as explanatory power is computed for each variable individually. Predictors were measured using standard, appropriate methods, as detailed in Table A1 (Online Appendix). These include incentivized behavioral games to elicit social preferences (eg amounts sent in Trust, Dictator, and Public Goods games), standard survey questions on 0–10 Likert scales for attitudes and perceptions (eg willingness to take risks, satisfaction with public services), and direct demographic questions. This comprehensive approach enhances internal validity and sharpens the interpretation of each coefficient by minimizing the influence of potential confounders.
Reassuringly, we conducted a power analysis using G*Power (Faul, Erdfelder, Lang et al. Reference Faul, Erdfelder, Lang and Buchner2007) for a fixed-set multiple regression with $k = 40$
predictors. Assuming a small effect size of
$k = 40$
predictors. Assuming a small effect size of ${f^2} = 0.02$
(Cohen Reference Cohen1988), a sample of
${f^2} = 0.02$
(Cohen Reference Cohen1988), a sample of $N = 2005$
achieves
$N = 2005$
achieves $1 - \beta = 0.95$
power at a two-sided
$1 - \beta = 0.95$
power at a two-sided $\alpha = 0.05$
. The squared semi-partial effect size,
$\alpha = 0.05$
. The squared semi-partial effect size, ${f^2} = {R^2}/\left( {1 - {R^2}} \right)$
, captures the variance explained jointly by the predictors relative to residual variance. Given that our estimation samples include up to
${f^2} = {R^2}/\left( {1 - {R^2}} \right)$
, captures the variance explained jointly by the predictors relative to residual variance. Given that our estimation samples include up to $N \approx 7000$
observations, statistical power approaches 1 – even under a Bonferroni-adjusted significance level of
$N \approx 7000$
observations, statistical power approaches 1 – even under a Bonferroni-adjusted significance level of $\alpha = .00125$
to control for familywise error. These calculations confirm that our analyses are well powered to detect even modest effects.
$\alpha = .00125$
to control for familywise error. These calculations confirm that our analyses are well powered to detect even modest effects.
Research question
This study reconciles evidence on institutional trust determinants by evaluating competing factors’ relative importance, without favoring one theory. Among the factors outlined in Section Conceptual framework, political scientists have frequently emphasized governance quality – including integrity, shared values, and competencies such as responsiveness and effectiveness – as a central driver of trust in government (Citrin and Stoker Reference Citrin and Stoker2018; Norris Reference Norris2011). We formally test this view through the following hypothesis:
Hypothesis 1: Perceived governance quality is the most important determinant of trust in institutions, above partisanship, societal attitudes, social preferences, and other individual characteristics.
While this hypothesis guides the core analysis, the study also examines the explanatory power of the broader set of factors. In particular, we assess which dimensions of governance quality matter most and how they compare to alternative drivers of institutional trust.
Results
Descriptive analysis
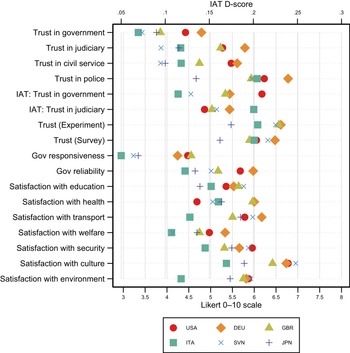
As illustrated in Figure 1, the data reveal generally low levels of institutional trust. Confidence in national governments averages just 3.9, with particularly low scores in Italy and Slovenia. Japan stands out for reporting the lowest levels of both interpersonal trust and trust in the police. A key finding, consistent with theories of performance-based legitimacy (see, eg Hetherington and Rudolph Reference Hetherington and Rudolph2015), is that citizens clearly distinguish between institutions: trust in the police averages 5.7 – well above trust in government across all countries – possibly reflecting its more apolitical and service-oriented role.
Mean trust and governance perceptions by country.
Notes: The figure plots the mean scores for each variable by country. Self-reported survey, experimental, and satisfaction measures are plotted on the bottom axis (0–10 Likert scale). Implicit Association Test (IAT) measures are plotted on the top axis (D-score scale). The legend indicates the marker corresponding to each country. DEU, GBR, ITA, JPN, SVN, and USA are the ISO codes for Germany, the United Kingdom, Italy, Japan, Slovenia, and the United States.

Strikingly, the figure also visualizes the divergence between explicit and implicit attitudes. While the explicit trust measures are spread across the bottom 0–10 scale, the implicit (IAT) measures on the top axis are more clustered. This visual pattern is confirmed by statistical tests: while most cross-country differences in explicit trust and satisfaction are significant, t-tests show that differences in implicit trust scores between countries rarely are. For instance, for implicit trust in the judiciary, national averages are statistically indistinguishable in most pairwise comparisons, while for implicit trust in government, the few significant differences are driven primarily by comparisons involving Italy and the United States. This suggests that these subconscious attitudes are more stable across national contexts than their explicit counterparts, pointing to a latent reservoir of positive trust (see also Intawan and Nicholson Reference Intawan and Nicholson2018). Finally, the close alignment between self-reported (6.2) and experimental (5.9) measures of interpersonal trust reinforces the credibility of both approaches.
These cross-country differences in trust mirror underlying perceptions of how governments perform. Figure 1 visually confirms this link: countries with lower trust scores, such as Italy and Slovenia, also consistently show lower mean scores on performance metrics like government responsiveness and reliability. In contrast, Germany and the United States, where trust in government is relatively higher, have markers further to the right on these same governance dimensions. Although the correspondence is not exact – Japan, for instance, shows moderate trust despite lukewarm performance ratings – the overall pattern supports a performance-based view of trust. That is, institutional trust appears to reflect citizens’ assessments of how well government functions, rather than being purely cultural or static.
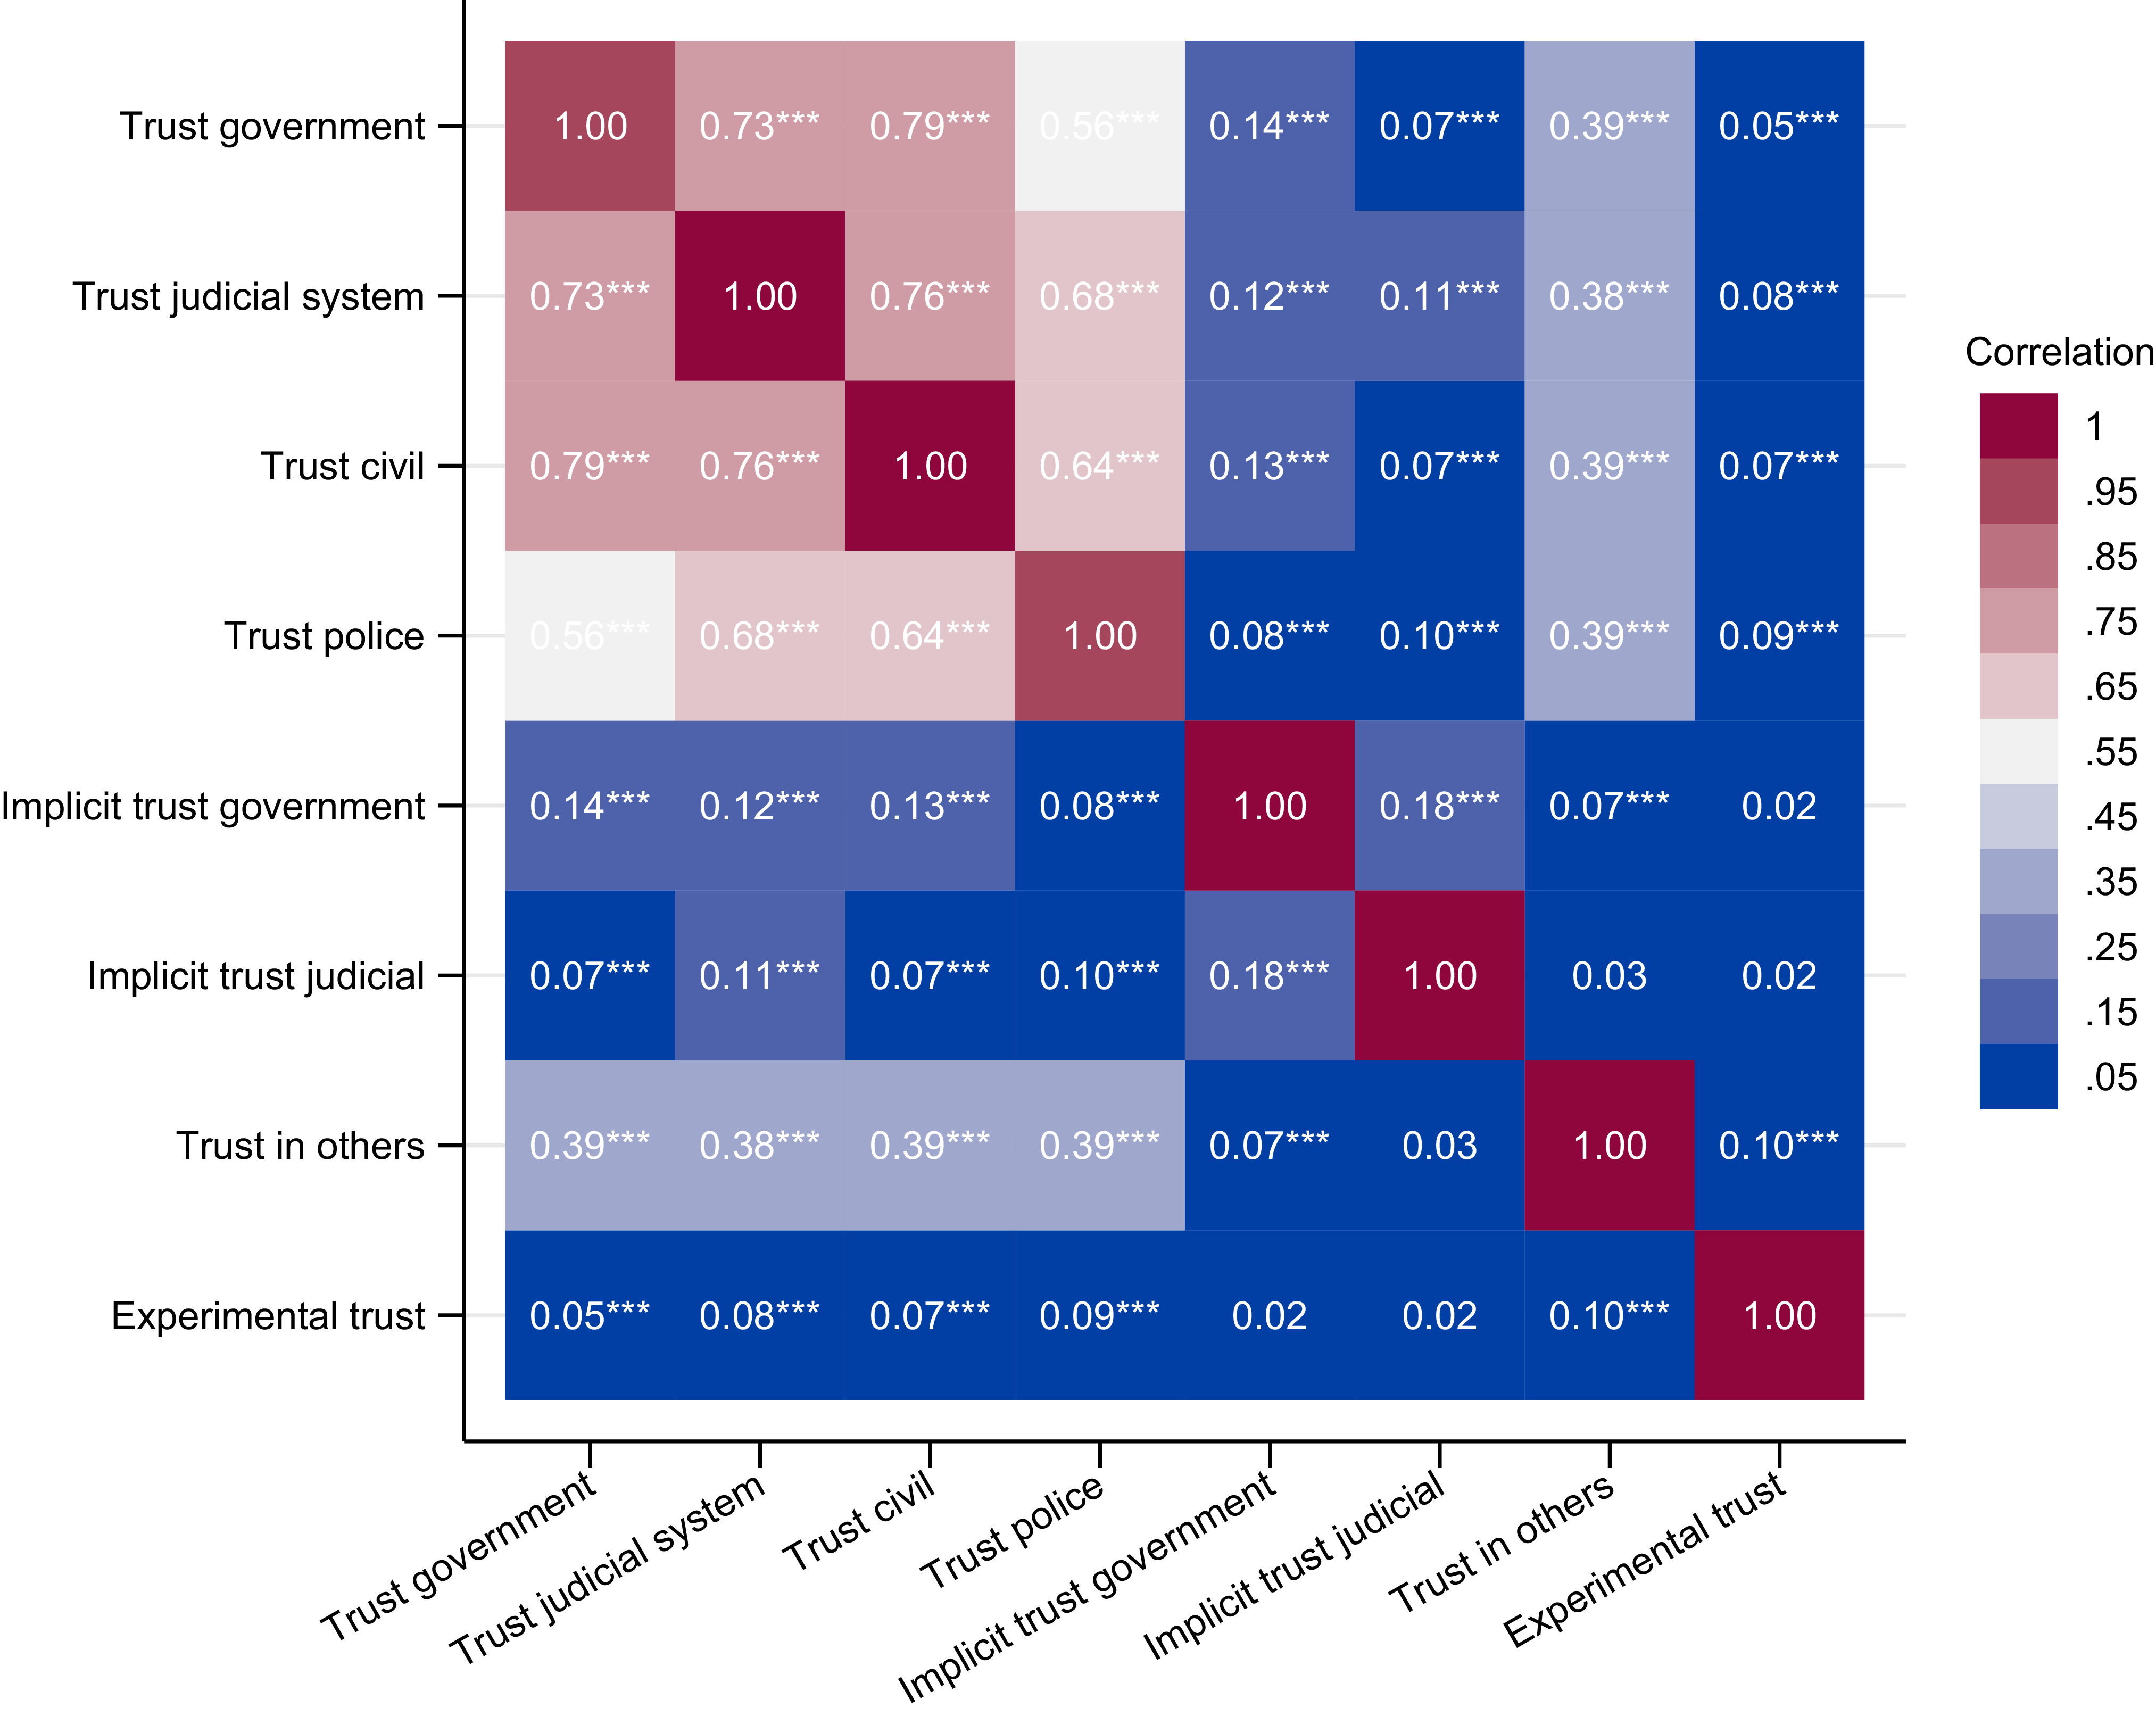
The correlation matrix in Figure 2 highlights three key findings. First, self-reported trust in different state institutions – government, the judiciary, civil service, and the police – are all highly correlated, with coefficients often exceeding 0.70, suggesting a strong, single dimension of explicit institutional trust. Second, and most critically, there is a stark disconnect between these explicit measures and their implicit counterparts. The correlations between explicit and implicit trust are consistently weak, typically below 0.15, reinforcing the view that they capture distinct psychological constructs. Third, while general trust in others is moderately associated with institutional trust (around 0.39), trust as measured in an experimental setting shows almost no relation to institutional attitudes.
Correlation matrix of trust measures.
Notes: The figure displays Pearson’s correlation coefficients between self-reported, implicit, and experimental trust measures from the pooled six-country sample. The color scale indicates the strength of the correlation, from high positive correlations (dark red) to weak or low correlations (blue). Asterisks denote statistical significance: ***p $ \lt$
0.01, **p
$ \lt$
0.01, **p $ \lt$
0.05, *p
$ \lt$
0.05, *p $ \lt$
0.1.
$ \lt$
0.1.
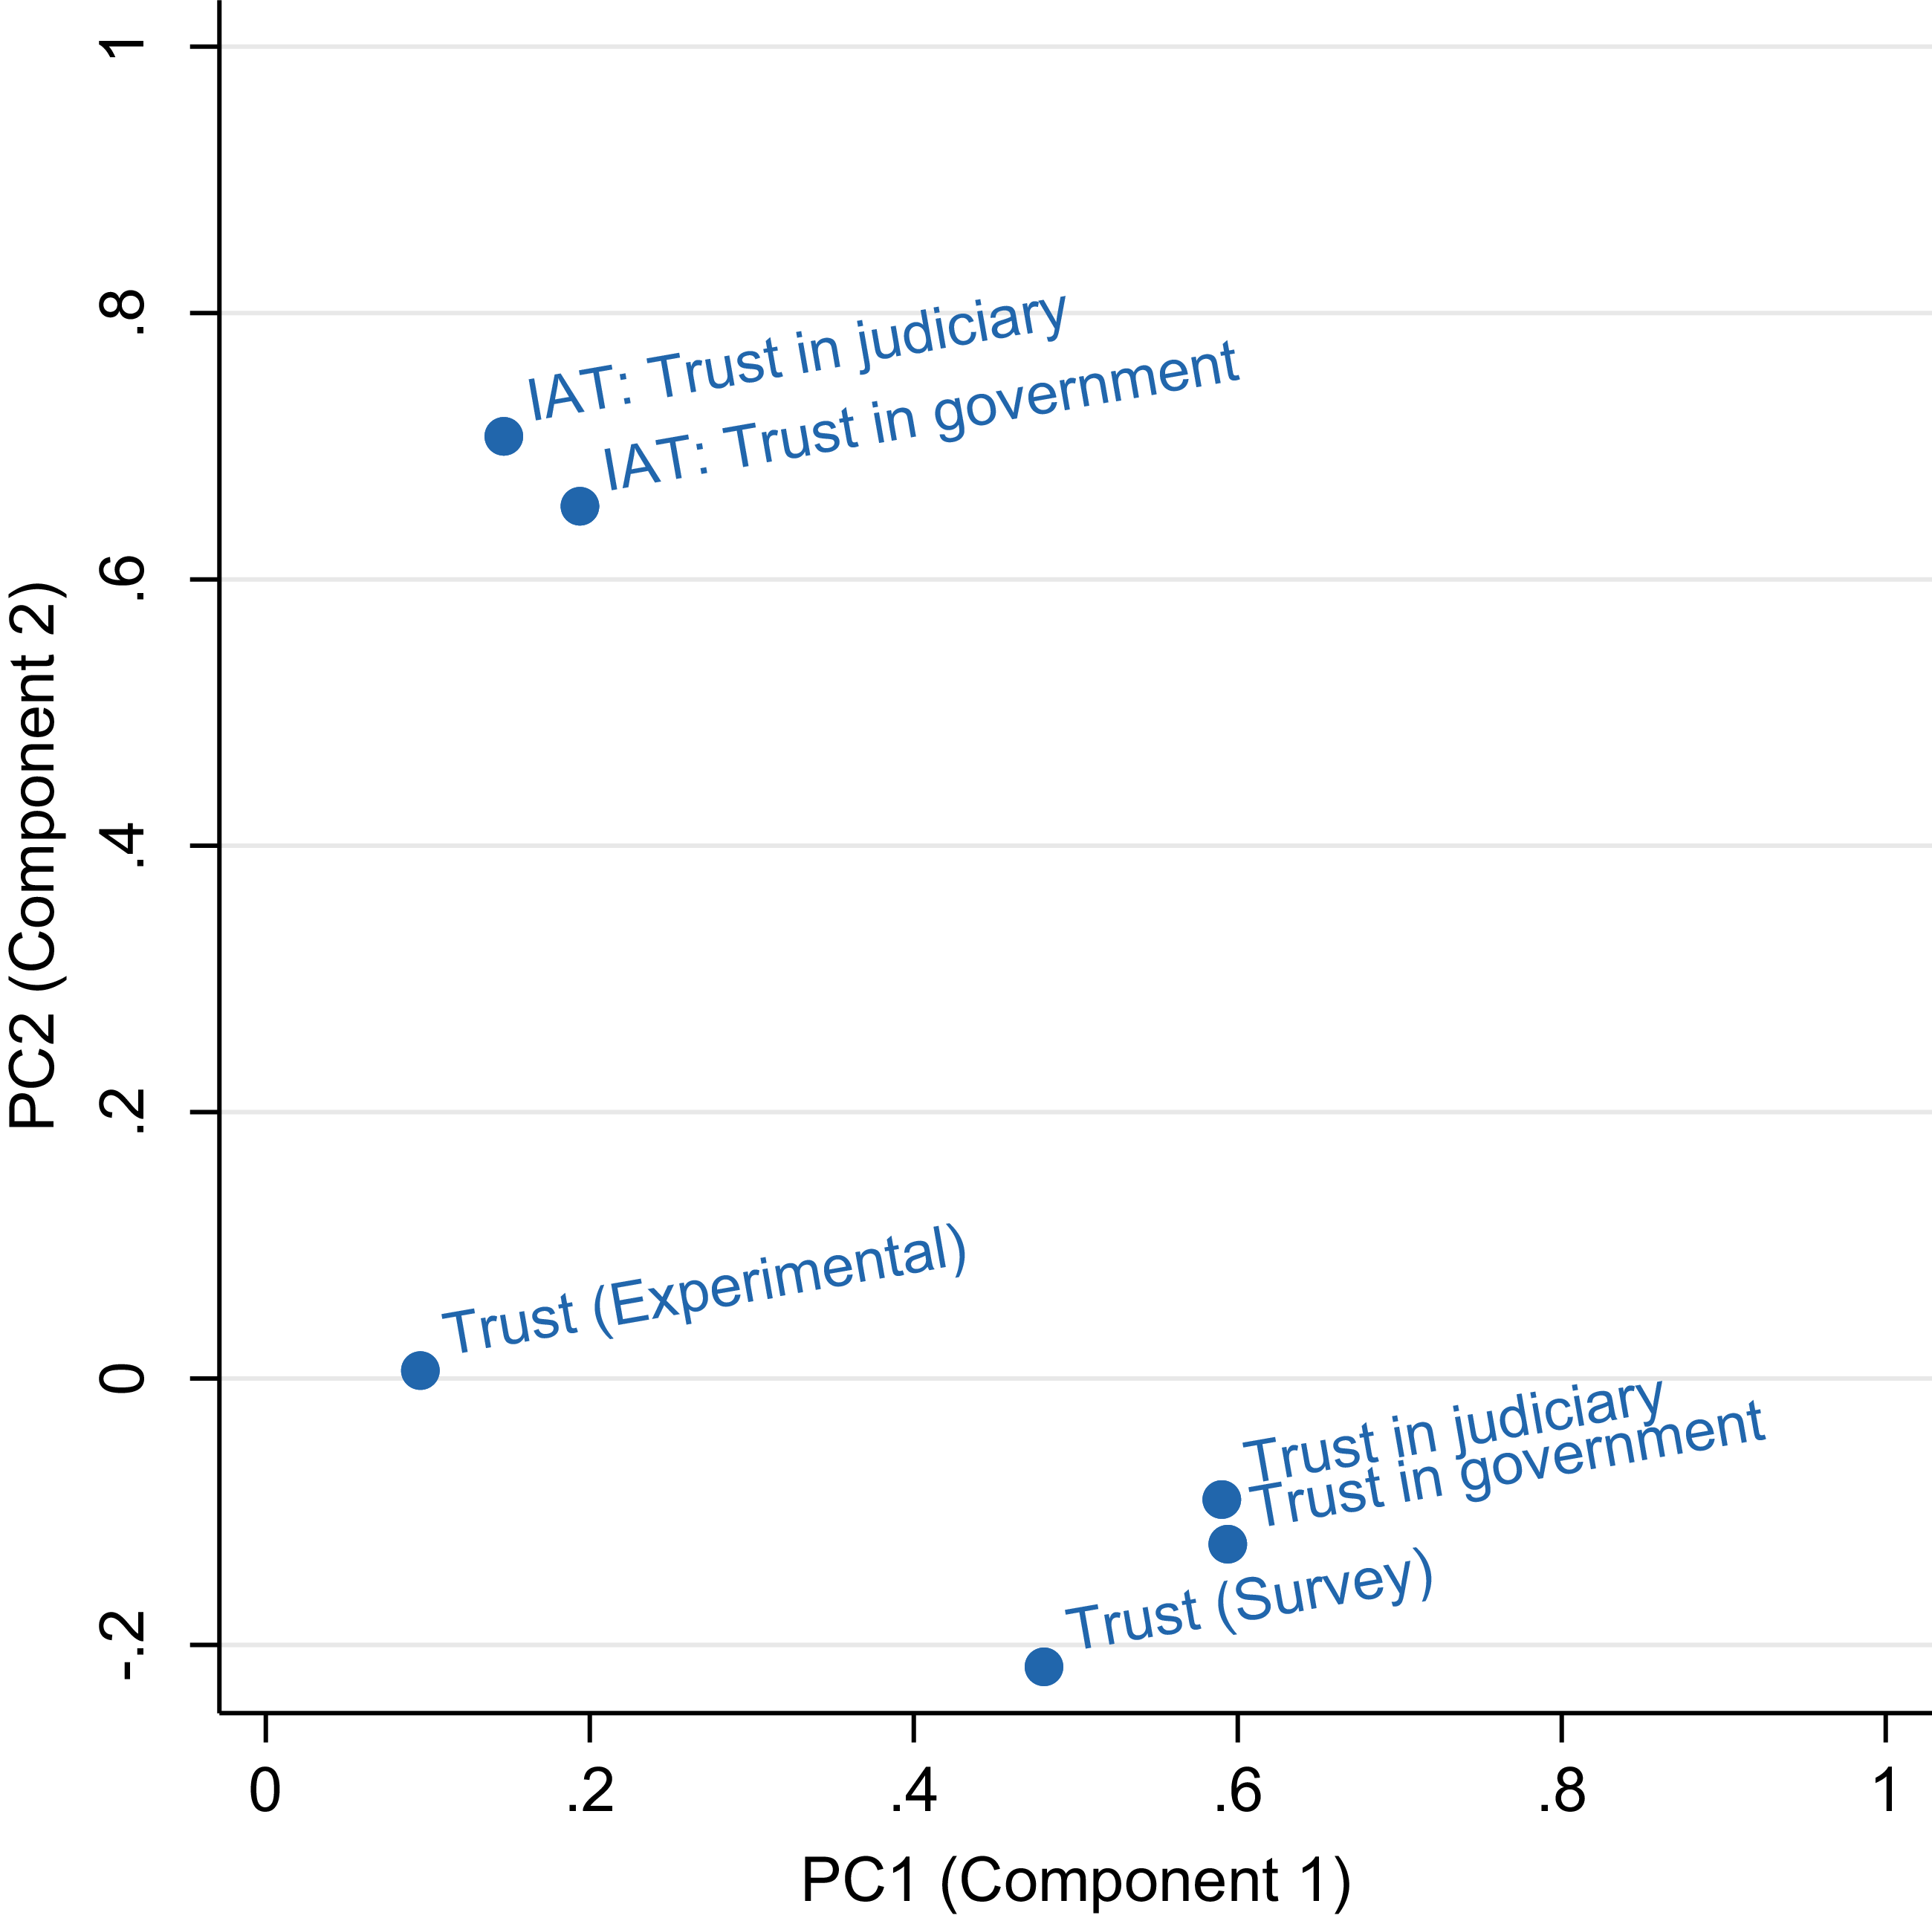
A principal component analysis (PCA) helps uncover the underlying structure of the trust measures used in this study. Figure 3 maps all variables onto the first two principal components and reveals that trust measures cluster more by methodology – self-reported, implicit, or experimental – than by trust domain (eg institutional vs. interpersonal). This suggests that the mode of measurement is a key source of variation, raising concerns about potential ‘method effects’ in cross-study comparisons (Gershtenson and Plane Reference Gershtenson and Plane2007).
PCA of all trust measures by measurement type.
Notes: The plot shows the loading of each trust measure on the first two principal components.

Yet this methodological pattern likely reflects more than a measurement artifact. Implicit and behavioral tools are designed to capture intuitive, automatic forms of trust that operate below conscious awareness. Their proximity in the PCA implies they tap into a shared ‘gut-level’ trust that is distinct from the deliberative judgments elicited by self-reports. Importantly, this divergence appears domain-specific: for concepts like partisanship, implicit and explicit measures often align closely (Theodoridis Reference Theodoridis2017). That this is not the case for trust in our data supports the idea that people may hold dual attitudes – one conscious, the other automatic – when evaluating institutions (Intawan and Nicholson Reference Intawan and Nicholson2018).
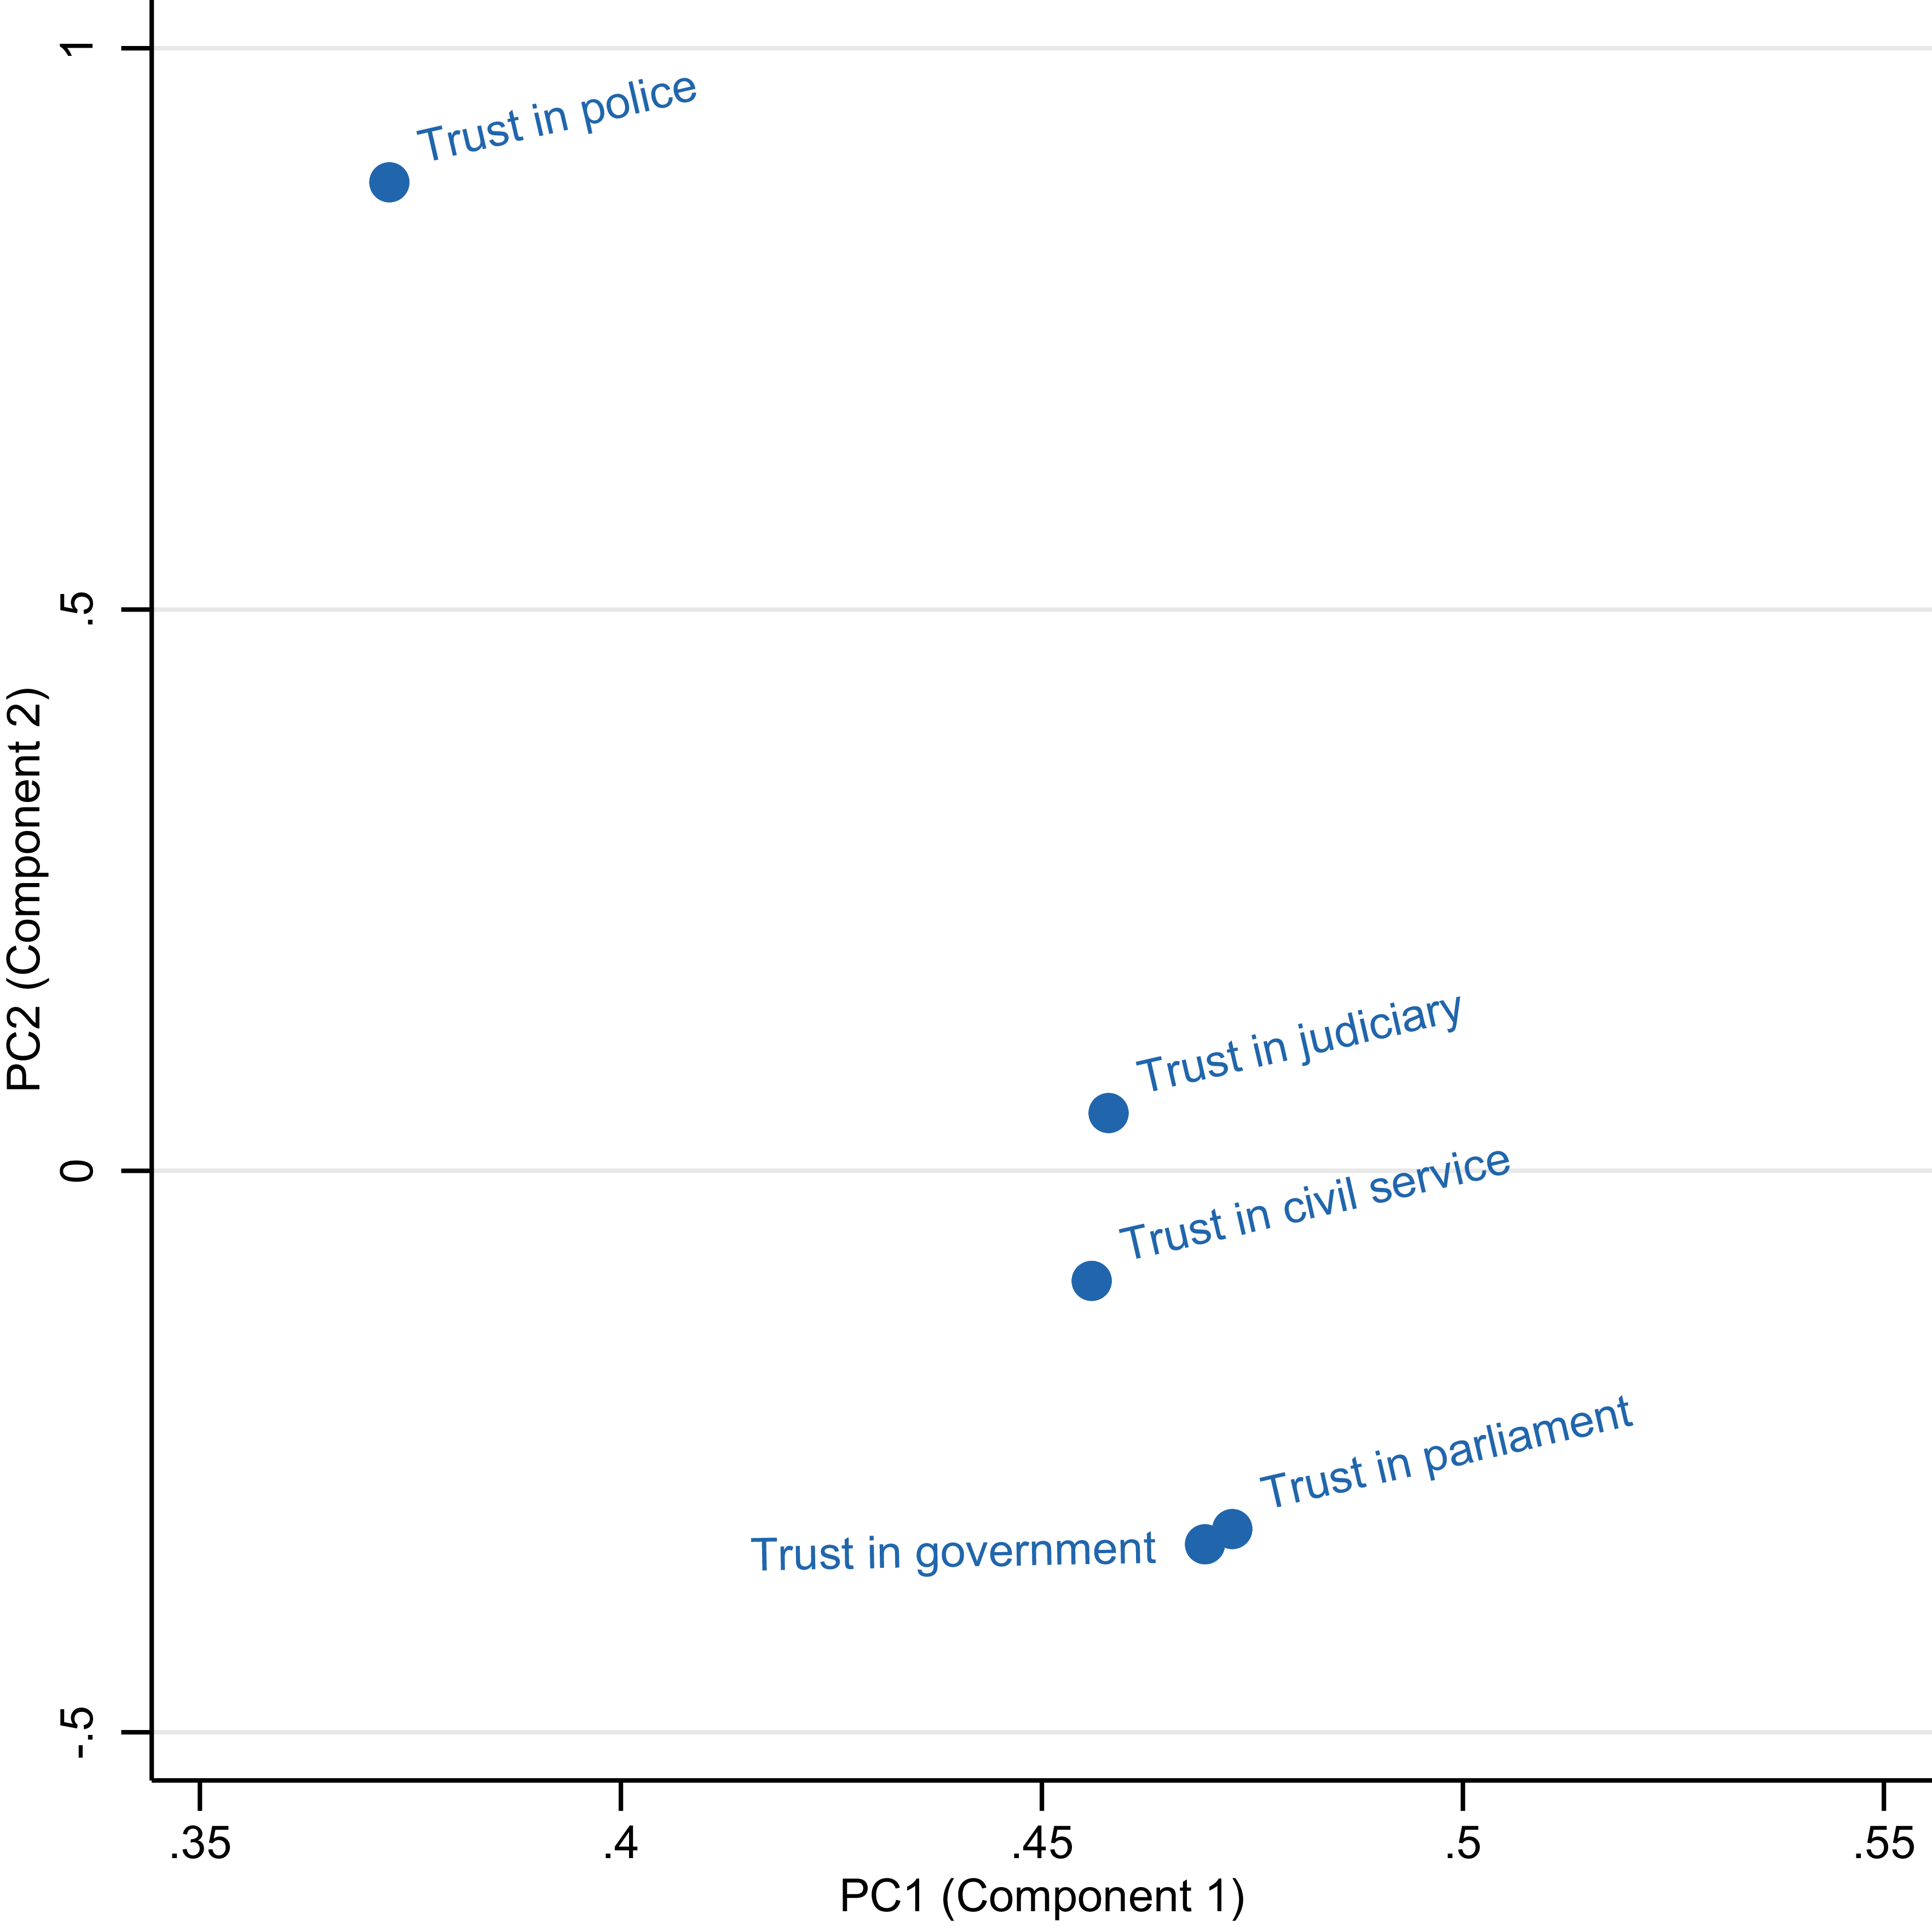
Focusing on self-reported measures of institutional trust, Figure 4 reveals three distinct clusters. Trust in political bodies – government and parliament – forms one group; trust in core administrative and legal institutions – the judicial system and civil servants – forms a second. Trust in the police stands apart, suggesting it is perceived as functionally and symbolically distinct from both political and bureaucratic branches of the state. This clustering aligns with classic theories of diffuse versus specific support (Citrin Reference Citrin1974; Miller Reference Miller1974). According to these, trust in ‘deep’ institutions such as the judiciary and the police – those perceived as foundational and enduring – tends to reflect broader regime legitimacy. By contrast, trust in government and the parliament is more contingent, shaped by evaluations of incumbent performance. These distinctions foreshadow our regression-based results in the next section, where perceived governance quality emerges as a key driver of institutional trust.
PCA of self-reported institutional trust measures.
Notes: The plot shows the loading of each self-reported institutional trust measure on the first two principal components.

Key explanatory factors of institutional trust
We analyze the determinants of trust using a multivariate framework with 40 individual-level variables. To handle missing data, we use multiple imputation for respondents with five or fewer missing values, excluding approximately 5% of the sample (see Online Appendix Table A3). All regressions use heteroskedasticity robust standard errors, and all explanatory variables are standardized to allow for comparison of effect sizes.
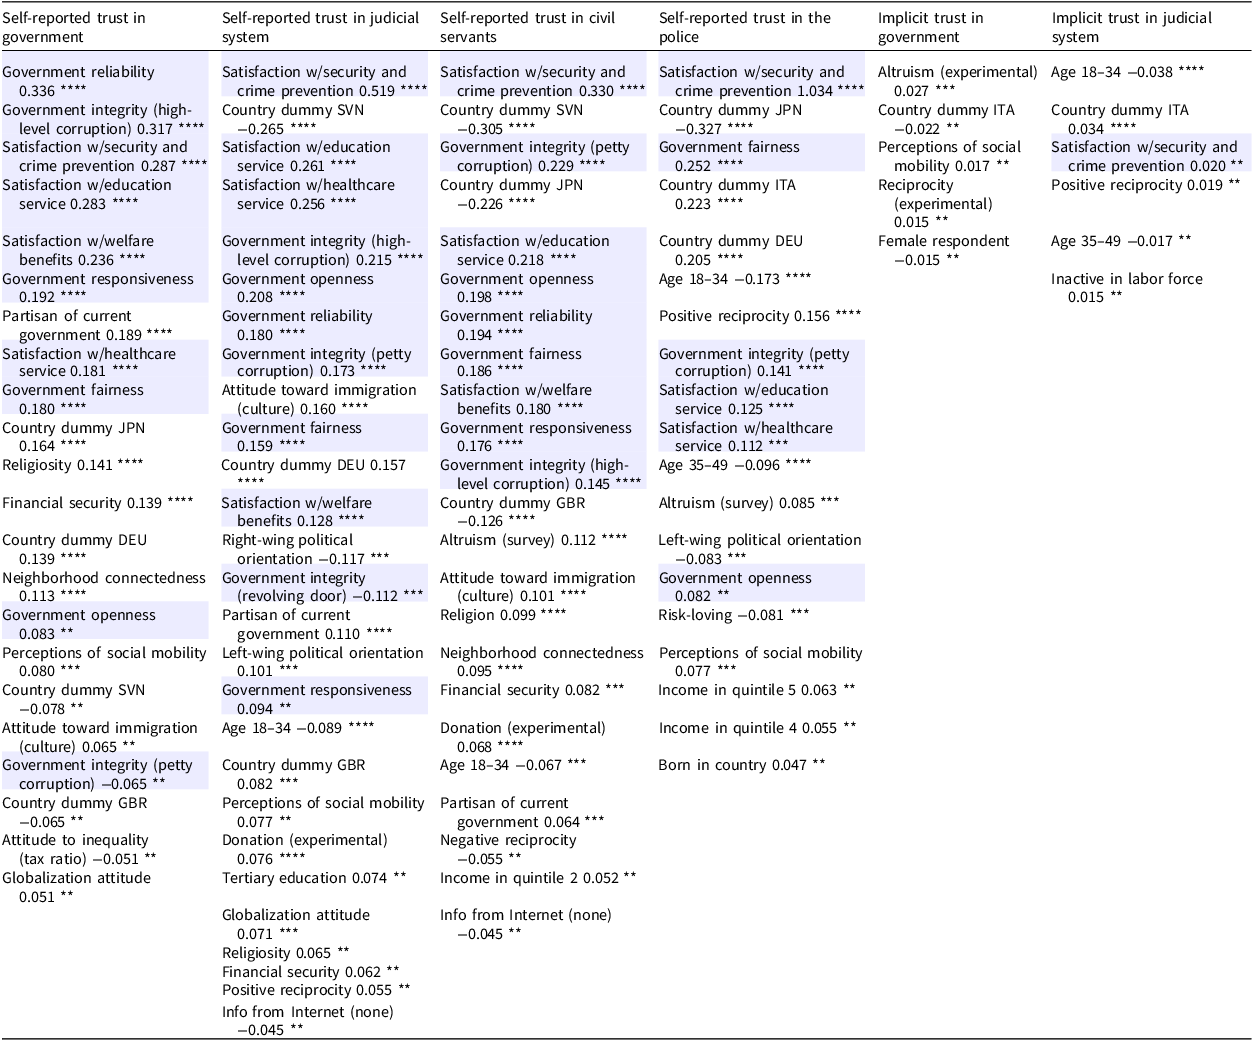
Table 1 reports the correlates of trust in different institutions, focusing on results significant at the 5% level or higher. Perceptions of government quality are the strongest predictors of self-reported institutional trust. For trust in government, perceived government reliability is the most important factor ( $\beta = 0.336$
,
$\beta = 0.336$
, $p{\rm{ }} \lt 0.001$
), followed by integrity of high-level officials (
$p{\rm{ }} \lt 0.001$
), followed by integrity of high-level officials ( $\beta = 0.317$
,
$\beta = 0.317$
, $p{\rm{ }} \lt 0.001$
) and satisfaction with public services, notably security (
$p{\rm{ }} \lt 0.001$
) and satisfaction with public services, notably security ( $\beta = 0.287$
,
$\beta = 0.287$
, $p{\rm{ }} \lt 0.001$
) and education (
$p{\rm{ }} \lt 0.001$
) and education ( $\beta = 0.283$
,
$\beta = 0.283$
, $p{\rm{ }} \lt 0.001$
). For trust in the judicial system, satisfaction with security services is the dominant correlate (
$p{\rm{ }} \lt 0.001$
). For trust in the judicial system, satisfaction with security services is the dominant correlate ( $\beta = 0.519$
,
$\beta = 0.519$
, $p{\rm{ }} \lt 0.001$
), followed by satisfaction with education (
$p{\rm{ }} \lt 0.001$
), followed by satisfaction with education ( $\beta = 0.261$
,
$\beta = 0.261$
, $p{\rm{ }} \lt 0.001$
) and healthcare (
$p{\rm{ }} \lt 0.001$
) and healthcare ( $\beta = 0.256$
,
$\beta = 0.256$
, $p{\rm{ }} \lt 0.001$
). Similarly, trust in civil servants is most strongly associated with satisfaction with security (
$p{\rm{ }} \lt 0.001$
). Similarly, trust in civil servants is most strongly associated with satisfaction with security ( $\beta = 0.330$
,
$\beta = 0.330$
, $p{\rm{ }} \lt 0.001$
) and perceived integrity of government employees (
$p{\rm{ }} \lt 0.001$
) and perceived integrity of government employees ( $\beta = 0.229$
,
$\beta = 0.229$
, $p{\rm{ }} \lt 0.001$
). Unsurprisingly, trust in the police is overwhelmingly determined by satisfaction with security and crime prevention services (
$p{\rm{ }} \lt 0.001$
). Unsurprisingly, trust in the police is overwhelmingly determined by satisfaction with security and crime prevention services ( $\beta = 1.034$
,
$\beta = 1.034$
, $p{\rm{ }} \lt 0.001$
).
$p{\rm{ }} \lt 0.001$
).
The key correlates of trust in various institutions

Notes: This table reports OLS estimates with heteroskedasticity-robust standard errors. Results are based on multiple imputation. The analysis sample retains respondents with five or fewer missing covariate values. Missing covariates are multiply imputed (m = 10) in Stata using mi impute mvn. All independent variables are normalized. Variables are ranked by decreasing order of the coefficient’s absolute value. Variables belonging to the category of perceived governance quality are highlighted in blue. * $p{\rm{ }} \lt 0.10$
; **
$p{\rm{ }} \lt 0.10$
; ** $p{\rm{ }} \lt 0.05$
; ***
$p{\rm{ }} \lt 0.05$
; *** $p{\rm{ }} \lt 0.01$
; ****
$p{\rm{ }} \lt 0.01$
; **** $p \lt 0.001$
.
$p \lt 0.001$
.
In contrast, implicit trust measures do not or only weakly correlate with perceptions of governance. The most significant predictor of implicit trust in government is experimental altruism ( $\beta = 0.027$
,
$\beta = 0.027$
, $p{\rm{ }} \lt 0.01$
), while for implicit trust in the judicial system it is age, with younger individuals showing less trust (
$p{\rm{ }} \lt 0.01$
), while for implicit trust in the judicial system it is age, with younger individuals showing less trust ( $\beta = - 0.038$
,
$\beta = - 0.038$
, $p \lt 0.001$
).
$p \lt 0.001$
).
Table A7 details the results for self-reported trust in government for each country. Measures of perceived government quality are consistently the most important factors, though their relative importance varies. Perceived government reliability ranks first in Italy ( $\beta = 0.435$
,
$\beta = 0.435$
, $p \lt 0.001$
) and the United Kingdom (
$p \lt 0.001$
) and the United Kingdom ( $\beta = 0.383$
,
$\beta = 0.383$
, $p \lt 0.001$
) and is also significant in Germany (
$p \lt 0.001$
) and is also significant in Germany ( $\beta = 0.238$
,
$\beta = 0.238$
, $p = 0.007$
), Japan (
$p = 0.007$
), Japan ( $\beta = 0.292$
,
$\beta = 0.292$
, $p \lt 0.001$
), and Slovenia (
$p \lt 0.001$
), and Slovenia ( $\beta = 0.196$
,
$\beta = 0.196$
, $p = 0.017$
). High-level integrity is a top-five determinant in Germany, Slovenia, the United Kingdom, and the United States. Satisfaction with security services is the top determinant in Germany (
$p = 0.017$
). High-level integrity is a top-five determinant in Germany, Slovenia, the United Kingdom, and the United States. Satisfaction with security services is the top determinant in Germany ( $\beta = 0.432$
,
$\beta = 0.432$
, $p \lt 0.001$
) and is statistically significant in all countries. Satisfaction with education is the leading factor in Japan (
$p \lt 0.001$
) and is statistically significant in all countries. Satisfaction with education is the leading factor in Japan ( $\beta = 0.362$
,
$\beta = 0.362$
, $p \lt 0.001$
) and the United States (
$p \lt 0.001$
) and the United States ( $\beta = 0.358$
,
$\beta = 0.358$
, $p = 0.001$
) and is significant in Germany (
$p = 0.001$
) and is significant in Germany ( $\beta = 0.225$
,
$\beta = 0.225$
, $p = 0.019$
), Italy (
$p = 0.019$
), Italy ( $\beta = 0.190$
,
$\beta = 0.190$
, $p = 0.016$
), and Slovenia (
$p = 0.016$
), and Slovenia ( $\beta = 0.282$
,
$\beta = 0.282$
, $p \lt 0.001$
), but not in the UK.
$p \lt 0.001$
), but not in the UK.
Our analysis by country reveals 64 coefficients significant at the 5% level or better, presented in Table A7 (Online Appendix). Of these, 37 relate to measures of perceived governance quality. The coefficients for these governance variables are all signed as expected, with two exceptions: satisfaction with public transportation in Slovenia ( $\beta = - 0.293$
,
$\beta = - 0.293$
, $p \lt 0.001$
) and perceived petty corruption in the United States (
$p \lt 0.001$
) and perceived petty corruption in the United States ( $\beta = - 0.220$
,
$\beta = - 0.220$
, $p = 0.023$
). These counterintuitive signs are attributable to collinearity with other, more dominant governance variables in the respective models. We also note that having a political orientation aligned with the incumbent government significantly correlates with higher trust, except in Germany and Slovenia. While perceptions of governance quality are the primary correlates of trust across all countries, some country-specific factors are also important. These include societal attitudes, such as those toward immigration in Germany (
$p = 0.023$
). These counterintuitive signs are attributable to collinearity with other, more dominant governance variables in the respective models. We also note that having a political orientation aligned with the incumbent government significantly correlates with higher trust, except in Germany and Slovenia. While perceptions of governance quality are the primary correlates of trust across all countries, some country-specific factors are also important. These include societal attitudes, such as those toward immigration in Germany ( $\beta = 0.217$
,
$\beta = 0.217$
, $p = 0.002$
) or social mobility in the United Kingdom (
$p = 0.002$
) or social mobility in the United Kingdom ( $\beta = 0.255$
,
$\beta = 0.255$
, $p = 0.002$
), and individual characteristics like religiosity in Japan and the United Kingdom. Interestingly, economic factors are largely not significant, with the notable exceptions of Japan, where financial security and income are key correlates, and Slovenia, where financial security is also a significant predictor (
$p = 0.002$
), and individual characteristics like religiosity in Japan and the United Kingdom. Interestingly, economic factors are largely not significant, with the notable exceptions of Japan, where financial security and income are key correlates, and Slovenia, where financial security is also a significant predictor ( $\beta = 0.130$
,
$\beta = 0.130$
, $p = 0.040$
).
$p = 0.040$
).
In unreported regressions that control for standard covariates, interpersonal trust does not significantly predict trust in any state institution, consistent with institutional and interpersonal trust being distinct (Bahry, Kosolapov, Kozyreva et al. Reference Bahry, Kosolapov, Kozyreva and Wilson2005). This pattern holds across each country sample for self-reported trust in government, suggesting that while generalized trust in others underpins social capital and everyday economic exchanges (Putnam Reference Putnam, Crothers and Lockhart2000), it operates independently from evaluations of formal institutions.
Discussion
Institutional trust spans economics, sociology, political science, public management, and psychology. While trust is widely seen as a complex construct (Christensen and Laegreid Reference Christensen and Laegreid2005; Dalton Reference Dalton2005), most studies examine measures in isolation, overlooking insights from other fields. This paper systematically tests correlates from diverse disciplines, revealing that self-reported trust in government correlates most strongly with perceptions of governance and public service quality, above societal or individual factors.
A long-standing tradition in political science distinguishes between specific support – the conditional approval of incumbent leaders and policies – and the more enduring diffuse support directed at the broader political system or regime itself (Citrin Reference Citrin1974; Easton Reference Easton1965; Miller Reference Miller1974). Specific support is sensitive to short-term developments in the political and economic landscape, responding to factors such as economic growth, political scandals, or military casualties (Hetherington Reference Hetherington1998; OECD 2013). Diffuse support, by contrast, is shaped over the long run through civic education, socialization, and attachment to democratic norms and institutions (Intawan and Nicholson Reference Intawan and Nicholson2018; Levi and Stoker Reference Levi and Stoker2000).
This conceptual distinction is reflected in the measurement literature. Self-reported items, which require conscious deliberation, tend to capture specific support. In contrast, IATs bypass reflective evaluation and tap into more affective, intuitive orientations that align with diffuse support (Greenwald, McGhee and Schwartz Reference Greenwald, McGhee and Schwartz1998; Jost Reference Jost2004). Our empirical findings support this interpretation: implicit trust correlates with stable traits – such as age and childhood socioeconomic background – as well as with prosocial preferences from economic games, yet shows little association with perceived government competence (Table 1). Explicit trust, by contrast, closely follows perceived institutional performance. In short, while citizens revise their stated trust in response to current governance, their implicit trust reflects a deeper, historically rooted orientation.
These results contribute to the broader debate on trust by highlighting a fundamental divergence between its explicit and implicit dimensions. The weak correlation we observe between implicit trust and performance perceptions mirrors prior findings showing a disconnect between IAT outcomes and survey responses (Huang, Intawan and Nicholson Reference Huang, Intawan and Nicholson2023; Intawan and Nicholson Reference Intawan and Nicholson2018). This supports the notion that individuals may be ‘of two minds’, holding deliberative evaluations alongside more automatic, intuitive attitudes (Intawan and Nicholson Reference Intawan and Nicholson2018). For example, research in China shows that while explicit trust responds to performance, a latent baseline of implicit trust persists – likely shaped by long-term socialization or exposure to state narratives (Huang et al. Reference Huang, Intawan and Nicholson2024). This cognitive duality is further illustrated by our PCA, where trust measures cluster by method rather than institutional target (Figure 3).
Hence, this pattern likely reflects more than just a methodological artifact, as it aligns with cognitive distinctions emphasized in dual-process theories of judgment and decision-making. These theories differentiate between System 1, which governs fast, intuitive thinking, and System 2, which underlies slow, deliberative reasoning (Kahneman Reference Kahneman2011; Stanovich and West Reference Stanovich and West2000). Therefore, our results suggest that self-reported trust, which requires conscious reflection, primarily captures System 2 evaluations. In contrast, implicit and behavioral measures appear to access System 1 processes – automatic, gut-level attitudes that arise spontaneously and without conscious awareness (Haidt Reference Haidt2001).
This interpretation is further supported by the significant correlation between our implicit measure of trust in government and altruistic behavior in the dictator game. Both involve minimal deliberation, indicating they may draw on a common intuitive foundation. The convergence of two different non-verbal, non-reflective measures strengthens the view that these tools capture a distinct, automatic layer of trust. Understanding this distinction is particularly crucial in a time of widespread distrust. In the United States, for example, explicit trust in government hovers around 20% (Pew Research Center 2024). Yet, the presence of a latent reservoir of implicit trust suggests that even amid overt skepticism, an underlying affective orientation toward institutions may persist. This implicit trust could serve as a source of institutional resilience, offering a potential foundation for rebuilding confidence when explicit trust collapses (Algan, Guriev, Papaioannou et al. Reference Algan, Guriev, Papaioannou and Passari2017; Intawan and Nicholson Reference Intawan and Nicholson2018; Krastev Reference Krastev2011).
Our findings further suggest that perceived governance quality outweighs political affiliation in explaining institutional trust, though both play important roles. This supports a growing body of research distinguishing between perceptions of ‘government competence’ – the extent to which service delivery meets expectations – and ‘government values,’ such as fairness, integrity, and ethical behavior (Blind Reference Blind2006; Bouckaert Reference Bouckaert2012; Nooteboom Reference Nooteboom2007; Rothstein Reference Rothstein2011; Yang and Holzer Reference Yang and Holzer2006). Recent OECD studies similarly emphasize both dimensions as essential to trust in public institutions (Brezzi, González, Nguyen et al. Reference Brezzi, González, Nguyen and Prats2021; OECD 2021, 2022a, 2022b).
Trustlab results corroborate this framework. Competence-related factors – such as satisfaction with public services, perceived responsiveness (Kampen, Maddens and Vermunt Reference Kampen, Maddens, Vermunt and Salminen2003), and reliability (See Reference See2009) – emerge as key drivers of trust among the considered factors. So do value-based indicators, including perceived integrity (Esaiasson, Gilljam and Persson Reference Esaiasson, Gilljam and Persson2012; Hibbing and Theiss-Morse Reference Hibbing and Theiss-Morse2001; Rothstein Reference Rothstein2013), openness (Kim and Lee Reference Kim and Lee2012; Stiglitz Reference Stiglitz2002; Traber Reference Traber2013), and procedural fairness (Tyler Reference Tyler1987; Tyler, Goff and MacCoun Reference Tyler, Goff and MacCoun2015). Importantly, evaluations of high-level officials’ integrity link trust to incumbent behavior (Bowler and Karp Reference Bowler and Karp2004; Dahlstr¨om and Lapuente Reference Dahlström and Lapuente2017), while perceptions of petty corruption erode trust in the civil service, reflecting the importance of day-to-day bureaucratic interactions (Thomas Reference Thomas1998).
Our study also relates to the work of social scientists interested in better understanding the role of fundamental social preferences such as altruism or cooperation in the formation of trust. A number of studies show that social preferences assessed in the lab translate into real-world outcomes (Algan and Cahuc Reference Algan, Cahuc, Aghion and Durlauf2014; Benz and Meier Reference Benz and Meier2008; Charness and Fehr Reference Charness and Fehr2015; Karlan Reference Karlan2005; Laury and Taylor Reference Laury and Taylor2008; de Oliveira, Croson and Eckel Reference de Oliveira, Croson and Eckel2015), although the evidence is still debated (Campos-Mercade, Meier, Schneider et al. Reference Campos-Mercade, Meier, Schneider and Wengström2021; Galizzi and Navarro-Martinez Reference Galizzi and Navarro-Martinez2019; Levitt and List Reference Levitt and List2007). Unlike self-reported trust in others, experimental trust shows a more consistent and robust association with social preferences, whether measured through survey items or behavioral games (see Table A6, Online Appendix). While the self-reported measure also correlates significantly with experimental indicators of altruism, expected trustworthiness, and survey-based measures of positive reciprocity and risk preferences, the coefficients are generally smaller and less stable.
In a similar vein, this study builds on prior work by Falk, Becker, Dohmen et al. (Reference Falk, Becker, Dohmen, Enke, Huffman and Sunde2018), who developed a global database of socioeconomic preferences, including a measure of self-reported interpersonal trust. In earlier validation work based on an experiment with 409 students from the University of Bonn, this self-reported trust measure was found to correlate with an experimental trust game, lending support to its behavioral relevance. Their studies and ours have five countries in common, namely Germany, Italy, Japan, the United Kingdom, and the United States. In both studies, Japan is the country with the lowest level of self-reported interpersonal trust. We consistently find that among the five countries in common, Germany displays the highest level of average experimental trust in others (see Figure 1).
The analysis remains subject to two main caveats. First, large measurement errors may affect IAT measures of institutional trust, which may explain the low ${R^2}$
in the corresponding regressions (about 4%). Second, our analysis does not identify causal relationships, as no convincing instruments exist for such a large number of explanatory variables.
${R^2}$
in the corresponding regressions (about 4%). Second, our analysis does not identify causal relationships, as no convincing instruments exist for such a large number of explanatory variables.
Nonetheless, by controlling for an unprecedented 40 variables drawn from multiple disciplines – including social preferences, societal attitudes, and individual traits – we mitigate omitted variable bias that plagues narrower studies, yielding associations that are more reliable than simple bivariate correlations (Angrist, Lang and Oreopoulos Reference Angrist, Lang and Oreopoulos2009). This approach echoes prior work in behavioral economics, where extensive controls help isolate key predictors of trust even without randomization, such as the examination of inherited cultural trust across generations by Algan and Cahuc (Reference Algan and Cahuc2010). Endogeneity remains a concern: perceptions of governance quality could be shaped by preexisting trust levels, or both might stem from unobserved factors like historical experiences (Nunn and Wantchekon Reference Nunn and Wantchekon2011). Future research could build on our findings by employing causal methods, such as natural experiments from policy reforms or instrumental variables based on historical shocks, to test whether improving perceived competence and integrity directly boosts trust (Alesina and Giuliano Reference Alesina and Giuliano2015). In this vein, our results provide a foundation for such inquiries, highlighting governance perceptions as prime candidates for intervention. Ultimately, while correlations do not imply causation, the dominance of governance factors in our horse race suggests they warrant priority in efforts to rebuild trust in polarized societies.
Practically, our findings offer a compelling message for policymakers: institutional trust can be bolstered through tangible improvements in public service delivery – especially in domains like education and security, which emerge as the most consistent predictors across countries (OECD 2017a). This is particularly salient against the backdrop of rising populism and political polarization (Algan, Guriev, Papaioannou et al. Reference Algan, Guriev, Papaioannou and Passari2017; Guriev and Papaioannou Reference Guriev and Papaioannou2022; Inglehart and Norris Reference Inglehart and Norris2016). As shown in the Online Appendix (Table A6), extreme-left and extreme-right political orientations are strongly associated with attitudes toward immigration, perceptions of government fairness, and, to a lesser extent, religiosity – albeit with coefficients pointing in opposite directions. Immigration, in particular, stands out as a deeply polarizing issue that fuels both sides of the spectrum. By contrast, these extreme views are only weakly linked to perceptions of governance quality, which explain less than 10% of their variance.
This divergence underscores an important distinction: while trust in government is primarily driven by perceived competence and integrity, political radicalization is rooted in broader societal attitudes – factors that are far less amenable to short-term policy interventions. Crucially, we also find that institutional and interpersonal trust are largely uncorrelated once a broad set of controls is included. This decoupling implies that strong community-level cooperation, often grounded in inherited cultural norms, does not automatically translate into trust in the state (Alesina and Giuliano Reference Alesina and Giuliano2015; Algan and Cahuc Reference Algan and Cahuc2010). From a policy perspective, this is encouraging. It suggests that institutional trust is not hardwired into culture: it can be rebuilt through concrete improvements in public sector performance.
This is particularly relevant in low-trust contexts, where targeted reforms may yield outsized returns in legitimacy and economic outcomes (Nunn and Wantchekon Reference Nunn and Wantchekon2011). Such reforms should be tailored to local deficits. In Italy and Slovenia, where perceptions of elite corruption strongly predict distrust, anti-corruption audits and transparency initiatives may be most effective (Rothstein Reference Rothstein2011). In the United States, enhancing perceived procedural fairness in the judiciary through public consultation may help restore confidence. In Japan, improving welfare reliability may resonate with cultural priorities around social harmony (Algan, Guriev, Papaioannou et al. Reference Algan, Guriev, Papaioannou and Passari2017). These differentiated, performance-based strategies – if causally validated – offer a pragmatic roadmap to reverse trust erosion without waiting for slow-moving cultural change.
Supplementary material
The supplementary material for this article can be found at https://doi.org/10.1017/S1475676526100875.
Data availability statement
The Trustlab database and all replication codes are available from the authors upon request for replication of the results or for research purposes.
Competing interests
The author(s) declare none.
Preregistration
This research has not been preregistered in an independent institutional registry.
Declaration of generative AI and AI-assisted technologies in the writing process
During the preparation of this work, the authors used OpenAI’s ChatGPT and Google’s Gemini to assist with language editing and the construction of LaTeX tables. The authors subsequently reviewed and edited all content as necessary and take full responsibility for the published article.




 Open access

