




Introduction
Crop production in smallholder farming systems in sub-Saharan Africa (SSA) is mainly rainfed (Rege and Sones, Reference Rege, Sones, Rege and Sones2022). With increasing impacts from climate change, manifesting as increased intensity of droughts, and greater temperatures and rainfall variability (Engelbrecht et al., Reference Engelbrecht, Steinkopf, Padavatan, Midgley, von Maltitz, Midgley, Vietch, Brummer, Rotter and talt2024; Unganai et al., Reference Unganai, Troni, Manatsa and Mukarakate2013), most smallholder farmers in Southern Africa experience unpredictable and low crop yields, leading to severe food and feed insecurity (Bjornlund et al., Reference Bjornlund, Bjornlund and Van Rooyen2020).
In Zimbabwe, where agriculture constitutes the main basis of livelihoods and income (Mujeyi et al., Reference Mujeyi, Mudhara and Mutenje2021), at least 70% of the smallholder farmers rely on rainfed crop production for food security (Mamombe et al., Reference Mamombe, Kim and Choi2017). Mixed crop-livestock farming dominates these smallholder systems (Baudron et al., Reference Baudron, Tui, Silva, Chakoma, Matangi, Nyagumbo and Dube2024). However, crop productivity is challenged by land degradation, water stress, inherently poor soil fertility, and low use of fertilisers (Baion et al., Reference Baion, Yunxia, Foday, Jianmin, Chuanfu and Agyeman2023; Kwenda et al., Reference Kwenda, Falconnier, Cardinael, Affholder, Couëdel, Baudron, Franke, Nyagumbo, Mabasa, de Freitas, Pret, Diop, Mutsamba-Magwaza and Chikowo2025; Sanchez, Reference Sanchez2002; Zingore et al., Reference Zingore, Tittonell, Corbeels, van Wijk and Giller2011). Currently, the national mean yield of the staple crop, maize (Zea mays), is around 0.8 t/ha (ZimVAC, 2024) against a potential of 12 t/ha (Mukaro et al., Reference Mukaro, Chaingeni, Sneller, Cairns, Musundire, Prasanna, Mavankeni, Das, Mulanya and Chivasa2024). Simultaneously, livestock production is hindered by insufficient and poor-quality feeds, unreliable clean water sources (Descheemaeker et al., Reference Descheemaeker, Zijlstra, Masikati, Crespo and Tui2018; Matope et al., Reference Matope, Zindove, Dhliwayo and Chimonyo2020; Mutsamba-Magwaza et al., Reference Mutsamba-Magwaza, Nyandoro, Makiwa, Kapembeza and Chakoma2022), and dwindling grazing lands due to expanding arable lands (Tirivanhu and Chimuka, Reference Tirivanhu and Chimuka2024).
Sustainable intensification options are required to avoid expanding arable areas at the cost of grazing and natural lands (Giller et al., Reference Giller, Delaune, Silva, van Wijk, Hammond, Descheemaeker, van de Ven, Schut, Taulya, Chikowo and Andersson2021; Li et al., Reference Li, Hoffland, Kuyper, Yu, Li, Zhang, Zhang and van der Werf2020). One such option is intercropping, which involves growing two or more crops together on the same piece of land during the same cropping season (Pretty, Reference Pretty2011). Intercropping cereals and legumes (both grain and forage) has the potential to increase systems’ total biomass output through mechanisms such as weed suppression, pest and disease reduction (Kutamahufa et al., Reference Kutamahufa, Matare, Soropa, Mashavakure, Svotwa and Mashingaidze2022; Mugi, Reference Mugi2022), nitrogen fixation, and improved hydraulic conductivity, especially in short- and long-rooted crop species combinations (Chimonyo et al., Reference Chimonyo, Modi and Mabhaudhi2016a; Dabney et al., Reference Dabney, Delgado and Reeves2001; Franke et al., Reference Franke, van den Brand, Vanlauwe and Giller2018). Intercropping also offers several environmental benefits, including reducing raindrop impact, soil erosion, and runoff (Rao et al., Reference Rao, Xiao, Ouyang and Yu2015; Schultze-Kraft et al., Reference Schultze-Kraft, Rao, Peters, Clements, Bai and Liu2018). Maize-legume intercropping systems may also reduce soil moisture loss from the soil surface by providing shade as live mulch, reducing wind speed, and improving infiltration and soil structure (Maitra et al., Reference Maitra, Shankar, Banerjee and Hossain2020; Mbanyele et al., Reference Mbanyele, Mtambanengwe, Nezomba, Groot and Mapfumo2021; Mobasser et al., Reference Mobasser, Vazirimehr and Rigi2014; Namatsheve et al., Reference Namatsheve, Cardinael, Corbeels and Chikowo2020).
Grain legumes such as cowpea (Vigna unguiculata (L.) Walp.) also provide dietary proteins, especially crucial for rural people with limited access to animal-based protein sources (Nyamayevu et al., Reference Nyamayevu, Nyagumbo, Liang, Li and Silva2024; Snapp et al., Reference Snapp, Cox and Peter2019; ZimVAC, 2024). Farmers also intercrop grain legumes to improve household income and food security (Rusinamhodzi et al., Reference Rusinamhodzi, Corbeels, Nyamangara and Giller2012). Additionally, forage legumes such as cowpea and mucuna (Mucuna pruriens var. Utilis) produce high-quality forage, with approximately 14% crude protein (CP) in stover and up to 27.7% CP in mucuna grain compared to 3.9% in maize stover (Feedipedia, 2022). However, CP improvements in intercrop mixtures depend on the species and proportion of the legume contributing to total biomass, with higher legume inclusion generally increasing forage protein concentration (Dahmardeh et al., Reference Dahmardeh, Ghanbari, Syasar and Ramroudi2009; Javanmard et al., Reference Javanmard, Nasab, Javanshir, Moghaddam and Janmohammadi2009). For instance, Baghdadi et al. (Reference Baghdadi, Halim, Ghasemzadeh, Ebrahimi, Othman and Yusof2016) reported CP concentrations of 12.75%, 13.7%, and 14.8% for maize–soybean mixtures 75:25, 50:50, and 25:75, respectively, compared with 10.83% for sole maize. Similarly, Strydhorst et al. (Reference Strydhorst, King, Lopetinsky and Harker2008) found 27–64% higher protein yields in mixtures of legume–barley intercrops than in sole barley.
Conversely, intercropping typically reduces the yields of component crops due to competition for resources such as light, nutrients, and water (Correia et al., Reference Correia, Pereira, De Almeida, Williams, Freach, Nesbitt and Erskine2014; Fu et al., Reference Fu, Chen, Zhang, Du, Zheng, Yang, Luo, Lin, Li and Pu2023). The rooting depths and growth patterns of component crops determine the outcome of the competition for water and nutrients (Adam et al., Reference Adam, Giller, Rusinamhodzi, Rasche, Koomson, Marohn and Cadisch2025; Bekele et al., Reference Bekele, Ademe, Gemi and Habtemariam2021; Mugi-Ngenga et al., Reference Mugi-Ngenga, Bastiaans, Anten, Zingore and Giller2022). For example, component crops with similar grain-filling stages tend to increase competition for nutrients and water at critical growth stages (Trail et al., Reference Trail, Abaye, Thomason, Thompson, Gueye, Diedhiou, Diatta and Faye2016). Overall, intercropping benefits emerge when interspecific competition is weaker than intraspecific competition (Ebbisa, Reference Ebbisa2022).
Livestock in Zimbabwe strongly depend on crop residues during the dry season (Descheemaeker et al., Reference Descheemaeker, Zijlstra, Masikati, Crespo and Tui2018), and intercropping can potentially increase residue outputs. Integrating cereals and legumes, including forage legumes, into farming systems can improve feed quality and quantities (Ates et al., Reference Ates, Cicek, Bell, Norman, Mayberry, Kassam, Hannaway and Louhaichi2018; Mkuhlani et al., Reference Mkuhlani, Mupangwa, Macleod, Gwiriri, Nyagumbo, Manyawu and Chigede2020; Mutsamba et al., Reference Mutsamba, Nyagumbo and Mupangwa2019). Some smallholder farmers in Zimbabwe already use on-farm forage-based rations using forage cowpeas, mucuna, and lablab as dry season supplements (Chakoma et al., Reference Chakoma, Manyawu, Gwiriri, Moyo, Dube, Imbayarwo-Chikosi, Halimani, Chakoma, Maasdorp and Buwu2016; Gwiriri et al., Reference Gwiriri, Manyawu, Mashanda, Chakoma, Moyo, Chakoma, Sethaunyane, Imbayarwo-Chikosi, Dube and Maasdorp2016).
Given the potential benefits of intercropping in increasing crop and livestock productivity among smallholder farmers of Zimbabwe, it is important to understand the mechanisms that affect the relative performance of intercropping systems. Since smallholder crop production is largely rain-fed, soil moisture dynamics across different rainfall regimes are crucial to determine whether interspecific competition is weaker than intraspecific competition for intercropping benefits to manifest. In Zimbabwe, most previous studies on soil moisture dynamics have focused on sole cropping systems (Mhizha and Ndiritu, Reference Mhizha and Ndiritu2013; Mupangwa et al., Reference Mupangwa, Love and Twomlow2006; Ncube, Reference Ncube2007; Nyagumbo et al., Reference Nyagumbo, Nyamadzawo and Madembo2019). The few published studies in Zimbabwe and beyond on soil moisture trends in intercropping systems did not measure soil moisture beyond 45 cm depth (Bekele et al., Reference Bekele, Ademe, Gemi and Habtemariam2021; Mbanyele et al., Reference Mbanyele, Mtambanengwe, Nezomba, Groot and Mapfumo2021; Yun et al., Reference Yun, Bi, Gao, Zhu, Ma, Cui and Wilcox2012).
This study, thus, sought to determine the impact of seasonal rainfall amount on the performance of intercropping systems by addressing the following objectives:
-
i. Determine the grain and forage yield of maize-cowpea and maize-mucuna intercropping systems, relative to sole cropping systems, under on-farm conditions across seasons.
-
ii. Determine the seasonal rainfall amount for which intercropping systems produce sufficient maize grain to meet a household’s annual food needs and provide adequate livestock feed for the dry season (July to December), relative to sole cropping systems.
-
iii. Assess how intercropping influences soil moisture use at different soil depths throughout the growing season.
Materials and methods
Site description
The research was conducted in Mutoko District, situated in the Mashonaland East Province of Zimbabwe, during the 2021/22 and 2022/23 growing seasons. The study was implemented on five farms/sites situated between latitudes 17.1944°S and 17.3233°S and longitudes 32.3142°E and 32.3822°E. (Figure 1). The research was conducted in the agroecological zone (AEZ) IV section of Mutoko District, an area recommended for extensive livestock production and the cultivation of drought-resistant crops such as small grains and short-season maize varieties. In AEZ IV, mean annual rainfall ranges from 450 to 650 mm, with maximum temperatures ranging from 27–29°C (Manatsa et al., Reference Manatsa, Mushore, Gwitira, Wuta, Chemura, Shekede, Mugandani, Sakala, Ali and Masukwedza2020). The rain-fed cropping season spans from November to March, followed by a 7-month dry period. The dominant soil types in Mutoko are fersiallitic coarse-textured sandy soils derived from granite, which generally have low fertility. According to the FAO classification, these soils are classified as Ferralic Arenosol, characterised by low water holding capacity due to their low clay content (Nyamapfene, Reference Nyamapfene1991). The trials were established on pale brown, medium-grained sandy soils with pH (CaCl2) values ranging from 4.3 to 5.2 (Table 1). The soils across the study sites were relatively fertile, with a mean C concentration of 1.1% and available P of 24 mg/kg (Table 1). All trial fields were located within 100 m of the homesteads and probably received regular organic input applications.
Map of Zimbabwe showing the project site and agroecological zones (AEZs) (A) and map of Mutoko District showing the distribution of experimental sites in Ward 4 (W4) and Ward 16 (W16) (B). Numbers 1 to 5 in Figure 1B correspond to Farm 1 to Farm 5, respectively.

Figure 1. Long description
The map of Zimbabwe is divided into various agroecological zones, each represented by different colors. The zones are labeled as AEZ I to AEZ V. An arrow points to a detailed map of Mutoko District, highlighting the distribution of experimental sites in Ward 4 and Ward 16. The experimental sites are marked with numbers 1 to 5, indicating the locations of Farm 1 to Farm 5 respectively. The map provides a visual representation of the agricultural and ecological landscape of Zimbabwe, focusing on the specific project sites within Mutoko District.
Soil characteristics at 0–20 cm depth at the start of the experiment in October 2021, in Mutoko

Table 1. Long description
The table presents soil characteristics at five farms in Mutoko, Zimbabwe, measured at a depth of 0-20 centimeters in October 2021. It includes data on the percentage of carbon, pH levels measured with calcium chloride, nitrogen content in parts per million, available phosphorus in parts per million, and exchangeable cations such as potassium, calcium, and magnesium in milliequivalents per 100 grams. The table has six columns: Site, Percentage of Carbon, pH (CaCl2), Nitrogen (ppm), Available Phosphorus (ppm), Exchangeable Potassium (meq/100 g), Exchangeable Calcium (meq/100 g), and Exchangeable Magnesium (meq/100 g). It contains five rows of data corresponding to five different farms. Notable trends include varying levels of soil fertility and pH across the sites, with Farm 1 having the highest percentage of carbon at 0.91 percent and the lowest pH at 4.3.
Nmin refers to mineral N.
Site selection and experimental design
Five farms were selected by researchers with the assistance of government extension officers based on accessibility and the farmers’ capacity to host and manage on-farm trials. All sites had maize the previous season and had a slope estimated at 4% or less. Each farm served as a replicate with one block. Fields were situated about 100 m away from the homestead. A Randomised Complete Block Design was employed, with five treatments assigned to each plot. Each plot, measuring 6 m × 5 m, received the same treatment in both seasons.
Agronomic practices
The crops tested included a drought-tolerant maize variety (SC419), mucuna, and a landrace cowpea locally known as ‘Nyadawa’, suitable for grain and fodder due to high forage production. The cropping systems were:
-
1. Sole maize
-
2. Sole cowpea
-
3. Sole mucuna
-
4. Maize-mucuna intercropping
-
5. Maize-cowpea intercropping
Maize and mucuna were planted at an average depth of 5 cm in basins spaced at 90 cm between rows and 60 cm within rows, while sole cowpea was planted at 4–5 cm depth in basins at a spacing of 45 cm between rows and 30 cm within rows. Planting basins are recommended in semi-arid regions (receiving less than 600 mm seasonal rainfall) as they harvest rainfall and conserve soil moisture. Maize and sole legumes were planted from 28 November and from 14 November during the 2021/22 and 2022/23 seasons, respectively. Depending on rainfall availability, the legume intercrops were relay planted 2–4 weeks after maize to reduce competition with maize (Masvaya et al., Reference Masvaya, Nyamangara, Descheemaeker and Giller2017). At planting, three or four seeds were dropped at each planting station and thinned down to two after crop emergence. For maize and mucuna, each station had two plants, resulting in a plant population density of 37,037 plants per hectare. Similarly, sole cowpea had two plants per station, resulting in a plant population density of 148,148 plants per hectare. Intercropped mucuna and cowpea were planted between the maize rows using hand hoes at 37,037 and 74,047 plants per hectare. Maize and mucuna seeds were obtained from local seed houses, namely Seed Co and Klein Karoo, respectively.
Recommended fertiliser application rates were applied. Compound D fertilizer (7N:14P2O5:7K2O) was applied at a rate of 200 kg per hectare, providing 14 kg of nitrogen (N), 12.2 kg of phosphorus (P), and 11.6 kg of potassium (K) per hectare at planting in all treatments. Ammonium nitrate (34.5% N) was applied as a topdress to both sole and intercropped maize plots (rows) at a rate of 69 kg N per hectare. Overall, a total of 83 kg N, 12.2 kg P, and 11.6 kg K were applied per ha annually, except for plots with sole legumes, which received Compound D only. Weeding was performed using a hand hoe to control weeds before they exceeded 10 cm in height.
Data collection
Rainfall and soil moisture content
Daily rainfall was recorded using rain gauges installed at each farm. For data analysis, farms/sites were categorised into rainfall regimes based on seasonal rainfall amount (since rainfall distribution was similar across farms (Supplementary Material-SM Figure 1)) during the cropping season. Sites (farm x season combination) were classified as representative for dry, average, and wet seasons when seasonal rainfall was below 450 mm, ranged between 450–600 mm (normal range in NR IV), and above 600 mm, respectively.
For soil moisture determination, polyvinyl chloride access tubes were installed in the soil up to 180 cm depth in each plot, on each farm. Volumetric soil moisture content was measured using a Prime-PicoT3/IPH44 probe at 10 cm intervals down the soil profile. These measurements were taken every two weeks, starting two weeks after planting the intercrop legumes and continuing until crops were harvested or reached physiological maturity. The growth stages of the tested crops, whenever sampling was done, are reported in SM Table 1. The soil moisture content for different soil depths was aggregated for 0–60, 60–120, and 120–180 cm depths per plot and sampling date.
Soil analysis
At the start of the trials, soil samples were collected from six random positions per field from the top 20 cm of the soil profile using an auger, following a zig-zag sampling pattern. The six sub-samples were thoroughly mixed to form a composite sample. These soil samples were tested for pH (CaCl2) using a pH metre, total nitrogen (%N) by the Kjeldahl method, soil organic carbon by the modified Walkley-Black method (Bahadori and Tofighi, Reference Bahadori and Tofighi2016), available P quantified with Resin-extractable P (Almeida et al., Reference Almeida, Penn and Rosolem2018; Lajtha et al., Reference Lajtha, Driscoll, Jarell, Elliot, Robertson, Coleman, Bledsoe and Sollins1999), and K using flame emission spectroscopy (Ziadi and Tran, Reference Ziadi and Tran2007). Soil texture and total exchangeable bases were also analysed as outlined in Okalebo et al. (Reference Okalebo, Gathua and Woomer2002).
Yield and systems’ productivity
Grain and biomass yield determination
Crop yields were measured at physiological maturity from net plots of two rows, four metres long, except for sole cowpea, which was harvested from net plots of four rows. Sole cowpea was planted at 45 cm row spacing; hence, four rows were harvested to maintain the same sampling area as maize and mucuna planted at 90 cm spacing. Physiological maturity was determined using standard visual indicators for each crop, including husk drying and black layer formation for maize, and pod colour change and seed hardening for legumes. All plants within the net plots were cut at ground level, and in intercrop treatments, maize and legume components were harvested, handled, and weighed separately.
For all crops, the number of plants and cobs (for maize only) per net plot was recorded prior to weighing. Harvested biomass was separated into cobs/pods (grain component) and stover (stalks and leaves), and fresh weights were measured separately immediately after harvest. A random subsample of six cobs or 1 kg of pods per plot was taken to determine grain moisture content using a Dickey-John mini-GAC grain moisture analyser (Model 11001-1464 Rev D). Grain yield was corrected to 12.5% moisture for maize and 9% for legumes. Stover yield was determined from the same net plots as grain. A representative stover subsample of six stalks per plot was cut into small pieces, thoroughly mixed, and a subsample was oven-dried at 48°C for 48 h. Dried subsamples were reweighed, and the measured moisture content was used to calculate dry matter biomass yields.
Each crop was harvested at its own physiological maturity, with cowpea harvested in February, maize in April to May, and mucuna in May, reflecting differences in crop phenology. Harvesting for grain and forage was conducted simultaneously for each crop at maturity. Although optimal forage harvest for some legumes may occur earlier, harvesting at physiological maturity mimicked farmers’ practices who feed livestock using both forage seed and stover and grow cowpeas for both human consumption (grain) and feed (stover).
Land equivalent ratio (LER)
The productivity of both grain and total biomass yield in intercropping systems was evaluated using the LER (Dariush et al., Reference Dariush, Ahad and Meysam2006). The LER was calculated as:
 $$LER={YA \over SA}+{YB \over SB}$$
Where YA and YB are the yields of the individual intercrops, while SA and SB are the yields of these crops when grown as sole crops. The partial LERs (pLERs) were then summed up to give the total LER for the intercrop.
The LER indicates the relative land requirements for intercrops compared to monocrops. A LER value above 1.0 indicates intercropping is more productive than sole cropping on the same land area, while a LER value below 1.0 suggests sole cropping is more productive.
Edible grain and feed yields and their protein contents
Feed output (yield) from each system included:
-
i. maize stover in sole maize systems.
-
ii. cowpea stover in sole cowpea systems.
-
iii. mucuna grain + mucuna stover in sole mucuna systems.
-
iv. maize stover + cowpea stover in maize-cowpea intercropping systems.
-
v. maize stover + mucuna grain + mucuna stover in maize-mucuna intercropping systems.
Maize and cowpea grains were considered edible grains and not livestock feed because, under smallholder farming systems, they are primarily grown for human consumption. Livestock is typically fed using stover or the grain of forage legumes such as mucuna and lablab. The edible grain protein content and feed CP content produced from different cropping systems were calculated on a dry matter basis. Grain yields, initially reported at standard moisture contents (12.5% for maize and 9% for legumes), were converted to dry matter using their respective moisture content values. The resulting dry matter yields were then multiplied by the corresponding protein concentrations in Table 2 to estimate protein yield.
Feed crude protein contents and edible grain protein contents used to calculate systems’ nutritive value

To estimate the livestock feeding period from the harvested feed, it was assumed that each household owns 4.6 cattle (Baudron et al., Reference Baudron, Tui, Silva, Chakoma, Matangi, Nyagumbo and Dube2024) and 1 ha of arable land allocated to the specific cropping system, with each cattle requiring 5 kg of feed per day (Chakoma et al., Reference Chakoma, Manyawu, Gwiriri, Moyo, Dube, Imbayarwo-Chikosi, Halimani, Chakoma, Maasdorp and Buwu2016), giving a daily dry matter feed requirement of 25 kg per household. For calculations, a round figure of 5 cattle per household was used. Surplus feed from each cropping system was calculated as the extra feed remaining after a household feeds its livestock during the feed lean (dry) months, from July to December.
The food/grain consumption periods were based on the national Pfumvudza concept, which assumes that a mean household of six people requires 20 kg of grain per week (Edwards et al., Reference Edwards, Deall, Edwards, Oldreive and Stockil2014). Surplus edible grain from each cropping system was calculated as the grain remaining after 12 months of consumption, after which the household is ready to harvest from the subsequent season. The surplus feed and edible grains can be sold. It was also assumed that there were no post-harvest losses of edible grain or animal feed.
Statistical analyses
Data was analysed using R software, version 4.4.2 (R Core Team, Reference Team2016). Prior to data analysis, model residuals were assessed for normality and homoscedasticity using diagnostic plots, namely histograms of residuals, residuals versus fitted values, and Q-Q plots. Additionally, potential outliers and influential observations were analysed, though no data points were found to unduly influence the regression results. Mixed linear models were run to determine the effects of treatments on edible grain yields, protein content, and feed output. Rainfall regimes (dry, average, and wet seasons) and treatments were considered fixed effects, while the experimental site was considered random. Interactions between treatments and rainfall regimes were tested. Crop yields and protein content were analysed for each rainfall regime separately. Significance levels were determined at P < 0.05. Soil moisture dynamics were also analysed using mixed linear models, where depth (presented in depth ranges of 0–60, 60–120, and 120–180 cm), rainfall regime, and treatments were considered fixed effects, while the experimental site was considered a random effect. A simple linear regression analysis was performed on seasonal rainfall against maize grain and feed yield using the lm function. The linear regression line was generated in ggplot2 using stat_smooth(method = “lm”), which fits a linear model (lm) to the data and overlays the fitted regression line on the scatter plot. The functions lmer and glm were used to run the mixed and generalised linear models, respectively, while figures were generated using the ggplot2 package in R.
Results
Rainfall distribution
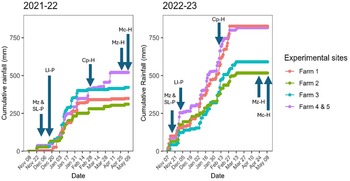
The 2021/22 season was relatively dry, with total rainfall ranging from 329 to 521 mm and a late onset of the rainy season. In contrast, the 2022/23 season was wetter, receiving 517 to 827 mm of rainfall (Figure 2). Farms 2 and 3 received considerably less rain in 2022/23 than the other farms. Across the two seasons combined, three sites (a combination of farm by season) were classified as dry (rainfall < 450 mm), four sites as average (rainfall 450–600 mm), and three sites as wet seasons (rainfall > 600 mm).
Cumulative rainfall received in the farms included in the experiement during the 2021/22 and 2022/23 agricultural seasons. In each season, Mz & SL-P indicates the maize and sole legume (mucuna and cowpea) planting dates, LI-P indicates the legume intercrop planting dates, Cp-H, Mz-H, and Mc-H indicates the cowpea, maize, and mucuna harvesting dates, respectively. NB. There were inconsistencies in the recorded daily rainfall at Farm 4. Therefore, the average annual rainfall for Farms 4 and 5, which were located within a 500-metre radius, was used.

Figure 2. Long description
Two line graphs compare cumulative rainfall at four experimental sites in Mutoko District during the 2021-22 and 2022-23 agricultural seasons. The x-axis represents dates from November to May, while the y-axis shows cumulative rainfall in millimeters. Each graph includes data from Farm 1, Farm 2, Farm 3, and Farms 4 and 5. Key planting and harvesting dates are marked with arrows: Mz & SL-P for maize and sole legume planting, LI-P for legume intercrop planting, Cp-H for cowpea harvesting, Mz-H for maize harvesting, and Mc-H for mucuna harvesting. The 2021-22 season shows more gradual rainfall accumulation, while the 2022-23 season shows a steeper increase. The data for Farms 4 and 5 were averaged due to inconsistencies in daily recordings. All values are approximated.
Soil moisture
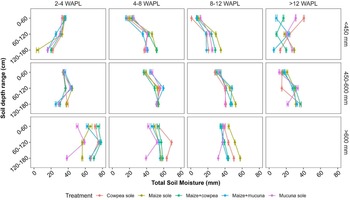
In wet seasons, the sole maize system followed by sole cowpea used less water than the other systems, as indicated by the high residual soil moisture content at the end of the season, particularly at 60–180 cm soil depth (Figure 3). Sole mucuna generally extracted more moisture than intercrops from the 60–120 cm layer throughout the season. In dry and average seasons, no clear patterns in soil moisture distribution were observed across cropping systems with increasing depth, likely due to limited moisture availability (Figure 3).
Mean volumetric soil moisture in the soil profile under different cropping systems and rainfall regimes. WAPL refers to weeks after planting legumes during the 2021/22–2022/23 agricultural seasons in Mutoko.

Figure 3. Long description
The image contains twelve line graphs arranged in a grid, each representing mean volumetric soil moisture in the soil profile under different cropping systems and rainfall regimes. The graphs are organized into four columns based on weeks after planting legumes (WAPL): 2-4 WAPL, 4-8 WAPL, 8-12 WAPL, and greater than 12 WAPL. Each row represents different rainfall regimes: less than 450 millimeters, 450-600 millimeters, and greater than 600 millimeters. The x-axis of each graph indicates total soil moisture in millimeters, while the y-axis indicates soil depth range in centimeters. Different colored lines represent various treatments: Cowpea sole, Maize sole, Maize+cowpea, Maize+mucuna, and Mucuna sole. Each graph shows how soil moisture varies with depth and time under different treatments and rainfall conditions. The trends, values, and interactions between different treatments and rainfall regimes are visually represented, highlighting the impact of cropping systems on soil moisture retention.
Crop productivity
Rainfall impacting crop yields
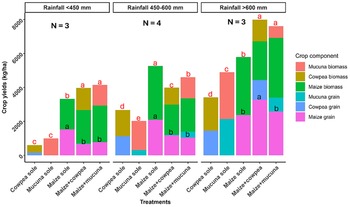
In dry and average seasons (rainfall < 600 mm), intercropping significantly reduced maize grain yield (P = 0.034) (Figure 4). Sole cowpea gave 165 kg/ha grain yield in relatively dry seasons (<450 mm), with yields improving as rainfall increased. As a sole crop, maize was significantly more productive than cowpea and mucuna, irrespective of the rainfall regime. Cowpea in intercropping systems only produced substantial grain yields (1160 kg/ha) in wet seasons (>600 mm). In average and dry seasons, a mean biomass yield of intercropped cowpea (811 kg/ha) and mucuna (1232 kg/ha) was harvested, with respective grain yields of 38 kg/ha of cowpea and 412 kg/ha of mucuna. Total biomass production was enhanced in intercropping systems in relatively wet seasons (>600 mm), relative to the monocropping systems. In average and dry seasons, differences in biomass production between intercropping systems and sole maize were small (Figure 4). While grain yields were strongly affected by rainfall regime, stover yields were less affected, particularly in the intercropping systems (Figure 4).
Crop yields (grain and stover) harvested under different rainfall regimes during the 2021/22–2022/23 agricultural seasons in Mutoko. Red letters indicate the significance of differences in total biomass of all crops; black letters indicate the significance of differences in maize grain yield. For total biomass or maize grain, same letters within a rainfall regime indicate no significant differences between treatments.

Figure 4. Long description
The bar graph compares crop yields in kilograms per hectare under different rainfall regimes in Mutoko during the 2021/22–2022/23 agricultural seasons. The x-axis lists treatments: cowpea sole, mucuna sole, maize sole, maize plus cowpea, and maize plus mucuna. The y-axis measures crop yields in kilograms per hectare, ranging from 0 to 8000. The graph is divided into three sections based on rainfall: less than 450 millimeters, 450-600 millimeters, and more than 600 millimeters. Each bar is color-coded to represent different crop components: mucuna biomass, cowpea biomass, maize biomass, mucuna grain, cowpea grain, and maize grain. Red letters indicate the significance of differences in total biomass of all crops, while black letters indicate the significance of differences in maize grain yield. Same red letters within a rainfall regime indicate no significant differences between treatments. All values are approximated.
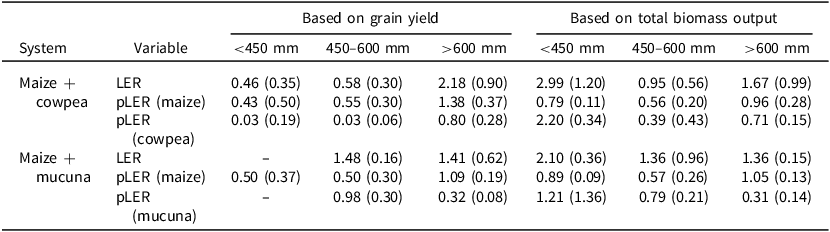
The sole maize system produced 877 kg/ha and 932 kg/ha more edible grain yield than maize-cowpea intercropping in dry and average seasons, respectively, as indicated by LER < 1 (Table 3). Conversely, in wet seasons, both intercropping systems were more productive than sole cropping, with both total LER and maize pLERs values often exceeding 1 (Table 3).
Land equivalent ratios (LERs) and partial LERs (pLERs) calculated from the cropping systems established during the 2021/22–2022/23 agricultural seasons in Mutoko. Numbers in brackets represent standard deviations of means

Table 3. Long description
The table presents land equivalent ratios (LERs) and partial LERs (pLERs) for various cropping systems established in Mutoko during the 2021/22–2022/23 agricultural seasons. The table is divided into two main sections based on grain yield and total biomass output, with further subdivisions based on rainfall amounts. The systems compared include maize sole cropping, maize-cowpea intercropping, and maize-mucuna intercropping. The table has 10 rows and 10 columns, with headers indicating the system, variable, and different rainfall conditions. Notable trends include higher productivity in intercropping systems during wet seasons, as indicated by LER values often exceeding 1. In contrast, sole maize systems produced more edible grain yield in dry and average seasons, with LER values less than 1. The table also includes standard deviations of means in brackets.
A clear positive association was observed between rainfall and maize grain yield (P < 0.001), although rainfall only explained a limited proportion of the total variability in yield (R 2 = 35%). No relationship between rainfall and feed yield could be observed, P = 0.821.
Crop use and protein content
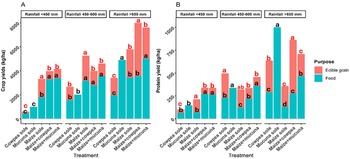
In dry seasons, sole maize had significantly higher protein content (P = 0.028) in edible grain than in sole cowpea and maize-cowpea intercropping system. However, feed in the maize-cowpea system contained more protein than feed in sole maize and in sole cowpea. In wet seasons, both sole cowpea and maize-cowpea cropping systems produced more protein in grain and feed than sole maize (Figure 5). Sole mucuna provided the highest CP in feed among all systems in wet seasons only (Figure 5). Despite comparable biomass yields, maize-mucuna intercropping systems produced more CP than sole maize in average seasons (Figure 5).
Mean edible grain yield and feed yield (A) and protein yield (B) as affected by rainfall and cropping system during the 2021/22–2022/23 agricultural seasons in Mutoko. Red letters indicate the significance of differences in edible grain; black letters indicate the significance of differences in feed yield. For edible grain or feed, same letters within a ranfall regime indicate no significant differences between treatments.

Figure 5. Long description
The bar graph compares crop yields and protein yields under different rainfall conditions and cropping systems. The x-axis represents various treatments, including cowpea sole, mucuna sole, maize sole, maize-cowpea, and maize-mucuna. The y-axis on the left measures crop yields in kilograms per hectare, while the y-axis on the right measures protein yield in kilograms per hectare. The graph is divided into three sections based on rainfall: less than 450 millimeters, 450-600 millimeters, and more than 600 millimeters. Each bar is color-coded to represent edible grain in red and feed in teal. The graph shows significant differences in edible grain and feed yield, indicated by red and black letters respectively. The treatments and rainfall conditions affect the yields, with higher rainfall generally resulting in higher yields. The data highlights the impact of different cropping systems on agricultural productivity.
Household grain and feed sufficiency
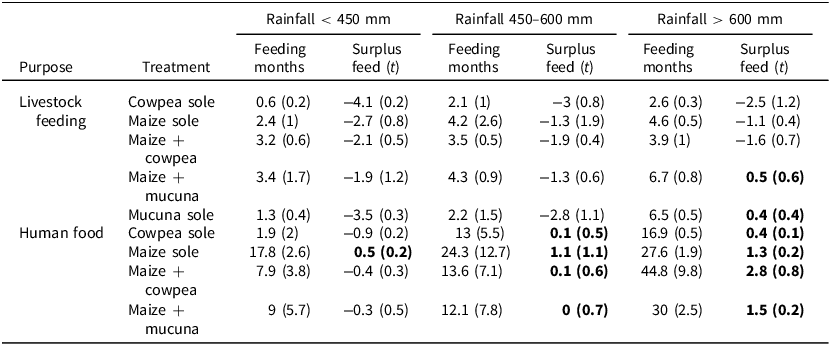
Only feed produced from sole mucuna and maize-mucuna intercropping systems in wet seasons was sufficient to meet cattle’s dry season feed requirements for six months (July–December), with a mean surplus of 0.45 t (Table 4). In dry seasons, only sole maize systems produced enough grain to meet annual household food needs, while in average and wet seasons, sole maize produced a surplus greater than 1 t of grain. Maize–cowpea intercropping provided a surplus of 2.8 t of grain in wet seasons. The low rainfall regime resulted in the greatest food and feed deficits across treatments except for sole maize.
Surplus feed and edible grain harvested from different cropping systems under varying rainfall regimes during the 2021/22–2022/23 agricultural seasons in Mutoko. Numbers in brackets represent the standard deviation of means

Table 4. Long description
The table presents data on surplus feed and edible grain harvested from different cropping systems under varying rainfall regimes during the 2021/22–2022/23 agricultural seasons in Mutoko. It includes three main rainfall categories: less than 450 millimeters, 450 to 600 millimeters, and more than 600 millimeters. The table has 10 rows and 7 columns, with columns for treatment, feeding months, and surplus feed in tons for each rainfall category. Treatments include cowpea sole, maize sole, maize plus cowpea, maize plus mucuna, and mucuna sole. Notable trends include the greatest food and feed deficits in the low rainfall regime across treatments except for sole maize. Sole maize systems produced enough grain to meet annual household food needs in dry seasons and a surplus greater than 1 ton of grain in average and wet seasons. Maize-cowpea intercropping provided a surplus of 2.8 tons of grain in wet seasons. Only feed produced from sole mucuna and maize-mucuna intercropping systems in wet seasons was sufficient to meet cattle’s dry season feed requirements for six months, with a mean surplus of 0.45 tons.
NB: Figures in bold represent the surplus harvested from respective cropping systems and rainfall regimes.
Discussion
Seasonal rainfall–driven interactions between maize and legume intercrops
Seasonal rainfall strongly influenced the productivity of sole and intercropping systems. In relatively dry seasons (rainfall < 450 mm), maize intercrops produced less grain yield than sole maize. This suggests that under moisture-limiting conditions in dry and average seasons, intercropping exacerbated moisture deficiencies for maize, leading to substantially lower maize yields. Similarly, maize yield penalties from intercrops were reported under low rainfall conditions in a regional study including five countries in East and Southern Africa (Nyagumbo et al., Reference Nyagumbo, Mupangwa, Chipindu, Rusinamhodzi and Craufurd2020). On the contrary, Masvaya et al. (Reference Masvaya, Nyamangara, Descheemaeker and Giller2017) reported that intercropping cowpea did not compromise maize yields in seasons receiving less than 600 mm, in the same agro-ecological region (NR IV). The differences may be attributed to the cowpea varieties used in the respective studies. Masvaya et al. (Reference Masvaya, Nyamangara, Descheemaeker and Giller2017) used CBC2, a narrow-leaved variety, whereas this study employed a broad-leaved local landrace. The broader canopy of the local variety may have increased competition for water and light, potentially reducing maize yield.
In dry seasons, the LER values were below 1, indicating that intercropping reduced system productivity, probably due to competition for soil moisture. However, in wet seasons (rainfall > 600 mm), intercropping systems’ LER values based on grain yield exceeded 1, indicating an advantage of intercropping in enhancing resource use efficiency and system productivity. In such seasons, intercropping systems utilised more soil water than sole maize (Figure 5). Maize grain yields in intercropping in wet seasons were maintained or improved, relative to maize yields in sole cropping, suggesting that soil moisture was adequate to support crop growth, while beneficial interspecies interactions, such as a complementary rooting system, may have enhanced maize yield (Adam et al., Reference Adam, Giller, Rusinamhodzi, Rasche, Koomson, Marohn and Cadisch2025; Mthembu et al., Reference Mthembu, Everson and Everson2017; Mugi-Ngenga et al., Reference Mugi-Ngenga, Bastiaans, Anten, Zingore and Giller2022). Our findings concur with Gwenambira-Mwika et al. (Reference Gwenambira-Mwika, Snapp and Chikowo2021) and Mugi-Ngenga et al. (Reference Mugi-Ngenga, Bastiaans, Anten, Zingore and Giller2022), who found that maize yields are improved or unaffected by legume intercropping in wet seasons.
In relatively dry seasons, grain production of cowpea and mucuna in intercropping systems was more negatively affected by dry spells than that of maize, since legume intercrops were only planted when the maize crop/roots were already established. Given the medium-grained texture of soils at all sites (Table 1) with a low water holding capacity (Nyamapfene, Reference Nyamapfene1991), the establishment of legume intercrops was likely negatively impacted by low soil moisture content during the first four weeks after planting the legumes (Figure 5). The poor performance of legume intercrops in average and wet seasons concurs with Kwenda et al. (Reference Kwenda, Falconnier, Cardinael, Affholder, Couëdel, Baudron, Franke, Nyagumbo, Mabasa, de Freitas, Pret, Diop, Mutsamba-Magwaza and Chikowo2025), who reported that sole cowpea produced 56% more above-ground biomass than cowpea grown in intercrop systems. Shading effects of maize on the legume intercrops may have compounded grain yield losses (Chimonyo et al., Reference Chimonyo, Modi and Mabhaudhi2016b). Masvaya et al. (Reference Masvaya, Nyamangara, Descheemaeker and Giller2017) suggested that the low cowpea grain yields observed in intercropping systems may be attributed to limited below-ground niche differentiation, resulting in overlapping root distribution patterns and increased competition for soil water and nutrients between maize and cowpea.
While soil moisture supported crop growth during dry seasons, it was insufficient for optimal grain filling, particularly in intercropping systems. As a result, grain yields increased with rainfall, while stover biomass yield showed weaker associations with seasonal rainfall (Figure 4). In wet seasons, mucuna-based systems produced more forage biomass (feed) than maize and cowpea systems, likely due to mucuna’s higher leaf area index, which enhances light interception and biomass accumulation (Jiri, Reference Jiri2012). Mucuna’s deep-rooting traits also conferred an advantage under wet conditions. More rainfall allowed water to infiltrate deeper into the soil profile, where moisture is retained longer, enabling deep-rooted crops like mucuna to sustain growth and biomass production. In contrast, during dry seasons, soil moisture was limited across all depths, reducing the benefit of deeper roots for maintaining growth. Sole mucuna extracted more water from the 120–180 cm soil layer than maize–mucuna intercropping systems. A higher mucuna density in the sole crop could have resulted in greater root length density and more effective subsoil moisture extraction (Saha et al., Reference Saha, Lenga, Wamocho and Mureithi2010).
Implications of seasonal rainfall variability for food and feed security
The sole maize cropping system emerged as the most reliable system for achieving food security in dry and average seasons, providing the best chances to ensure sufficient food for the household throughout the year. The choice of legume species significantly influenced system outcomes. The maize-cowpea intercropping yields two food crops from one plot, resulting in more edible grain and protein available to the household in wet seasons (Figure 4). In addition, intercropping cowpea with maize did not compromise maize productivity in wet seasons, supplying 2.8 t of surplus edible grain (Table 3) and offering opportunities for income generation (Njira et al., Reference Njira, Semu, Mrema and Nalivata2021; Rusinamhodzi et al., Reference Rusinamhodzi, Corbeels, Nyamangara and Giller2012). The cowpea-based cropping systems thus provided higher dietary protein (Figure 4) due to cowpea’s higher protein content than cereals (USDA, 2020). This finding concurs with Nyagumbo et al. (Reference Nyagumbo, Nyamayevu and Silva2025), who reported higher protein yields from intercropping systems relative to sole cropping. Dietary proteins are crucial for rural people with limited access to animal-based protein sources (Nyamayevu et al., Reference Nyamayevu, Nyagumbo, Liang, Li and Silva2024; Snapp et al., Reference Snapp, Cox and Peter2019; ZimVAC, 2024).
Mucuna, although challenging to harvest due to its vines entangling maize plants and causing irritation upon contact (Correia et al., Reference Correia, Pereira, De Almeida, Williams, Freach, Nesbitt and Erskine2014; Mthembu et al., Reference Mthembu, Everson and Everson2017), proved to be valuable for livestock feed security. Systems involving mucuna produced sufficient feed for lean periods (July–December) in wet seasons, addressing seasonal feed shortages. Mucuna-based systems provided the highest CP content, because both mucuna grain and stover are fed to livestock and contain more CP than maize and cowpea stover.
Although mucuna provided better feed quality, the maize-cowpea intercropping systems produced a comparable amount of total biomass. Given cowpea’s dual-purpose nature, suitable as food and feed, most farmers are likely to prefer cowpea over mucuna. Legume feed is relevant in these smallholder systems where livestock typically rely on cereal residues and grass during the dry season, both of which are low in CP (Descheemaeker et al., Reference Descheemaeker, Zijlstra, Masikati, Crespo and Tui2018; Feedipedia, 2022; Mutsamba et al., Reference Mutsamba, Nyagumbo and Mafongoya2012). The mucuna-based system may be more important to households that keep livestock as a source of income.
This study could have benefited from a proper gross margin analysis for each cropping system across seasons with different seasonal rainfall amounts. However, a full economic assessment was not possible because labour data was not collected. Although general labour data in intercropping systems could be obtained, e.g., from Rusinamhodzi et al. (Reference Rusinamhodzi, Corbeels, Nyamangara and Giller2012) and Mutsamba et al. (Reference Mutsamba, Nyagumbo and Mupangwa2019), labour requirements, particularly for weeding and harvesting, are likely to vary considerably depending on the intensity of ground cover and the extent of legume vine climbing on the maize crop, both of which are influenced by seasonal rainfall amount (Mhlanga et al., Reference Mhlanga, Cheesman, Maasdorp, Mupangwa and Thierfelder2017).
Conclusions
This study highlights that variations in seasonal rainfall significantly impact productivity and the relative performance of intercropping and monocropping systems. Intercropping provided grain yield advantages and improved land use efficiency (LER > 1) in relatively wet seasons (rainfall > 600 mm), while sole maize cropping produced more grain on average in dry seasons (rainfall < 600 mm).
Maize-cowpea intercropping enhanced total edible grain yield and dietary protein, while mucuna-based systems improved feed biomass and feed protein yield. Given cowpea’s dual-purpose nature for food and feed, most farmers are likely to prefer cowpea over mucuna. In wet seasons, sole mucuna utilised more moisture in deep soil layers than crops in other systems. During dry seasons, the small differences in residual soil moisture between cropping systems suggest that water availability was limiting across all systems. The poor intercrop grain yields under dry conditions reinforce the importance of water availability in semi-arid crop production. The results from this study can guide extension workers and farmers on deciding if and when to intercrop the main staple food, maize, with legumes, particularly in seasons when climate anomalies such as El Niño or La Niña are anticipated. However, providing reliable cropping system recommendations remains a challenge due to the high spatial and temporal variability in rainfall observed within the same season and over a relatively small geographical area. This variability and inherent unpredictability of seasonal rainfall limit the effectiveness of current seasonal forecasts in supporting smallholder farmers’ decisions. To effectively advise farmers on cropping systems, seasonal weather forecasting needs to improve, which is a challenge given the observed high spatial variability in rainfall within seasons in a relatively small area.
Supplementary material
The supplementary material for this article can be found at https://doi.org/10.1017/S0014479726100350.
Acknowledgements
We acknowledge the government extension officers from the district office (Mr Makona and Mr Muhle) and ward-based extension officers from wards 4 and 16 in Mutoko District for their assistance in identifying host farmers. We also extend our gratitude to the farmers for hosting and managing the trials. We greatly appreciate CIRAD-Zimbabwe for allowing us to use their soil moisture probe to measure soil moisture content.
Author contributions
Mutsamba-Magwaza, E.F: Conceptualised the study, produced protocols and data collection sheets, collected, consolidated and analysed the data, wrote the original draft, and consolidated comments from co-authors in subsequent versions. Franke, L. C: Conceptualised the study, guided methodology, supervised the writing and flow of the paper, reviewed and edited all versions of the manuscript. Baudron, F: Conceptualised the study, participated in funding acquisition, guided data analysis using R software, reviewed and edited the manuscript. van der Watt, E: Conceptualised the study, supervised the writing of the paper, reviewed and edited all versions of the manuscript. Kwenda, I. W: Assisted in data collection, consolidation and analysis, reviewed and edited the manuscript. Nyagumbo, I: Conceptualised the study, participated in funding acquisition, reviewed and edited the manuscript.
Funding statement
This work was supported by the Livestock Production Systems in Zimbabwe (LIPS-Zim) project (2020–2024), funded by the European Union (https://lips-zim.org/).
Competing interests
The authors declare none.





 Open access

