

Introduction
Annually, more than 200 million hectares of wheat are cultivated worldwide, of which 95% represents bread wheat (Li et al. Reference Li, Wen, Liu, Zhang, Cao, He, Rasheed, Jin, Zhang, Yan, Zhang, Wan and Xia2019; Robbana et al. Reference Robbana, Kehel, Ben Naceur, Sansaloni, Bassi and Amri2019; Erenstein et al. Reference Erenstein, Jaleta, Mottaleb, Sonder, Donovan, Braun, Reynolds and H-J2022). Global production of this vital crop reached 767 million tons in 2020 and 771 million tons in 2021 (FAOSTAT, 2024). Wheat is an important source of nutrients that are essential for health, including dietary fibre, minerals, vitamins and phytochemicals (Javid Iqbal et al. Reference Javid Iqbal, Shams, Fatima and Ansari2022 ). Given current population growth and food demands, the annual production of bread wheat must rise by 2% per year (Hatfield and Beres Reference Hatfield and Beres2019; Singh et al. Reference Singh, Wu, Tiwari, Sehgal, Raupp, Wilson, Abbasov, Gill and Poland2019). Historically, crop wild relatives and farmer varieties, also termed landraces, have served as valuable sources of novel diversity that can be easily accessed via global gene banks (Thattantavide and Kumar Reference Thattantavide, Kumar, Kumar, Singh, Singh and Singh2023).
With 21 pairs of chromosomes (AABBDD genome), bread wheat is a hexaploid cereal species, whose origins can be traced back to hybridization between three different grass species within the fertile crescent region of Syria and Turkey (Feldman Reference Feldman, Bonjean and Angus2001). The first hybridization event took place between 500,000 and 150,000 years ago, between Triticum urartu (AA genome) and an unidentified species closely related to Aegilops speltoides (BB genome), creating a new tetraploid species with 14 pairs of chromosomes, namely Triticum turgidum L. ssp. dicoccoides (AABB genome). The derived domesticated species is termed T. turgidum ssp. dicoccum, which is also the ancestor of modern durum wheat. A second hybridization event occurred around 8,500–9,000 years ago, between the domesticated tetraploid T. dicoccum and the wild diploid species Aegilops tauschii (DD genome) to give rise to the hexaploid species Triticum aestivum L. (AABBDD genome) (Charmet Reference Charmet2011; Mastrangelo and Cattivelli Reference Mastrangelo and Cattivelli2021; Levy and Feldman Reference Levy and Feldman2022). Ae. speltoides, T. timophevii, T. dicoccoides and Ae. tauschii are species that are closely related to bread wheat and have been successfully used to give resistance to common diseases and pests, including leaf rust, yellow rust, stem rust, powdery mildew, Hessian fly and Russian wheat aphid to cultivated wheat (Helguera et al. Reference Helguera, Khan, Kolmer, Lijavetzky, Zhong‐qi and Dubcovsky2003; Vikal et al. Reference Vikal, Chhuneja, Singh and Dhaliwal2004; Liu et al. Reference Liu, Brown-Guedira, Hatchett, Owuoche and Chen2005; Marais et al. Reference Marais, McCallum, Snyman, Pretorius and Marais2005; Hiebert et al. Reference Hiebert, Thomas, Somers, McCallum and Fox2007; Miranda et al. Reference Miranda, Bland, Cambron, Lyerly, Johnson, Buntin and Murphy2010; Klindworth et al. Reference Klindworth, Saini, Long, Rouse, Faris, Jin and Xu2017; Niranjana et al. Reference Niranjana, Vinod, Sharma, Mallick, Tomar and Jha2017; Sadeghabad et al. Reference Sadeghabad, Dadkhodaie, Heidari, Razi and Mostowfizadeh-Ghalamfarsa2017; Klymiuk et al. Reference Klymiuk, Fatiukha, Raats, Bocharova, Huang, Feng, Jaiwar, Pozniak, Coaker, Dubcovsky and Fahima2020). Several studies examined the contribution of wheat relatives in improving resistance to significant abiotic stresses, including heat, salinity and drought (Rasheed et al. Reference Rasheed, Mujeeb-Kazi, Ogbonnaya, He and Rajaram2018). In particular, Ae. tauschii is contributing significantly to bread wheat improvement by developing synthetic hexaploid wheat through interspecific crosses between this wild species and durum wheat (Kishii Reference Kishii2019; Aberkane et al. Reference Aberkane, Belkadi, Kehel, Filali-Maltouf, Tahir, Meheesi and Amri2021; Gaurav et al. Reference Gaurav, Arora, Silva, Sánchez-Martín, Horsnell, Gao, Brar, Widrig, John Raupp, Singh, Wu, Kale, Chinoy, Nicholson, Quiroz-Chávez, Simmonds, Hayta, Smedley, Harwood and Wulff2022; Gudi et al. Reference Gudi, Jain, Singh, Kaur, Srivastava, Mavi, Chhuneja, Sohu, Safhi, El-Moneim and Sharma2024).
Molecular markers can be a useful tool to examine the genetic diversity and evolutionary links between plant accessions (Khan et al. Reference Khan, Pandey, Choudhary, Hakki, Akkaya and Thomas2014). Single nucleotide polymorphisms (SNPs) are considered as one of the most widely used type of markers in gene banks to examine the genetic diversity, population structure and relationships between accessions, which help in the effective use of genetic resources for pre-breeding as well as their management and protection (Arif et al. Reference Arif, Bakir, Khan, Al Farhan, Al Homaidan, Bahkali, Al Sadoon and Shobrak2010; Robbana et al. Reference Robbana, Kehel, Ben Naceur, Sansaloni, Bassi and Amri2019). In plant breeding, markers like SNP are useful to create kinship matrices for genomic selection (GS), identifying quantitative trait loci (QTL) for gene discovery and to facilitating marker-assisted selection (MAS) for desirable traits (Kamaluddin et al. Reference Kamaluddin, Khan, Kiran, Ali, Abdin, Zargar, Ahmad, Sofi, Gulzar, Abdin, Kiran, Kamaluddin and Ali2017).
Recently, CGIAR has developed mid-density DArTag marker panels for several crops to make genotyping more accessible and cost-effective, particularly for researchers in low- and middle-income countries. These panels aim to optimize genotyping approaches, support breeding programs and accelerate the introduction of new improved varieties to the farmers (Sansaloni et al. Reference Sansaloni, Petroli, Jaccoud, Carling, Detering, Grattapaglia and Kilian2011; Singh et al. Reference Singh, Wu, Tiwari, Sehgal, Raupp, Wilson, Abbasov, Gill and Poland2019; CGIAR 2024). However, the use of the mid-density panel for pre-breeding has been limited. Pre-breeding has become an important link between gene banks and breeding initiatives but often lacks sufficient funding. Also, the use of modern breeding technologies, including genotyping with low-cost panels, can help in this context of pre-breeding efforts.
In this study, we start from the hypothesis that the CGIAR mid-density DArTag panel can provide useful information on the genetic diversity and structure of our 484 bread wheat pre-breeding lines derived mainly from crosses with wild parent accessions, making it a valuable tool for pre-breeding. Specifically, our objectives are to (I) assess the panel’s ability to capture genetic variation across a set of pre-breeding germplasm, (II) investigate population structure with a focus on the contribution of exotic and elite parents and (III) identify allelic variation of potential selective value, including private alleles (PAs) that may be associated with adaptive traits linked to heat stress performance, which can be strategically exploited in pre-breeding to improve adaptation to drought and climate change. By testing this hypothesis, we aim to demonstrate the applicability of the mid-density DArTag panel and provide new insights into how wild relatives and landraces contribute to the genetic diversity available for wheat breeding.
Materials and methods
Plant material
This study utilized 484 pre-breeding accessions of bread wheat (T. aestivum L.), developed though interspecific crosses performed by ICARDA-Genetic Resources team and selected at the experimental stations Marchouch (33°36′ N 6°42′ W) and Annoceur (33°41′ N 4°51′ W) in Morocco. The crosses were made using different landraces and wild species. The selection method employed was the Bulk and pedigree method, which allowed for an efficient identification and propagation of lines exhibiting desirable traits. Pedigrees, species type used in cross and selection histories of all accessions are presented in the supplementary Table S1.
Genotyping and marker quality control
All 484 accessions were genotyped using the mid-density DArTag panel of 3,900 markers. This panel, designed for bread wheat genetic diversity research and GS, includes random and gene/QTL-specific markers (Wheat 3.9K Mid-Density Genotyping Services, 2021). Selection criteria of markers in this panel include haplotypes, minor allele frequency and genome and chromosome allocation. To increase its coverage and application, the genotyping panel was modified in 2021 to obtain 3,900 SNP markers distributed over 21 chromosomes (Velu et al., Reference Velu2016; Sehgal et al., Reference Sehgal, Mondal and Crespo-Herrera2020). As a result, 3,900 SNP markers were distributed among the 21 bread wheat chromosomes. DNA extraction and genotyping were performed by Diversity Array Technology (Australia). Markers were filtered by two criteria: missing data ≤20% and minor alleles >5% and heterozygosity ≤0.95, using the ASRgenomics (Gezan et al., Reference Gezan, de Oliveira, Galli and Murray2022) package in R version 4.4.3.
Population structure analysis
The population structure of our pre-breeding accessions was studied using sparse non-negative matrix factorization (sNMF) first introduced in 2014 by Frichot et al. and implemented in the LEA package of R version 4.4.3 (Frichot & François, Reference Frichot, François and O’Meara2015). We evaluated a range of K values from K = 2 to K = 10. For each K value, five repetitions were applied, the alpha parameter was set to 10, the tolerance to 10−5 and the number of iterations to 200. The principal component analysis (PCA) was also conducted on the genomic data for bread wheat using R package ASRgenomics (Gezan et al., Reference Gezan, de Oliveira, Galli and Murray2022) to present the population structure and genetically distinct groups within our population, using the first two principal components.
Analysis of genetic variation and population structure using AMOVA, genetic distances and diversity indices
To validate the population structure found in the previous analysis and to quantify genetic variation within and among resulting subpopulations, an analysis of molecular variance (AMOVA) implemented in the R package poppr (Kamvar et al., Reference Kamvar, Tabima and Grünwald2014) was performed. Population differentiation was measured using pairwise F ST values calculated with the hierfstat R package (Goudet, Reference Goudet2005). The genetic diversity indices including Nei’s unbiased gene diversity, PAs (i.e., the alleles unique to the subpopulation) and allelic richness were calculated using the R poppr package (Kamvar et al., Reference Kamvar, Tabima and Grünwald2014).
Results
Characterization of the CGIAR wheat DArTag panel in pre-breeding
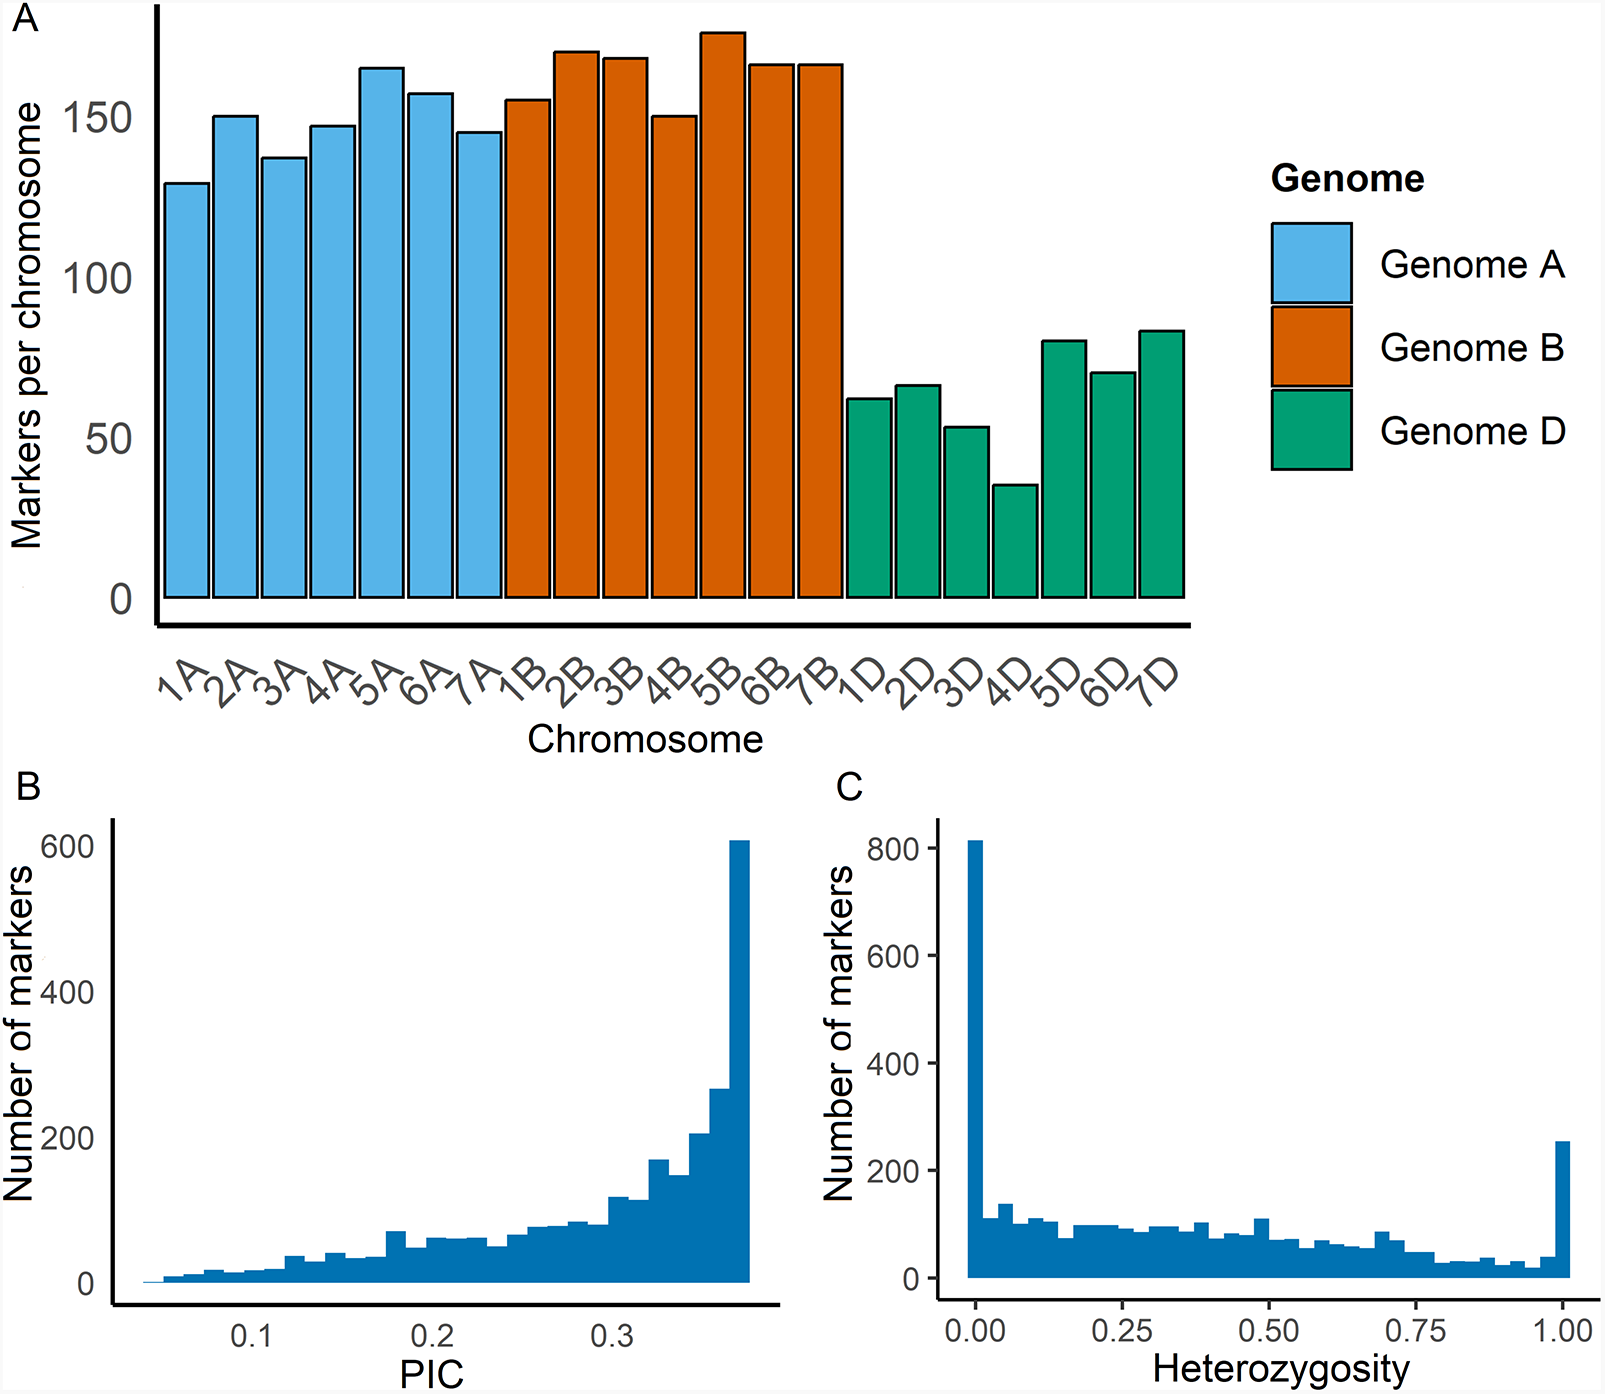
We evaluated the quality and the relevance of the CGIAR mid-density DArTag marker panel for wheat pre-breeding population, consisting of 484 genotypes derived from crosses between elite germplasm, landraces and crop wild relatives, by analysing marker frequency and distribution across the polyploid genome. Out of the 3,900 markers in the panel, 2,633 were retained after filtering. Of the 2,633 markers, 1,153 (43.81%) were found on the B genome, 1,030 (39.13%) on the A genome and only 449 (17.06%) on the D genome (Supplementary Table S2, Fig. 1A). This distribution of markers reflects the unbalanced distribution of markers in the mid-density panel, which has only 21% of the markers designed for the D genome. The telomeric sections of the 21 bread wheat chromosomes had more markers than the pericentromeric regions, showing a similar distribution to the one reported for the same marker panel used with elite CIMMYT material (CGIAR Excellence in Breeding 2024) (Supplementary Figure S1).
Distribution of 2,633 DArTag markers based on marker characteristics and chromosomal distribution. (A) Number of DArTag markers across the 21 chromosomes of bread wheat for 484 pre-breeding wheat accessions. (B) Polymorphism information content (PIC) distribution. (C) Distribution of the percentage of heterozygosity.

Figure 1 Long description
The image A showing a bar graph with the vertical axis labeled Markers per chromosome and tick labels 0, 50, 100, 150. The horizontal axis is labeled Chromosome with categories 1A, 2A, 3A, 4A, 5A, 6A, 7A, 1B, 2B, 3B, 4B, 5B, 6B, 7B, 1D, 2D, 3D, 4D, 5D, 6D, 7D. A legend titled Genome lists Genome A, Genome B, Genome D. Bar heights by chromosome: 1A about 130; 2A about 150; 3A about 140; 4A about 148; 5A about 165; 6A about 158; 7A about 145; 1B about 155; 2B about 170; 3B about 168; 4B about 150; 5B about 175; 6B about 165; 7B about 165; 1D about 62; 2D about 66; 3D about 55; 4D about 35; 5D about 80; 6D about 70; 7D about 83. The image B showing a histogram with the horizontal axis labeled PIC and tick labels 0.1, 0.2, 0.3. The vertical axis is labeled Number of markers with tick labels 0, 200, 400, 600. Bars increase toward the right side, with the tallest bar at the far right reaching about 600. The image C showing a histogram with the horizontal axis labeled Heterozygosity and tick labels 0.00, 0.25, 0.50, 0.75, 1.00. The vertical axis is labeled Number of markers with tick labels 0, 200, 400, 600, 800. The tallest bar is at 0.00 reaching about 800. Bars across the middle range are lower and a bar near 1.00 rises to about 250.
The heterozygosity across all markers ranged from 0.00 to 0.946. About 2% of the markers exhibited heterozygosity between 0.80 and 0.946. For a total of 1,509 markers, heterozygosity was below 0.05 (Fig. 1C, Supplementary Table S3). A total of 2,002 markers had a polymorphism information content (PIC) value greater than 0.25, with a range of 0.05–0.38. Chromosomes 4A, 5A, 6A, 3B and 1D had the highest PIC value (0.38; Supplementary Table S2, Fig. 1B).
Genotypic data of the pre-breeding population reveals distinct sub-populations are due to the gene bank and elite parent
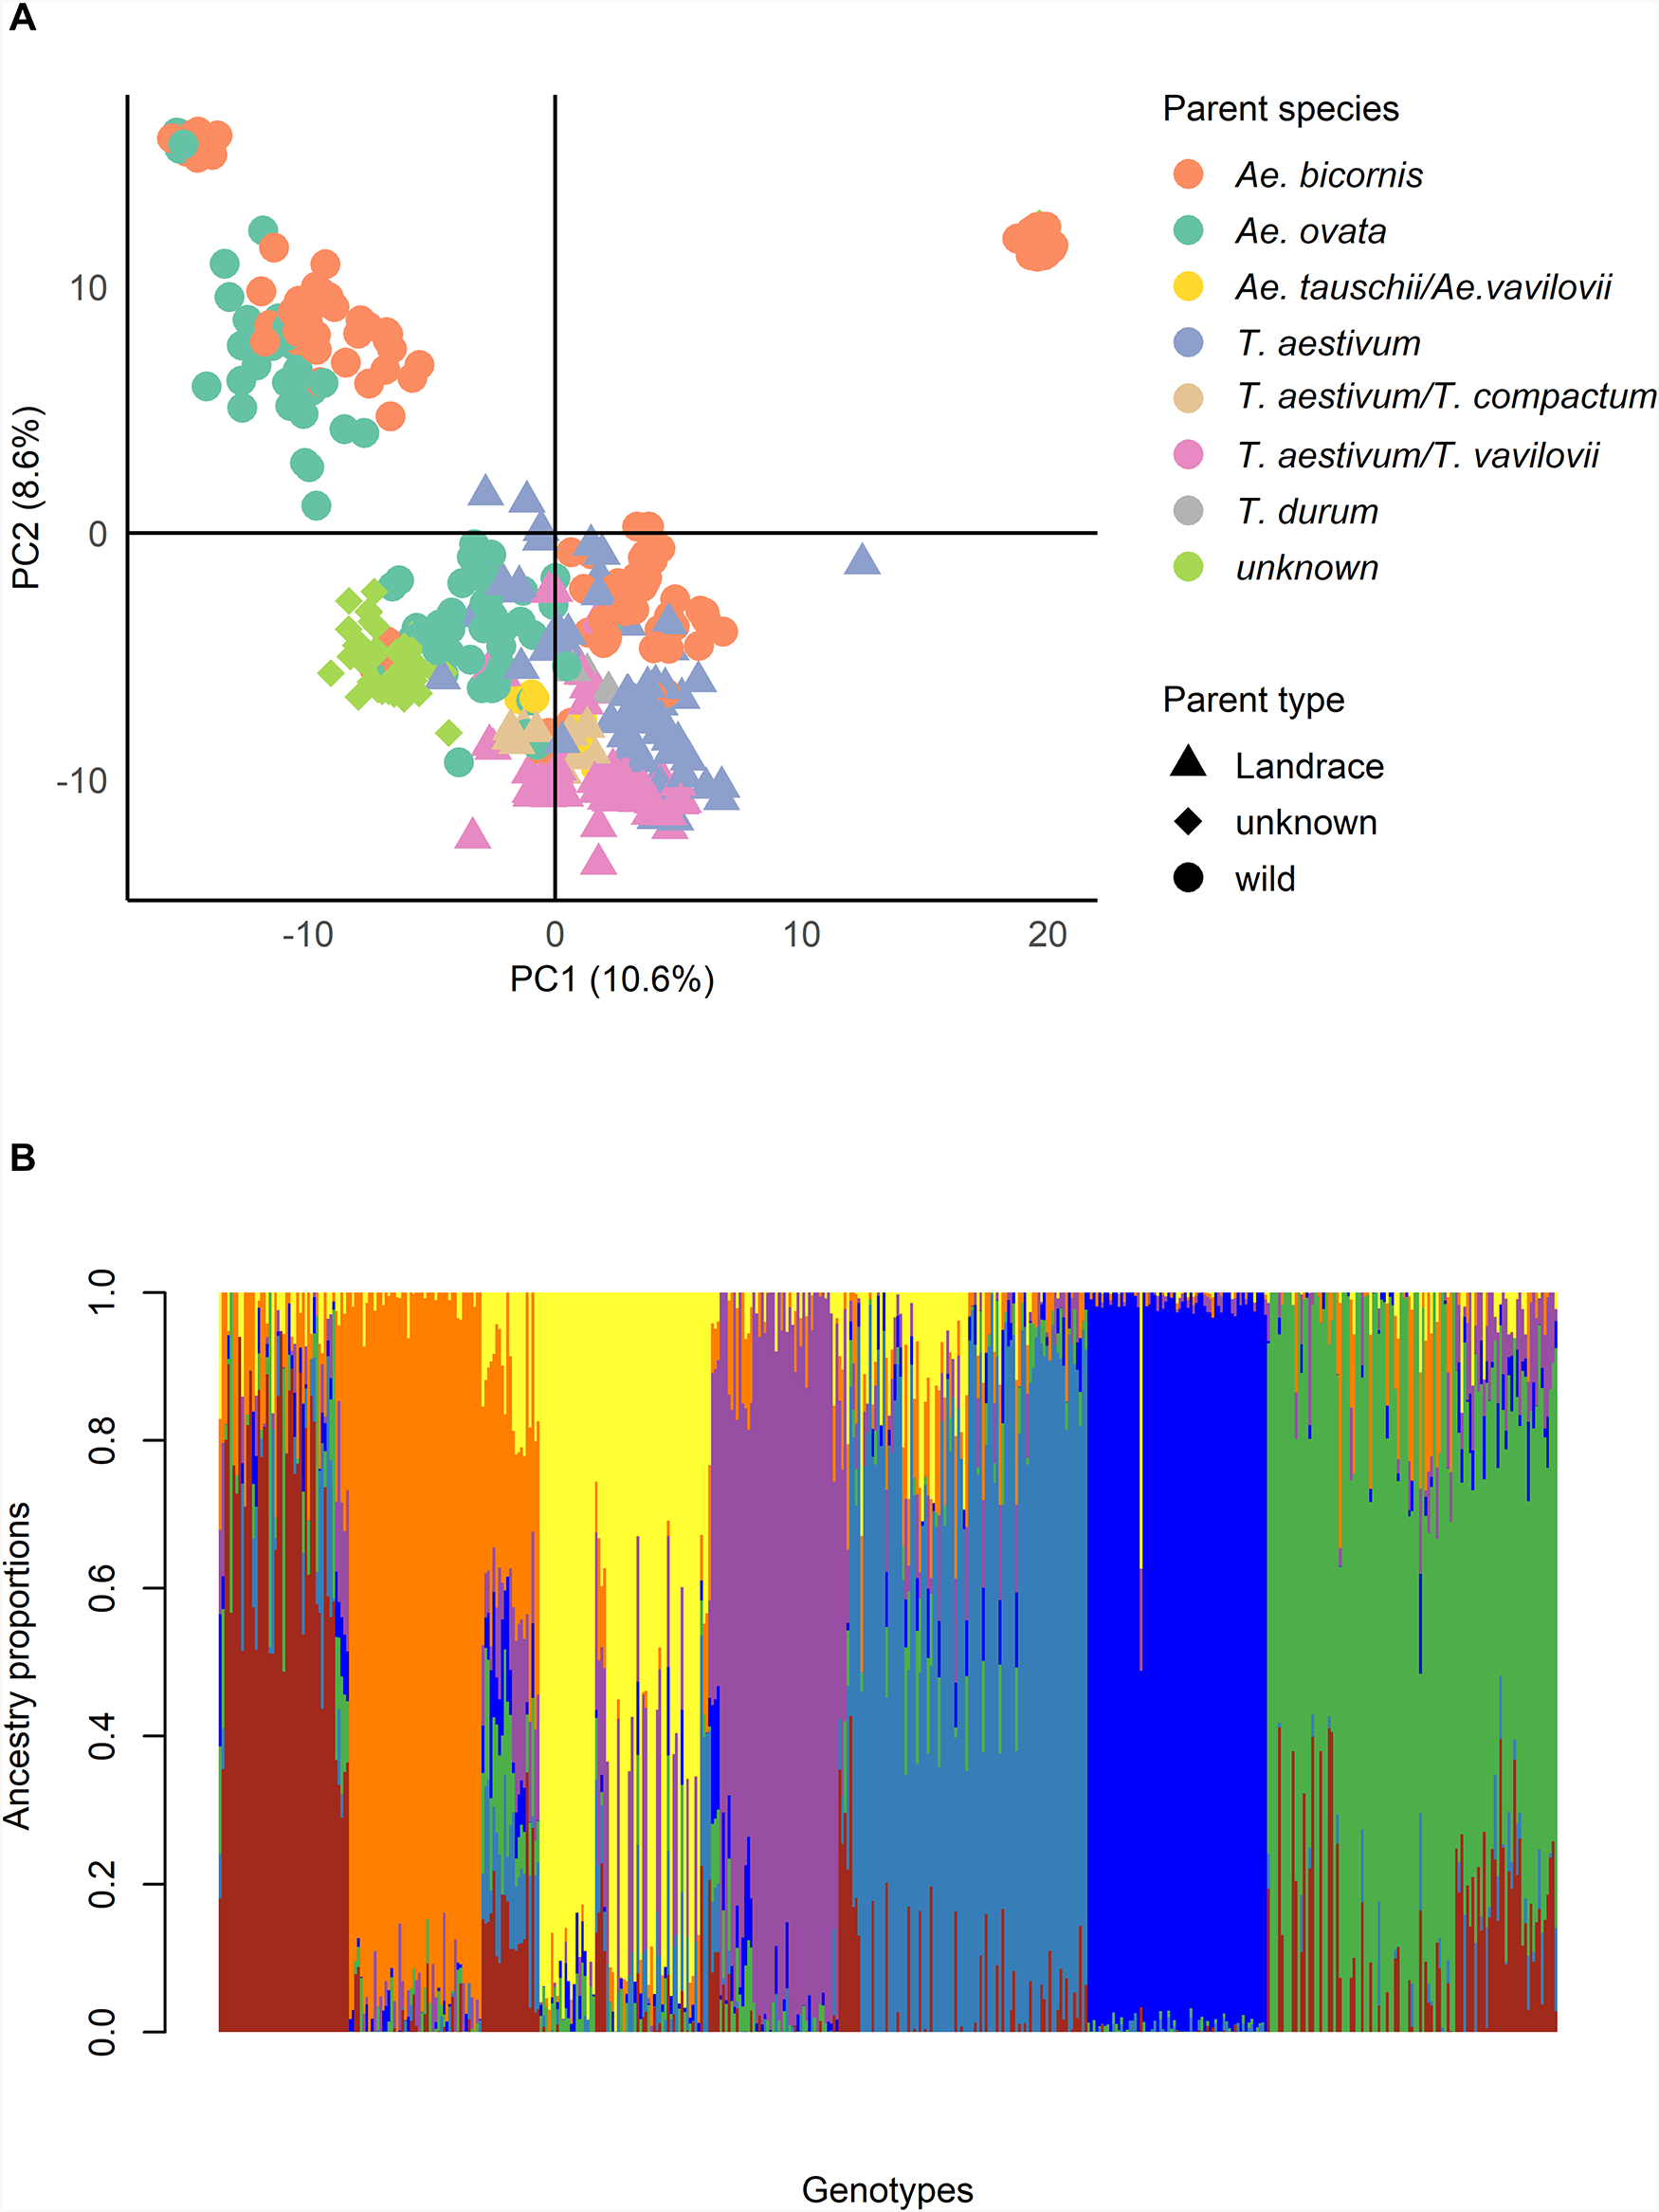
We conducted PCA using the filtered set of 2,633 DArTag markers to evaluate the genetic diversity of the 484 pre-breeding accessions. The first two principal component (PC1: 10.6% and PCA2: 8.6%) explained 19.2% of the total genomic variance and grouped the lines into four clusters (Fig. 2A). Cluster 1 consisted mainly of accessions derived from crosses with Ae. ovata and Ae. bicornis. While clusters 2 and 4 contained a mixture of lines, including lines from wild and elite varieties.
Population structure of 484 bread wheat pre-breeding lines. (A) Principal component analysis of 484 bread wheat pre-breeding lines. (B) Ancestry matrix of 484 bread wheat pre-breeding lines at K = 7. Each vertical bar represents one genotype, and the colours indicate the proportion of ancestry from each of the seven subpopulations.

Figure 2 Long description
The image A showing a scatter plot with the horizontal axis labeled PC1 (10.6 percent) and the vertical axis labeled PC2 (8.6 percent). The horizontal axis shows tick labels at minus 10, 0, 10 and 20. The vertical axis shows tick labels at minus 10, 0 and 10. A vertical line at PC1 equals 0 and a horizontal line at PC2 equals 0 divide the plot into four quadrants. Points are plotted using multiple marker shapes and multiple fill styles. A legend titled Parent species lists: Ae. bicornis; Ae. ovata; Ae. tauschii slash Ae. vavilovii; T. aestivum; T. aestivum slash T. compactum; T. aestivum slash T. vavilovii; T. durum; unknown. A second legend titled Parent type lists: Landrace; unknown; wild. The plotted points form several clusters. One cluster is concentrated at negative PC1 values around minus 12 to minus 6 and positive PC2 values around 4 to 12. Another dense cluster is concentrated near PC1 values around minus 4 to 4 and PC2 values around minus 10 to minus 2. A smaller group of points extends to positive PC1 values around 6 to 10 with PC2 values around minus 10 to minus 4. A single point appears at a high positive PC1 value near 18 and a positive PC2 value near 12. The image B showing a stacked bar chart with the vertical axis labeled Ancestry proportions and tick labels from 0.0 to 1.0. The horizontal axis label reads Genotypes. The plot contains many thin vertical stacked bars across the horizontal axis, with each bar segmented into multiple stacked sections that sum to 1.0. The bars form broad consecutive blocks where one segment occupies most of the bar height for many adjacent genotypes and other stretches where multiple segments share the bar height within the same genotype. Several bars include segments that reach close to 1.0 and many bars include mixed segments spread across the 0.0 to 1.0 range. Both graphs present genotype grouping patterns, with the scatter plot showing separation by PC1 and PC2 scores and the stacked bars showing per-genotype ancestry proportions.
Cluster 3 was composed mainly by accessions from crosses between Ae. bicornis and winter bread wheat breeding accession (GRISET9/5/VRZ/3/ORF1.148/TDL//BLO/4/PONY/OPATA/) as the elite parent. Additionally, this cluster includes six accessions that, according to the pedigree were derived from a cross between the mentioned winter wheat Ae. bicornis accession, back-crossed to the spring elite breeding accession 6920/6/F9.70/MAYA//4105W/3/PLK70/LIRA/4/88 ZHONG 257//CNO79/PRL/5/SB-360-1. Grouped with the winter material, suggesting the backcross was unsuccessful and showcasing the role of genotyping for pedigree validation in pre-breeding. Overall, the PCA indicates that both wild and elite parents influence the genetic diversity of the pre-breeding material(Fig. 2A).
The population structure of the pre-breeding population was further analysed using the sNMF algorithm, indicating the existence of 6–8 subpopulations (Supplementary Figures S2, S3 and S4).
Based on the conducted analysis, K = 7 was identified as the most suitable choice of number of subpopulations (Fig. 2B). At K = 7 as compared to K = 6, a distinct subpopulation comprising 48 lines emerged exclusively from crosses with Ae. ovata, highlighting a clear separation of genetic material and providing a coherent grouping with pedigree information. Furthermore, the subpopulations at K = 7 are distinct and interpretable on the basis of parental type and species, whereas at K = 8, the emergence of a small subpopulation with no biological relevance may be a sign of overfitting (Supplementary Figures S3 and S4).
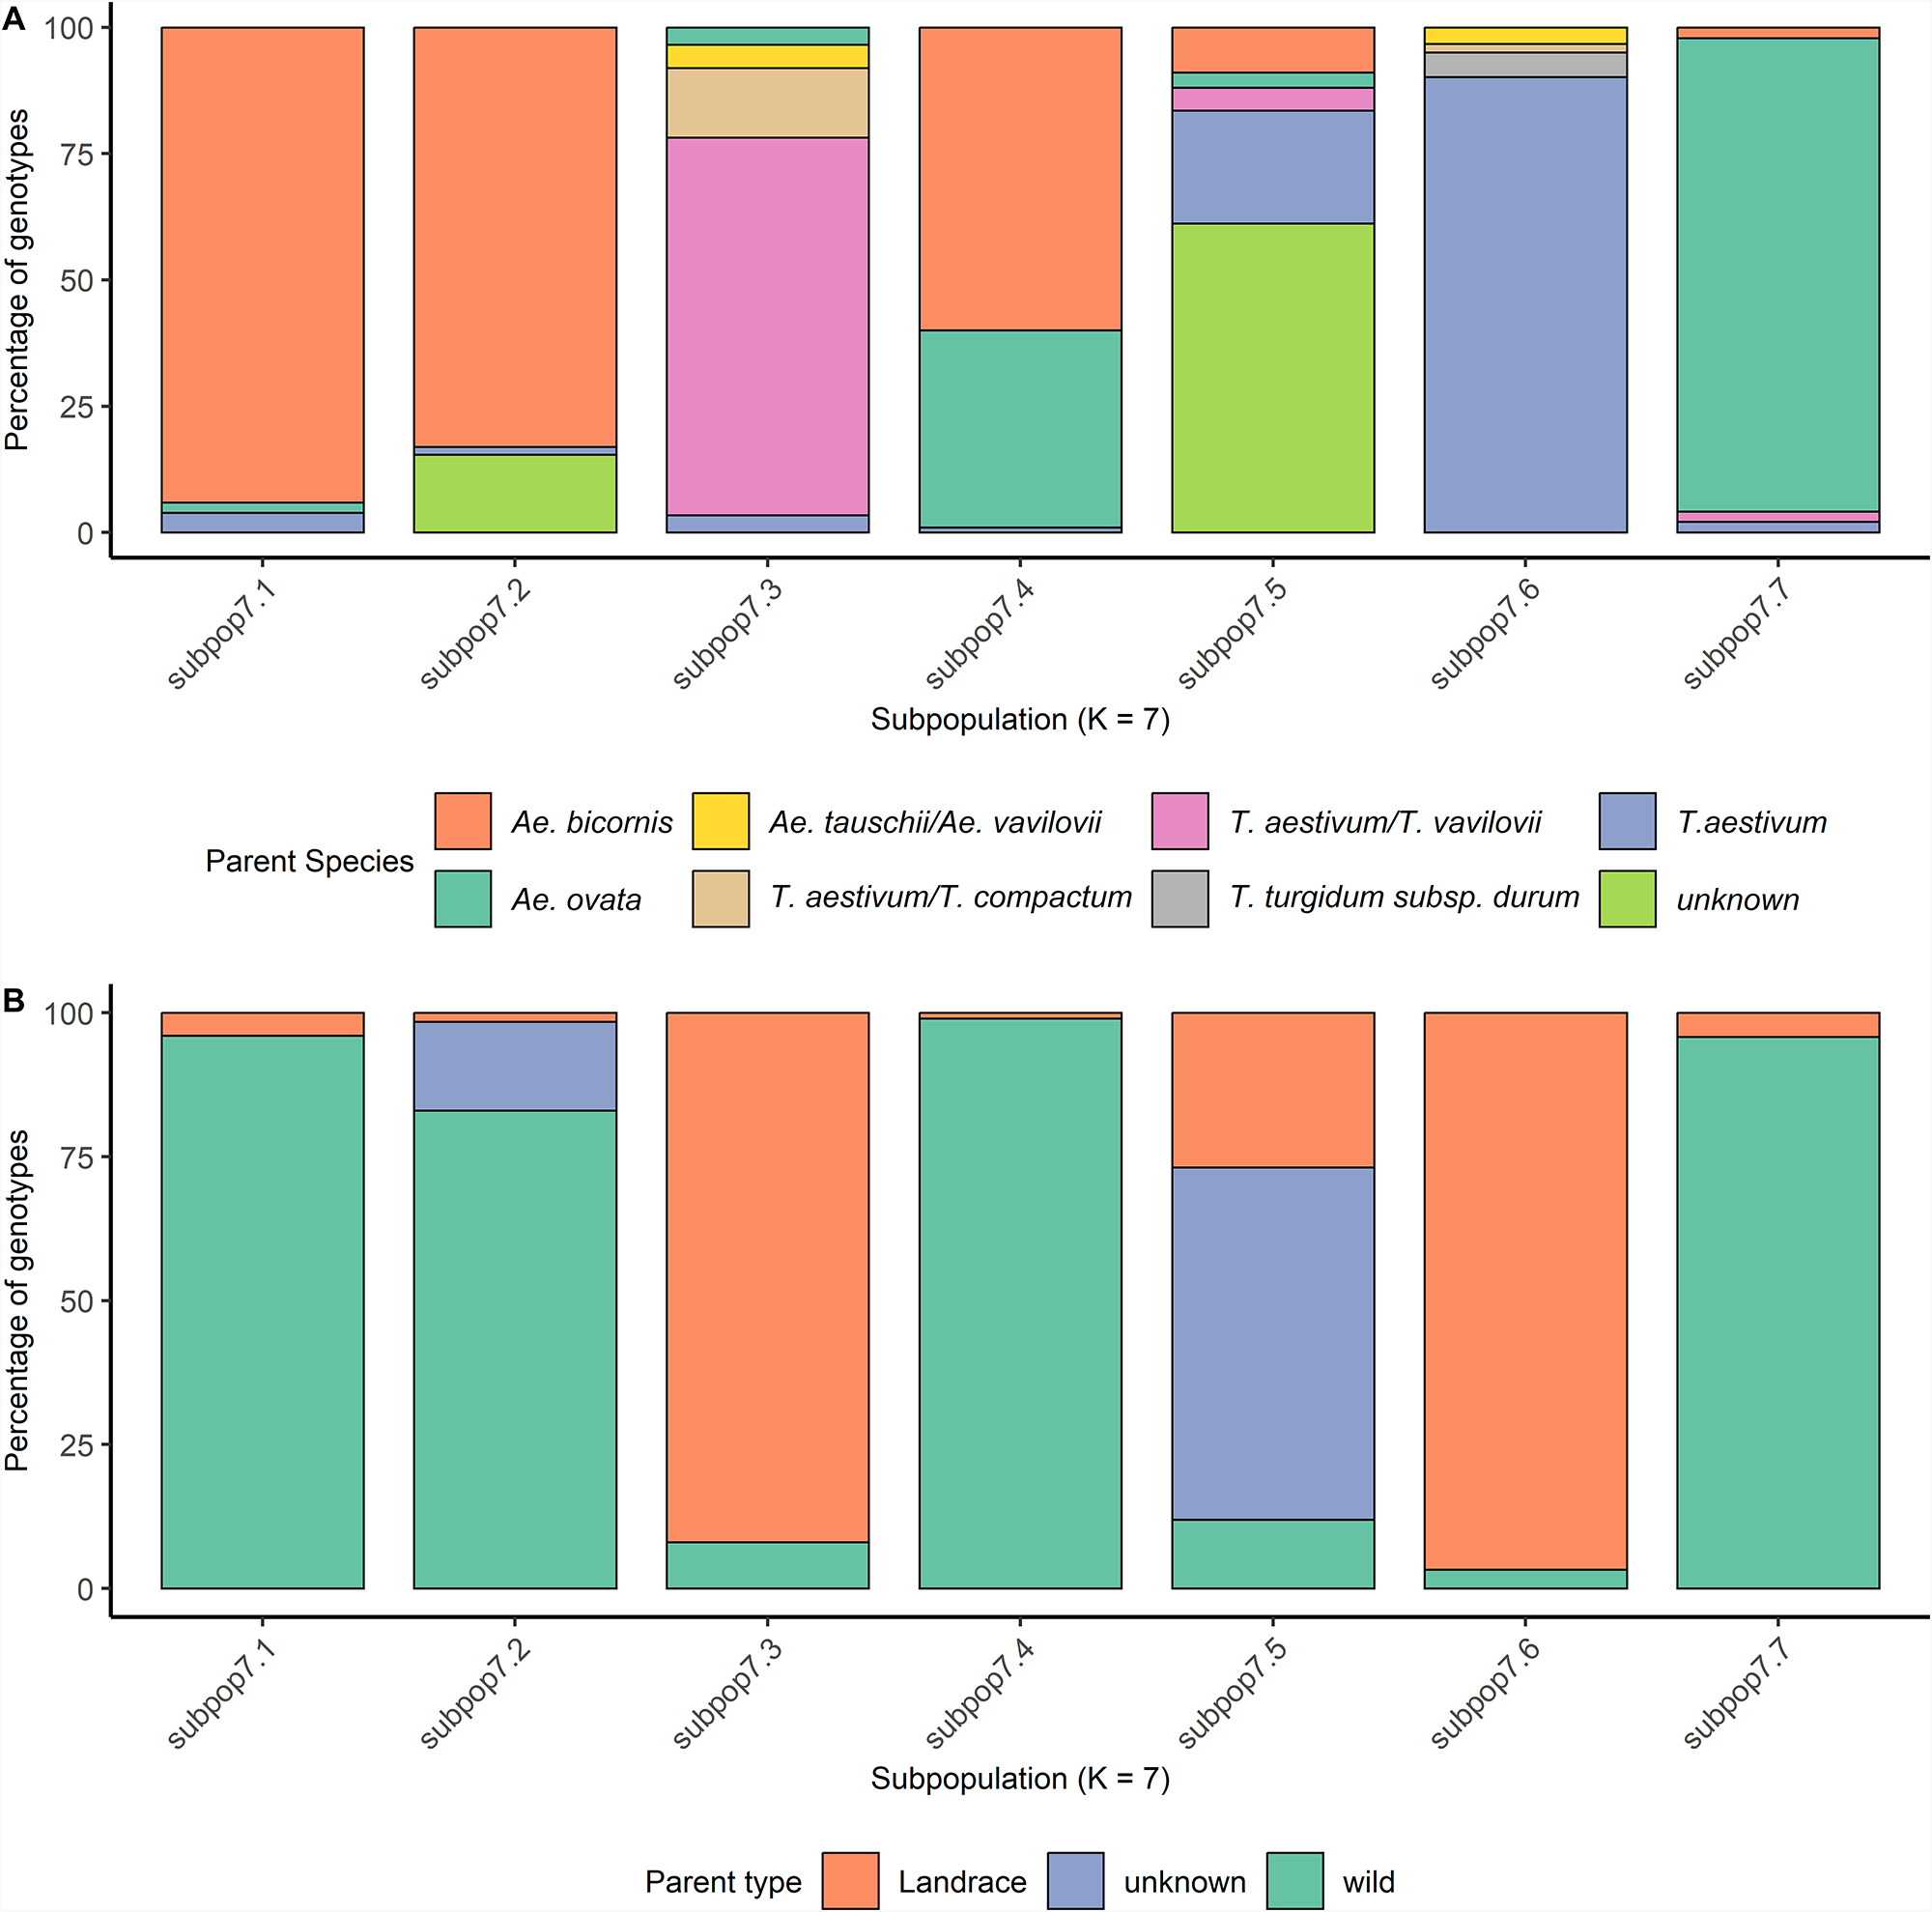
Based on the pedigree information, subpop7.1 included 50 genotypes, derived from crosses between the wild parent Ae. bicornis (IG47572, IG46854 and IG47620) and elite winter bread wheat lines, corresponding to cluster 4 identified in the PCA. Subpop7.2 consisted of 65 accessions, of which 83.07% resulted from crosses with Ae. bicornis (IG46854) and the elite winter bread wheat GRISET-9/5/VRZ/3/ORF1.148/TDL//BLO/4/PONY/OPATA, and the six lines with the same wild and elite parent but back-crossed to a spring variety, corresponding thus to PCA cluster 3 (Figs. 2A and 3). Subpop7.4 contained 105 lines that were also mostly derived from crosses to Ae. bicornis (IG47572 and IG47403; 60% of the sub-population), but the elite parent included accessions derived from durum varieties (Icaracha and Merzak) crossed to bread wheat lines (SERI.1B//KAUZ/HEVO, Najia and Demo 104; Fig. 3, Supplementary Table S1). In the same sub-population, there were also accessions derived from Ae. ovata (IGAECO96-21, IGAECO96-62 and IGAECO96-23) crossed with bread wheat Aguilal, Najia, Tilila and SERI-1B/KAUZ. The pedigree information thus suggests that sub-populations are defined by the wild parent as all three populations (subpop7.1, subpop7.2 and subpop7.4) contain accessions derived from Aegilops. However, the sub-populations are also heavily influenced by the elite parent, especially subpop7.4 demonstrates that accessions derived from two different wild species cluster together due to the similar elite parents in the pedigree. Subpop7.3 was predominantly (96.55%) composed of lines resulting from crosses with parents belonging to the Triticum genus (T. aestivum, T. aestivum subsp. compactum and Triticum vavilovii) to the Tunisian bread wheat varieties Florence, Aurore, Ariana 66, Haidra 99, Tahent and Utique. Subpop7.5 was composed of 61% accessions with unresolved pedigrees and 27% accessions from landraces crossed to the bread wheat varieties Nesma and Cham8, suggesting that the accessions with unresolved pedigrees were from landrace by elite crosses (Fig. 3, Supplementary Table S1). Subpop7.6 predominantly (96.72%) consisted also of accessions resulting from crosses with landraces; however, the elite parent used is a winter wheat accession. Subpop7.7, comprising 48 genotypes that were exclusively derived from crosses with Ae. ovata (IGAECO96-21 and IGAECO96-62), crossed to Faiza, Kharouba and Kanz (Fig. 3, Supplementary Table S1).
Percentage of parent types and parent species of the 484 bread wheat pre-breeding lines in subpopulations at K = 7. (A) Percentage of parent types in subpopulations at K = 7. (B) Percentage of parent specie in subpopulations at K = 7.

Figure 3 Long description
Panel A shows a stacked bar graph comparing parent species percentages across subpopulations (K = 7). The y-axis is labeled ′Percentage of genotypes′ with a range from 0 to 100. The x-axis lists subpopulations: subpop7.1 to subpop7.7. The legend identifies parent species: Ae. bicornis, Ae. ovata, Ae. tauschii/Ae. vavilovii, T. aestivum/T. vavilovii, T. aestivum/T. compactum, T. turgidum subsp. durum, T. aestivum and unknown. Subpop7.1 is dominated by Ae. bicornis, while subpop7.3 shows a mix with T. aestivum/T. vavilovii being prominent. Subpop7.4 has a notable presence of T. aestivum/T. compactum. Subpop7.5 and subpop7.6 show significant unknown species. Panel B presents a stacked bar graph comparing parent type percentages across the same subpopulations. The y-axis is labeled ′Percentage of genotypes′ with a range from 0 to 100. The x-axis lists subpopulations: subpop7.1 to subpop7.7. The legend identifies parent types: Landrace, unknown and wild. Subpop7.1 is dominated by wild types, while subpop7.3 shows a significant presence of landrace types. Subpop7.5 has a notable mix of unknown and landrace types. The graphs highlight the diversity and distribution of parent species and types across subpopulations, with Ae. bicornis and wild types being dominant in several subpopulations.
Furthermore, genetic variation between and within subpopulations was investigated using AMOVA. The results of the AMOVA for K = 7 are summarized in Table 1. AMOVA confirmed significant structure at K = 7, with 25.8% of variation explained between subpopulations, 16.1% between samples within populations and 58% within samples (Table1; Supplementary Figure S5).
AMOVA results for the genetic variation among and within populations for K = 7

Table 1 Long description
The table is intended to report an AMOVA partitioning of genetic variation among and within populations when the number of clusters is seven. It would normally list sources of variation and their associated degrees of freedom, sums of squares, and mean squares. However, no table values were provided, so the relative contributions of among-population versus within-population variation cannot be summarized or compared. Without the numeric entries, it is also not possible to identify which component is largest, whether variation is concentrated within populations, or whether among-population structure is substantial. Provide the table rows and numbers to generate an accurate, WCAG-compliant description of the key findings.
Note: Df: degrees of freedom; Sum Sq: sum of squares; Mean Sq: mean square.
Identification of potential introgressions from mid-density genotyping uncovers genetic differences within sub-populations
In addition to the results of our population structure analysis, we identify potential introgressions (PIs) by screening for blocks of consecutive missing markers, which may indicate genomic regions from crop wild relatives not captured by DArTag markers as the markers were designed to amplify in the wheat genome but not in wild relatives.
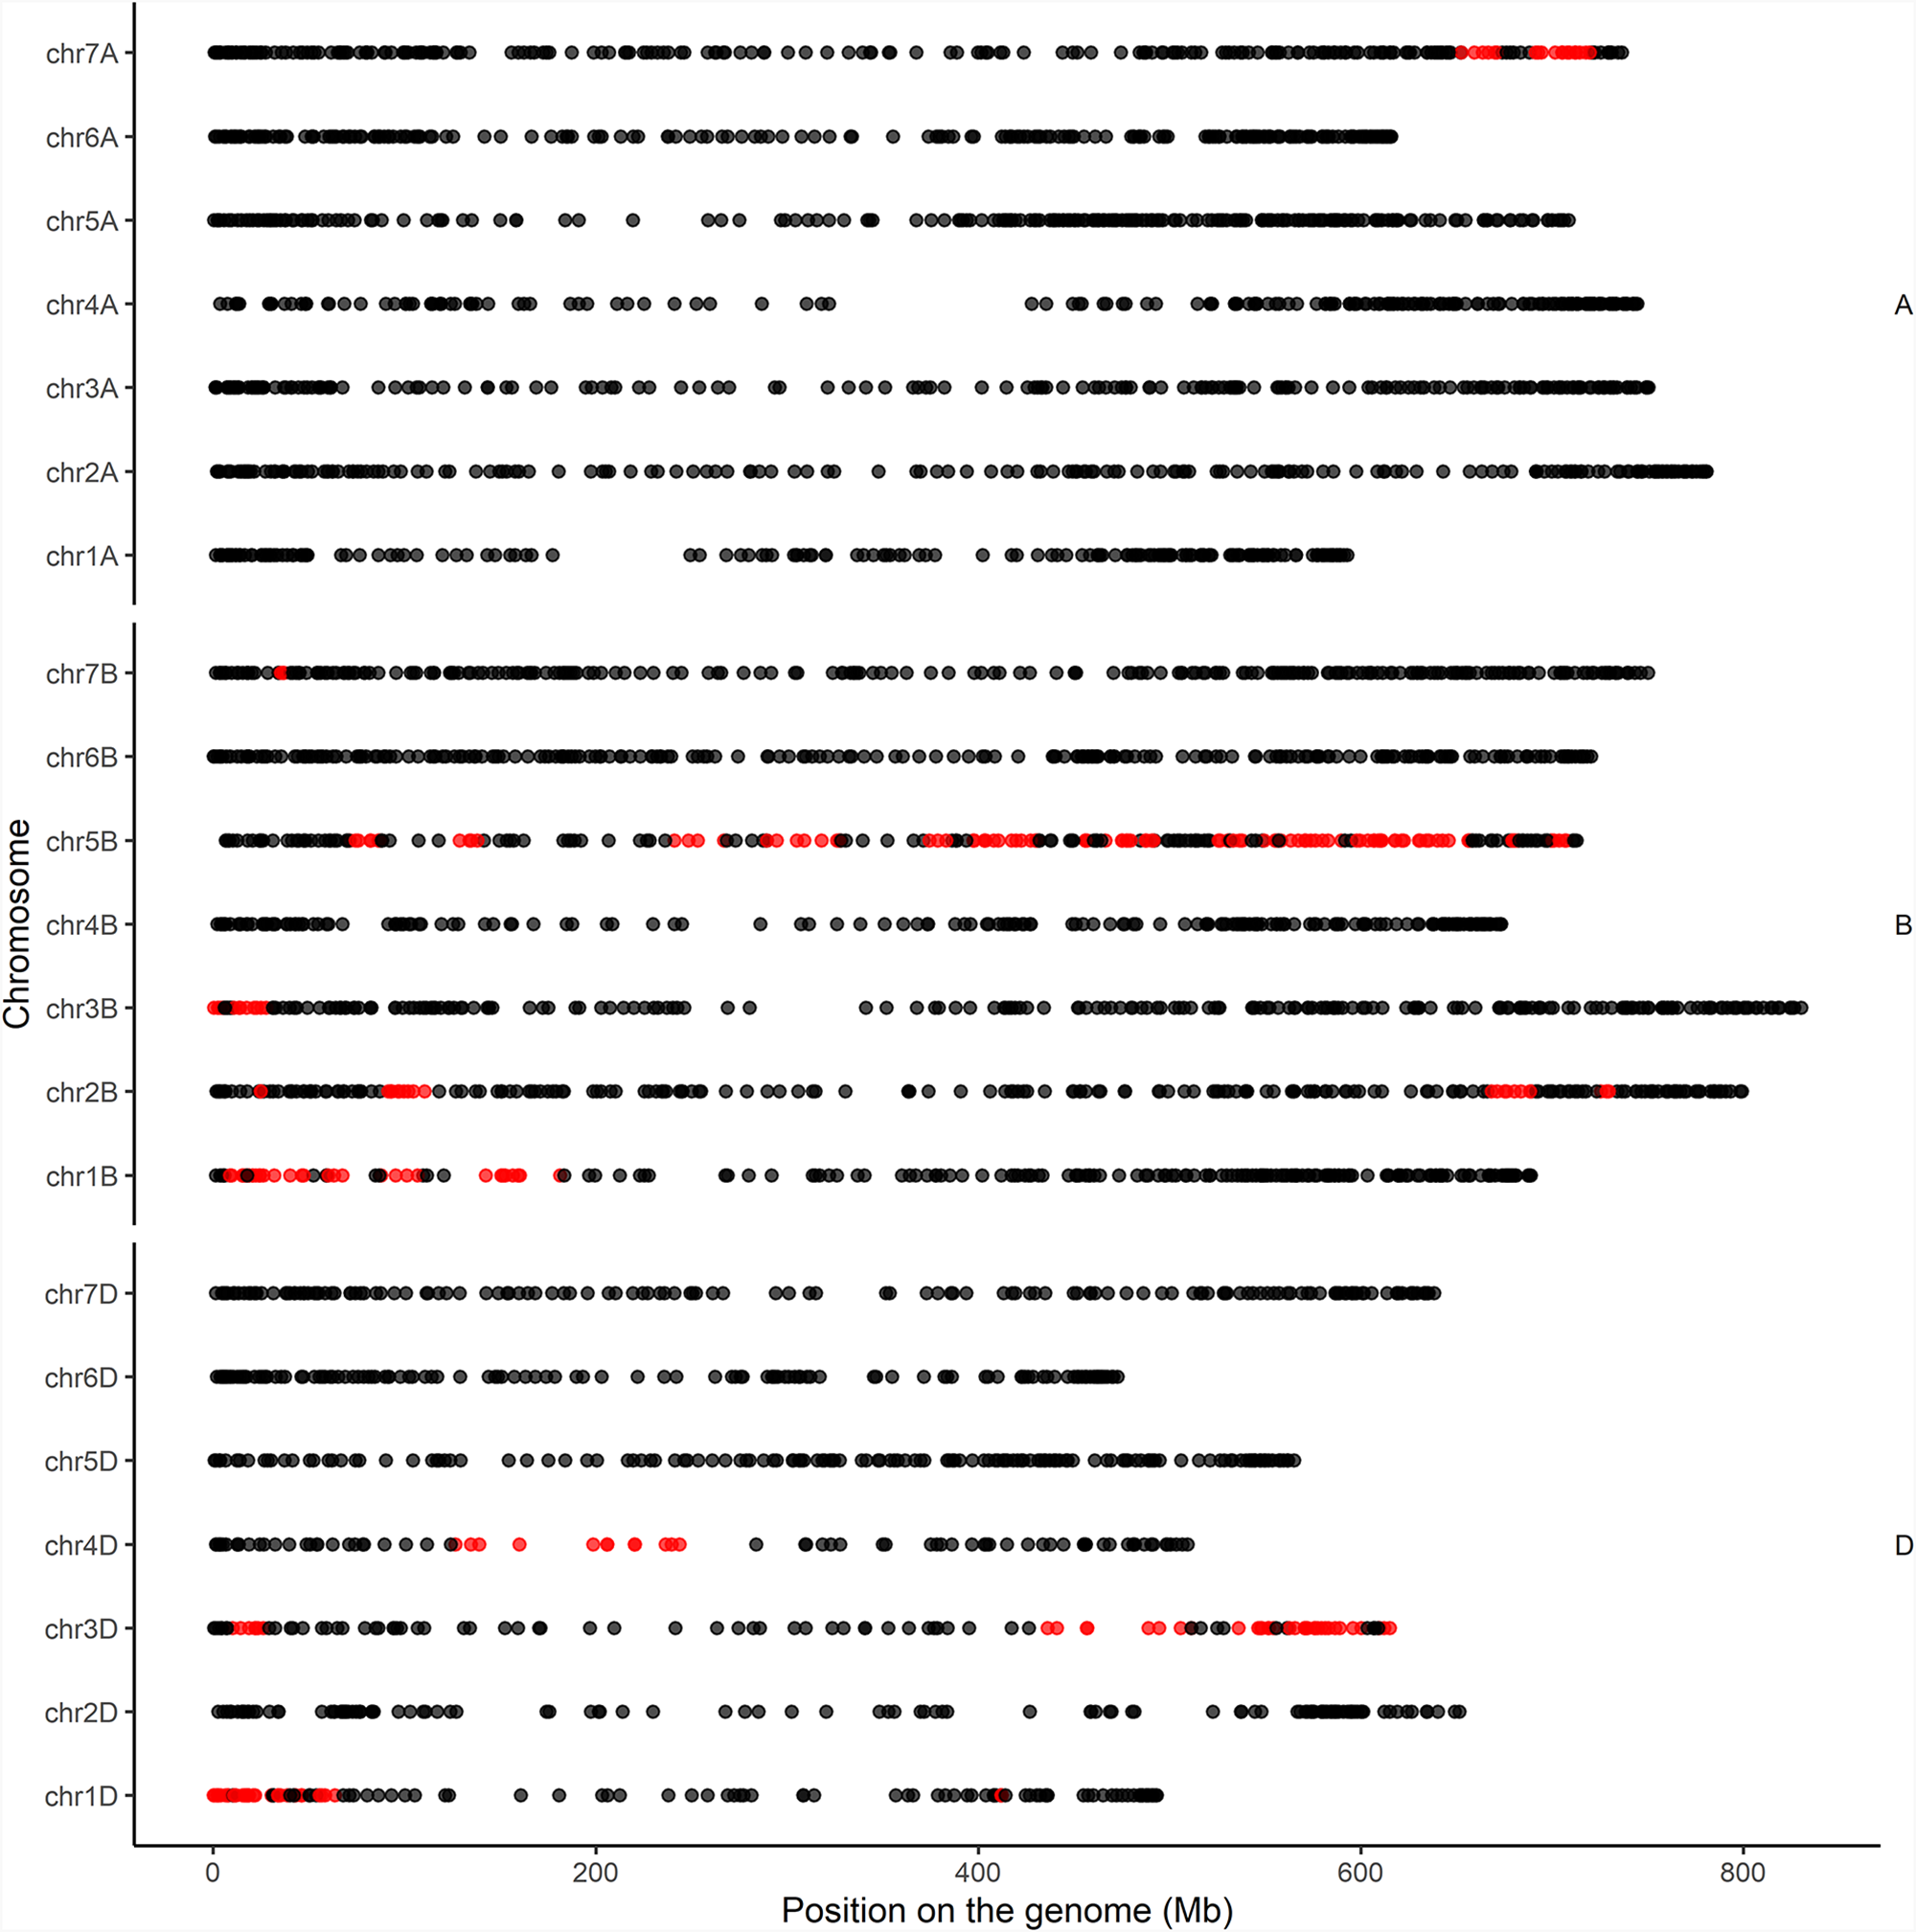
Searching for these PIs systematically, we gathered all regions with at least three consecutive markers missing and where the same block of missing data occurs in at least two accessions. We detected a total of 49 PIs (Fig. 4, Supplementary Table S4), which were predominantly identified in accessions derived from crosses with Aegilops species (98.97%). We detected PIs in accessions derived from crosses with Ae. ovata (29) in subpop7.4 and subpop7.7, Ae. bicornis (7) in subpop7.1, subpop7.4 and subpop7.5 and T. vavilovii (10) in subpop7.3, subpop7.5 and subpop7.6. In subpop7.4, accessions with the pedigree MERZAK/Ae. bicornis IG47403//Demo 104 share a potentially introgressed region from marker TaDArTAG006220 to TaDArTAG002597 on chromosome 3B with accessions of the pedigree MERZAK/Ae. bicornis IG47403//SERI.1B/KAUZ. As these accessions are all derived from the same original cross (Merzak by Ae. bicornis), this suggests that genetic material from Ae. bicornis was introgressed into the Merzak genome during cross-over in the meiotic division, which was retained in both top-crosses (with Demo and SERI.1B/Kauz). Of the 40 accessions derived from the original crosses, only 18 carried the PI while the other accessions had DArTag data for the three consecutive markers, supporting the idea that the missing data are not due to quality issues.
Distribution of DArTag markers across wheat chromosomes highlighting potential introgressions. Markers are presented along chromosomes grouped by genome (A, B and D). Red points indicate the position of markers within introgressed regions; black points represent non-introgressed markers. Genomic positions are in megabases (Mb).

Figure 4 Long description
A scatter plot with the horizontal axis labeled Position on the genome (Mb). Tick labels shown are 0, 200, 400, 600 and 800. The vertical axis is labeled Chromosome. The chromosome labels shown are chr7A, chr6A, chr5A, chr4A, chr3A, chr2A, chr1A, chr7B, chr6B, chr5B, chr4B, chr3B, chr2B, chr1B, chr7D, chr6D, chr5D, chr4D, chr3D, chr2D and chr1D. Each chromosome label has a horizontal row of circular markers spread across the genome position axis. Most markers are black and some markers are red. Red markers appear in multiple rows, including a cluster near the far right end of chr7A, multiple red markers spread across chr5B and several red markers on chr1B and chr2B. Red markers also appear on chr1D and chr3D, including a group on chr3D around the mid to right portion of the axis. The plot includes the letters A, B and D placed to the right of the corresponding chromosome groups.
Additionally, 8 (out of 14) accessions with the pedigree MIKI3/Ae. ovata IGAECO96-62//Kharouba and (6 out of 13) accessions MIKI3/Ae. ovata IGAECO96-62//Kanz carried a PI in chromosome 3D (TaDArTAG002861-TaDArTAG002868), suggesting a similar inheritance of a PI as described above. Among eight accessions resulting from crosses with Ae. ovata IGAECO96-62 (pedigree: MIKI3/Ae. ovata IGAECO96-62//Kharouba), all carried PI in chromosome 1D, 3D and 4D. However, three of these accessions (GWP2101873, GWP2100307 and GWP2100349) carried only the PI in chromosome 4D (Fig. 4, Supplementary Table S4).
Accessions with and without the PI clustered closely together as the genome wide differences between them are only marginal and could not be detected with these methods. However, introgressions from the wild can have substantial phenotypic effects and are highly interesting to pre-breeding (Boehm & Cai, Reference Boehm and Cai2024; Heuberger et al., Reference Heuberger, Koo, Ahmed, Tiwari, Abrouk, Poland, Krattinger and Wicker2024). Our analysis suggests that clustering based only on genome-wide differences to form core collections is not advisable when working with pre-breeding material derived from crop wild relatives. The information of PI allows us furthermore to link specific phenotypic variations to introgression once the accessions are evaluated phenotypically and thus measure the benefit of each introgression in comparison to the sister line. The information on PIs can thus help to reduce population size during population advancement, focusing on retaining as many introgressions in the smallest possible population size.
A considerable proportion of markers in these introgressed regions are linked to key traits, including rust resistance, grain yield, heat tolerance and grain quality. This indicates that introgressions could be valuable for breeding programs aimed at improving the adaptability and productivity of wheat under various environmental conditions. Furthermore, the stability of these introgressions across accessions implies that they could be reliable targets for MAS, which could accelerate the development of improved wheat varieties with the desired introgression.
Genetic diversity between sub-populations identifies Ae. ovata-derived material as most diverse
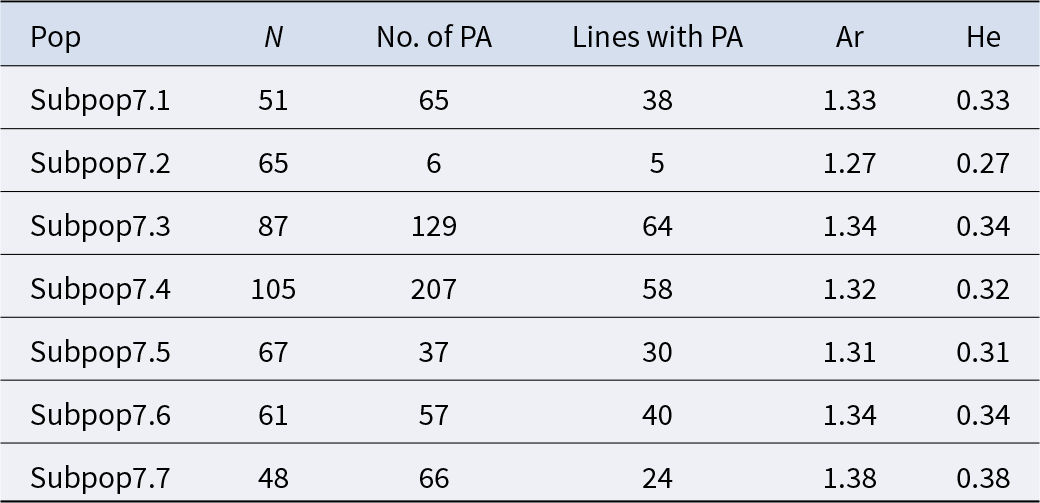
Genetic diversity ranged from 0.27 to 0.34 for the seven subpopulations (Table 2). The highest count of PAs was found in subpop7.4 and subpop7.3 with 207 and 129 PAs, respectively. These two subpopulations were the ones with the largest number of genotypes.
Population genetics parameters among subpopulations at K = 7

Table 2 Long description
The table is meant to report population genetics parameters for subpopulations defined under a seven group clustering. For each subpopulation, it would typically list the number of genotypes sampled, the count of alleles unique to that subpopulation, allelic richness as a standardized measure of allele diversity, and Nei’s unbiased gene diversity as a measure of genetic variation. These columns would allow comparisons of which subpopulations have larger sample sizes, more unique alleles, higher allelic richness, or higher gene diversity. However, no table entries were provided, so specific values, rankings, or trends cannot be described. If you share the table data, the can summarize the highest and lowest groups and any notable contrasts while noting any limitations due to unequal sample sizes.
Note: N: number of genotypes; PA: private allele; Ar: allelic richness; He: Nei’s unbiased gene diversity.
Subpop7.4, which is composed of diverse crosses involving both, Ae. ovata (IGAECO96-62, IGAECO96-21 and IGAECO96-23) and Ae. bicornis (10.18730/7NS17 and 10.18730/7NRP∼), displayed a wide variation in PAs, ranging from 1 PA per accession to as many as 10 in the accession GWP2100412 with the pedigree Aguilal/Ae. ovata IGAECO96-21//Aguilal. The diversity of parental lines in this subpopulation, combining genetic material from wild relatives with traditional farmer varieties (Aguilal, Najia, Icaracha, Merzak and MIKI3), likely contributed to the high number of PAs. This suggests that the integration of wild species with locally adapted varieties can introduce unique genetic variations that may be beneficial if large population sizes for each cross are maintained (Supplementary Table S5). While subpop7.3 was primarily composed of genotypes resulting from crosses involving T. vavilovii, this subpopulation included 64 genotypes with PAs, ranging from 1 allele found in 5 genotypes derived from crosses like T. aestivum subsp. aestivum (DOI:10.18730/9J03Z)/T. vavilovii (DOI:10.18730/9HE6D)//T. aestivum subsp. aestivum (DOI:10.18730/9J58B) to 4 PAs identified in 3 lines from crosses involving T. aestivum subsp. aestivum (DOI: 10.18730/9J3M∼)/T. vavilovii (DOI: 10.18730/9HE6D)//T. aestivum subsp. aestivum (DOI: 10.18730/9HWX3; Supplementary Table S5). The presence of these PAs, particularly in genotypes derived from multiple crosses with T. vavilovii, indicates that such combinations may be effective in introducing unique genetic variations without use of crop wild relatives. This genetic diversity could be biologically significant for breeding programs focused on enhancing diversity per se (Supplementary Table S5).
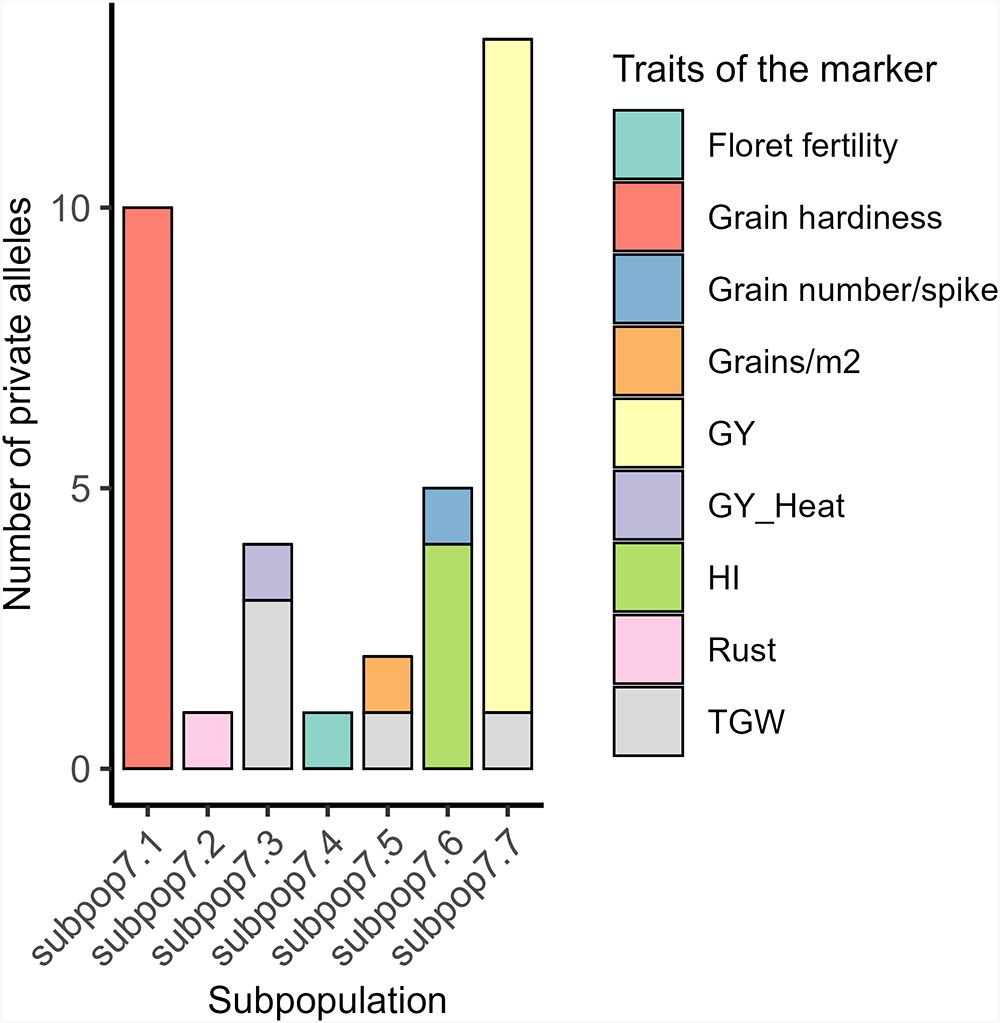
Despite having the lowest number of genotypes (48), subpop7.7 exhibited the highest unbiased Nei genetic diversity (He = 0.38) and allelic richness (1.38), with 66 PAs identified, 6 of which are associated with grain yield (Fig. 5). This higher diversity in subpop7.7 is likely due to its exclusive composition of genotypes derived from crosses with Ae. ovata (IGAECO96-21 and IGAECO96-62) and different farmer varieties such as Aguilal, Kanz, MIKI3, Najia, Arrehane, Merzak, Faiza, Kharouba, Najia and Rajae (Fig. 5). Whereas 65 PAs were found in subpop7.1 with 10 related to grain hardiness (Fig. 5), subpop7.2, which consisted of 65 genotypes with 83.07% resulting from crosses with Ae. bicornis (DOI: 10.18730/7NQMU), showed the lowest values in terms of PAs (6) with one related to rust, allelic richness (1.27) and genetic diversity (He = 0.27).
Total private alleles by subpopulation and trait at K = 7. GY: grain yield; GY_Heat: grain yield under heat stress; HI: harvest index; TGW: thousand grain weight.

Overall, these results indicate comparatively better diversity in subpop7.7 that was predominantly composed of crosses with the wild parents Ae. ovata (IGAECO96-21 and IGAECO96-62) crossed to Faiza, Kharouba and Kanz.
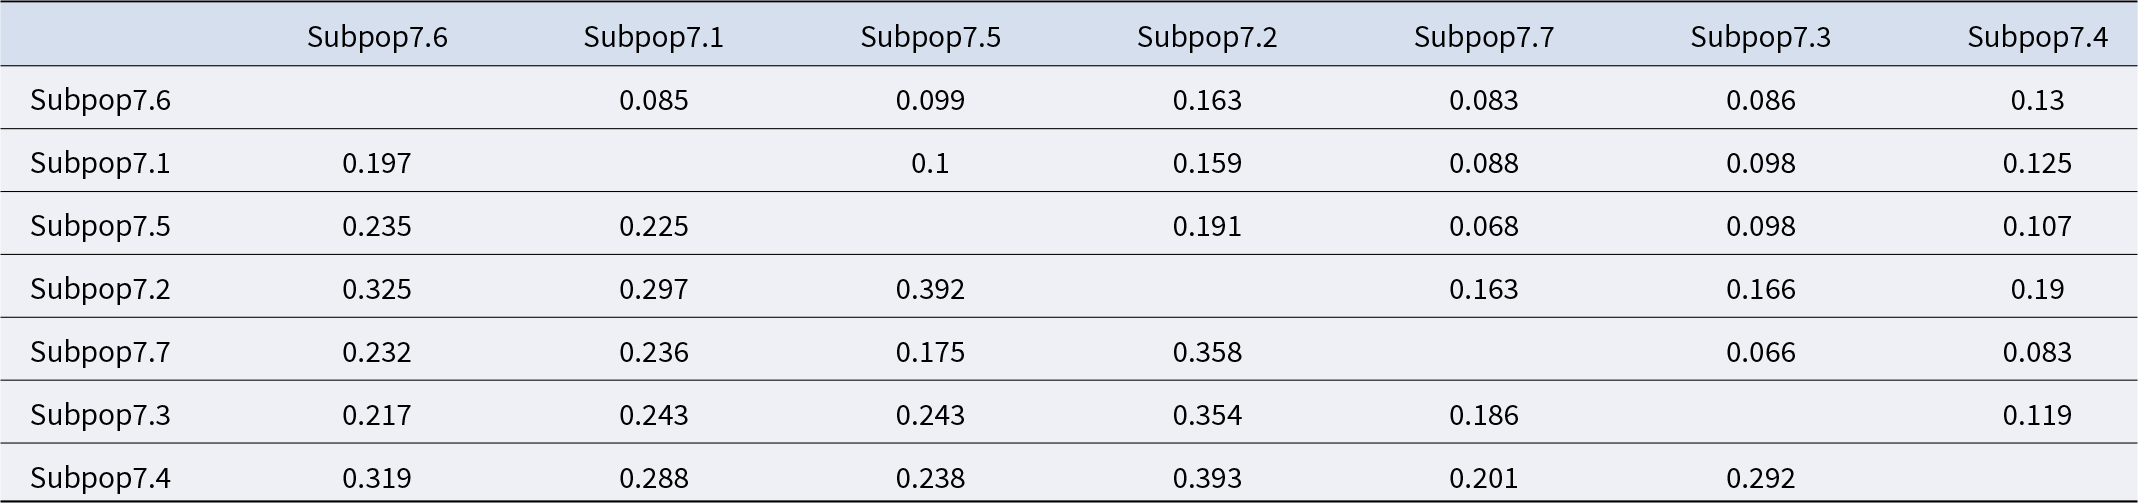
The population differentiation matrix gives insights into the genetic structure of the seven subpopulations of pre-breeding bread wheat lines (Table 3). The Nei genetic distance values, shown below the diagonal, indicate that subpop7.2 is the most genetically distinct, with values ranging from 0.297 (with subpop7.1) to 0.393 (with subpop7.4). On the other hand, subpop7.5 and subpop7.7 have smaller genetic distances of 0.068, suggesting a closer genetic relationship. The F ST values, shown above the diagonal, underline this differentiation even more. Subpop7.2 has higher F ST values, of 0.191 (with subpop7.5) and 0.166 (with subpop7.3), indicating significant genetic differentiation. In contrast, subpop7.7 has lower F ST values with several subpopulations, such as 0.066 (with subpop7.3) and 0.083 (with subpop7.6), reflecting less genetic differentiation.
Population differentiation matrix of bread wheat pre-breeding lines based on Nei’s genetic distance (below the diagonal) and pairwise F ST values (above the diagonal)

Table 3 Long description
The table is a square comparison matrix for multiple bread wheat pre-breeding lines. For each pair of lines, it reports two related measures of genetic separation: Nei’s genetic distance in the lower half of the matrix and pairwise FST in the upper half. Reading across a row and down a column gives the distance and differentiation between one line and every other line. Larger values in either half indicate greater genetic divergence, while smaller values indicate closer genetic similarity. Because the numeric entries are not provided here, specific highest or lowest pairs, clusters of similar lines, and overall ranges cannot be described. Interpret comparisons cautiously, since the two measures are on different scales and should be compared within their own half of the matrix rather than directly across halves.
DArTag genotyping can be used to assemble smaller trait-specific subsets that capture full population diversity of target traits
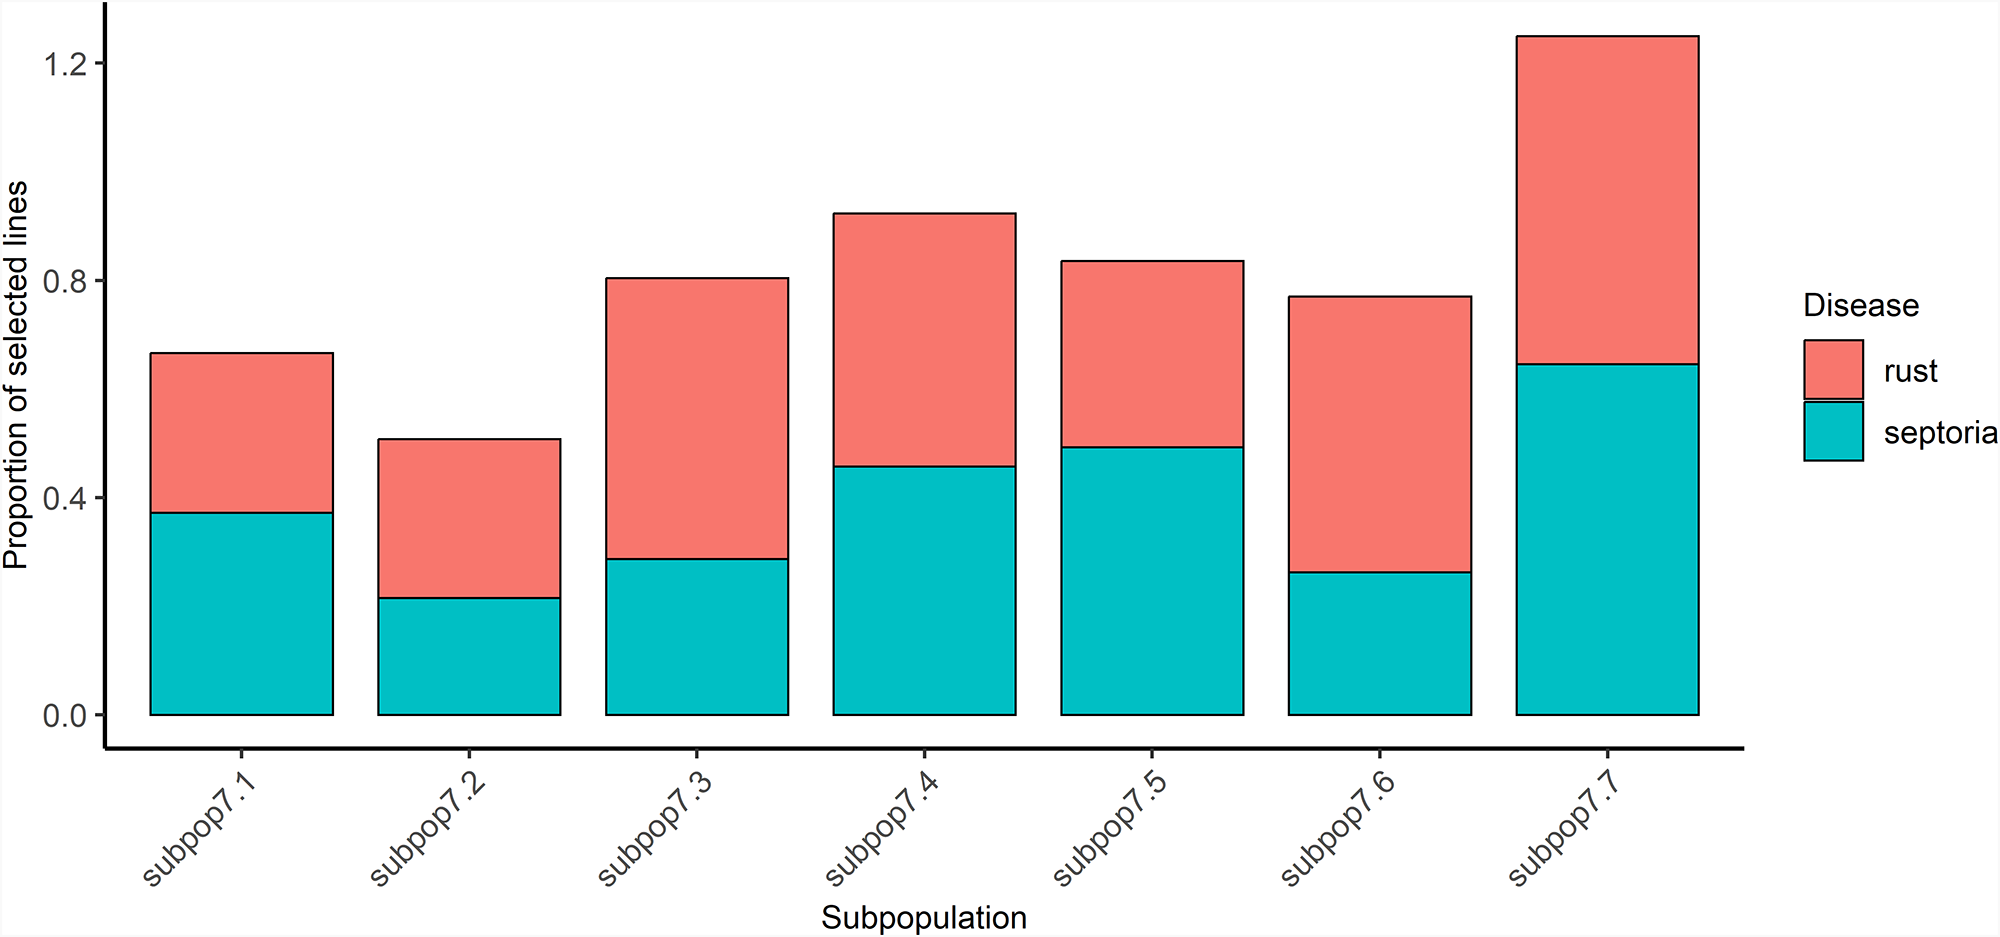
One benefit of the DArTag mid-density marker set is its inclusion of several markers linked to known genes and QTLs for a range of phenotypes. By using this information, we examined the 6 known markers associated with septoria and 11 with rust resistance (CGIAR Excellence in Breeding 2024). We systematically analysed markers for resistance to rust and septoria in order to identify genetic variation within each cross. For each pedigree, we defined the allele combinations of markers linked to each disease (septoria and rust) in order to represent genetic variation in our material. Based on these combinations and the number of lines having each combination, we selected the minimum number of lines needed to capture at least one representative of each unique haplotype (allele combination) in a new subset. Figure 6 illustrates the distribution of selected lines among groups and pedigrees (see Supplementary Table S6). Notably, subpop7.4 and subpop7.7 exhibited higher percentages (more than 46%) of selected lines for either septoria and rust markers, suggesting that the population has particularly high genetic variation for the two traits of interest. In contrast, subpop7.2 displayed a lower proportion of lines selected for septoria and rust. Overall, our methodology enabled us to select 189 (39% of the population) lines with unique haplotypes associated with septoria resistance and 270 (56% of the population) lines with unique haplotypes linked to rust resistance, allowing us to capture the complexity of the allelic compositions present in the whole panel within much smaller sub-panels. This selection approach could lead to more cost-effective and more traits targeted evaluation of pre-breeding populations. For instance, for septoria, the evaluation of only 40% of the initial population would be sufficient to assess all possible unique septoria haplotypes.
Proportion of selected lines in subpopulations at K = 7 for rust and septoria markers.

Interestingly, in some cases, specific gene-based resistance gene markers segregated within a sister-line population between a known allele and an unknown one. For example, 15 accessions all with the same pedigree had either the allele ‘1’ for marker TaDArTAG000180 or the marker did not amplify, suggesting that there could be a new allele present in these accessions. Therefore, it would be highly valuable to prioritize the phenotypic assessment of these accessions to explore if the unknown allele harbours a novel resistance gene.
Discussion
This study demonstrated the relevance of DArTag technology as a reliable and cost-effective tool for assessing the diversity within and between accessions from crosses between gene bank material including wild parents and elite varieties. This technique yielded a large number of polymorphic and informative markers spread in the A (39.1%), B (43.8%) and D (17.1%) genomes allowing high coverage of the genomes of the bread wheat pre-breeding lines compared to other molecular techniques used previously for wheat cultivar, landraces and advanced lines (Winfield et al. Reference Winfield, Allen, Burridge, Barker, Benbow, Wilkinson, Coghill, Waterfall, Davassi, Scopes, Pirani, Webster, Brew, Bloor, King, West, Griffiths, King, Bentley and Edwards2016; Ul Islam et al. Reference Ul Islam, Mir, Dar, Khan, Shikari, Sofi, Mohiddin, Ahangar, Jehangir, Kumar, Singh and Wani2023; Uddin et al. Reference Uddin, Islam and Halimuzzaman2024). The large coverage of the genomes can serve to undertake association mapping in the studied germplasm, including finding new allelic variations for major pre-breeder and breeders sought traits such as QTLs corresponding to yield component, protein content, salinity tolerance and disease resistance (L. Chou et al. Reference Chou, Lin, Wen and Tung2022; Tyrka et al. Reference Tyrka, Krajewski, Bednarek, Rączka, Drzazga, Matysik, Martofel, Woźna-Pawlak, Jasińska, Niewińska, Ługowska, Ratajczak, Sikora, Witkowski, Dorczyk and Tyrka2023; Chen et al. Reference Chen, Tao, Song, Liu, Tong, Ning, Zou, Fu, Zhang, Gao and Zhu2025). Mid-density DArTag technology along with other high throughput and genotyping by sequencing molecular techniques are increasingly used to study the genetic diversity of different crops as they allow to study the genetic diversity of large number entries and complex genomes with low-cost (T. Chen et al. Reference Chen, Tantasawat, Wang, Gao and Zhang2018; Nadeem et al. Reference Nadeem, Nawaz, Shahid, Doğan, Comertpay, Yıldız, Hatipoğlu, Ahmad, Alsaleh, Labhane, Özkan, Chung and Baloch2018; Ongom et al. Reference Ongom, Fatokun, Togola, Garcia-Oliveira, Ng, Kilian, Lonardi, Close and Boukar2024).
The PIC is widely used in population genetics studies because it provides information about the variability and frequency of different alleles within a population (Botstein et al. Reference Botstein, White, Skolnick and Davis1980). In our study, 76% of markers had values above 0.25, with an average of 0.28, which is consistent with previous studies using the DArTag and various marker panels for triticale and wheat accessions (Badea et al. Reference Badea, Eudes, Salmon, Tuvesson, Vrolijk, Larsson, Caig, Huttner, Kilian and Laroche2011; Novoselović et al. Reference Novoselović, Bentley, Šimek, Dvojković, Sorrells, Gosman, Horsnell, Drezner and Šatović2016).
While the mid-density DArTag panel for bread wheat offers a practical and cost-effective method for quality control, diversity analysis and GS, as well as for integrating markers linked to QTLs, genes and quality control in order to balance genome coverage with trait relevance, its lower marker density compared to high-density panels limits its resolution for accurate mapping or the discovery of new variants (CGIAR Excellence in Breeding 2024). On the other hand, the 35K Axiom platform and other high-resolution arrays offer better interpretation of studies due to reduced missing data and greater uniformity for population structure analysis and GWAS analysis, as well as broader genomic coverage (Kumar et al. Reference Kumar, Chhokar, Sheoran, Singh, Sharma, Jaiswal, Iquebal, Jaiswar, Jaisri, Angadi, Rai, Singh, Kumar and Tiwari2020; Wang et al. Reference Wang, Tian, Ma, Liu, Zhang, Chen, Shahinnia and Yang2022). The ideal panel could be further optimized to specifically mark SNPs across all Triticum and Aegilops lines, although this requires a lot of work and is not necessary for most breeding programmes. As a practical alternative, the use of mid-density panels, such as DArTag in parallel with parental genotyping, may offer a balance between cost, resolution and forward analysis performance.
In our study, population structure analysis using PCA revealed the genetic relationships between accessions, identifying four groups within the 484 bread wheat pre-breeding lines. A distinct cluster (3) was created by all accessions derived from winter wheat by Ae. bicornis crosses. However, within this cluster were also six accessions, which according to their pedigree were derived from crossing the winter Ae. bicornis to spring bread wheat varieties. The PCA results suggest that in these six cases the cross failed and the pedigree should be corrected. Another nine accessions derived from the same spring × (winter × Ae. bicornis) crosses were assigned to cluster 4 and 2, which otherwise contained spring wheat × Ae. bicornis crosses, suggesting that these were successful top-crosses. Furthermore, in 51 accessions, the information on what gene bank species had been used was lost in the pedigree. All clustered with other accessions derived from crosses with landraces, suggesting that the 51 unresolved accessions were derived from landrace crosses as well. Population structure analysis using the sNMF algorithm enabled us to identify seven distinct subpopulations, four of them composed mainly of crosses with the wild parents Ae. bicornis and Ae. ovata. In particular, the analysis revealed that the subpop7.1 and subpop7.2 groups are associated with crosses with winter wheat, indicating that these constitute a unique subpopulation with characteristics of interest for breeding.
Subpop7.5, subpop7.6 and subpop7.3 were composed mainly of crosses with landraces and primitive wheat from the primary gene pool, which includes T. aestivum subsp. compactum and T. vavilovii. All subpopulations identified by the PCA and sNMF analyses were aligned, indicating that the selected elite parent and the wild parent from the gene banks have important effects on subpopulation structure. Also, a high degree of within subpopulation diversity was associated with the diversity of elite parents chosen. This underlines the importance of careful designing crosses in pre-breeding, considering both parents. Pre-breeding involves crossing diverse gene bank accessions to a limited number of elite accessions (Mujeeb-Kazi and Hettel Reference Mujeeb-Kazi and Hettel1995; Moore Reference Moore2015; Dempewolf et al. Reference Dempewolf, Baute, Anderson, Kilian, Smith and Guarino2017), such as Chinese Spring wheat, which is more successful in wide crosses with wild relatives. Similarly, the discovery of Ph1 mutations has limited the diversity of elite parents in pre-breeding (Türkösi et al. Reference Türkösi, Ivanizs, Farkas, Gaál, Kruppa, Kovács, Szakács, Szőke-Pázsi, Said, Cápal, Griffiths, Doležel and Molnár2022). Looking forward, especially in landrace crosses with low recombination barriers, pre-breeders must focus more on selecting the elite crossing partner, based on the trait desired from the cross, the adaptation to the local environment, and on reducing the loss of genetic gain by using younger elite accessions.
The contribution of wild relatives to genetic diversity was demonstrated by the analysis of PAs, which showed distinct differences between subpopulations. The greatest number of PAs was found in subpop7.7, which is derived from Ae. ovata crosses. This suggests that this species offers an important number of novel variations. On the other hand, subpop7.2, composed mainly of crosses with Ae. bicornis, had the fewest number of PAs. This aligns with previous studies demonstrating wild relatives’ contribution to bread wheat gene pools (Khanna-Chopra and Viswanathan Reference Khanna-Chopra and Viswanathan1999; Farooq Reference Farooq2004; Pradhan et al. Reference Pradhan, Prasad, Fritz, Kirkham and Gill2012; Tirnaz et al. Reference Tirnaz, Zandberg, Thomas, Marsh, Edwards and Batley2022). In addition, several studies have shown that Ae. ovata provides salt tolerance-related alleles for bread wheat breeding (Farooq et al. Reference Farooq, Niazi, Iqbal and Shah1989; Nevo et al. Reference Nevo, Krugman and Beiles1993; Mguis et al. Reference Mguis, Ben Brahim, Albouchi, Yakkoubi-Tej, Mahjoub and Ouerghi2008).
The population structure and genetic diversity identified in our material, particularly the PAs associated with traits related to heat and drought tolerance, provide useful information for improving pre-breeding efforts aimed at enhancing drought resilience and climate adaptability in wheat production systems in arid areas.
PIs of the CWR genomic sequence improve wheat’s genetic diversity, disease resistance and grain quality. These introgressions increase wheat’s adaptability and resilience to environmental changes and pests. Studies show that introgressions from Triticum and Aegilops species significantly increase wheat’s genetic diversity (Farooq Reference Farooq2004; Kishii Reference Kishii2019; Johansson et al. Reference Johansson, Henriksson, Prieto-Linde, Andersson, Ashraf and Rahmatov2020; Aberkane et al. Reference Aberkane, Belkadi, Kehel, Filali-Maltouf, Tahir, Meheesi and Amri2021; Gudi et al. Reference Gudi, Jain, Singh, Kaur, Srivastava, Mavi, Chhuneja, Sohu, Safhi, El-Moneim and Sharma2024). In our study, we identified 49 PIs in accessions derived from crosses with Aegilops species, with 98.97% of these introgressions occurring in accessions that include Ae. ovata and Ae. bicornis, specifically involving the B and D genomes. This high frequency of PIs, particularly in Ae. ovata accessions, suggests that these wild species contribute considerably different and novel genetic variation to the wheat genome. Although the presence of these PIs, based on missing marker data, provides a first indication of their importance, further validation is essential to confirm their added value. Techniques such as targeted molecular markers, fluorescent in situ hybridization or genomic in situ hybridization are complementary tools for validating these introgressions and assessing their true contribution to wheat breeding. Previous studies have highlighted the role of these cytogenetic methods to detect introgressions and confirm their functional role in crop improvement (Chaumeil et al. Reference Chaumeil, Okamoto and Heard2003; Asmamaw Amogne and Awoke Reference Asmamaw Amogne and Awoke2023).
Characterizing genetic diversity in pre-breeding material is essential for identifying beneficial alleles. In this study, we explored PAs and exploited the design of the DArTag panel, which includes 466 markers linked to known genes and QTLs. By focusing on disease resistance traits, particularly septoria and rust, we reduced the population from 484 to 189 accessions for septoria and to 270 for rust, while keeping all the genetic diversity. Accessions from CWR crosses for which data were missing were also retained, as they may carry new alleles not detected by current markers. These results show how the panel can be used to create trait-focused subsets from pre-breeding populations for specific traits of interest, making the process more targeted, decreasing downstream phenotyping costs and facilitating the discovery of new resistance genes.
Conclusion
In the present study, we used the DArTag mid-density panel to assess genetic diversity in bread wheat pre-breeding material. Our population showed significant genetic variation and several subgroups based on parent type and species, indicating its potential for future breeding programs aimed at developing new wheat varieties with desirable traits such as high yield and resistance to major biotic and abiotic stresses. In addition, the identification of PAs linked to important agronomic traits highlights the importance of incorporating diverse genetic resources into pre-breeding efforts. While DArTag technology is still efficient and low-cost, future panels should contain markers coming from related wild species and increase marker density in order to better understand changes in relations to wild species and enhance the success of introgression. This work highlights how crucial it is to combine pre-breeding with advanced molecular methods in order to maximize the utilization of genetic resources and manage challenges related to global food security.
Supplementary material
The supplementary material for this article can be found at https://doi.org/10.1017/S1479262126100525.
Acknowledgements
This work is partially funded by the CGIAR Genebank initiative on gene banks. Work by AEB was supported by the UK-CGIAR Centre for Collaboration in Science and Innovation, project L24ROM137, funded by FCDO. We also acknowledge the contributions of all collaborators involved in the development and evaluation of the wheat pre-breeding material.
Author contributions
F.A.: Conceptualization (lead); methodology (lead); investigation (lead); data curation (lead); formal analysis (lead); visualization (lead); writing – original draft (lead); and writing – review and editing (equal). A.B.: Conceptualization (supporting); methodology (supporting); formal analysis (supporting); supervision (supporting); writing – original draft (supporting); and funding acquisition (supporting). A.A.: Resources (supporting); writing – review and editing (equal); supervision (lead); and validation (supporting). L.B.: Writing – review and editing (equal); supervision (lead); and validation (supporting). Al.A.: Writing – review & editing (equal). Z.K.: Conceptualization (supporting); methodology (supporting); resources (lead); formal analysis (supporting); supervision (lead); writing – original draft (supporting); funding acquisition (lead); and validation (lead).
Competing interests
The authors declare no competing interests.
Data availability
The data generated and analysed during this study will be made available through ICARDA’s institutional database at the following link: https://gigwa.icarda.org:8443/gigwa/?module=Wheat_Taestivum5.



 Open access

