





1. Introduction
Astrophysical masers are valuable tracers of their local environment due to their (often) high brightness and the specific conditions required to produce their requisite population inversion. The hydroxyl (OH) radical exists primarily in its $^2 \Pi_{3/2}\,J=3/2$
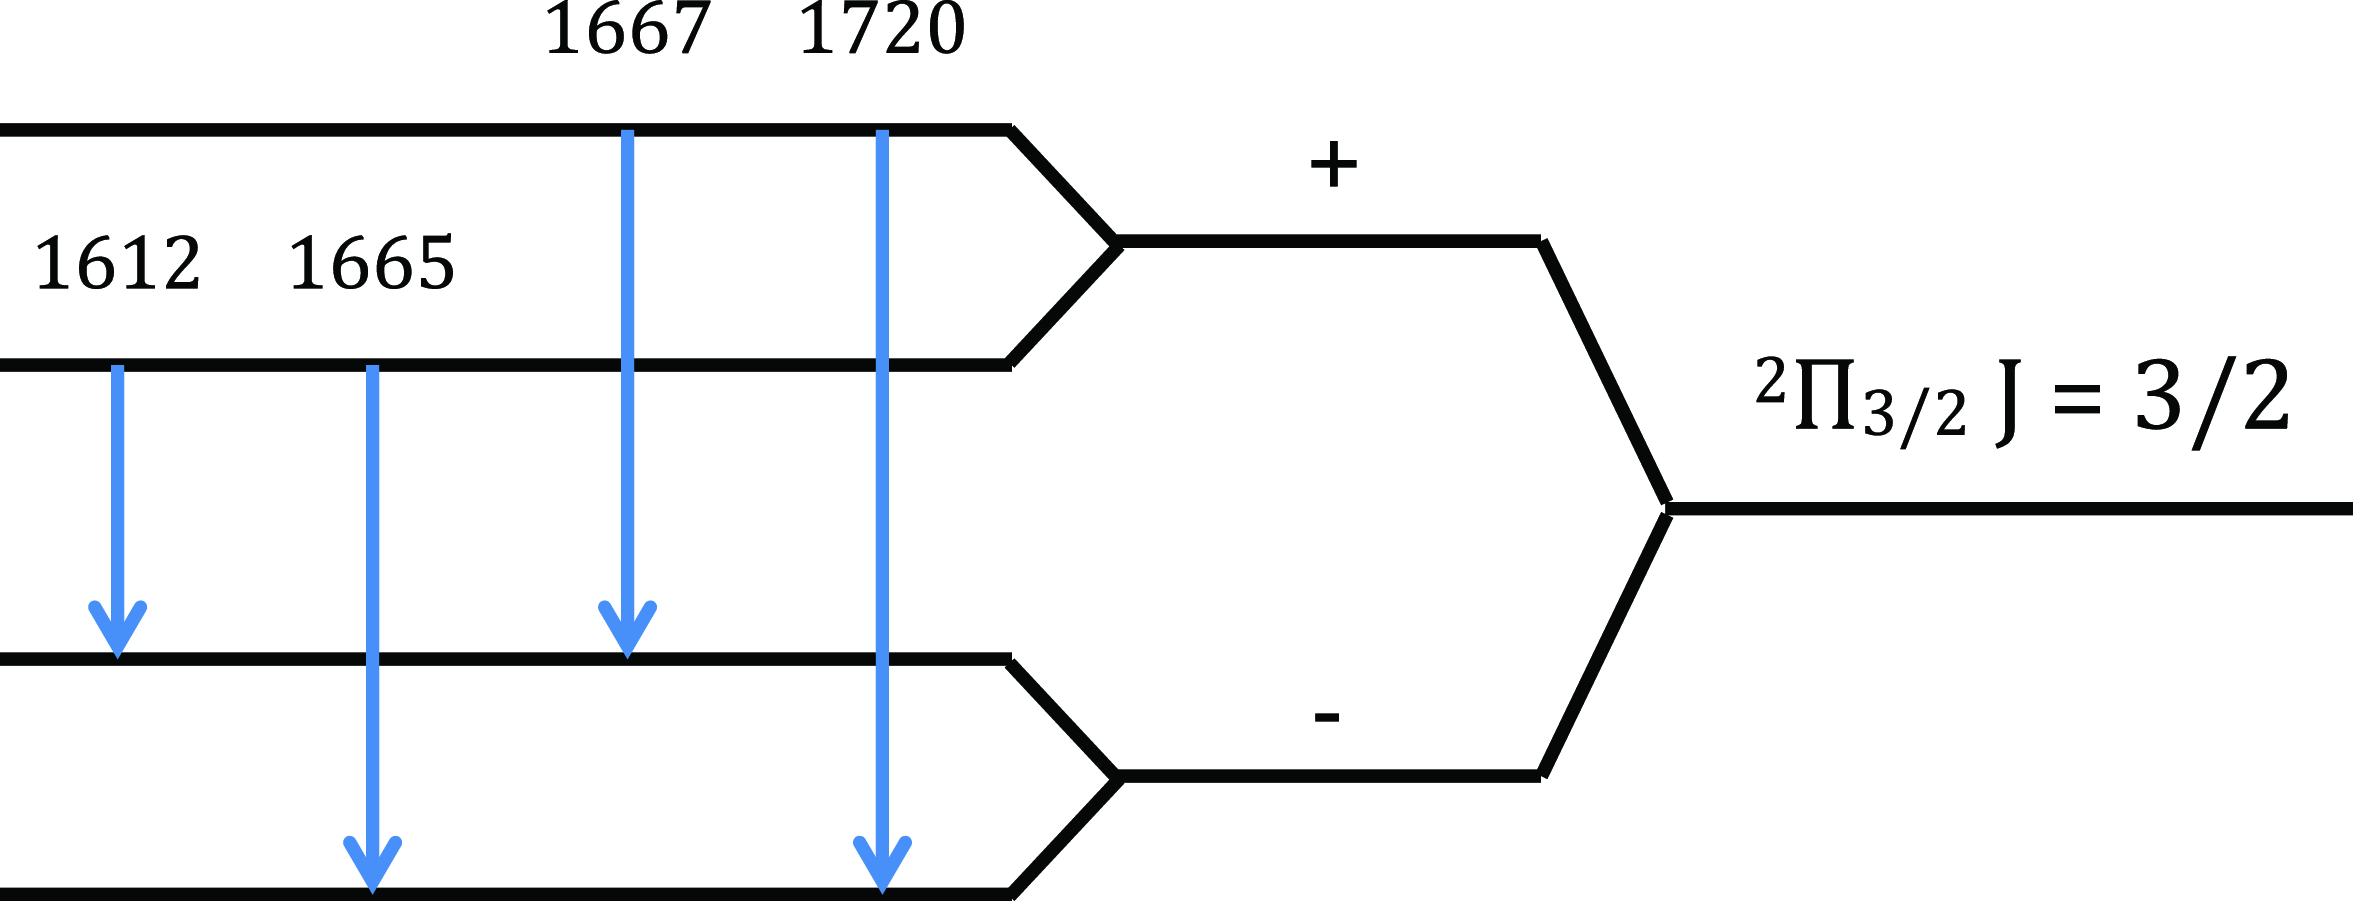
ground-rotational state in the interstellar medium (ISM), and this work is focused on the four transitions within that state at 1 612.231, 1 665.402, 1 667.359, and 1 720.530 MHz (see Fig. 1). All of these transitions are capable of experiencing a population inversion and can hence produce masers, though these tend to occur under different local environmental conditions and are therefore associated with different astrophysical phenomena. High-mass (
$^2 \Pi_{3/2}\,J=3/2$
ground-rotational state in the interstellar medium (ISM), and this work is focused on the four transitions within that state at 1 612.231, 1 665.402, 1 667.359, and 1 720.530 MHz (see Fig. 1). All of these transitions are capable of experiencing a population inversion and can hence produce masers, though these tend to occur under different local environmental conditions and are therefore associated with different astrophysical phenomena. High-mass ( $\ge$
8 M
$\ge$
8 M $_{\odot}$
) star-forming regions (HMSFRs) tend to host main-line OH masers at 1 665 and 1 667 MHz, though as shown in this and previous works (e.g. Caswell Reference Caswell1999) they can also host satellite-line masers at 1 612 and 1 720 MHz.
$_{\odot}$
) star-forming regions (HMSFRs) tend to host main-line OH masers at 1 665 and 1 667 MHz, though as shown in this and previous works (e.g. Caswell Reference Caswell1999) they can also host satellite-line masers at 1 612 and 1 720 MHz.
Energy level diagram of the $^2 \Pi_{3/2}\,J=3/2$
ground-rotational state of the OH radical from Hafner, Dawson, & Wardle (Reference Hafner, Dawson and Wardle2021). The four allowed transitions between the levels of the ground-rotational state are the ‘main’ lines at 1 665.402 and 1 667.359 MHz, and the ‘satellite’ lines at 1 612.231 and 1 720.530 MHz. The lambda-doublet parity (+/–) is shown.
$^2 \Pi_{3/2}\,J=3/2$
ground-rotational state of the OH radical from Hafner, Dawson, & Wardle (Reference Hafner, Dawson and Wardle2021). The four allowed transitions between the levels of the ground-rotational state are the ‘main’ lines at 1 665.402 and 1 667.359 MHz, and the ‘satellite’ lines at 1 612.231 and 1 720.530 MHz. The lambda-doublet parity (+/–) is shown.
The project described in this paper is the Maser Monitoring Parkes Program (M2P2): a long-term programme using the 64 m CSIRO Parkes radio telescope, MurriyangFootnote a Dish at Parkes, Australia (referred to hereafter as Murriyang) to monitor the intensity of OH masers in HMSFRs of the Milky Way, with simultaneous observations of methylidyne (CH) and methyl formate (HCOOCH $_3$
). The purpose of this paper is to describe the M2P2 project and to communicate its preliminary results, namely the identification and description of Stokes-I intensity variability seen in the OH maser transitions in the first two years of observations.
$_3$
). The purpose of this paper is to describe the M2P2 project and to communicate its preliminary results, namely the identification and description of Stokes-I intensity variability seen in the OH maser transitions in the first two years of observations.
The M2P2 project was motivated by the need for greater volume and cadence of maser monitoring observational data. The project aims to contribute to this body of data in partnership with a coordinated global maser monitoring initiative, the ‘Maser Monitoring Organisation’ (M2OFootnote b), specifically with Southern Hemisphere monitoring of OH masers.
The potential of long-term monitoring of variable masers is realised by the fact that the regions from which the maser emission originates are clearly undergoing some kind of physical changeFootnote c which must necessarily follow from some known or unknown astrophysical phenomenon. If we optimistically assume that these phenomena involve changes to only a subset of the possible local environmental parameters, then the time-series data of the variation in maser intensity represents a semi-controlled experiment of the effect of those parameters, particularly if a likely astrophysical phenomenon can be identified. Furthermore, many HMSFRs host several maser features in more than one maser transition, further constraining the parameters of the phenomena that cause their variability. Indeed, this is the long-term goal of this project: to use the time-series data of changing maser intensities to constrain the local environmental conditions and ongoing astrophysical phenomena within HMSFRs. Follow-up publications will focus on individual HMSFRs (or groups of similar regions) and will attempt to constrain these conditions and phenomena.
1.1. OH masers
Masers are bright (generally $>1$
Jy but often
$>1$
Jy but often $>100$
Jy), narrow (FWHM
$>100$
Jy), narrow (FWHM ${\lesssim}1\,$
km s
${\lesssim}1\,$
km s $^{-1}$
) spectral features, and are therefore relatively easy to observe and identify. This, coupled with an understanding of the local conditions that could lead to the requisite population inversion (the non-thermal pumping mechanism), implies that masers are excellent signposts of those local conditions.
$^{-1}$
) spectral features, and are therefore relatively easy to observe and identify. This, coupled with an understanding of the local conditions that could lead to the requisite population inversion (the non-thermal pumping mechanism), implies that masers are excellent signposts of those local conditions.
Most of the OH in the ISM will exist in the $^2 \Pi_{3/2}\,J=3/2$
ground-rotational state which is split into four levels by lambda doubling and hyperfine splitting. These levels and the four allowed transitions between them are shown in Fig. 1. The distribution of molecules across those four levels is determined primarily by cascades back into the ground-rotational state from molecules previously excited into higher rotational states. As molecules cascade back into the ground-rotational state they tend to stay on the same side of the ‘rotational ladder’ (i.e. the
$^2 \Pi_{3/2}\,J=3/2$
ground-rotational state which is split into four levels by lambda doubling and hyperfine splitting. These levels and the four allowed transitions between them are shown in Fig. 1. The distribution of molecules across those four levels is determined primarily by cascades back into the ground-rotational state from molecules previously excited into higher rotational states. As molecules cascade back into the ground-rotational state they tend to stay on the same side of the ‘rotational ladder’ (i.e. the $^2 \Pi_{3/2}$
or the
$^2 \Pi_{3/2}$
or the $^2 \Pi_{1/2}$
side). Population inversions in the satellite lines are generally understood to arise from imbalances in the de-excitation pathways into the ground-rotational state from either side of the rotational ladder (Elitzur Reference Elitzur1976; Elitzur, Goldreich, & Scoville Reference Elitzur, Goldreich and Scoville1976; Gray, Howe, & Lewis Reference Gray, Howe and Lewis2005). Population inversions in the main lines require excitations into excited rotational states that preference one half of the lambda-doublet over the other. This can be achieved in the presence of hot dust with a steep infrared emission spectral index (Elitzur Reference Elitzur1978; Gray Reference Gray2007). This radiative source of pumping is similar to the one responsible for inversion of the 6.7 GHz methanol transition described in Sobolev & Deguchi (Reference Sobolev and Deguchi1994), Cragg, Sobolev, & Godfrey (Reference Cragg, Sobolev and Godfrey2002), which explains why these maser species are so often observed together (e.g. Caswell et al. 1995a; Caswell, Vaile, &Forster 1995b; MacLeod & Gaylard Reference MacLeod and Gaylard1996; Cragg, Sobolev, & Godfrey Reference Cragg, Sobolev and Godfrey2002, etc.).
$^2 \Pi_{1/2}$
side). Population inversions in the satellite lines are generally understood to arise from imbalances in the de-excitation pathways into the ground-rotational state from either side of the rotational ladder (Elitzur Reference Elitzur1976; Elitzur, Goldreich, & Scoville Reference Elitzur, Goldreich and Scoville1976; Gray, Howe, & Lewis Reference Gray, Howe and Lewis2005). Population inversions in the main lines require excitations into excited rotational states that preference one half of the lambda-doublet over the other. This can be achieved in the presence of hot dust with a steep infrared emission spectral index (Elitzur Reference Elitzur1978; Gray Reference Gray2007). This radiative source of pumping is similar to the one responsible for inversion of the 6.7 GHz methanol transition described in Sobolev & Deguchi (Reference Sobolev and Deguchi1994), Cragg, Sobolev, & Godfrey (Reference Cragg, Sobolev and Godfrey2002), which explains why these maser species are so often observed together (e.g. Caswell et al. 1995a; Caswell, Vaile, &Forster 1995b; MacLeod & Gaylard Reference MacLeod and Gaylard1996; Cragg, Sobolev, & Godfrey Reference Cragg, Sobolev and Godfrey2002, etc.).
We note that in the context of this work we will use the term ‘maser’ to describe a discrete, velocity-coherent region in which a population inversion exists between the upper and lower levels of the transition. VLBI measurements (e.g. Zheng Reference Zheng1989) indicate that these regions are typically small ( ${\lesssim}100$
AU) and tend to exist in clusters smaller than
${\lesssim}100$
AU) and tend to exist in clusters smaller than ${\sim}1$
arcsec
${\sim}1$
arcsec $^2$
(e.g. Forster et al. Reference Forster, Graham, Goss and Booth1982; Migenes, Cohen, & Brebner Reference Migenes, Cohen and Brebner1992; Orosz et al. Reference Orosz2017) and therefore will remain unresolved by Murriyang. Instead, individual regions of masing gas within the telescope beam may be differentiated from one another spectrally as each is expected to correspond to a Gaussian or similarly shaped spectral emission feature at slightly different line-of-sight velocities. We therefore refer to each of these spectral features as a ‘maser feature’.
$^2$
(e.g. Forster et al. Reference Forster, Graham, Goss and Booth1982; Migenes, Cohen, & Brebner Reference Migenes, Cohen and Brebner1992; Orosz et al. Reference Orosz2017) and therefore will remain unresolved by Murriyang. Instead, individual regions of masing gas within the telescope beam may be differentiated from one another spectrally as each is expected to correspond to a Gaussian or similarly shaped spectral emission feature at slightly different line-of-sight velocities. We therefore refer to each of these spectral features as a ‘maser feature’.
1.2. Mechanisms of variability
Broadly speaking, the observed intensity of a given maser feature depends on the intensity of the background continuum radiation and how this is amplified by the masing gas. The degree of amplification of the background continuum will depend on the number of velocity-coherent molecules along the line of sight in the upper and lower levels of the transition and the beaming processes within the masing gas (Alcock & Ross Reference Alcock and Ross1986). Variation in the intensity of a maser feature can then be attributed to variation in some combination of these factors.
If the observed intensity of a maser feature varied due to variations in the background continuum intensity, the baseline intensity of the properly calibrated, off-source-subtracted spectra could be seen to vary, though the precision required to detect such variation may often be prohibitive. Variation in the intensity of maser features due to variation in the background continuum intensity is expected to occur. For example, van der Walt (Reference van derWalt2011) proposed that the periodic variability seen in methanol masers towards G009.62+0.20E and G188.95+0.89 could be due to a colliding-wind binary increasing the ionisation of the background continuum source, a cause they preferred to any changes to the masing gas. In another intriguing example – and one with much shorter-period variability – Weisberg et al. (Reference Weisberg, Johnston and Koribalski2005) identified an OH maser stimulated by a pulsar.
The case where a maser feature varies in intensity due to changes in the masing gas is much more complex as the expected intensity of a maser feature depends on many inter-dependant parameters. Broadly these can be divided into two categories: parameters affecting the amount of molecules along a line of sight and parameters affecting the excitation of those molecules. These two are not independent, but changes in them are likely to arise from different causes.
When considering the number of molecules along a line of sight, one must also consider the velocity coherence of those molecules. Therefore any phenomenon that affects the number of velocity-coherent molecules along a line of sight could be expected – to a first approximation – to have a proportional effect on the observed intensity of a maser feature.Footnote d The column density and velocity dispersion of the OH molecules could change via several plausible mechanisms. For instance, a non-uniform cloud may drift across a source of background continuum changing the effective line-of-sight depth of the cloud, or a shock wave could (among other effects) precipitate increased turbulence and therefore increased velocity dispersion within the gas, etc. It is likely that such changes may take place over long periods of time (i.e. months or years rather than weeks).
The excitation of the molecules within the masing gas is perhaps the most complex factor affecting the observed intensity of a maser feature as it depends on even more physical parameters of the gas such as its kinetic temperature, number density and radiative environment, as well as the aforementioned column density and velocity dispersion. Indeed, the dependence of the molecular excitation on these parameters is so complex that there are no simple naive statements about their relationship to the maser feature intensity, even to a first order of approximation. Instead, molecular excitation modelling is required to predict the intensity of a maser feature given a set of local environmental parameters using tools such as MOLPOP-CEP (Asensio Ramos & Elitzur Reference Asensio Ramos and Elitzur2018) or that used by Hafner, Dawson, &Wardle (Reference Hafner, Dawson and Wardle2020).
Since the excitation of the molecules depends on several local parameters, many local phenomena could cause these parameters to change. However, since the dominant pumping mechanism of main-line OH masers appears to be infrared radiation, it may be more likely for changes in this radiation to be responsible for significant changes in the maser feature intensity. For example, a significant accretion event onto a young stellar object in the vicinity of the masing gas could increase the local infrared radiation field, but might also be expected to increase the local gas temperature and perhaps later increase the number density if there were an associated shock. It is likely that these types of changes could happen over a wide range of timescales characteristic of a wide variety of astrophysical phenomena, though a likely lower limit would be determined by the light speed time-of-flight across the masing gas, which is likely to be on the order of minutes to hours.
2. Source selection
As previously mentioned, the M2P2 project was motivated by a general lack of high-cadence maser monitoring data, and as a result our source selection criteria were quite broad. In order to maximise the number of HMSFRs we could target, we only considered those with known OH maser fearures that were bright enough ( $>$
1 Jy) to observe with short integrations (
$>$
1 Jy) to observe with short integrations ( $\sim$
4 min) with Murriyang. To further maximise our observing time, we preferred HMSFRs with multiple maser features and/or emission in multiple OH transitions. Additionally, we preferred sources with maser features that were known to be highly variable (bursting or flaring) or periodic in methanol or OH, and those known to have prominent or unusual polarimetric properties (e.g. Zeeman triplets, features with high linear polarisation).
$\sim$
4 min) with Murriyang. To further maximise our observing time, we preferred HMSFRs with multiple maser features and/or emission in multiple OH transitions. Additionally, we preferred sources with maser features that were known to be highly variable (bursting or flaring) or periodic in methanol or OH, and those known to have prominent or unusual polarimetric properties (e.g. Zeeman triplets, features with high linear polarisation).
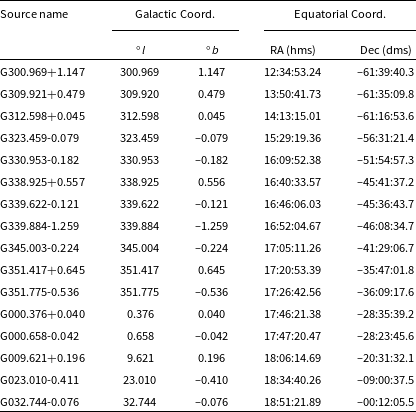
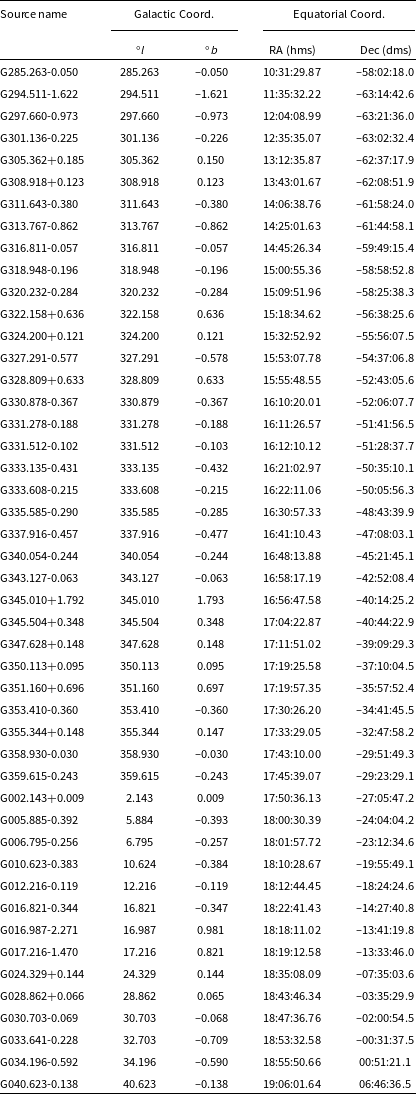
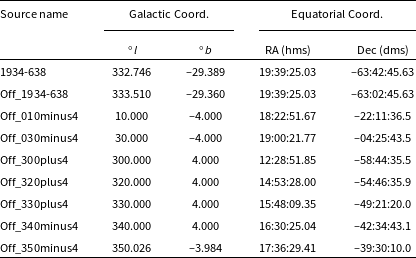
From these we compiled a list of 15 primary targets to be observed weekly for the first semester, later increased to 16 when G351.417+0.645 was added in subsequent observing semesters. These are outlined in Table 1. In addition to these weekly observations, our initial proposals also included once-per-semester 8-h observing blocks for which we compiled a list of secondary targets, outlined in Table 2. Our weekly observations generally allowed for the observation of an additional 3-5 targets, and these were chosen from this list of secondary targets. All of the selected sources had been observed with Murriyang previously (in full polarisation) providing a baseline for the variability studies (published in Caswell, Green, & Phillips Reference Caswell, Green and Phillips2013, Reference Caswell, Green and Phillips2014). As will be described in further detail in the following section, all of our observations also included the flux calibrator 1934-638 and several off-source pointings, all of which are outlined in Table 3.
Primary targets of the Maser Monitoring Parkes Program (M2P2).
Secondary targets of the Maser Monitoring Parkes Program (M2P2).
Flux calibration and off-source targets of the Maser Monitoring Parkes Program (M2P2). Coordinates are J2000.
3. Observations and data preparation
Observations outlined in this work were made with the 64 m CSIRO Parkes radio telescope, Murriyang, from 14th October 2020 to 18th October 2022, though the project is ongoing. Observations consisted on average of weekly 2–3 h long observing blocks, during which time our 16 primary sources (Table 1) would be observed for 4 min integrations, with ‘off-source’ pointings (pointings made off the Galactic plane and away from known emission, see Table 3) approximately every 20–30 min. Each observing session also included observation on and off PKS $PKS 1934-638$
for verification of our flux calibration, as well as an additional 3–5 targets chosen from the list of secondary sources (Table 2). The dates for which each of these sources was observed are outlined in Fig. 2.
$PKS 1934-638$
for verification of our flux calibration, as well as an additional 3–5 targets chosen from the list of secondary sources (Table 2). The dates for which each of these sources was observed are outlined in Fig. 2.
Observations used the Ultra Wideband Low frequency receiver, (‘UWL’; Hobbs et al. Reference Hobbs2020). The receiver has the capability to obtain 26 subbands of 128 MHz between 704 MHz and 4 GHz, and we selected the subbands corresponding, respectively, to the transitions of CH at 704, 722, and 724 MHz (subband 0), OH at 1 612, 1 665, 1 667, and 1 720 MHz, methyl formate at 1610 MHz (subband 7) and CH at 3 263, 3 335, and 3 349 MHz (subbands 19, 20, and 21). A 100-Hz calibration signal with a 50 % duty cycle was applied for the purpose of flux calibration. Murriyang has a resolution of approximately 12 arcmin at the OH transitions which are the focus of this work.
Data were obtained with the ‘MEDUSA’ graphical processing unit based backend with a standard configuration of 262 144 channels across each of the 128 MHz subbands, for a frequency channel spacing of 0.488 kHz and corresponding velocity resolution of $\sim$ $0.1$
km s
$0.1$
km s $^{-1}$
(Hobbs et al. Reference Hobbs2020). Four polarisation products were recorded in order to generate full Stokes parameters, with a 1 s sampling time.
$^{-1}$
(Hobbs et al. Reference Hobbs2020). Four polarisation products were recorded in order to generate full Stokes parameters, with a 1 s sampling time.
A 100 Hz noise signal was added to the observations with a 50% duty cycle to facilitate an absolute flux density calibration (see Fig. 3). This method of flux calibration requires an observation on and off a ‘standard candle’ (PKS 1934-638), each of which also contain an alternating ‘on-off’ noise signal. This results in four measurements at each frequency channel (and in each linear polarisation): the signal on PKS 1934-638 with the noise off ( $S_{1934}$
) and with the noise on (
$S_{1934}$
) and with the noise on ( $S_{\rm 1934+n}$
), and the signal off PKS 1934-638 with the noise off (
$S_{\rm 1934+n}$
), and the signal off PKS 1934-638 with the noise off ( $S_{\rm Off1934}$
) and with the noise on (
$S_{\rm Off1934}$
) and with the noise on ( $S_{\rm Off1934+n}$
). These four measured quantities then relate to the brightness temperatures of PKS 1934-638 (
$S_{\rm Off1934+n}$
). These four measured quantities then relate to the brightness temperatures of PKS 1934-638 ( $T_{1934}$
), of the system and background in the region of PKS 1934-638 (
$T_{1934}$
), of the system and background in the region of PKS 1934-638 ( $T_{\rm sys1934}$
) and in the region off PKS 1934-638 (
$T_{\rm sys1934}$
) and in the region off PKS 1934-638 ( $T_{\rm sysOff1934}$
), and of the injected noise signal (
$T_{\rm sysOff1934}$
), and of the injected noise signal ( $T_{\rm n}$
) via Equation (1).
$T_{\rm n}$
) via Equation (1).
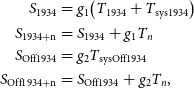 \begin{align}\begin{split} S_{\rm 1934}&= g_1\!\left(T_{1934}+T_{\rm sys1934}\right)\\ S_{\rm 1934+n}&= S_{\rm 1934}+g_1T_n\\ S_{\rm Off1934}&= g_2T_{\rm sysOff1934}\\ S_{\rm Off1934+n}&= S_{\rm Off1934}+g_2T_n, \end{split} \end{align}
where $g_1$
and
$g_1$
and $g_2$
are the gains of the telescope towards PKS 1934-638 and off PKS 1934-638, respectively. The brightness temperature of the injected noise signal is expected to be stable over time such that it can be defined as in Equation (2).
$g_2$
are the gains of the telescope towards PKS 1934-638 and off PKS 1934-638, respectively. The brightness temperature of the injected noise signal is expected to be stable over time such that it can be defined as in Equation (2).
 \begin{equation}T_{\rm n}=\frac{T_{1934}\!\left(S_{\rm 1934+n}-S_{1934}\right)\left(S_{\rm Off1934+n}-S_{\rm Off1934}\right)}{S_{1934}S_{\rm Off1934+n}-S_{\rm 1934+n}S_{\rm Off1934}}.\end{equation}
These observations of PKS 1934-638 are performed by the telescope operations staff, and the resulting calculation of $T_{\rm n}$
as a function of frequency is made available to observers. Our observations of PKS 1934-638, therefore, serve only to validate the subsequent process of flux calibration.
$T_{\rm n}$
as a function of frequency is made available to observers. Our observations of PKS 1934-638, therefore, serve only to validate the subsequent process of flux calibration.
Summary of the dates on which each of our target sources were observed between October 2020 and October 2022.

Absolute flux calibration is performed using an injected noise source with a 100 Hz duty cycle applied to observations on and off a ‘standard candle’ (PKS 1934-638) and the target as outlined in the text.
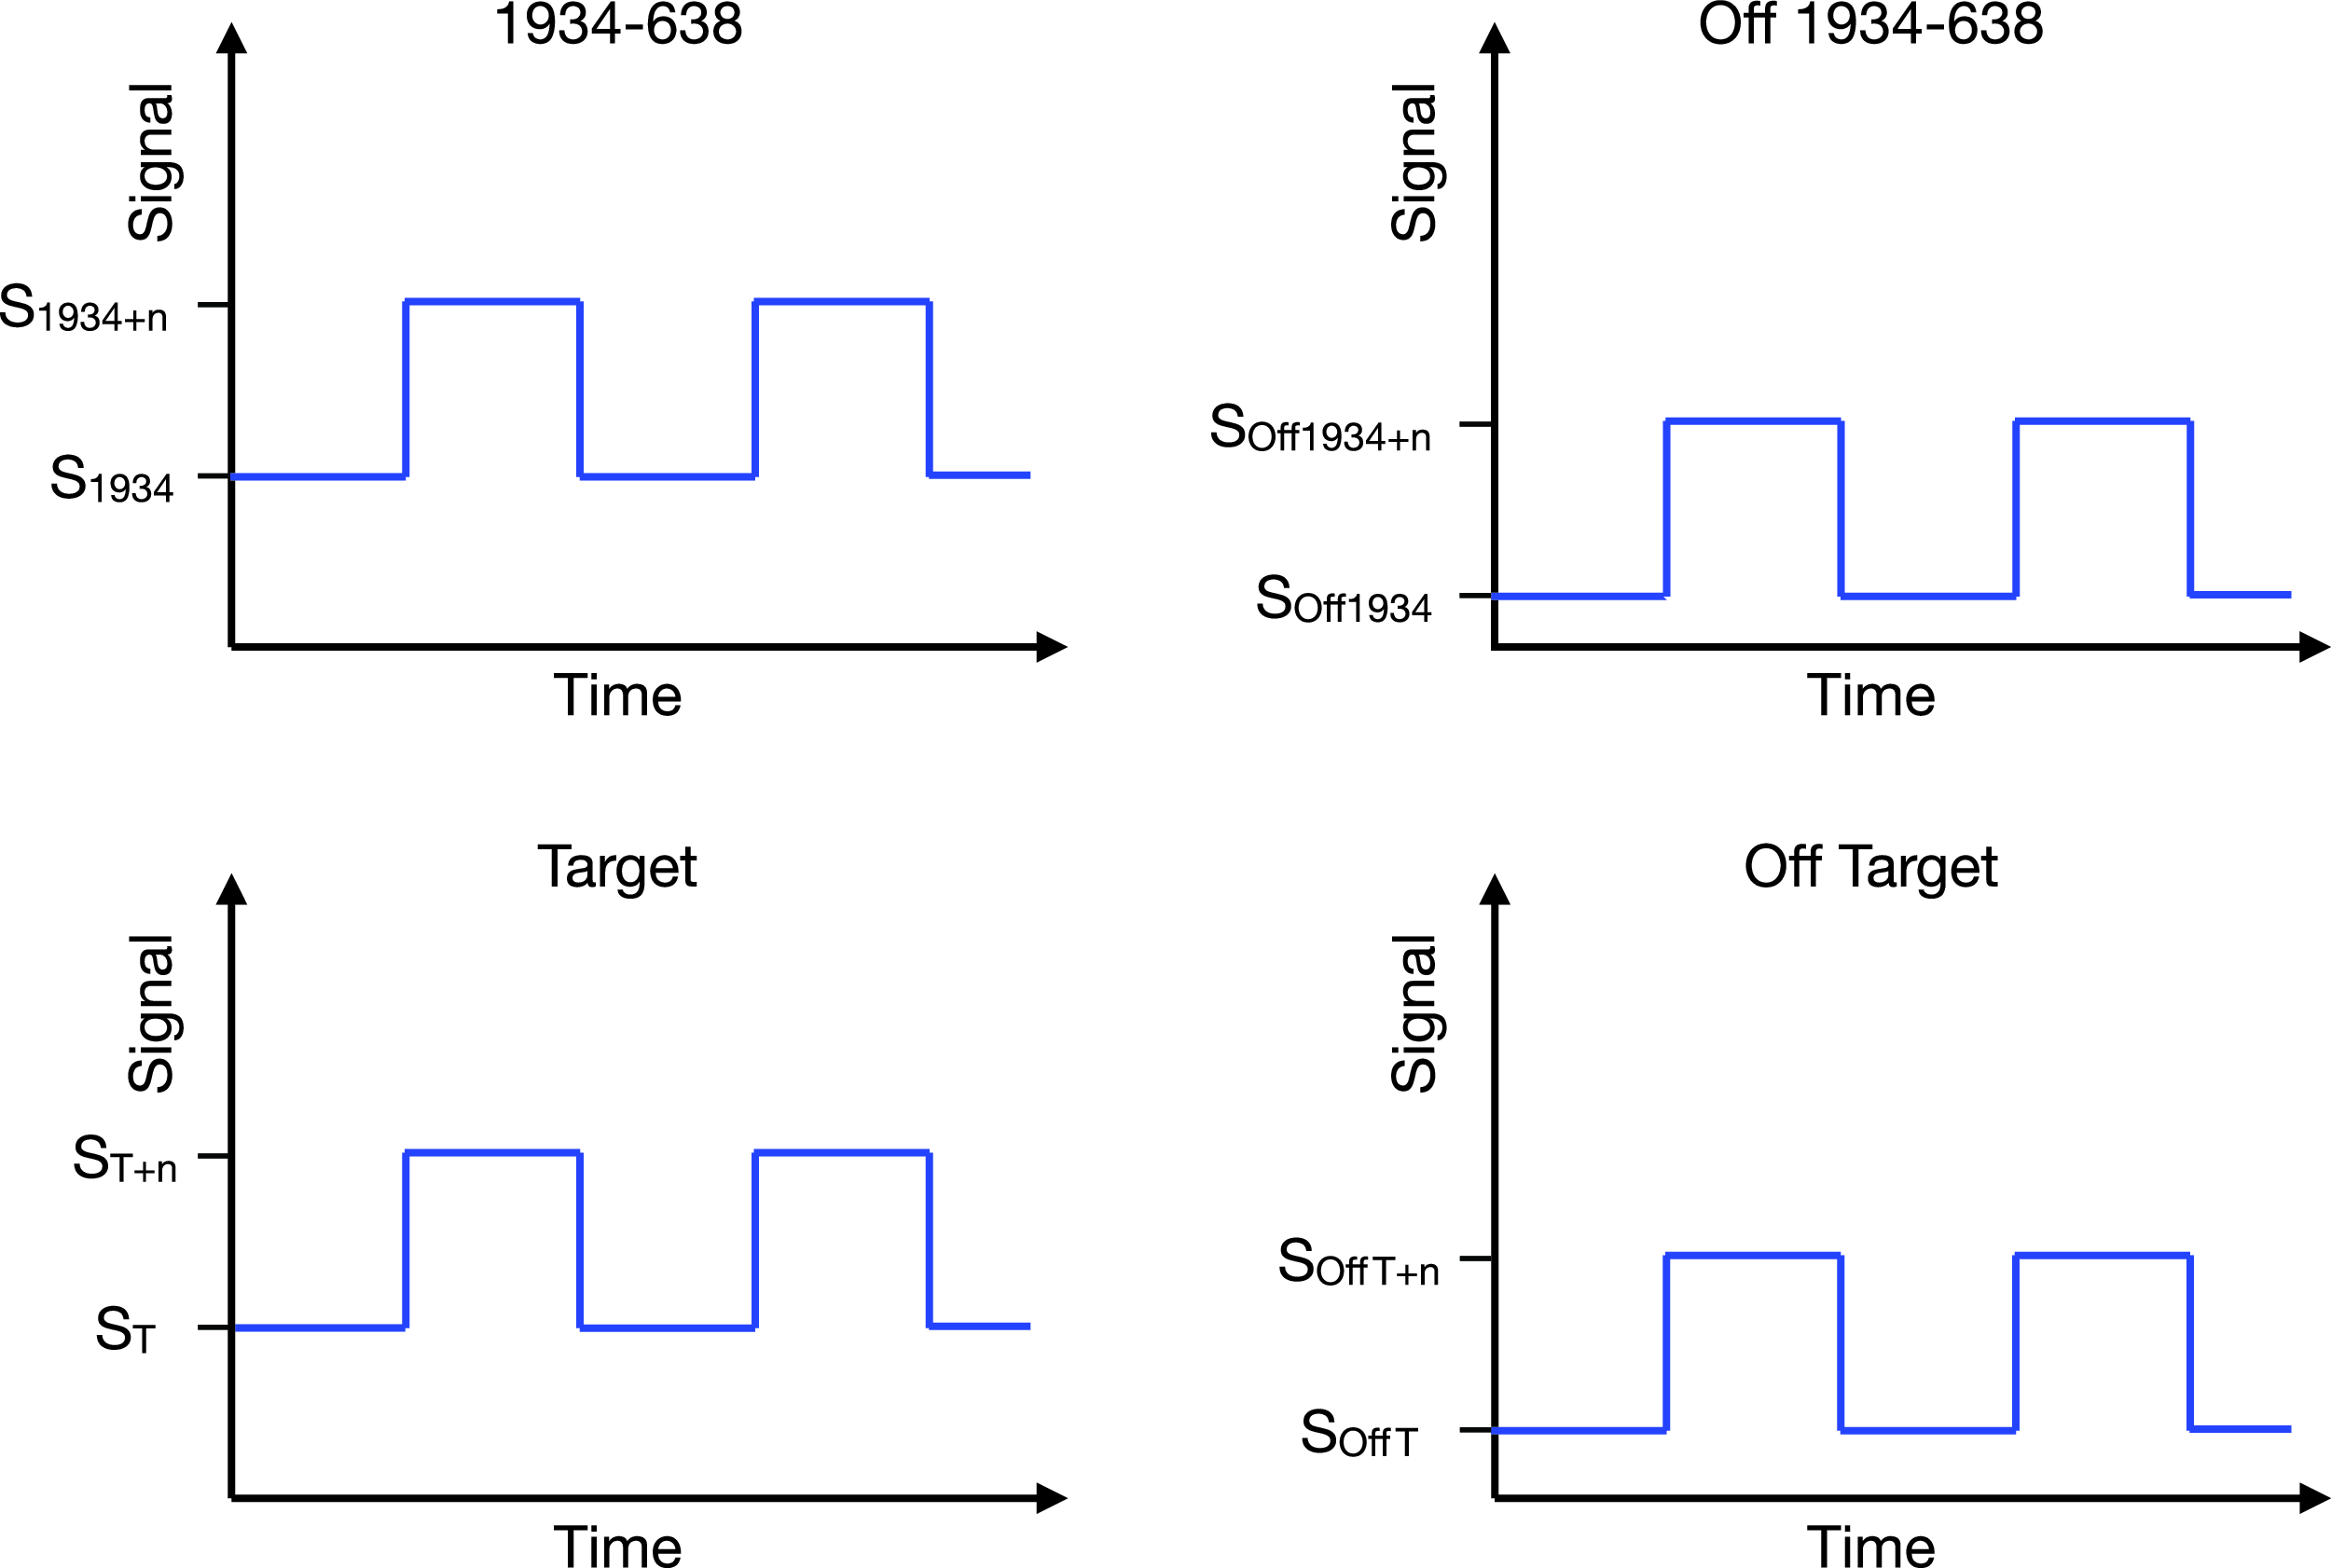
Using the INSPECTA software (Toomey et al. under review) the calculated brightness temperature of the noise source from Equation (2) is combined with measurements of the signal on the target with the noise off ( $S_{\rm T}$
) and with the noise on (
$S_{\rm T}$
) and with the noise on ( $S_{\rm T+n}$
), and the signal off the target with the noise off (
$S_{\rm T+n}$
), and the signal off the target with the noise off ( $S_{\rm OffT}$
) and with the noise on (
$S_{\rm OffT}$
) and with the noise on ( $S_{\rm OffT+n}$
). These four measured quantities then relate to the brightness temperatures of the target (
$S_{\rm OffT+n}$
). These four measured quantities then relate to the brightness temperatures of the target ( $T_{\rm T}$
), of the system and background in the region of the target (
$T_{\rm T}$
), of the system and background in the region of the target ( $T_{\rm sysT}$
) and in the region off the target (
$T_{\rm sysT}$
) and in the region off the target ( $T_{\rm sysOffT}$
), and of the injected noise signal (
$T_{\rm sysOffT}$
), and of the injected noise signal ( $T_{\rm n}$
) via Equation (1).
$T_{\rm n}$
) via Equation (1).
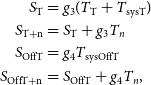 \begin{align}\begin{split} S_{\rm T}&= g_3(T_{\rm T}+T_{\rm sysT})\\ S_{\rm T+n}&= S_{\rm T}+g_3T_n\\ S_{\rm OffT}&= g_4T_{\rm sysOffT}\\ S_{\rm OffT+n}&= S_{\rm OffT}+g_4T_n, \end{split} \end{align}
where $g_3$
and
$g_3$
and $g_4$
are the gains of the telescope towards the target and off the target, respectively. Since
$g_4$
are the gains of the telescope towards the target and off the target, respectively. Since $T_{\rm n}$
is already known from Equation (2),
$T_{\rm n}$
is already known from Equation (2), $T_{\rm T}$
can then be calculated from Equation (4).
$T_{\rm T}$
can then be calculated from Equation (4).
 \begin{equation}T_{\rm T}=\frac{T_{\rm n}S_{\rm T}S_{\rm OffT+n}-S_{\rm T+n}S_{\rm OffT}}{(S_{\rm T+n}-S_{\rm T})(S_{\rm OffT+n}-S_{\rm OffT})}.\end{equation}
INSPECTA is also used to perform a local standard of rest correction before further processing can take place.
Radio-frequency interference (RFI) was identified and flagged using our own custom-built algorithm. Our RFI-flagging algorithm preferred to flag either individual pixels or entire time dumps rather than entire frequency channels, so some single-frequency-channel RFI was missed and can be seen in the resultant spectra (see e.g. G345.003 $-$
0.224 at 1 612 MHz in Fig. A4). The noise in each velocity channel was then determined from the standard deviation of the (unflagged) flux in each channel across the
$-$
0.224 at 1 612 MHz in Fig. A4). The noise in each velocity channel was then determined from the standard deviation of the (unflagged) flux in each channel across the $\approx$
240 1-s time dumps in an individual four minute observation. The individual time dumps were then averaged, and the horizontal and vertical polarisation products were added to generate Stokes-I spectra, and the frequency spectra were converted to velocity spectra for each transition.
$\approx$
240 1-s time dumps in an individual four minute observation. The individual time dumps were then averaged, and the horizontal and vertical polarisation products were added to generate Stokes-I spectra, and the frequency spectra were converted to velocity spectra for each transition.
Once RFI was removed, three classes of features remained present in the data: continuum, broad emission or absorption features (with FWHM $\sim$
5–10 km s
$\sim$
5–10 km s $^{-1}$
) and narrow emission features (maser features with FWHM
$^{-1}$
) and narrow emission features (maser features with FWHM $\sim$
1 km s
$\sim$
1 km s $^{-1}$
).
$^{-1}$
).
The continuum consists of any broad-spectrum background or foreground emission within the telescope beam. In the regions targeted in this project this will be dominated by Bremsstrahlung radiation from the Hii regions surrounding newly formed massive stars in the HMSFR, but will also include Galactic synchrotron radiation and the cosmic microwave background. It is possible for the absolute intensity of Bremsstrahlung radiation from an Hii region to change on the timescales of our observations, and we expect that such changes would either increase or decrease the overall intensity of the observed continuum, but would not significantly alter its spectral bandpass shape in the narrow velocity range that is our focus. For the majority of the sightlines examined in this work (those more than 5 degrees in Galactic longitude from the Galactic centre), at velocities between $-120$
and
$-120$
and $120\,$
km s
$120\,$
km s $^{-1}$
the spectra are dominated by continuum rather than by spectral features.
$^{-1}$
the spectra are dominated by continuum rather than by spectral features.
Broad emission and absorption features are due to large ( $\gtrsim$
1pc, e.g. Hafner, Dawson, &Wardle Reference Hafner, Dawson and Wardle2020) clouds of OH-containing molecular gas. The intensity of such features depends on the intensity of any background continuum, but also on intrinsic properties of the gas, parameterised by its frequency-dependant optical depth (
$\gtrsim$
1pc, e.g. Hafner, Dawson, &Wardle Reference Hafner, Dawson and Wardle2020) clouds of OH-containing molecular gas. The intensity of such features depends on the intensity of any background continuum, but also on intrinsic properties of the gas, parameterised by its frequency-dependant optical depth ( $\tau_{\nu}$
) and its transition-dependant excitation temperature (
$\tau_{\nu}$
) and its transition-dependant excitation temperature ( $T_{\rm ex}$
). Such large regions are not expected to intrinsically change in such a way as to change the intensity of their associated spectral features in the timescales of our observations. However, the intensity of these spectral features will tend to change proportionally to the intensity of the background continuum when the brightness temperature of the background continuum is much greater than the excitation temperature of the transition. We expect this to be the case, as excitation temperatures of the four ground-rotational transitions of OH in these large clouds are typically
$T_{\rm ex}$
). Such large regions are not expected to intrinsically change in such a way as to change the intensity of their associated spectral features in the timescales of our observations. However, the intensity of these spectral features will tend to change proportionally to the intensity of the background continuum when the brightness temperature of the background continuum is much greater than the excitation temperature of the transition. We expect this to be the case, as excitation temperatures of the four ground-rotational transitions of OH in these large clouds are typically $|T_{\rm ex}|<20\,$
K (Li et al. Reference Li2018; Hafner et al. 2023).
$|T_{\rm ex}|<20\,$
K (Li et al. Reference Li2018; Hafner et al. 2023).
The measured intensity of all of these features will in turn represent a convolution of their intrinsic intensity and the telescope response. In order, therefore, to ensure that any variability in flux density detected in these data was astrophysical in origin rather than due to instrumental effects, several checks were performed on the data.
The first of these was a visual inspection of the spectral bandpass shape over time, which proved to be remarkably stable. We then fit a polynomial to the spectral bandpass for each source, as well as for the off-source and flux calibrator observations. The average over velocity of a given polynomial fit was taken as an approximation of the continuum for that observation, and the behaviour of these compared to our off-source observations and calibrators were examined over time. Any changes in these were noted so that they could be compared to any variation seen in the intensity of the narrow maser features. At this stage of the analysis it was not necessary to distinguish between the various sources of continuum, so the off-source observations were not subtracted from the on-source observations. Instead, the polynomial fits for each source were subtracted from the spectra before further analysis was carried out.
4. Results
Here we present the first two years (October 2020 to October 2022) of total flux density (Stokes-I) monitoring data for the set of regular monitoring sources. Subsequent publications will present the polarisation variability information and delve into individual sources of note. For the purposes of this work – which is to identify significant variability in the observed intensity of individual maser features – we do not make any distinction between features that are or are not local to the targeted HMSFR (e.g. through reference to VLBI observations). In the general discussion contained in this section we assume that all maser features observed towards a given source (i.e. along the same sightline) are part of the same HMSFR. In Section 5 we speculate as to which maser features may be associated with one another due to their proximity in on-sky position (i.e. located within a single $\approx$ $12\,$
arcmin beam) and in velocity (typically within a few km s
$12\,$
arcmin beam) and in velocity (typically within a few km s $^{-1}$
). We note that such associations cannot be made with 1 612 MHz ‘double-horn’ masers which represent expanding shells of gas from the atmospheres of evolved stars, and whose velocity features will therefore tend not to align with the systemic line-of-sight velocity of the HMSFR. In subsequent publications we will make more careful distinction between features that are and are not associated with the HMSFR.
$^{-1}$
). We note that such associations cannot be made with 1 612 MHz ‘double-horn’ masers which represent expanding shells of gas from the atmospheres of evolved stars, and whose velocity features will therefore tend not to align with the systemic line-of-sight velocity of the HMSFR. In subsequent publications we will make more careful distinction between features that are and are not associated with the HMSFR.
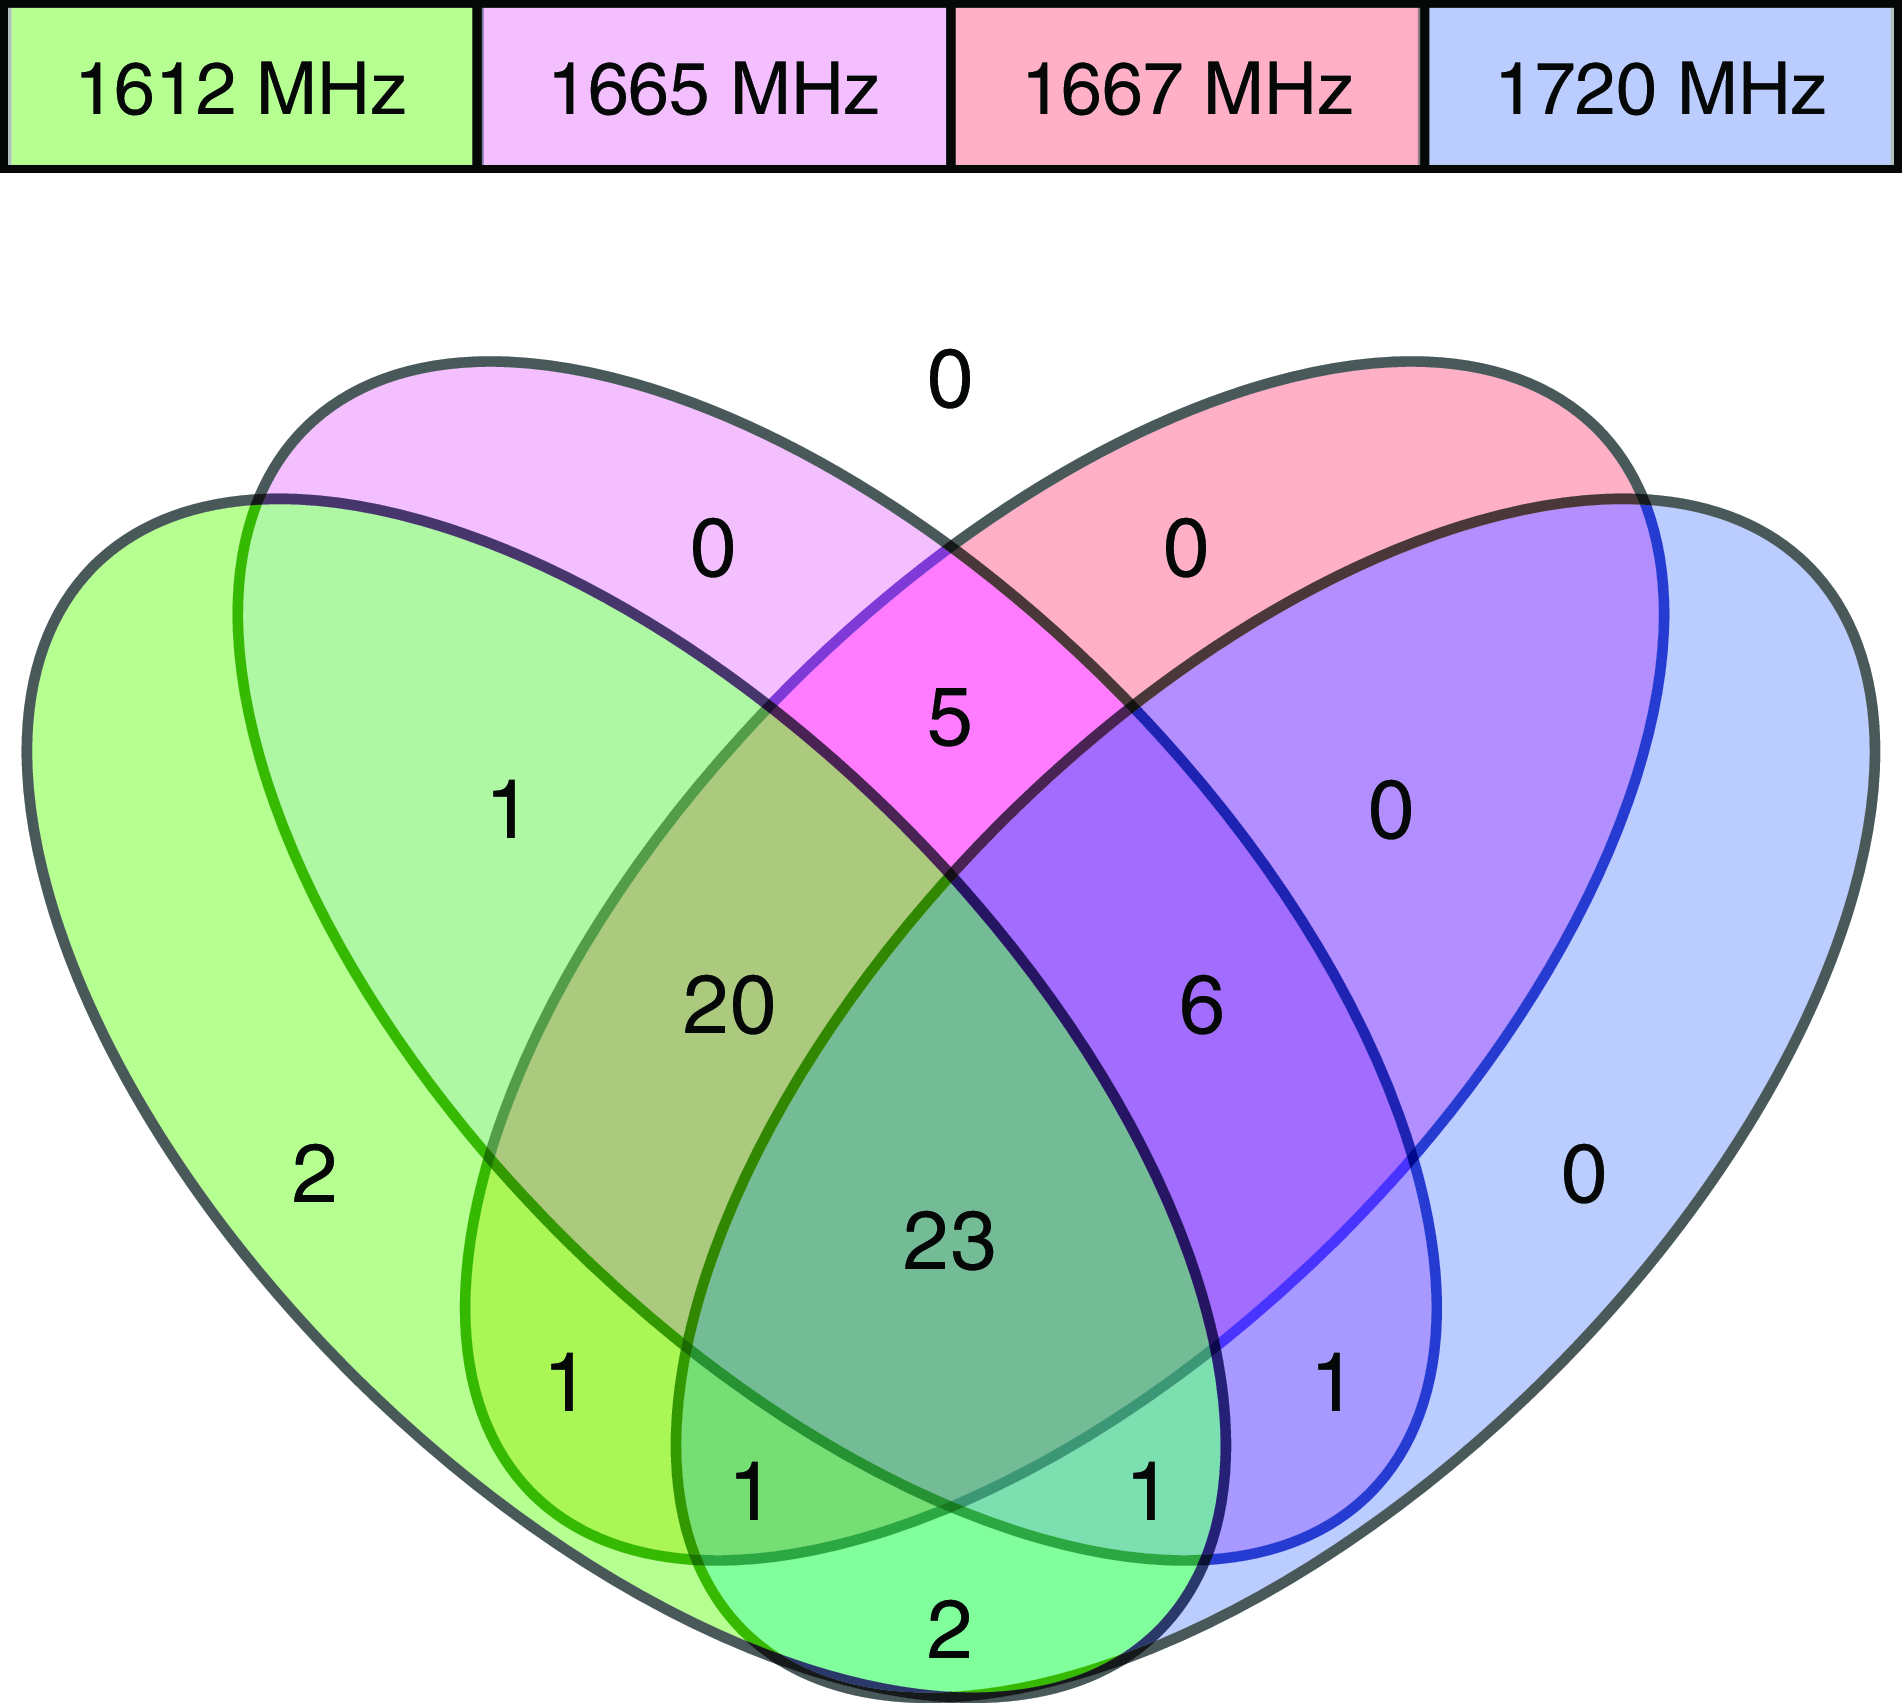
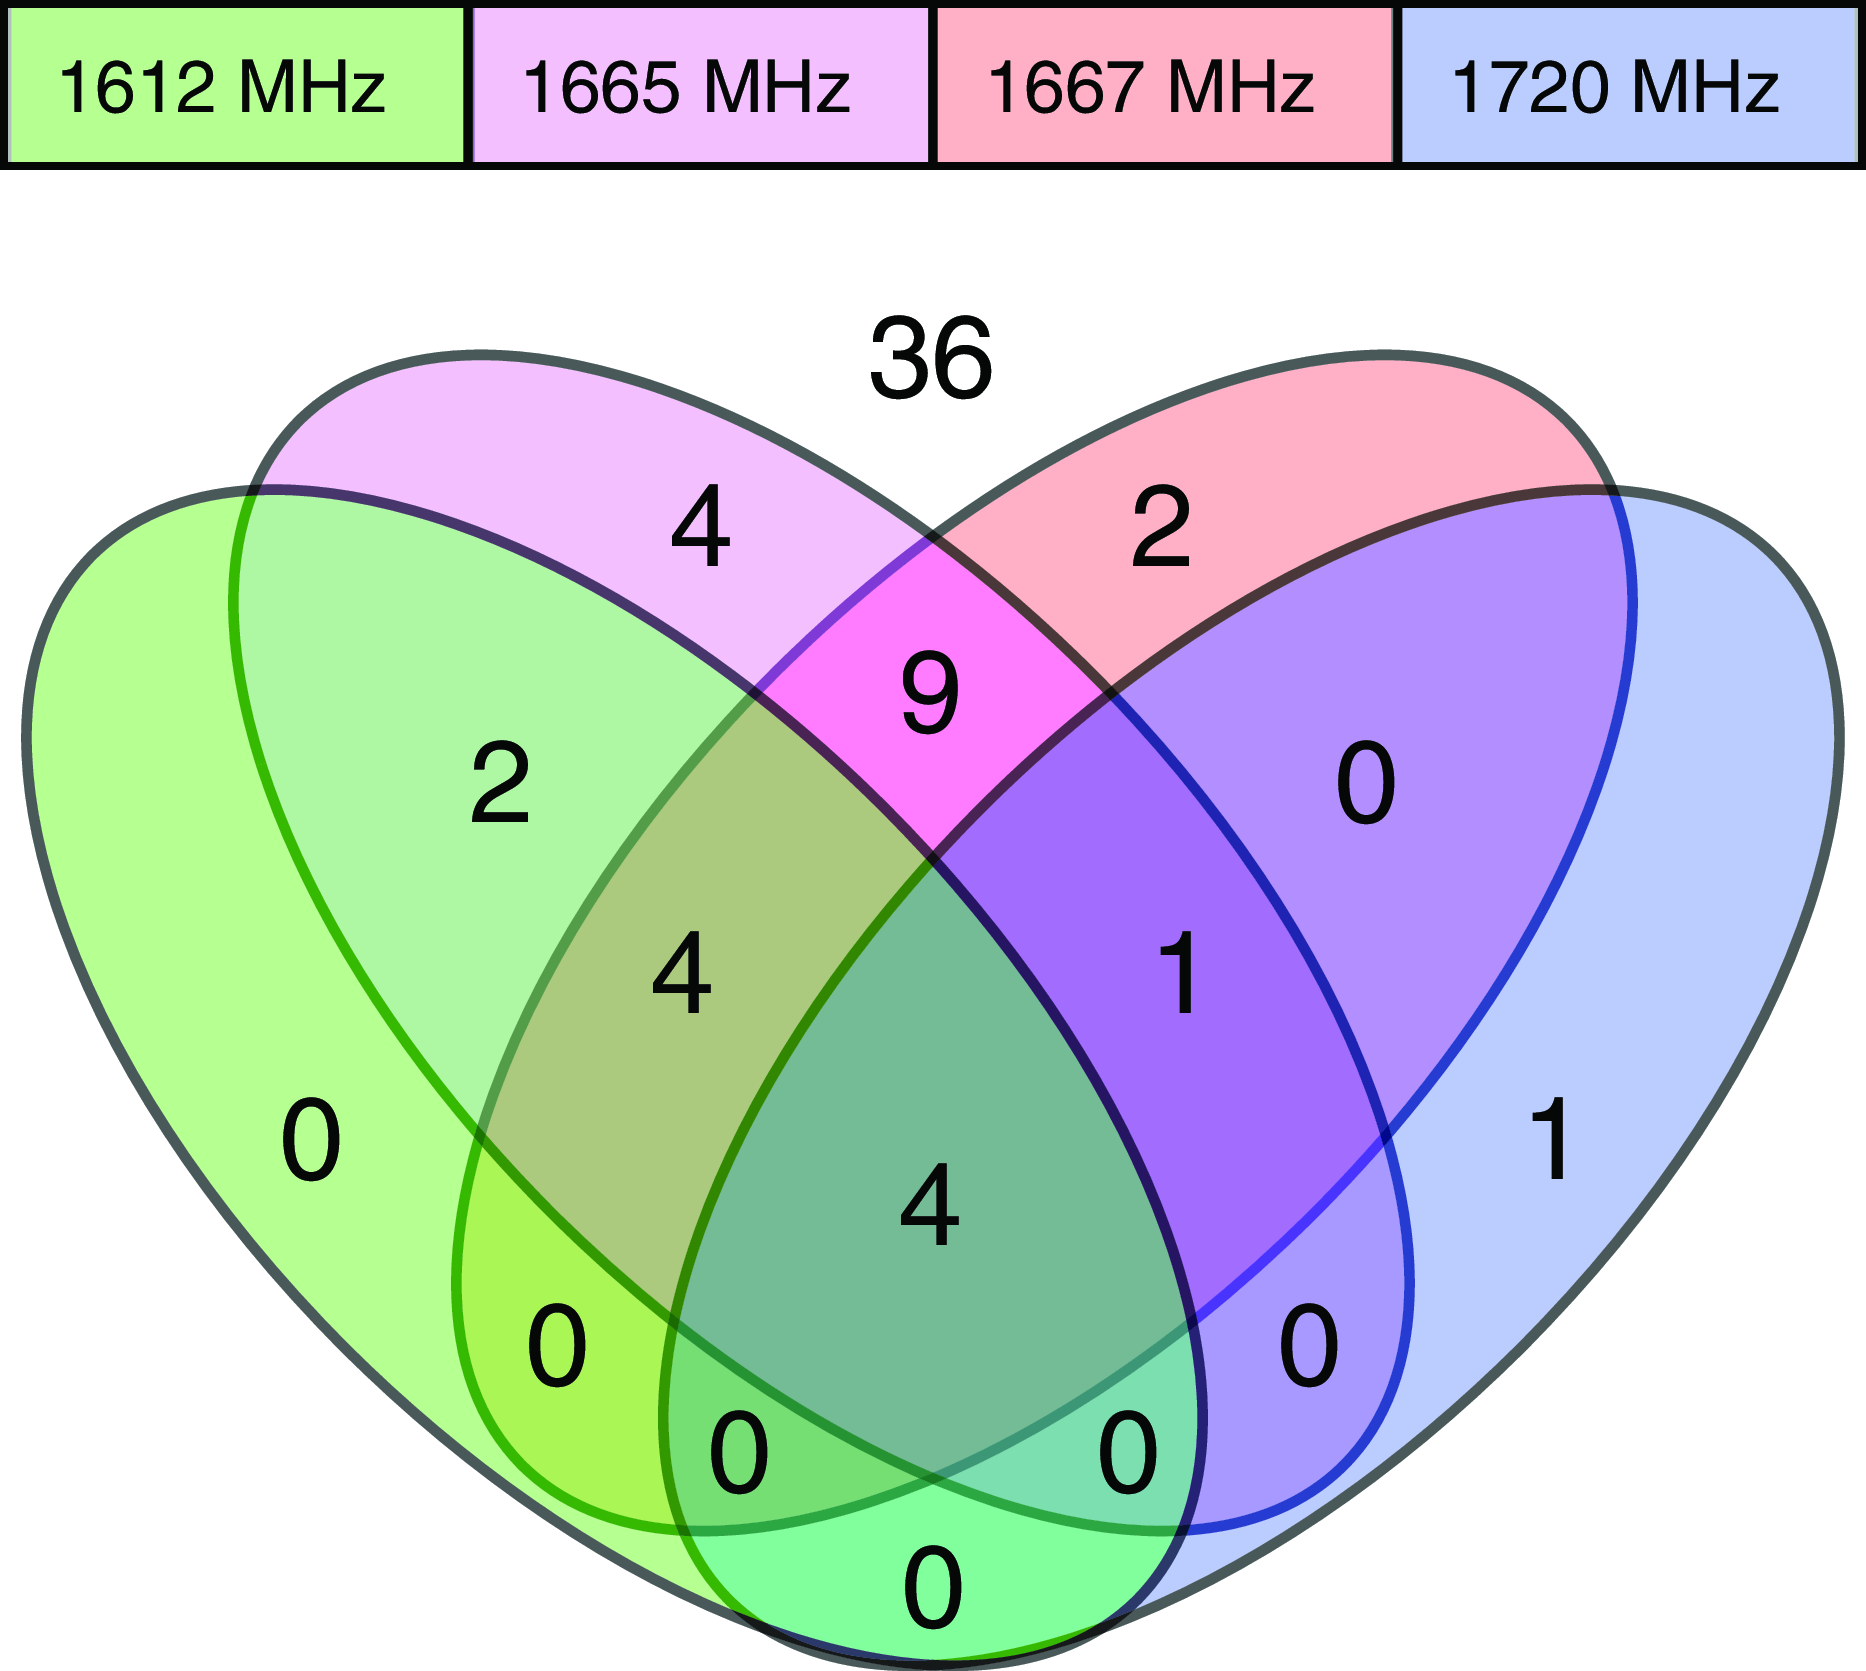
In this initial analysis we identify individual maser features in the OH ground-rotational state transition spectra using the scipy.signal package (Virtanen et al. Reference Virtanen2020). Peaks were identified in each observed spectrum independently, then matched across observations of the same source and transition at different times. Our initial identification of individual maser features across the 63 sources targeted at the 4 transitions examined in this paper resulted in a total of 1 514 individual maser features. As expected, main-line masers dominate this initial phase, as the majority of sources observed were sites of 6.7 GHz methanol masers which are known to also trace HMSFRs. Of the 63 HMSFRs targeted in this work, all have maser features in at least one OH transition, and 23 have maser features in all four OH transitions. The overlap of maser feature occurrence across the four OH transitions seen in the HMSFRs targeted in this work is shown in Fig. 4.
Venn diagram showing the overlap of occurrence of maser features in the targeted HMSFRs across the four ground-rotational state OH maser transitions identified in the M2P2 project.
4.1. Quantifying and categorising variability
Due to the wide range of signal-to-noise found in our data, we choose to adopt a dimensionless measure of variability, in contrast to that employed by Goedhart et al. (Reference Goedhart, van Rooyen, van der Walt, Maswanganye, Sanna, MacLeod and van den Heever2019). We utilise a simple statistic to identify variability in a given maser feature at a given transition which we refer to as the variability index I and define in Equation (5). Briefly, the statistic is the ratio of the standard deviation of the maser feature peak flux density across the set of observations, to the average standard deviation of the maser feature flux density across the time dumps of an individual observation:
 \begin{equation} I = \frac{m_{\sigma}}{\bar{n}},\end{equation}
where
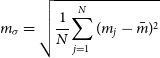 \begin{equation*} m_{\sigma}=\sqrt{\frac{1}{N}{\sum_{j=1}^{N} (m_j - \bar{m})^2}}\end{equation*}
is the standard deviation of maser flux densities across each observation. N is the number of observations, $m_j$
are the maser flux densities at each observation j computed from an average of each time dump i:
$m_j$
are the maser flux densities at each observation j computed from an average of each time dump i:
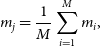 \begin{equation*} m_j=\frac{1}{M}\sum_{i=1}^{M} m_i,\end{equation*}
where M is the number of time dumps contributing to a given observation, $m_i$
is the maser flux density in a single time dump i.
$m_i$
is the maser flux density in a single time dump i. $\bar{m}$
is the average maser flux density across all observations. The average noise across the observations is
$\bar{m}$
is the average maser flux density across all observations. The average noise across the observations is
 \begin{equation*} \bar{n}=\frac{1}{N}\sum_{j=1}^{N} m_{\sigma_j},\end{equation*}
where
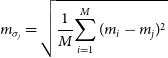 \begin{equation*} m_{\sigma_j}=\sqrt{\frac{1}{M}{\sum_{i=1}^{M} (m_i - m_j)^2}}\end{equation*}
is the standard deviation of maser flux densities across each time dump within a given observation.
Individual OH ground-rotational state maser features identified in this work as having significant variability in their intensity. The columns are the source name as expressed by its on-sky position in Galactic coordinates, the OH maser transition frequency in MHz, the average LSR velocity of the individual maser feature, the average flux density of the individual maser feature, the average standard deviation of the noise in the velocity channel of the maser feature, and the variability index (see Equation (5)), all of which are defined in more detail in the text. Each variable maser feature is categorised into one of 4 types: P – periodic, F – flare, L – long-term trend, or O – other (significant variability that does not fit well in these other categories). The 8th and 9th columns indicate the figures showing all the observed velocity spectra for a given source and maser transition, and those showing the plots of relative flux density versus time (and periodograms for periodically varying maser features) of the individual maser features. The final column gives the following notes: 1–6.7 GHz methanol maser detection within the Murriyang beam within 5 km s $^{-1}$
of the OH detection, 2–6.7 GHz methanol maser detection within the Murriyang beam but not at this velocity, 3–22 GHz water maser detection within the Murriyang beam within 5 km s
$^{-1}$
of the OH detection, 2–6.7 GHz methanol maser detection within the Murriyang beam but not at this velocity, 3–22 GHz water maser detection within the Murriyang beam within 5 km s $^{-1}$
of the OH detection (but no known 6.7 GHz methanol maser detection), 4 – spectra indicate double-horn 1 612 MHz maser (these source names are also italicised to distinguish them from features likely to be associated with the HMSFR), and 5 – observation triggered by 6.7 MHz methanol flare detected by M2O collaboration. Superscripts on the notes give the following references:
a
Green et al. (Reference Green2012),
b
Sevenster et al. (1997),
c
Caswell et al. (Reference Caswell2011),
d
Walsh et al. (Reference Walsh2011),
e
Caswell et al. (Reference Caswell2010),
f
Green et al. (Reference Green2010),
g
Sevenster et al. (Reference Sevenster, van Langevelde, Moody, Chapman, Habing and Killeen2001),
h
Breen et al. (Reference Breen2015), and
i
Cyganowski et al. (Reference Cyganowski, Koda, Rosolowsky, Towers, Donovan Meyer, Egusa, Momose and Robitaille2013).
$^{-1}$
of the OH detection (but no known 6.7 GHz methanol maser detection), 4 – spectra indicate double-horn 1 612 MHz maser (these source names are also italicised to distinguish them from features likely to be associated with the HMSFR), and 5 – observation triggered by 6.7 MHz methanol flare detected by M2O collaboration. Superscripts on the notes give the following references:
a
Green et al. (Reference Green2012),
b
Sevenster et al. (1997),
c
Caswell et al. (Reference Caswell2011),
d
Walsh et al. (Reference Walsh2011),
e
Caswell et al. (Reference Caswell2010),
f
Green et al. (Reference Green2010),
g
Sevenster et al. (Reference Sevenster, van Langevelde, Moody, Chapman, Habing and Killeen2001),
h
Breen et al. (Reference Breen2015), and
i
Cyganowski et al. (Reference Cyganowski, Koda, Rosolowsky, Towers, Donovan Meyer, Egusa, Momose and Robitaille2013).

In the absence of variation in flux density, the value of I in Equation (5) will tend towards 1, and most visually apparent variation results in a variability index of at least $I=2.5$
. We choose a cutoff of
$I=2.5$
. We choose a cutoff of $I \geq 5$
and an average signal-to-noise ratio
$I \geq 5$
and an average signal-to-noise ratio $\geq 3$
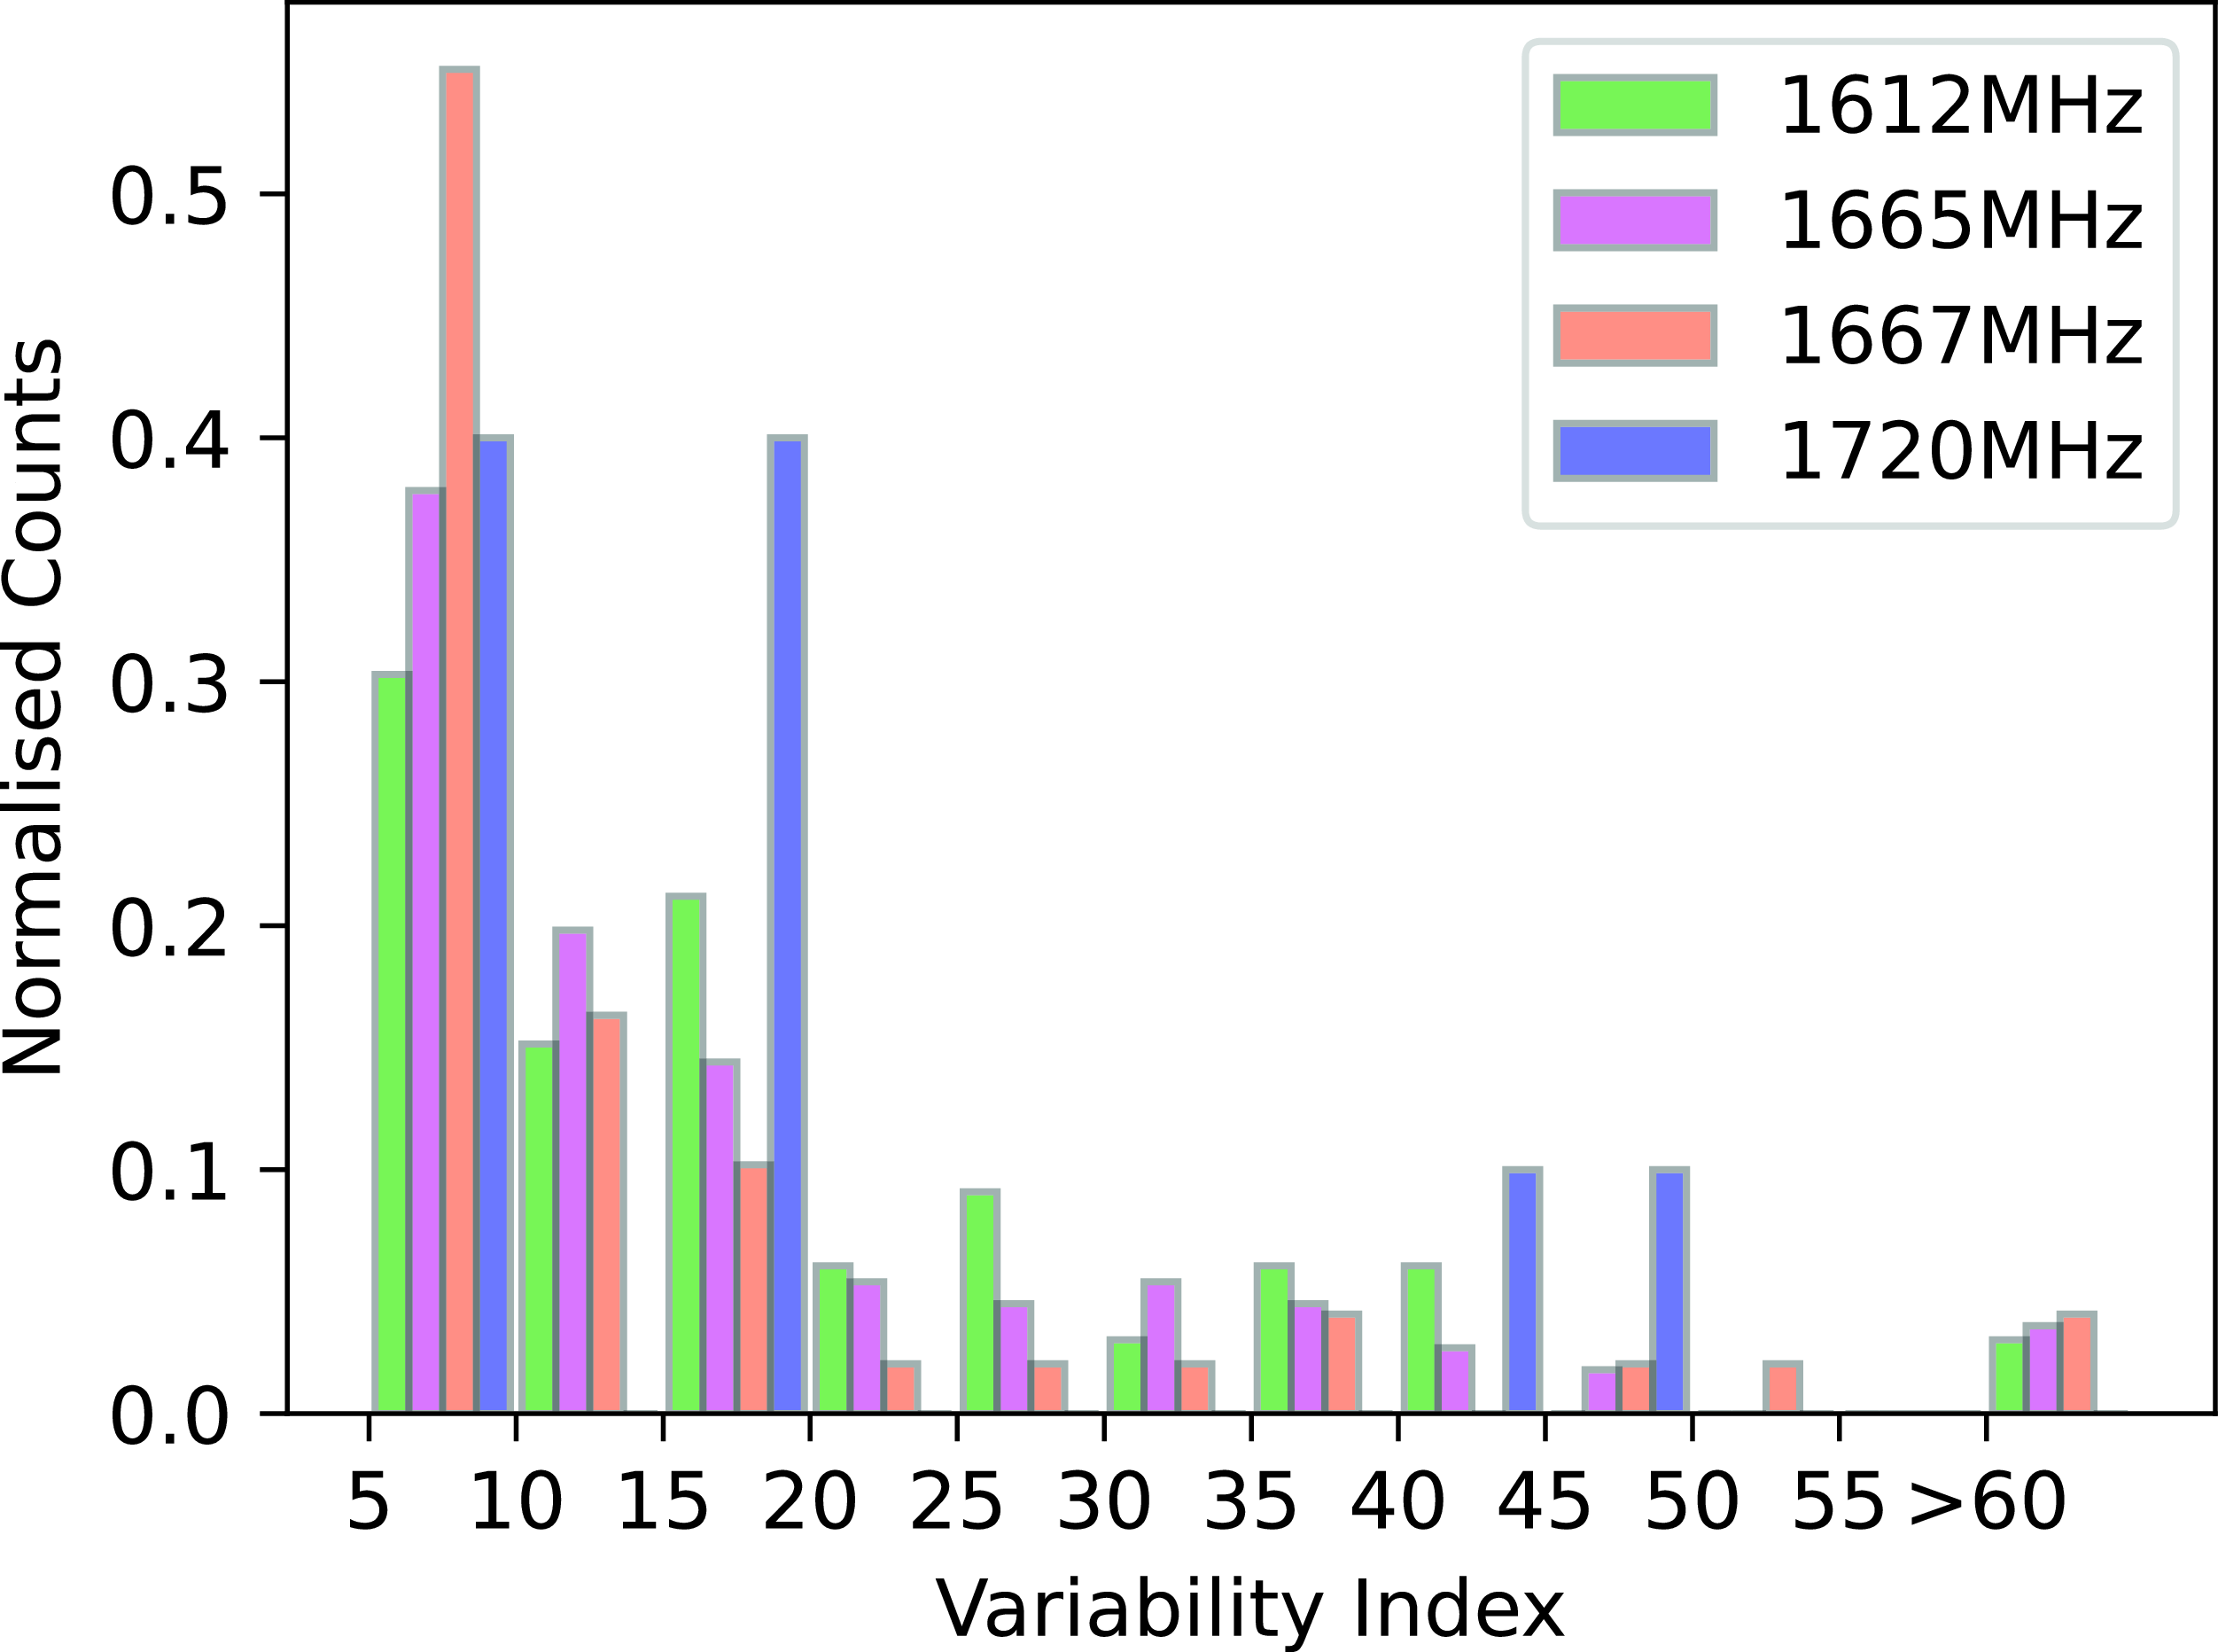
to highlight the most significant variability in this data set. These restrictions resulted in 203 individual maser features from 27 sources that demonstrate significant variability. These are summarised in Table 4. The distribution of variability index over the four OH maser transitions is shown in the histogram in Fig. 5. Aside from the 1 720 MHz masers (which suffer from a small sample size) all maser transitions show a similar trend in variability index. The overlap of variable maser features across the four OH transitions seen in the HMSFRs targeted in this work is shown in Fig. 6.
$\geq 3$
to highlight the most significant variability in this data set. These restrictions resulted in 203 individual maser features from 27 sources that demonstrate significant variability. These are summarised in Table 4. The distribution of variability index over the four OH maser transitions is shown in the histogram in Fig. 5. Aside from the 1 720 MHz masers (which suffer from a small sample size) all maser transitions show a similar trend in variability index. The overlap of variable maser features across the four OH transitions seen in the HMSFRs targeted in this work is shown in Fig. 6.
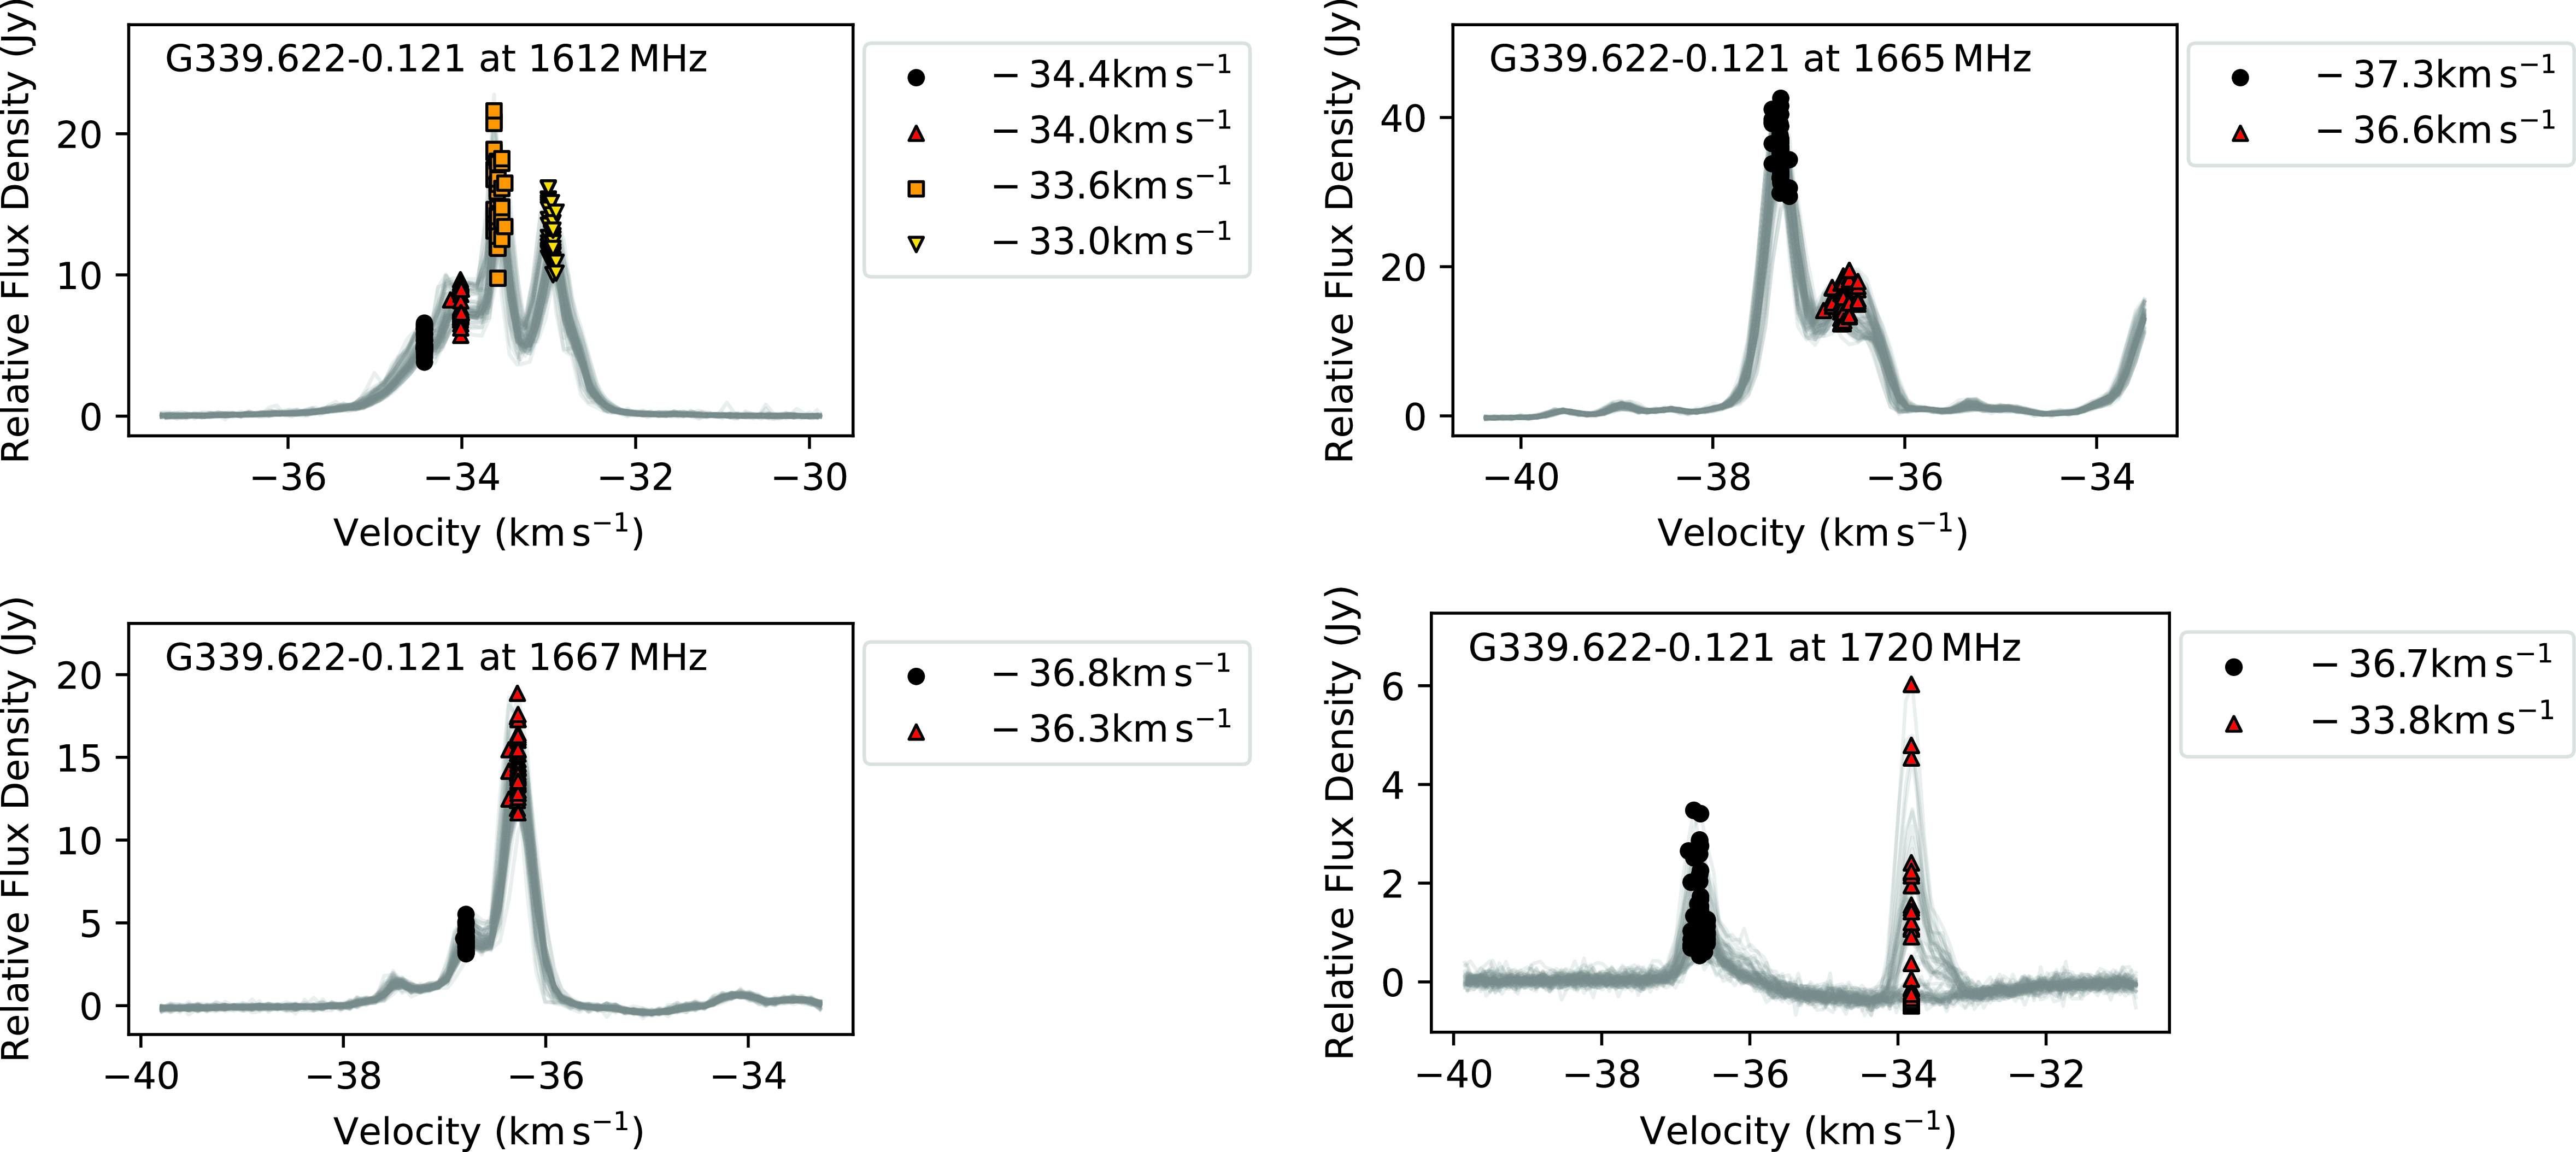
Plots of all observations with the positions of significantly varying maser features indicated are shown in the Appendix in Figs. A1–A6, and those towards the G339.622 $-$
0.121 HMSFR are shown in Fig. 7 as an example. The locations of these plots are indexed in Table 4 under the ‘Spectra Fig.’ heading. These figures and Table 4 identify each individual maser feature by its source name (the Galactic coordinates of the observed sightline), OH transition and average velocity. The average velocity was computed from the average of the velocity location of the peaks identified by scipy.signal. These velocities are intended for identification purposes only and will likely be refined in subsequent publications when more sophisticated fitting algorithms are used. The flux density listed in Table 4 is an average across all observations, the main purpose of which was to compute the average signal-to-noise ratio of the maser feature which functioned as a preliminary filter as previously mentioned.
$-$
0.121 HMSFR are shown in Fig. 7 as an example. The locations of these plots are indexed in Table 4 under the ‘Spectra Fig.’ heading. These figures and Table 4 identify each individual maser feature by its source name (the Galactic coordinates of the observed sightline), OH transition and average velocity. The average velocity was computed from the average of the velocity location of the peaks identified by scipy.signal. These velocities are intended for identification purposes only and will likely be refined in subsequent publications when more sophisticated fitting algorithms are used. The flux density listed in Table 4 is an average across all observations, the main purpose of which was to compute the average signal-to-noise ratio of the maser feature which functioned as a preliminary filter as previously mentioned.
We then divided these features into 4 broad (qualitative) categories based on the behaviour of their flux density over time. These are:
1. Flares: For the purposes of this work, characterised by flux density that increases from or decreases to zero, or by having periods of constant flux density punctuated by a significant ( $\gtrsim$
50%) increase in flux density.
$\gtrsim$
50%) increase in flux density.2. Long-term trends: These may be smooth long-term increases or decreases in flux density, or other meandering behaviour of flux density over time.
3. Periodic: Regular cadence of increases and decreases in flux density over time, many of which also show long term increases or decreases in average flux density.
4. Other: Non-periodic changes in flux density over time that do not fit well into the other categories. These changes in flux density are often similar across multiple features and/or transitions along the same sightline, and these correlations are discussed.

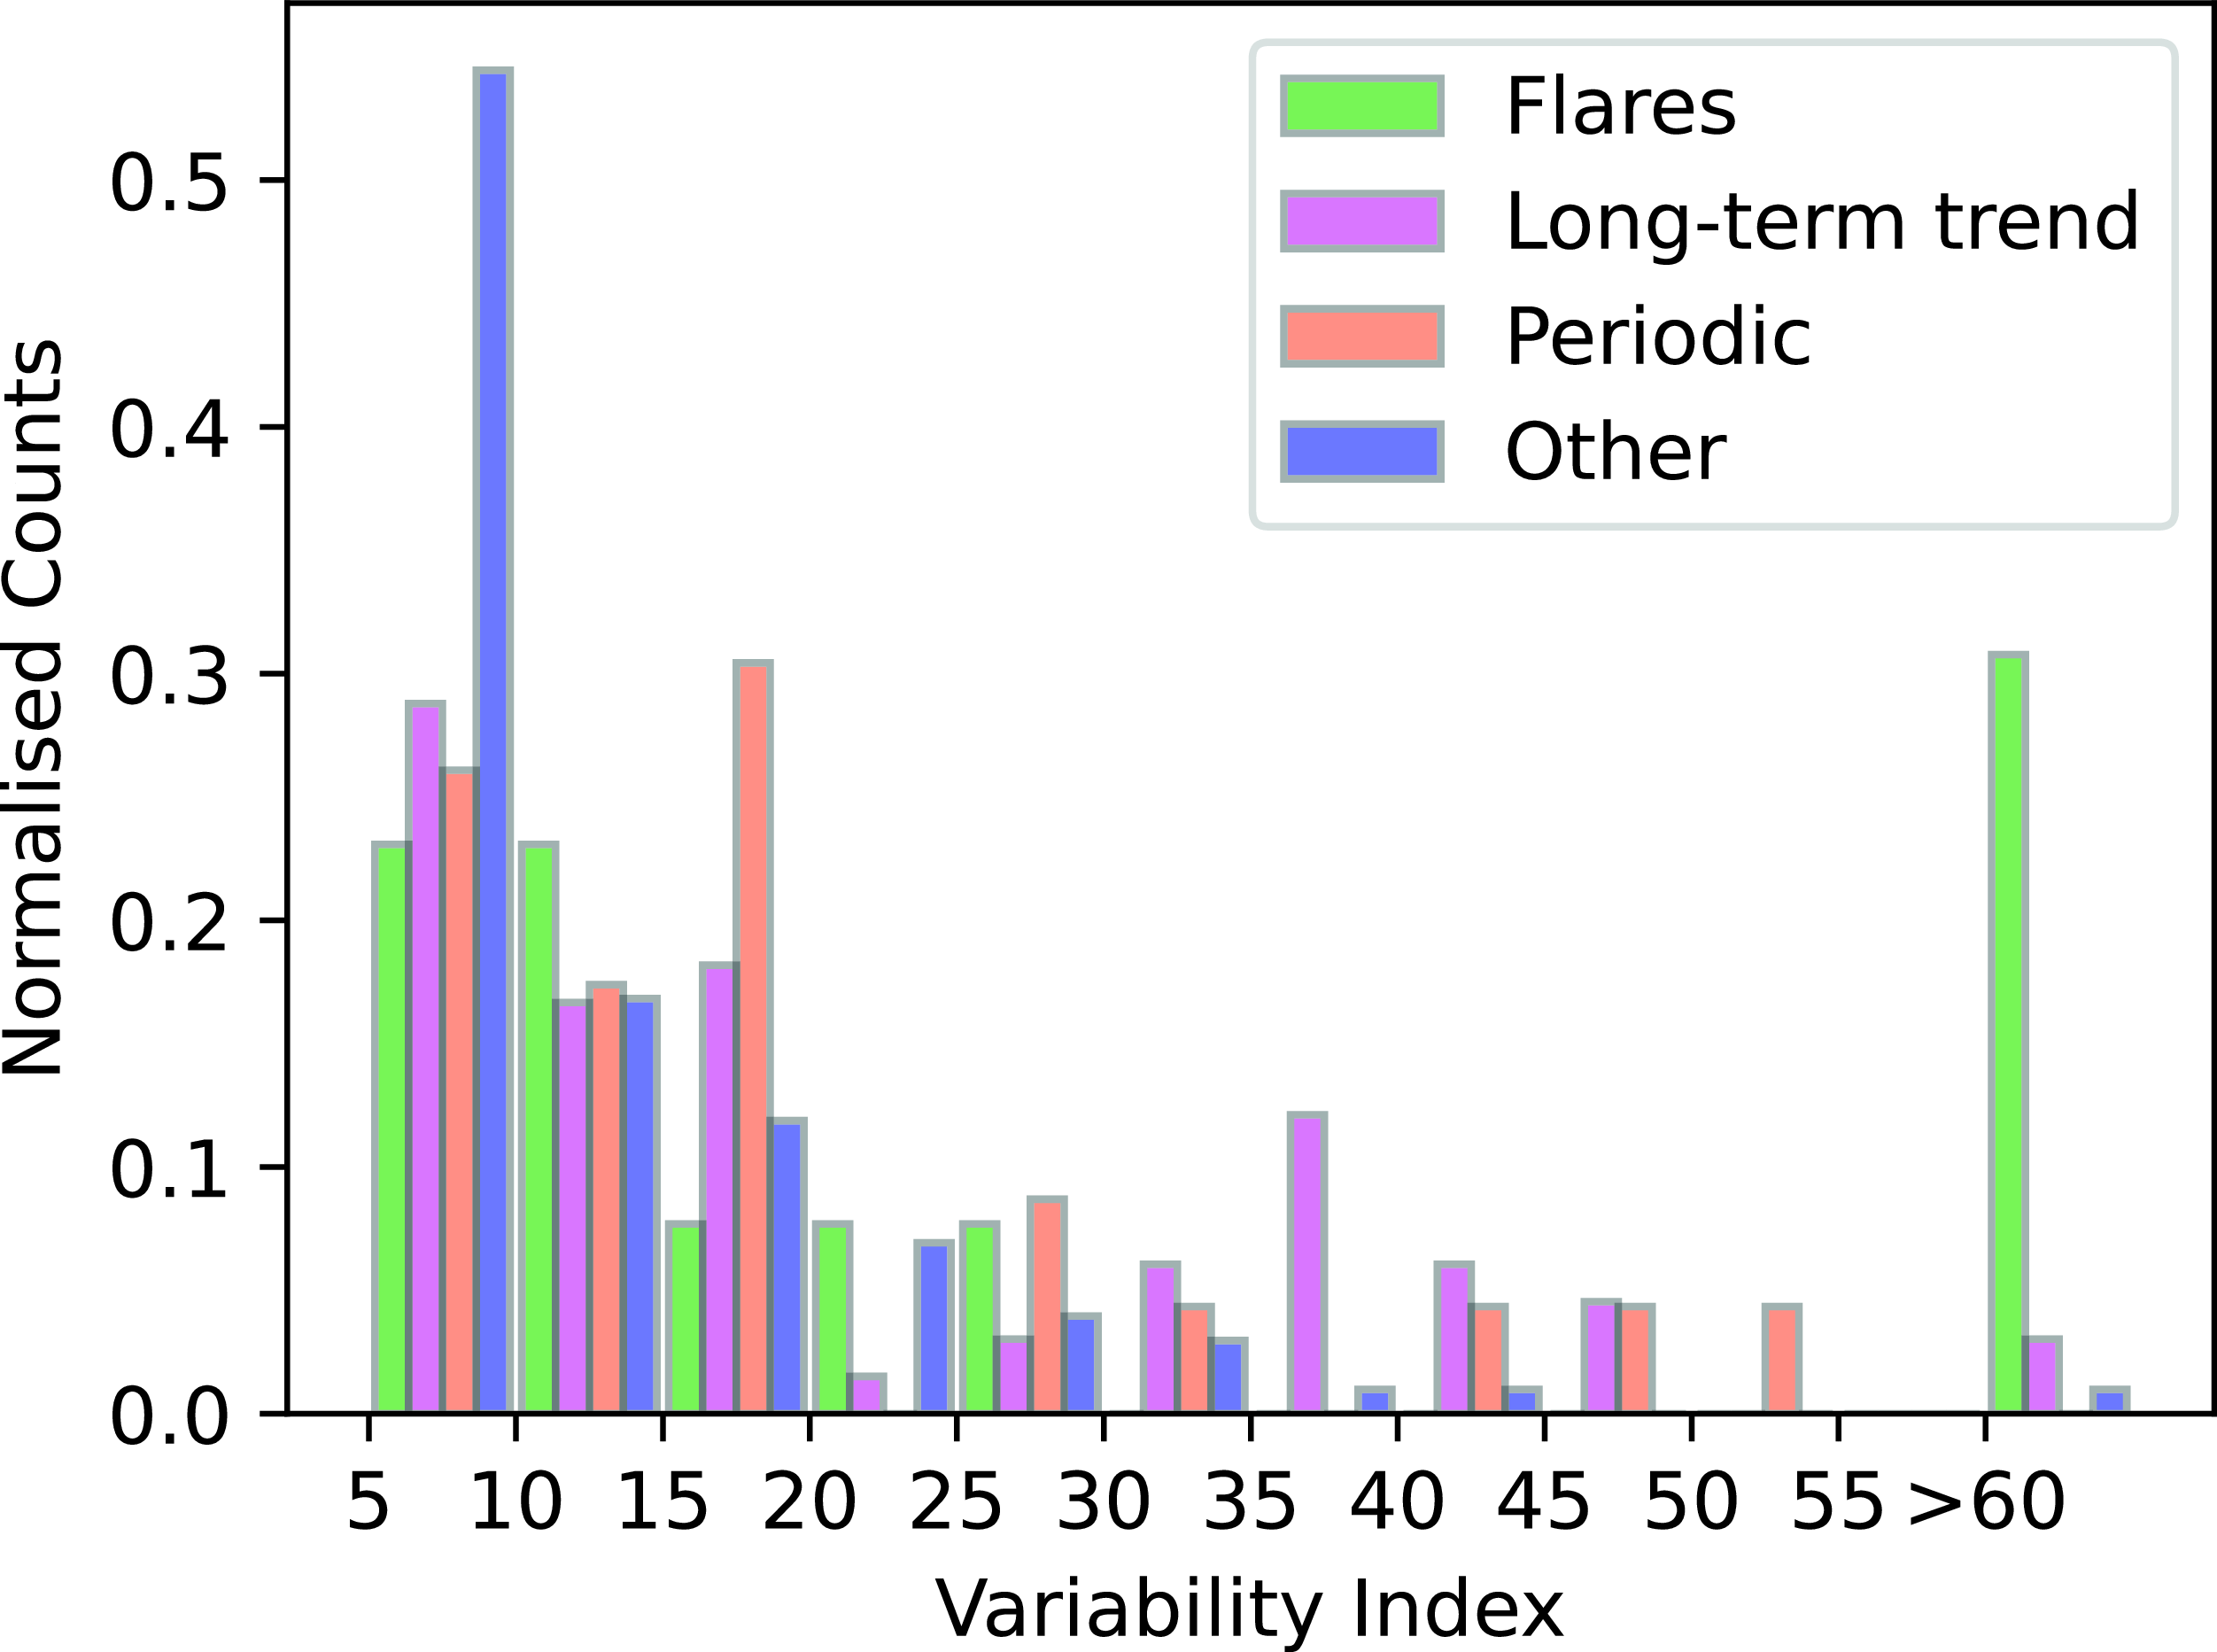
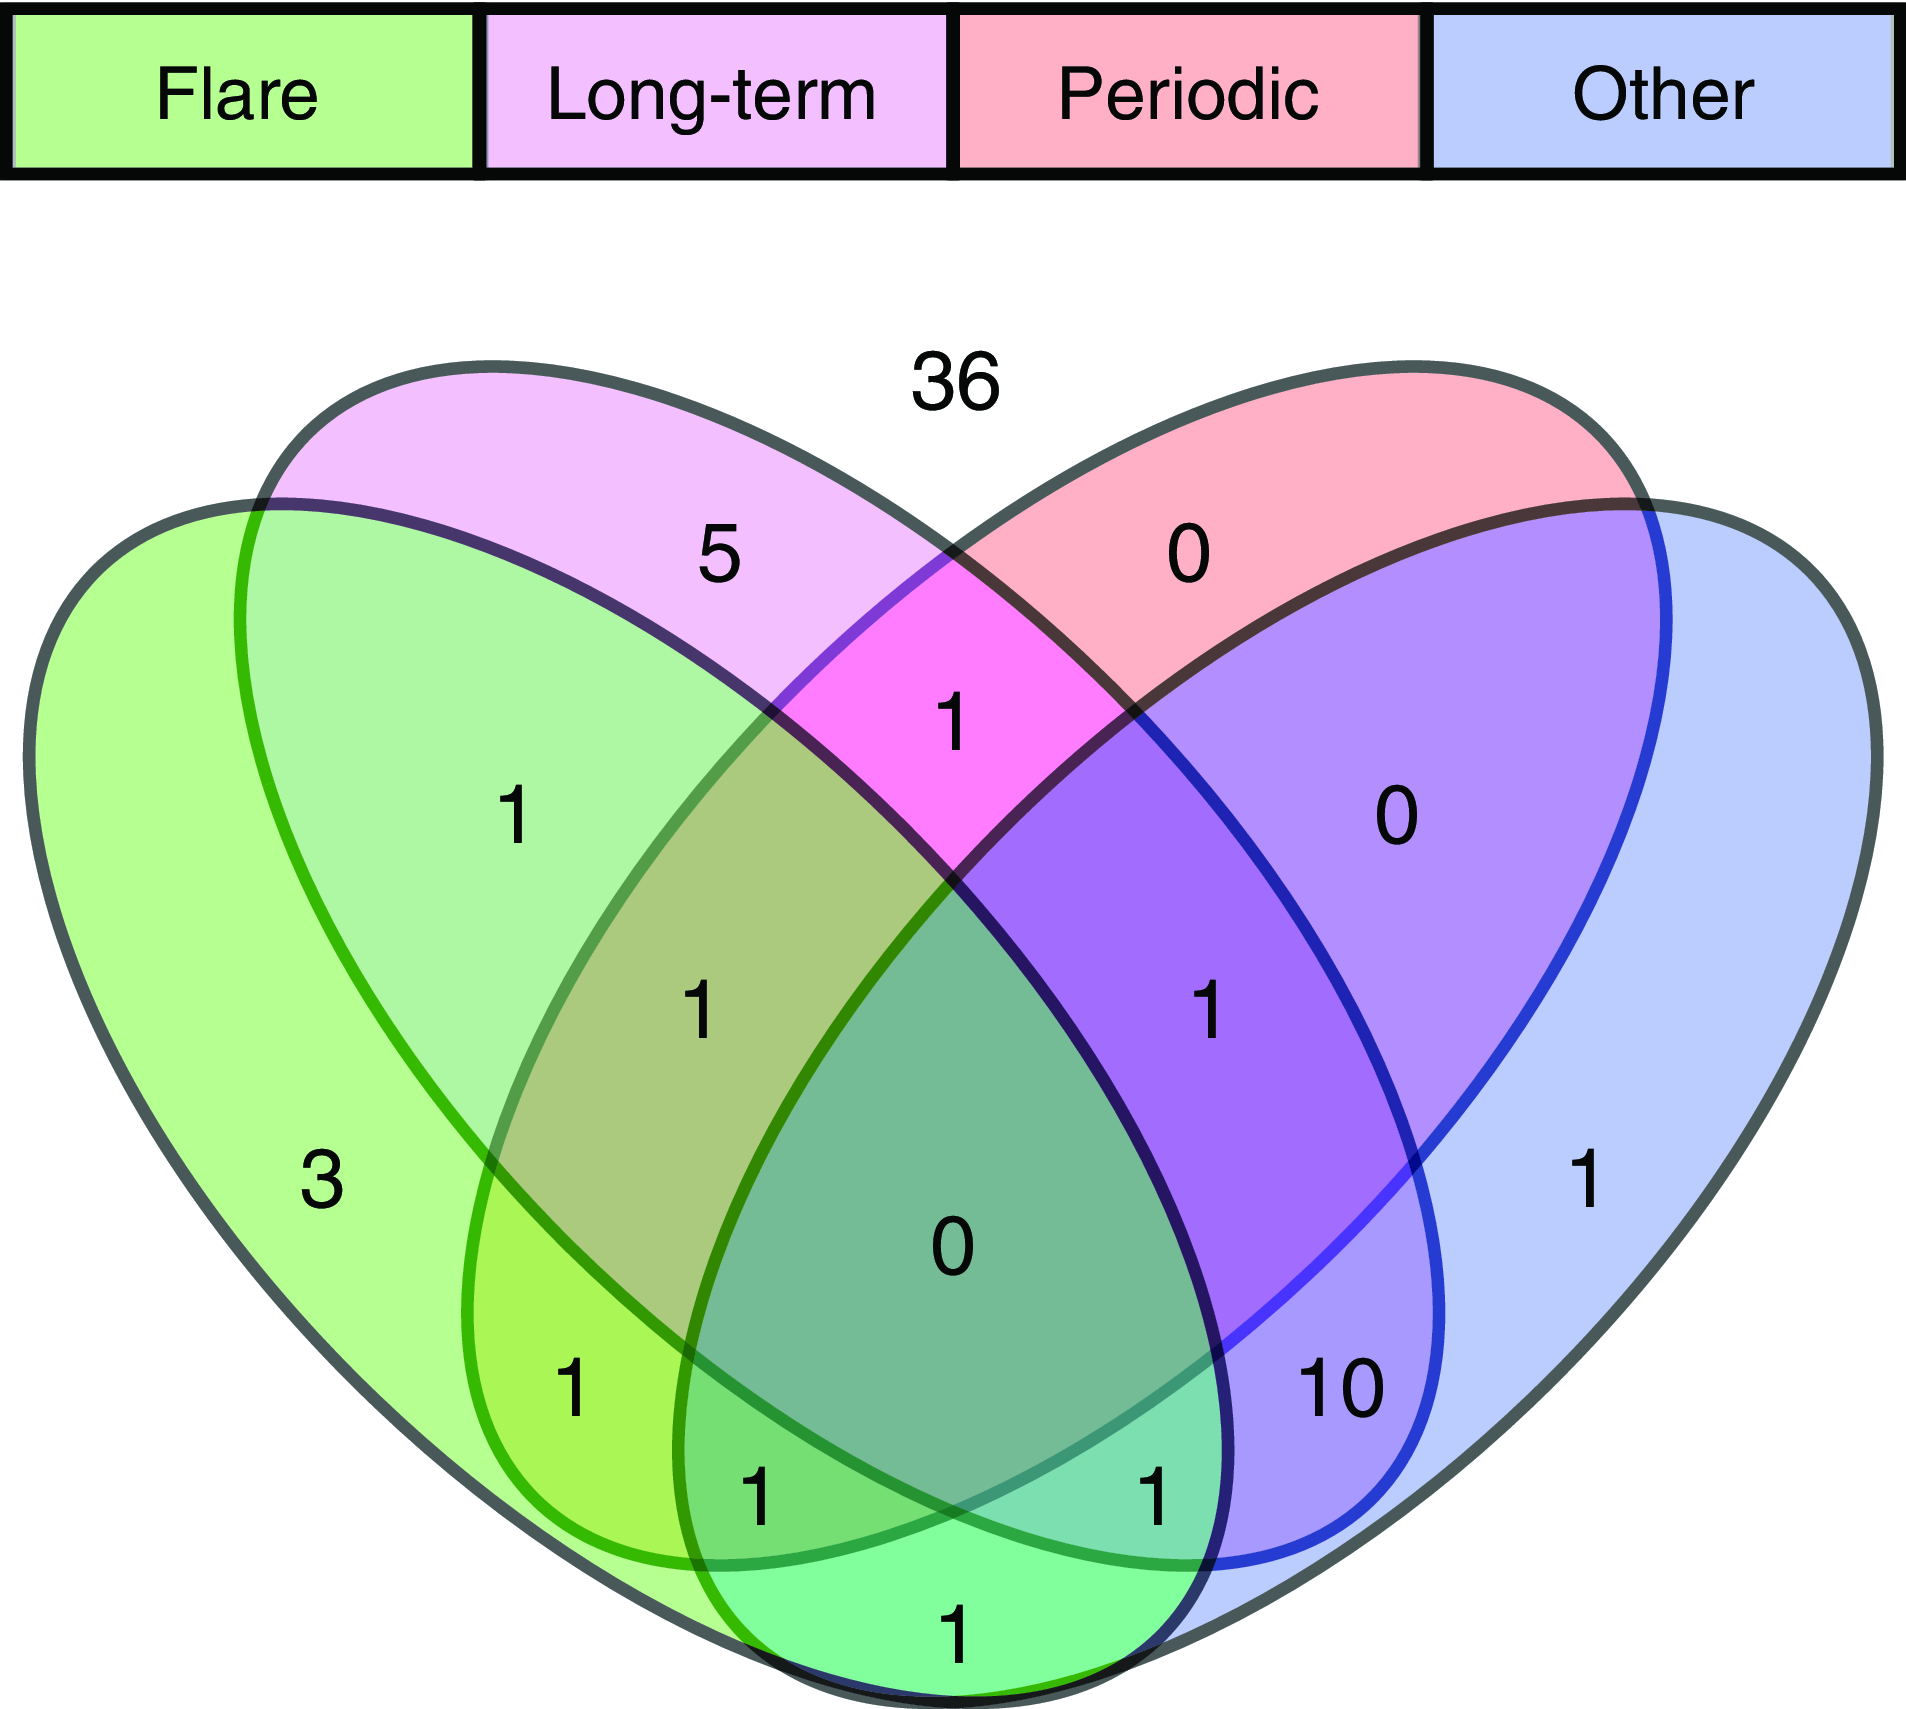
The categorisation of each individual maser feature is shown in Table 4 under the ‘Variability Type’ heading. The largest category of variability (containing 50% of all features) were those that showed no global trend (called ‘other’), with the ‘long-term trends’ category the next-most common with 33%, followed by periodic (11%) and flares (6%). The distribution of variability index over these four categories of variability is shown in the histogram in Fig. 8. The flaring maser features tend to have higher variability index than the other types of variability. Fig. 9 shows the overlap of each variability category across the 63 HMSFRs targeted in this work. We note that the rough feature identification algorithm may have led to a mis-categorisation of some features as ‘other’, and we expect this category to diminish somewhat in follow-up publications.
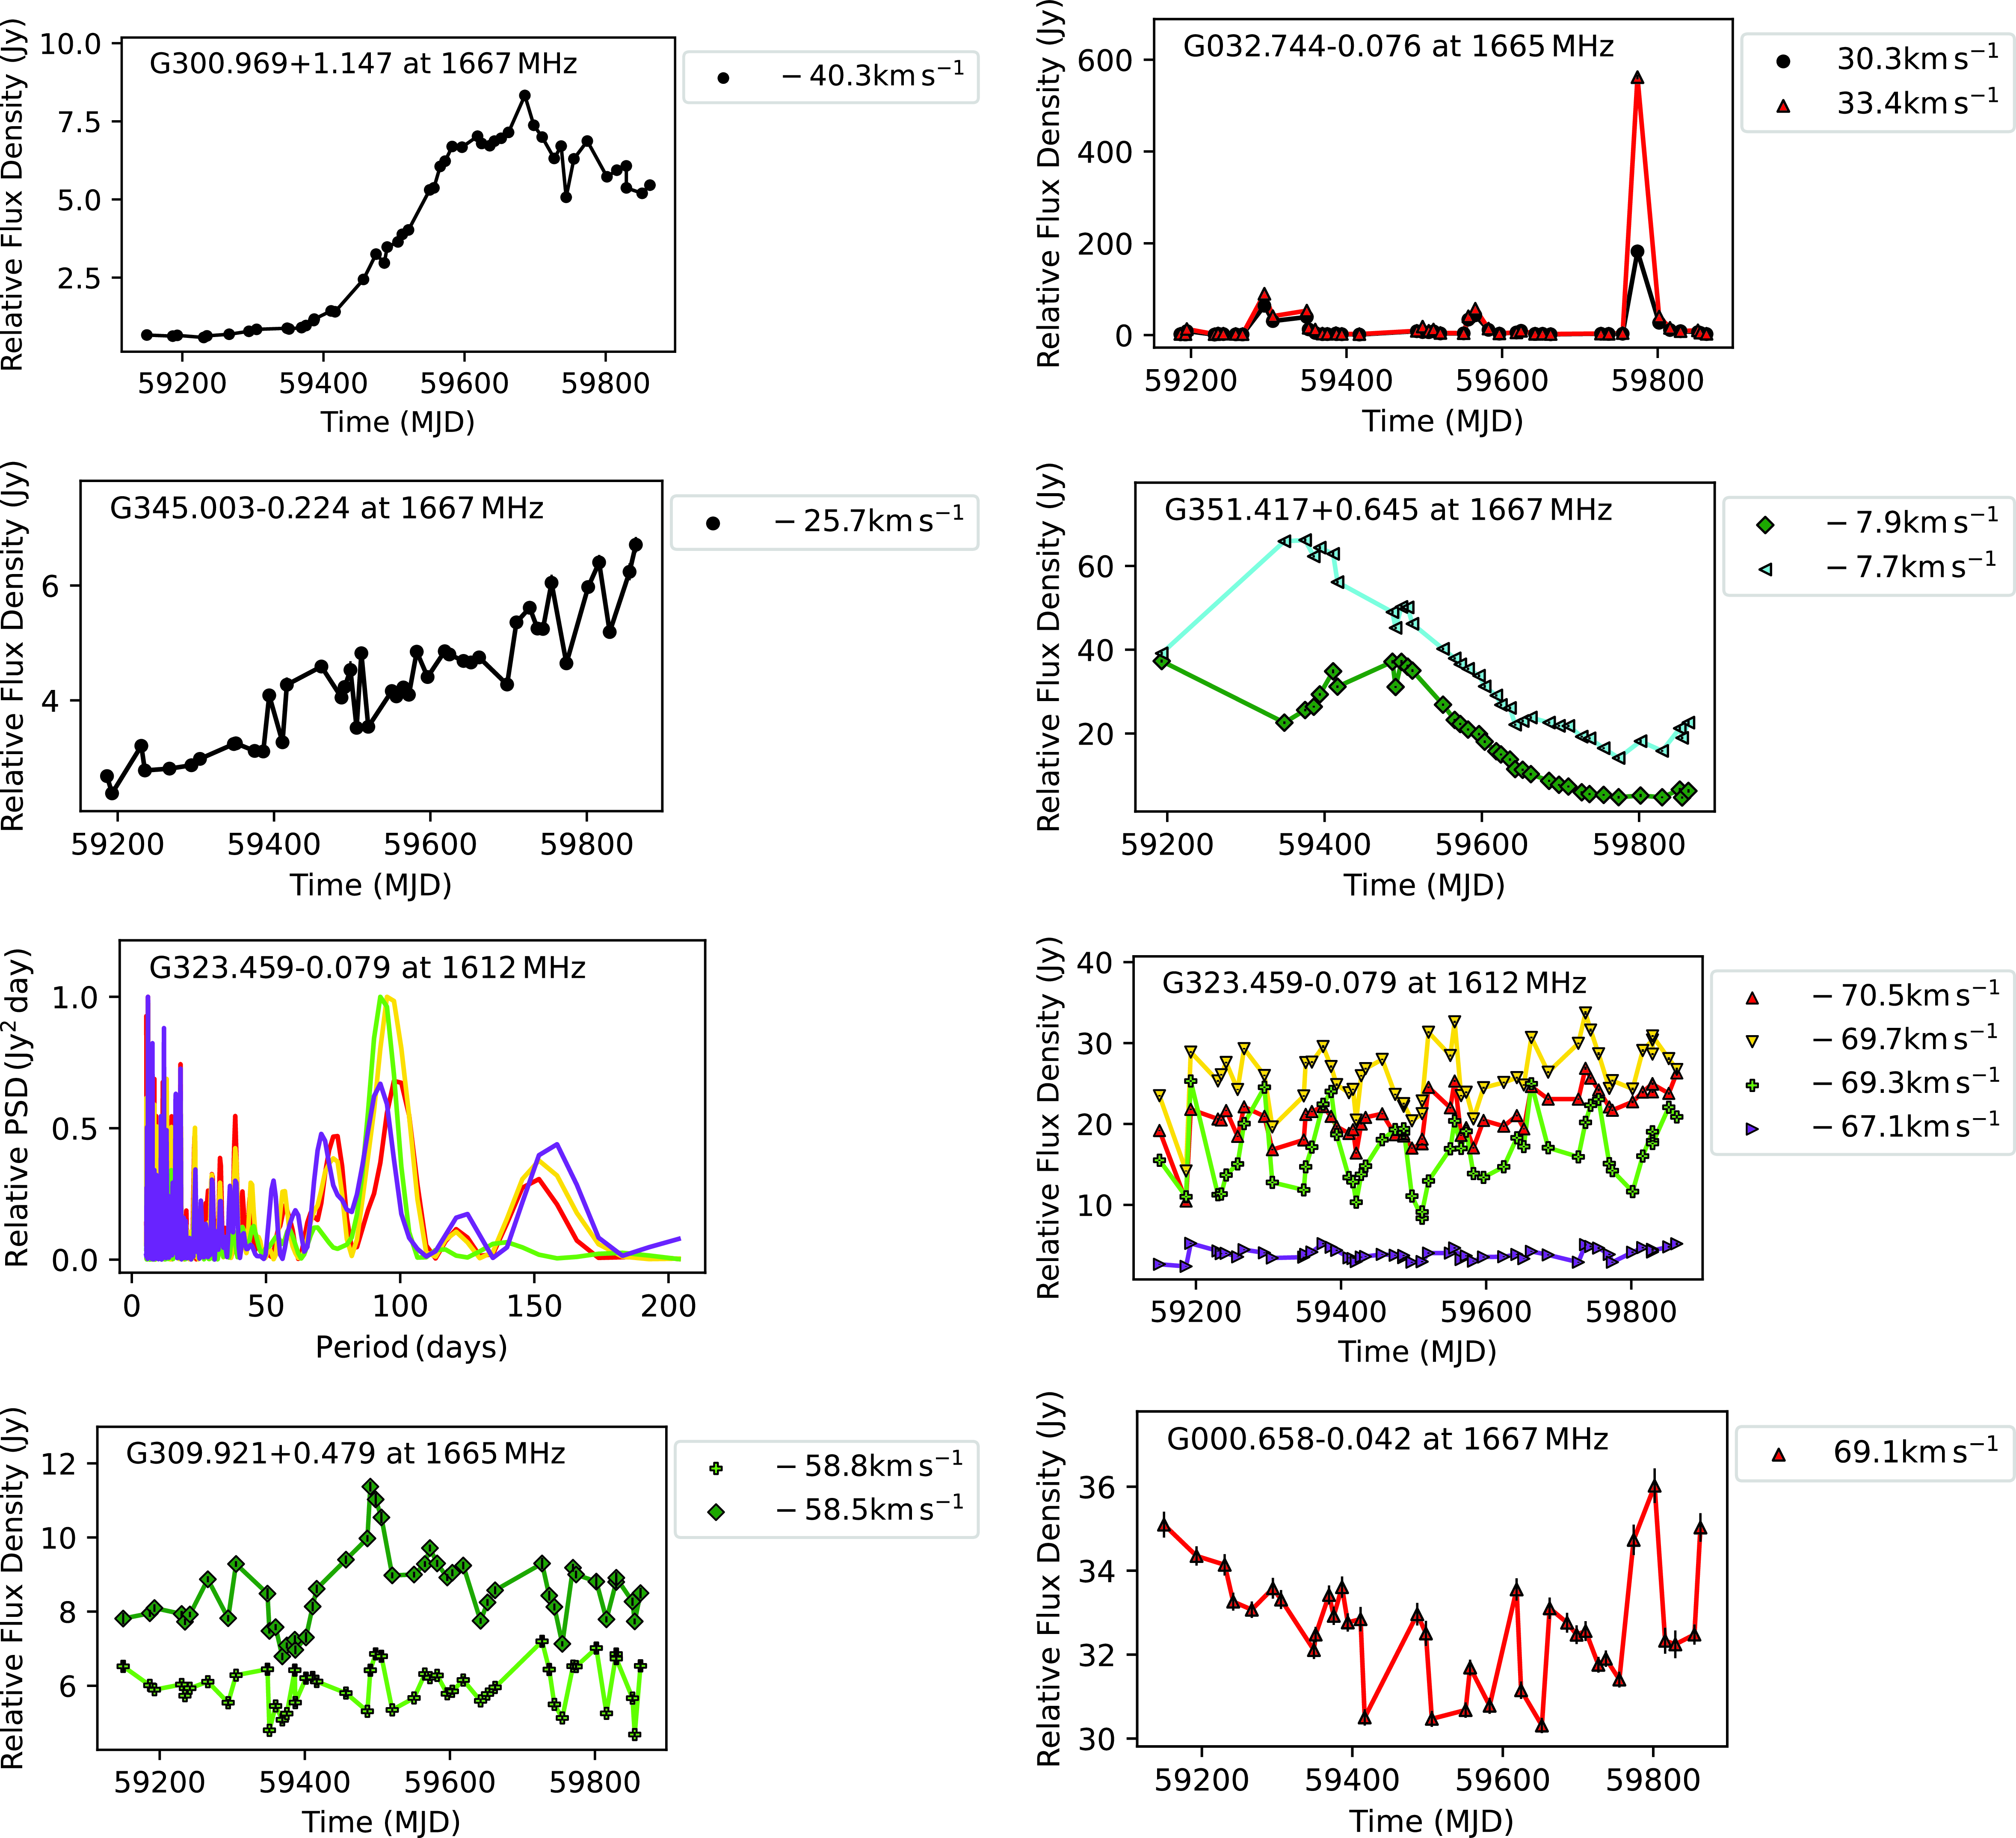
Time-series plots of individual maser features’ peak flux densities, grouped by variability type, are shown in the Appendix in Figs. B1 (Flares), C1–C4 (Long-term trends), D1–D3 (Periodic, and also showLomb–Scargle periodograms, Lomb Reference Lomb1976; Scargle Reference Scargle1982), and Figs. E1–E5 (Other). The locations of these plots are indexed in Table 4 under the ‘Flux vs time Fig.’ heading. Examples of each type of variability are shown in Fig. 10.
The vast majority of features identified in this work appear to be due to changes in the masing gas and/or its radiative pumping rather than in the background continuum source. The only possible exception to this is G327.291 $-$
0.577, where changes in the off-source-subtracted baseline match the changes in the intensity of the maser feature. In all other cases the off-source-subtracted baselines of all spectra were either constant, or their variation did not match that seen in the maser intensity.
$-$
0.577, where changes in the off-source-subtracted baseline match the changes in the intensity of the maser feature. In all other cases the off-source-subtracted baselines of all spectra were either constant, or their variation did not match that seen in the maser intensity.
The distribution of maser feature variability index (see Equation (5)) across maser transition.
Venn diagram showing the overlap of occurrence of variable maser features in the targeted HMSFRs across the four ground-rotational state OH maser transitions identified in the M2P2 project.
5. Discussion
In this section we discuss the general patterns of variability observed in this data set and describe each source for which significant variability is observed. We see variations in maser feature intensity across a wide range of timescales from continuous, nearly linear ongoing changes (see G023.010 $-$
0.411 at 1 667 MHz in Fig. C4) to rapid changes likely on timescales shorter than the weekly cadence of observations (see G330.953
$-$
0.411 at 1 667 MHz in Fig. C4) to rapid changes likely on timescales shorter than the weekly cadence of observations (see G330.953 $-$
0.182 at 1 665 MHz at
$-$
0.182 at 1 665 MHz at $-91.0$
km s
$-91.0$
km s $^{-1}$
in Fig. E2). We see both small changes in absolute intensity (see G343.127
$^{-1}$
in Fig. E2). We see both small changes in absolute intensity (see G343.127 $-$
0.063 at 1 612 MHz at
$-$
0.063 at 1 612 MHz at $-29.7$
km s
$-29.7$
km s $^{-1}$
in Fig. C2) to enormous changes (see G032.744
$^{-1}$
in Fig. C2) to enormous changes (see G032.744 $-$
0.076 at 1 665 MHz at 33.4 km s
$-$
0.076 at 1 665 MHz at 33.4 km s $^{-1}$
in Fig. B1). We see several HMSFRs with only a single significantly varying maser feature across the four 18 cm transitions of OH (G305.362+0.185, G312.598+0.045, G322.158+0.636, G338.925+0.557, and G036.705+0.096), as well as three HMSFRs that each have 16 significantly varying maser features (G323.459
$^{-1}$
in Fig. B1). We see several HMSFRs with only a single significantly varying maser feature across the four 18 cm transitions of OH (G305.362+0.185, G312.598+0.045, G322.158+0.636, G338.925+0.557, and G036.705+0.096), as well as three HMSFRs that each have 16 significantly varying maser features (G323.459 $-$
0.079, G351.417+0.645, and G351.775
$-$
0.079, G351.417+0.645, and G351.775 $-$
0.536).
$-$
0.536).
The following subsections outline the four types of variability identified and describe trends and patterns seen towards each source for which that type of variability was observed. We speculate that some features seen in one or more transition towards the same source (i.e. within the $\approx$ $12\,$
arcmin beam) and closely spaced in velocity (i.e. within a few km s
$12\,$
arcmin beam) and closely spaced in velocity (i.e. within a few km s $^{-1}$
) may be associated with one another, by which we mean that the clouds of gas they represent may be local to one another and may therefore be exposed to the same local environmental conditions. We intend to refine and test these speculations in subsequent publications.
$^{-1}$
) may be associated with one another, by which we mean that the clouds of gas they represent may be local to one another and may therefore be exposed to the same local environmental conditions. We intend to refine and test these speculations in subsequent publications.
Maser features with significant variability identified towards the G339.622 $-$
0.121 HMSFR. All observed spectra for a given transition are overlaid in grey to illustrate the range of intensities seen across our observations. The peaks of each maser feature at each observation are shown with symbols, defined in the legends in each plot. Plots for all HMSFRs and transitions at which significant variability is seen are shown in the Appendix.
$-$
0.121 HMSFR. All observed spectra for a given transition are overlaid in grey to illustrate the range of intensities seen across our observations. The peaks of each maser feature at each observation are shown with symbols, defined in the legends in each plot. Plots for all HMSFRs and transitions at which significant variability is seen are shown in the Appendix.
The distribution of maser feature variability index (see Equation (5)) across variability type.
Venn diagram showing the overlap of occurrence of the different categories of variability in the targeted HMSFRs in the M2P2 project.
In many cases more than one type of variability was seen towards a given source (see Fig. 9), so many sources will appear more than once in the following subsections. In the final subsection we speculate on possible astrophysical mechanisms for the observed types of intensity variation.
5.1. Flares
Fig. B1 shows individual maser features for which flares are observed. Though this was the smallest category of variability, accounting for only 6% of overall detections, the behaviour of these features is nonetheless diverse. All but one of the flares observed had a baseline intensity below our detection limit, but this is where the similarities end. In this group we see both slow and rapid increases in intensity, single and repeating flares, and both simultaneous and delayed flares. Some of the features have returned to their pre-flare intensity while some were still in an active flare state at the end of observations.
G300.969+1.147 – A single flaring feature is seen at 1 667 MHz at $-40.3$
km s
$-40.3$
km s $^{-1}$
beginning at modified Julian date (MJD) 59400 (5 July 2021) and reaching a peak at MJD 59685 (16 April 2022), after which its intensity declined steadily. This flare was still ongoing at the end of observations.
$^{-1}$
beginning at modified Julian date (MJD) 59400 (5 July 2021) and reaching a peak at MJD 59685 (16 April 2022), after which its intensity declined steadily. This flare was still ongoing at the end of observations.
G312.598+0.045 – A single flaring feature is seen at 1 665 MHz at $-69.7$
km s
$-69.7$
km s $^{-1}$
beginning at MJD 59650 (12 March 2022). It rose in intensity over approximately 100 days then has since shown variable intensity around a gently decreasing average.
$^{-1}$
beginning at MJD 59650 (12 March 2022). It rose in intensity over approximately 100 days then has since shown variable intensity around a gently decreasing average.
Examples of the four categories of variability identified in the M2P2 project. From top to bottom the categories are flares, long-term trends, periodic and ‘other’. Each panel shows the behaviour of the peak intensities of the given features over time, with the exception of the left-hand plot in the third row which shows a periodogram with coloured traces corresponding to the peaks whose time behaviour is shown in the right-hand panel. All other plots are shown in the Appendix.
G339.622 $-$
0.121 – A single flaring feature is seen at 1 720 MHz at
$-$
0.121 – A single flaring feature is seen at 1 720 MHz at $-33.8$
km s
$-33.8$
km s $^{-1}$
. The beginning of this flare is not captured in this data set, but it fell below our detection threshold (0.095 Jy) on approximately 59500 MJD (13 October 2021). Before disappearing, it seems to have experienced two smaller flares around MJDs 59300 (27 March 2021) and 59415 (20 July 2021).
$^{-1}$
. The beginning of this flare is not captured in this data set, but it fell below our detection threshold (0.095 Jy) on approximately 59500 MJD (13 October 2021). Before disappearing, it seems to have experienced two smaller flares around MJDs 59300 (27 March 2021) and 59415 (20 July 2021).
G351.417+0.645 – A single flaring feature is seen at 1 612 MHz at $-7.5$
km s
$-7.5$
km s $^{-1}$
beginning at MJD
$^{-1}$
beginning at MJD $\approx 59500$
(13 October 2021) and continuing to the end of available observations.
$\approx 59500$
(13 October 2021) and continuing to the end of available observations.
G012.216 $-$
0.119 – A single flaring feature is seen at 1 667 MHz at
$-$
0.119 – A single flaring feature is seen at 1 667 MHz at $15.7$
km s
$15.7$
km s $^{-1}$
, likely beginning near MJD 59600 (21 January 2022).
$^{-1}$
, likely beginning near MJD 59600 (21 January 2022).
G023.010 $-$
0.411 – Two flaring features are seen at 1 665 MHz at
$-$
0.411 – Two flaring features are seen at 1 665 MHz at $67.4$
and
$67.4$
and $68.1$
km s
$68.1$
km s $^{-1}$
. This data set captures both flares in full, and both appear to have the same duration of approximately 200 days. However, there is a significant delay between them, with the feature at
$^{-1}$
. This data set captures both flares in full, and both appear to have the same duration of approximately 200 days. However, there is a significant delay between them, with the feature at $68.1$
km s
$68.1$
km s $^{-1}$
peaking first at MJD 59310 (6 April 2021) and the feature at
$^{-1}$
peaking first at MJD 59310 (6 April 2021) and the feature at $67.4$
km s
$67.4$
km s $^{-1}$
peaking later at MJD 59410 (15 July 2021). The time profile of the two flares also differ. While the flare at
$^{-1}$
peaking later at MJD 59410 (15 July 2021). The time profile of the two flares also differ. While the flare at $68.1$
km s
$68.1$
km s $^{-1}$
rises and falls symmetrically, the feature at
$^{-1}$
rises and falls symmetrically, the feature at $67.4$
km s
$67.4$
km s $^{-1}$
appears to drop sharply after its initial increase in intensity, then remain relatively constant before dropping again (though this flare is not as well sampled due to a gap in observations) resulting in an asymmetrical shape. Though it is clear from their spectra that these features due not represent the same gas, they may represent pockets of gas that are close to one another due to their proximity in on-sky position and velocity. Both flares could therefore have the same cause, and the delay in the flares could be due to some physical ‘time-of-flight’ effect, for example, as a shock travels from one region to another, etc.
$^{-1}$
appears to drop sharply after its initial increase in intensity, then remain relatively constant before dropping again (though this flare is not as well sampled due to a gap in observations) resulting in an asymmetrical shape. Though it is clear from their spectra that these features due not represent the same gas, they may represent pockets of gas that are close to one another due to their proximity in on-sky position and velocity. Both flares could therefore have the same cause, and the delay in the flares could be due to some physical ‘time-of-flight’ effect, for example, as a shock travels from one region to another, etc.
G030.703 $-$
0.069 – A single flaring feature is seen at 1 667 MHz at
$-$
0.069 – A single flaring feature is seen at 1 667 MHz at $81.5$
km s
$81.5$
km s $^{-1}$
.
$^{-1}$
.
G032.744 $-$
0.076 – Four flaring features are seen at 1 665 and 1 667 MHz at similar velocities: in 1 665 MHz at
$-$
0.076 – Four flaring features are seen at 1 665 and 1 667 MHz at similar velocities: in 1 665 MHz at $30.3$
and
$30.3$
and $33.4$
km s
$33.4$
km s $^{-1}$
, and in 1667 MHz at
$^{-1}$
, and in 1667 MHz at $30.9$
and
$30.9$
and $32.7$
km s
$32.7$
km s $^{-1}$
. The profiles of these flares over time are nearly identical across velocity and transition, implying that all four may be associated, and therefore may have the same cause. Interestingly, these appear to be regularly re-occurring flares, repeating with a cadence of approximately 200 days.
$^{-1}$
. The profiles of these flares over time are nearly identical across velocity and transition, implying that all four may be associated, and therefore may have the same cause. Interestingly, these appear to be regularly re-occurring flares, repeating with a cadence of approximately 200 days.
G036.705+0.096 – A single flaring feature is seen at 1 720 MHz at $95.9$
km s
$95.9$
km s $^{-1}$
. The observations do not show the start of the flare, but its intensity drops below the detection limit (0.147 Jy) at some point between MJD 59800 (9 August 2022) and 59815 (24 August 2022).
$^{-1}$
. The observations do not show the start of the flare, but its intensity drops below the detection limit (0.147 Jy) at some point between MJD 59800 (9 August 2022) and 59815 (24 August 2022).
5.2. Long-term trends
Figs. C1–C4 show individual maser features for which long-term trends are observed. A significant portion of this category display nearly linear increases or decreases in intensity with respect to time across the entire observation period. Another significant portion show meandering behaviour, sometimes increasing and at other times decreasing in intensity over time. A small portion show apparently exponential decreases in intensity over time. Some also show significant variability on top of these trends.
G305.362+0.185 – A single feature with a long-term trend is seen at 1 667 MHz at $-36.7$
km s
$-36.7$
km s $^{-1}$
, though the low number of observations (5) limit our ability to characterise this behaviour further than to identify a significant increase in its intensity over the period of our survey.
$^{-1}$
, though the low number of observations (5) limit our ability to characterise this behaviour further than to identify a significant increase in its intensity over the period of our survey.
G309.921+0.479 – Two features with long-term trends are seen at 1 665 MHz at $-60.0$
and
$-60.0$
and $-59.4$
km s
$-59.4$
km s $^{-1}$
. Both features show a moderate increase in intensity over the period of our observations.
$^{-1}$
. Both features show a moderate increase in intensity over the period of our observations.
G320.232 $-$
0.284 – A single feature with a long-term trend is seen at 1 665 MHz at
$-$
0.284 – A single feature with a long-term trend is seen at 1 665 MHz at $-68.2$
km s
$-68.2$
km s $^{-1}$
. Though there are significant gaps in our observations, the feature appears to have increased in intensity almost linearly from MJD 59475 (18 September 2021) to the end of the available data (MJD 59830: 8 September 2022).
$^{-1}$
. Though there are significant gaps in our observations, the feature appears to have increased in intensity almost linearly from MJD 59475 (18 September 2021) to the end of the available data (MJD 59830: 8 September 2022).
G322.158+0.636 – A single feature with a long-term trend is seen at 1 665 MHz at $-60.8$
km s
$-60.8$
km s $^{-1}$
. Though the cadence of observations of this source was low, the feature increased then decreased in intensity through the period of observations.
$^{-1}$
. Though the cadence of observations of this source was low, the feature increased then decreased in intensity through the period of observations.
G323.459 $-$
0.079 – Five features with long-term trends are seen at 1 612 MHz at
$-$
0.079 – Five features with long-term trends are seen at 1 612 MHz at $-70.8$
,
$-70.8$
, $-70.1$
,
$-70.1$
, $-69.0$
,
$-69.0$
, $-68.4$
, and
$-68.4$
, and $-68.3$
km s
$-68.3$
km s $^{-1}$
. All of these features show similar behaviour with significant variation on top of a generally increasing trend. The feature at
$^{-1}$
. All of these features show similar behaviour with significant variation on top of a generally increasing trend. The feature at $-68.4$
km s
$-68.4$
km s $^{-1}$
may be associated with features identified at 1 665 and 1 667 MHz at the same velocity (both categorised as periodic) due to their proximity in on-sky position and velocity. The changes in their intensities may therefore have a common cause. We note that the features at
$^{-1}$
may be associated with features identified at 1 665 and 1 667 MHz at the same velocity (both categorised as periodic) due to their proximity in on-sky position and velocity. The changes in their intensities may therefore have a common cause. We note that the features at $-70.8$
and
$-70.8$
and $-70.1$
km s
$-70.1$
km s $^{-1}$
are significantly blended with other features in this source, namely by the periodically varying feature between them at
$^{-1}$
are significantly blended with other features in this source, namely by the periodically varying feature between them at $-70.5$
km s
$-70.5$
km s $^{-1}$
. This may drive some of the apparently stochastic variation, but the overall increasing trend is not seen in the other nearby features. This will be more clear in a subsequent publication where we intend to use more sophisticated fitting techniques.
$^{-1}$
. This may drive some of the apparently stochastic variation, but the overall increasing trend is not seen in the other nearby features. This will be more clear in a subsequent publication where we intend to use more sophisticated fitting techniques.
G327.291 $-$
0.577 – A single feature with a long-term trend is seen at 1 612 MHz at
$-$
0.577 – A single feature with a long-term trend is seen at 1 612 MHz at $5.8$
km s
$5.8$
km s $^{-1}$
. Though the cadence of observations of this source was low, the feature increased then decreased in intensity through the period of observations.
$^{-1}$
. Though the cadence of observations of this source was low, the feature increased then decreased in intensity through the period of observations.
G330.878 $-$
0.367 – Two features with long-term trends are seen at 1 667 MHz at
$-$
0.367 – Two features with long-term trends are seen at 1 667 MHz at $-64.7$
and
$-64.7$
and $-64.3$
km s
$-64.3$
km s $^{-1}$
. These two features show similar variation along with a slow increasing trend. The feature at
$^{-1}$
. These two features show similar variation along with a slow increasing trend. The feature at $-64.7$
km s
$-64.7$
km s $^{-1}$
may be associated with another feature identified at 1 665 MHz at
$^{-1}$
may be associated with another feature identified at 1 665 MHz at $-65.0$
km s
$-65.0$
km s $^{-1}$
(categorised as ‘other’) due to their proximity in on-sky position and velocity, though the pattern of their intensities over time do not appear to be similar.
$^{-1}$
(categorised as ‘other’) due to their proximity in on-sky position and velocity, though the pattern of their intensities over time do not appear to be similar.
G330.953 $-$
0.182 – A single feature with a long-term trend is seen at 1 665 MHz at
$-$
0.182 – A single feature with a long-term trend is seen at 1 665 MHz at $-86.0$
km s
$-86.0$
km s $^{-1}$
. The feature increased in intensity linearly over the period of our observations while also showing some periods of more complex variability from MJD 59380 to 59500 (15 June to 13 October 2021) and from MJD 59750 to end of available observations on MJD 59865 (20 June to 13 October 2022).
$^{-1}$
. The feature increased in intensity linearly over the period of our observations while also showing some periods of more complex variability from MJD 59380 to 59500 (15 June to 13 October 2021) and from MJD 59750 to end of available observations on MJD 59865 (20 June to 13 October 2022).
G331.278 $-$
0.188 – A single feature with a long-term trend is seen at 1 665 MHz at
$-$
0.188 – A single feature with a long-term trend is seen at 1 665 MHz at $-89.3$
km s
$-89.3$
km s $^{-1}$
where the intensity of the feature varies significantly on top of an overall decreasing trend.
$^{-1}$
where the intensity of the feature varies significantly on top of an overall decreasing trend.
G338.925+0.557 – A single feature with a long-term trend is seen at 1 665 MHz at $-61.1$
km s
$-61.1$
km s $^{-1}$
. The intensity of the feature varies significantly, but with an underlying trend of a decrease in intensity before MJD 59450 (24 August 2021) followed by an increase until the end of available observations.
$^{-1}$
. The intensity of the feature varies significantly, but with an underlying trend of a decrease in intensity before MJD 59450 (24 August 2021) followed by an increase until the end of available observations.
G339.884 $-$
1.259 – 12 features with long-term trends are seen at 1 665, 1 667, and 1 720 MHz. The feature at 1 665 MHz at
$-$
1.259 – 12 features with long-term trends are seen at 1 665, 1 667, and 1 720 MHz. The feature at 1 665 MHz at $-35.3$
km s
$-35.3$
km s $^{-1}$
is decreasing in intensity through the period of our observations, the feature at
$^{-1}$
is decreasing in intensity through the period of our observations, the feature at $-33.2$
km s
$-33.2$
km s $^{-1}$
increases then decreases, and all other features at this frequency increase in intensity over time. The behaviour of the
$^{-1}$
increases then decreases, and all other features at this frequency increase in intensity over time. The behaviour of the $-33.2$
km s
$-33.2$
km s $^{-1}$
feature at 1 665 MHz is very similar to that of the feature identified at 1 667 MHz at
$^{-1}$
feature at 1 665 MHz is very similar to that of the feature identified at 1 667 MHz at $-33.4$
. This and their proximity in on-sky position and velocity suggest that the two features may be associated. All other features at 1 667 and 1 720 MHz show a decline in intensity over the period of observations.
$-33.4$
. This and their proximity in on-sky position and velocity suggest that the two features may be associated. All other features at 1 667 and 1 720 MHz show a decline in intensity over the period of observations.
G343.127 $-$
0.063 – Eight features with long-term trends are seen at 1 612 and 1 665 MHz. All of the features at 1 612 MHz increase in intensity over time, while all the features at 1 665 MHz but the feature at
$-$
0.063 – Eight features with long-term trends are seen at 1 612 and 1 665 MHz. All of the features at 1 612 MHz increase in intensity over time, while all the features at 1 665 MHz but the feature at $-30.7$
km s
$-30.7$
km s $^{-1}$
decrease in intensity over time.
$^{-1}$
decrease in intensity over time.
G345.003 $-$
0.224 – Three features with long-term trends are seen at 1 665, 1 667, and 1 720 MHz at
$-$
0.224 – Three features with long-term trends are seen at 1 665, 1 667, and 1 720 MHz at $-25.0$
,
$-25.0$
, $-25.7$
and
$-25.7$
and $-29.2$
km s
$-29.2$
km s $^{-1}$
, respectively. The features in the main lines increase in intensity over time while the feature at 1 720 MHz decreases.
$^{-1}$
, respectively. The features in the main lines increase in intensity over time while the feature at 1 720 MHz decreases.
G351.417+0.645 – Three features with long-term trends are seen at 1 665 and 1 667 MHz at $-7.9$
(in both lines) and
$-7.9$
(in both lines) and $-7.7$
km s
$-7.7$
km s $^{-1}$
(at 1 667 MHz). After approximately 59500 MJD (13 October 2021) the behaviour of all three features is very similar, decreasing in intensity over time. While the feature at 1 665 MHz at
$^{-1}$
(at 1 667 MHz). After approximately 59500 MJD (13 October 2021) the behaviour of all three features is very similar, decreasing in intensity over time. While the feature at 1 665 MHz at $-7.9$
km s
$-7.9$
km s $^{-1}$
also showed a steady decline before this time, the features at 1 667 MHz were quite different. At the beginning of the observation epoch at 59200 MJD (17 December 2020) both features at 1 667 MHz had almost identical intensity, but then after a gap in observations (of
$^{-1}$
also showed a steady decline before this time, the features at 1 667 MHz were quite different. At the beginning of the observation epoch at 59200 MJD (17 December 2020) both features at 1 667 MHz had almost identical intensity, but then after a gap in observations (of $\approx$
150 days) the intensity of the feature at
$\approx$
150 days) the intensity of the feature at $-7.7$
km s
$-7.7$
km s $^{-1}$
has increased by nearly 70% while the feature at
$^{-1}$
has increased by nearly 70% while the feature at $-7.9$
km s
$-7.9$
km s $^{-1}$
decreased by 40%. The feature at
$^{-1}$
decreased by 40%. The feature at $-7.7$
km s
$-7.7$
km s $^{-1}$
then decreases in intensity for the remainder of the observations, while the feature at
$^{-1}$
then decreases in intensity for the remainder of the observations, while the feature at $-7.9$
km s
$-7.9$
km s $^{-1}$
increases until about 59500 MJD (13 October 2021), after which it decreases exponentially. The proximity of these 3 features in on-sky position and velocity implies that this odd behaviour may have a common cause.
$^{-1}$
increases until about 59500 MJD (13 October 2021), after which it decreases exponentially. The proximity of these 3 features in on-sky position and velocity implies that this odd behaviour may have a common cause.
G351.775 $-$
0.536 – Eight features with long-term trends are seen at 1 612, 1 665, and 1 720 MHz. It does not appear that the features across transitions are associated, partially due to their separation in velocity, but mainly due to the fact that 1 612 and 1 720 MHz masers do not generally trace the same environments as 1 665 MHz masers.
$-$
0.536 – Eight features with long-term trends are seen at 1 612, 1 665, and 1 720 MHz. It does not appear that the features across transitions are associated, partially due to their separation in velocity, but mainly due to the fact that 1 612 and 1 720 MHz masers do not generally trace the same environments as 1 665 MHz masers.
G000.658 $-$
0.042 – Four features with long-term trends are seen at 1 665 and 1 667 MHz, all showing decreasing intensity over time. Two of the features at 1 665 MHz (at 68.5 and 68.7 km s
$-$
0.042 – Four features with long-term trends are seen at 1 665 and 1 667 MHz, all showing decreasing intensity over time. Two of the features at 1 665 MHz (at 68.5 and 68.7 km s $^{-1}$
) show a change at MJD
$^{-1}$
) show a change at MJD $\approx 59600$
(21 January 2022) where the intensity of the feature at 68.5 km s
$\approx 59600$
(21 January 2022) where the intensity of the feature at 68.5 km s $^{-1}$
begins to increase while the feature at 68.7 km s
$^{-1}$
begins to increase while the feature at 68.7 km s $^{-1}$
stays relatively constant. We note however that these two features are very closely blended and therefore may not be independent given our simplistic identification method. These conclusions may change when a more sophisticated fitting technique is used.
$^{-1}$
stays relatively constant. We note however that these two features are very closely blended and therefore may not be independent given our simplistic identification method. These conclusions may change when a more sophisticated fitting technique is used.
G009.621+0.196 – Two features with long-term trends are seen at 1 665 and 1 667 MHz at 1.4 and 1.6 km s $^{-1}$
, respectively, both of which show a steady increase in intensity followed by a precipitous drop after MJD
$^{-1}$
, respectively, both of which show a steady increase in intensity followed by a precipitous drop after MJD $\approx 59800$
(9 August 2022). The proximity of these features in on-sky position and velocity imply they may be associated, and therefore the changes in their intensities may be due to the same cause. This source is the site of the first discovered periodic 6.7 GHz methanol maser (Goedhart et al. Reference Goedhart, Gaylard and van der Walt2003) with a period of 243.8 days (Goedhart et al. Reference Goedhart, Maswanganye, Gaylard and van derWalt2014), but our data do not suggest any significant periodic behaviour.
$\approx 59800$
(9 August 2022). The proximity of these features in on-sky position and velocity imply they may be associated, and therefore the changes in their intensities may be due to the same cause. This source is the site of the first discovered periodic 6.7 GHz methanol maser (Goedhart et al. Reference Goedhart, Gaylard and van der Walt2003) with a period of 243.8 days (Goedhart et al. Reference Goedhart, Maswanganye, Gaylard and van derWalt2014), but our data do not suggest any significant periodic behaviour.
G023.010 $-$
0.411 – Seven features with long-term trends are seen in 1 665 and 1 667 MHz. Due to their separation in velocity and the differences in the behaviour of their intensities, it is not likely that the single feature at 1 667 MHz (63.2 km s
$-$
0.411 – Seven features with long-term trends are seen in 1 665 and 1 667 MHz. Due to their separation in velocity and the differences in the behaviour of their intensities, it is not likely that the single feature at 1 667 MHz (63.2 km s $^{-1}$
) is associated with those at 1 665 MHz (lowest velocity 65.5 km s
$^{-1}$
) is associated with those at 1 665 MHz (lowest velocity 65.5 km s $^{-1}$
). That feature at 1 667 MHz increases in intensity throughout the time of our observations. Two of the features at 1 665 MHz at 65.5 and 72.9 km s
$^{-1}$
). That feature at 1 667 MHz increases in intensity throughout the time of our observations. Two of the features at 1 665 MHz at 65.5 and 72.9 km s $^{-1}$
increase moderately from the beginning of observations, but then begin to decrease at MJD
$^{-1}$
increase moderately from the beginning of observations, but then begin to decrease at MJD $\approx 59400$
(5 July 2021) and
$\approx 59400$
(5 July 2021) and $\approx 59500$
(13 October 2021), respectively. Two of the features at 1 665 MHz at 73.4 and 74.6 km s
$\approx 59500$
(13 October 2021), respectively. Two of the features at 1 665 MHz at 73.4 and 74.6 km s $^{-1}$
have very similar intensity behaviour, with roughly constant intensity up to MJD
$^{-1}$
have very similar intensity behaviour, with roughly constant intensity up to MJD $\approx 59500$
(13 October 2021) when they both begin to decrease in intensity. The remaining two features at 1 665 MHz at 72.9 and 76.4 km s
$\approx 59500$
(13 October 2021) when they both begin to decrease in intensity. The remaining two features at 1 665 MHz at 72.9 and 76.4 km s $^{-1}$
decrease in intensity throughout the time of our observations.
$^{-1}$
decrease in intensity throughout the time of our observations.
G024.329+0.144 – Two features with long-term trends are seen in 1 667 MHz at 80.9 and 81.7 km s $^{-1}$
. These features show almost exactly opposite behaviour, with the feature at 80.9 km s
$^{-1}$
. These features show almost exactly opposite behaviour, with the feature at 80.9 km s $^{-1}$
increasing in intensity throughout the observations and the feature at 81.7 km s
$^{-1}$
increasing in intensity throughout the observations and the feature at 81.7 km s $^{-1}$
decreasing.
$^{-1}$
decreasing.
G030.703 $-$
0.069 – A single feature with a long-term trend is seen at 1 665 MHz at
$-$
0.069 – A single feature with a long-term trend is seen at 1 665 MHz at $81.8$
km s
$81.8$
km s $^{-1}$
. Though there is a significant gap in the observations, the intensity decreases during the period of observations.
$^{-1}$
. Though there is a significant gap in the observations, the intensity decreases during the period of observations.
5.3. Periodic
Figs. D1–D3 show individual maser features for which periodic changes in intensity are seen. This periodicity was identified through examination of the time-series behaviour of the feature peaks, but also the periodograms shown in this subsection. The peaks in the periodograms can give an indication of the period of the variability, and in this set we see features with periods from 90 to 800 days.Footnote e Perhaps the most striking trend seen in this data set are the number of maser features within a given beam that share the same period, even across multiple transitions. Most notable among these are G323.459 $-$
0.079 with 11 features across three transitions with a period of
$-$
0.079 with 11 features across three transitions with a period of $\approx$
90 days, and G339.622
$\approx$
90 days, and G339.622 $-$
0.121 with four features across three transitions with a period of
$-$
0.121 with four features across three transitions with a period of $\approx$
200 days.
$\approx$
200 days.
G300.969+1.147 – Two features with periodic variations in intensity are seen in 1 665 MHz, however their identified period of $\approx$
600–800 days is similar to the total length of observations, so further observations will be required to establish that these are not long-term trends rather than periodicity.
$\approx$
600–800 days is similar to the total length of observations, so further observations will be required to establish that these are not long-term trends rather than periodicity.
G323.459 $-$
0.079 – 11 features with periodic variations in intensity are seen in 1 612, 1 665, and 1 667 MHz, by far the highest number of periodic features along a single line-of-sight seen in this data set. Intriguingly, the periodograms of all 11 features have local maxima (and 8 have global maxima) at the same period,
$-$
0.079 – 11 features with periodic variations in intensity are seen in 1 612, 1 665, and 1 667 MHz, by far the highest number of periodic features along a single line-of-sight seen in this data set. Intriguingly, the periodograms of all 11 features have local maxima (and 8 have global maxima) at the same period, $\approx$
90 days. Towards this source in this same velocity range Proven-Adzri et al. (Reference Proven-Adzri, MacLeod, van den Heever, Hoare, Kuditcher and Goedhart2019) reported a periodic 6.7 GHz maser with a period of 93.5 days, and MacLeod et al. (Reference MacLeod, Smits, Green and van den Heever2021) identified several periodic 1 665 MHz maser features with periods ranging from 91–94 days. While two of the features identified at 1 612 MHz (at
$\approx$
90 days. Towards this source in this same velocity range Proven-Adzri et al. (Reference Proven-Adzri, MacLeod, van den Heever, Hoare, Kuditcher and Goedhart2019) reported a periodic 6.7 GHz maser with a period of 93.5 days, and MacLeod et al. (Reference MacLeod, Smits, Green and van den Heever2021) identified several periodic 1 665 MHz maser features with periods ranging from 91–94 days. While two of the features identified at 1 612 MHz (at $-69.7$
and
$-69.7$
and $-69.3$
km s
$-69.3$
km s $^{-1}$
) are closely blended, all other features are sufficiently separated to imply the validity of our simplistic method of peak identification, suggesting that the periodicity of each feature will persist when a more sophisticated fitting technique is used in a subsequent publication. Also interesting – though perhaps less certain given our peak identification technique – is that most features also show a long-term linear increase in average intensity over the period of our observations, most noticeably in the feature identified at 1 667 MHz at
$^{-1}$
) are closely blended, all other features are sufficiently separated to imply the validity of our simplistic method of peak identification, suggesting that the periodicity of each feature will persist when a more sophisticated fitting technique is used in a subsequent publication. Also interesting – though perhaps less certain given our peak identification technique – is that most features also show a long-term linear increase in average intensity over the period of our observations, most noticeably in the feature identified at 1 667 MHz at $-68.3$
km s
$-68.3$
km s $^{-1}$
.
$^{-1}$
.
G339.622 $-$
0.121 – Five features with periodic intensity variation are seen at 1 665, 1 667, and 1 720 MHz, all in a narrow velocity range between
$-$
0.121 – Five features with periodic intensity variation are seen at 1 665, 1 667, and 1 720 MHz, all in a narrow velocity range between $-37.3$
and
$-37.3$
and $-36.3$
km s
$-36.3$
km s $^{-1}$
, implying that they may all be associated. All also appear to have the same period of
$^{-1}$
, implying that they may all be associated. All also appear to have the same period of $\approx$
200 days, with the minor exception of the feature in 1 665 MHz at
$\approx$
200 days, with the minor exception of the feature in 1 665 MHz at $-37.3$
km s
$-37.3$
km s $^{-1}$
which has a peak in its periodogram at
$^{-1}$
which has a peak in its periodogram at $\approx$
230 days. A visual inspection of the intensity behaviour of this feature at
$\approx$
230 days. A visual inspection of the intensity behaviour of this feature at $-37.3$
km s
$-37.3$
km s $^{-1}$
over time, however, does suggest that same period of
$^{-1}$
over time, however, does suggest that same period of $\approx$
200 days. Goedhart et al. (Reference Goedhart, Maswanganye, Gaylard and van derWalt2014) reported a periodic 6.7 GHz maser towards this source at
$\approx$
200 days. Goedhart et al. (Reference Goedhart, Maswanganye, Gaylard and van derWalt2014) reported a periodic 6.7 GHz maser towards this source at $-35.7$
km s
$-35.7$
km s $^{-1}$
with a period of 200.7 days. The two features at 1 665 MHz (at
$^{-1}$
with a period of 200.7 days. The two features at 1 665 MHz (at $-37.3$
and
$-37.3$
and $-36.6$
km s
$-36.6$
km s $^{-1}$
) and the two features at 1 667 MHz (at
$^{-1}$
) and the two features at 1 667 MHz (at $-36.8$
and
$-36.8$
and $-36.3$
km s
$-36.3$
km s $^{-1}$
) are closely blended, opening up the possibility that the periodicity seen in the weaker component (
$^{-1}$
) are closely blended, opening up the possibility that the periodicity seen in the weaker component ( $-36.6$
km s
$-36.6$
km s $^{-1}$
at 1 665 MHz and
$^{-1}$
at 1 665 MHz and $-36.8$
km s
$-36.8$
km s $^{-1}$
at 1 667 MHz) may be less apparent when a more sophisticated fitting technique is used in a subsequent publication.
$^{-1}$
at 1 667 MHz) may be less apparent when a more sophisticated fitting technique is used in a subsequent publication.
G339.884 $-$
1.259 – A single feature with periodic intensity variation is seen at 1 720 MHz at
$-$
1.259 – A single feature with periodic intensity variation is seen at 1 720 MHz at $-36.2$
km s
$-36.2$
km s $^{-1}$
. The periodogram for this feature has a peak at
$^{-1}$
. The periodogram for this feature has a peak at $\approx$
400 days and the current set of observations only shows one maximum and one minimum clearly. As our observations of this source continue this period may need to be revised.
$\approx$
400 days and the current set of observations only shows one maximum and one minimum clearly. As our observations of this source continue this period may need to be revised.
G023.010 $-$
0.411 – Four features with periodic intensity variation are seen at 1 612 MHz. These likely are not associated with the HMSFR represented by the features seen at 1 665 and 1 667 MHz, due partly to their separation in velocity, but also as the spectra at 1 612 MHz indicate a ‘double-horned’ maser, an evolved star tracer.
$-$
0.411 – Four features with periodic intensity variation are seen at 1 612 MHz. These likely are not associated with the HMSFR represented by the features seen at 1 665 and 1 667 MHz, due partly to their separation in velocity, but also as the spectra at 1 612 MHz indicate a ‘double-horned’ maser, an evolved star tracer.
5.4. Other
The maser features discussed in this subsection do not show distinct patterns, but do show significant variability, often in lock-step across several features along the same sightline and occasionally across frequency as well. Our discussion therefore focuses on these correlations and also on some notable anti-correlations. However, the lack of significant correlations between intensities of masers within a given HMSFR does not necessarily imply that the observed variability does not share a common cause, as the relationship between local environmental parameters and the intensity of the maser is highly complex.
G309.921+0.479 – In addition to the two features mentioned previously, four features are identified with significant variability at 1 665 MHz. The intensity behaviour of the features at $-61.2$
and
$-61.2$
and $-59.8$
km s
$-59.8$
km s $^{-1}$
are similar in that they remain relatively constant across the period of observations. The features at
$^{-1}$
are similar in that they remain relatively constant across the period of observations. The features at $-58.8$
and
$-58.8$
and $-58.5$
km s
$-58.5$
km s $^{-1}$
are much more similar to one another in that their intensities appear positively correlated. This is perhaps unsurprising given the proximity of these features in velocity and hence the degree of blending.
$^{-1}$
are much more similar to one another in that their intensities appear positively correlated. This is perhaps unsurprising given the proximity of these features in velocity and hence the degree of blending.
G318.948 $-$
0.196 – Eight features are identified with significant variability at 1 665 and 1 667 MHz. There are some strong positive and negative correlations between the intensities of these features throughout the period of our observations, particularly during the period of high-cadence observations between MJDs
$-$
0.196 – Eight features are identified with significant variability at 1 665 and 1 667 MHz. There are some strong positive and negative correlations between the intensities of these features throughout the period of our observations, particularly during the period of high-cadence observations between MJDs $\approx 59470$
and 59620 (13 September 2021–10 February 2022). During this time the features at 1 665 MHz at
$\approx 59470$
and 59620 (13 September 2021–10 February 2022). During this time the features at 1 665 MHz at $-35.6$
and
$-35.6$
and $-34.4$
km s
$-34.4$
km s $^{-1}$
and at 1 667 MHz at
$^{-1}$
and at 1 667 MHz at $-40.5$
and
$-40.5$
and $-34.9$
km s
$-34.9$
km s $^{-1}$
were generally increasing and positively correlated with one another. In turn, these features are negatively correlated with the features at 1665 MHz at
$^{-1}$
were generally increasing and positively correlated with one another. In turn, these features are negatively correlated with the features at 1665 MHz at $-37.2$
and
$-37.2$
and $-36.5$
km s
$-36.5$
km s $^{-1}$
and at 1 667 MHz at
$^{-1}$
and at 1 667 MHz at $-36.7$
and
$-36.7$
and $-35.9$
km s
$-35.9$
km s $^{-1}$
which were generally decreasing during this time.
$^{-1}$
which were generally decreasing during this time.
G320.232 $-$
0.284 – In addition to the single feature mentioned previously, five features are identified with significant variability at 1 665 and 1 667 MHz. The intensities of these features are strongly positively correlated within and across the two transitions, particularly during the period of high-cadence observations between MJDs
$-$
0.284 – In addition to the single feature mentioned previously, five features are identified with significant variability at 1 665 and 1 667 MHz. The intensities of these features are strongly positively correlated within and across the two transitions, particularly during the period of high-cadence observations between MJDs $\approx 59470$
and 59620 (13 September 2021–10 February 2022).
$\approx 59470$
and 59620 (13 September 2021–10 February 2022).
G327.291 $-$
0.577 – In addition to the single feature mentioned previously, one feature is identified with significant variability at 1 665 MHz at
$-$
0.577 – In addition to the single feature mentioned previously, one feature is identified with significant variability at 1 665 MHz at $-54.2$
km s
$-54.2$
km s $^{-1}$
. The cadence of observations is insufficient to fully characterise the intensity behaviour of this feature over time, but it appears to have experienced two rapid increases in intensity during the period of observations beginning on MJD 59505 (18 October 2021) and 59850 (28 September 2022).
$^{-1}$
. The cadence of observations is insufficient to fully characterise the intensity behaviour of this feature over time, but it appears to have experienced two rapid increases in intensity during the period of observations beginning on MJD 59505 (18 October 2021) and 59850 (28 September 2022).
G330.878 $-$
0.367 – In addition to the two features mentioned previously, 12 features are identified with significant variability at 1 665 and 1 667 MHz. With the exception of the feature at 1 665 MHz at
$-$
0.367 – In addition to the two features mentioned previously, 12 features are identified with significant variability at 1 665 and 1 667 MHz. With the exception of the feature at 1 665 MHz at $-91.1$
km s
$-91.1$
km s $^{-1}$
, all of the features are found in a relatively narrow velocity range from
$^{-1}$
, all of the features are found in a relatively narrow velocity range from $\approx -66$
to
$\approx -66$
to $-61$
km s
$-61$
km s $^{-1}$
, which taken together with their proximity in on-sky position implies that they may be associated. Indeed, all of the features (including that seen at 1 665 MHz at
$^{-1}$
, which taken together with their proximity in on-sky position implies that they may be associated. Indeed, all of the features (including that seen at 1 665 MHz at $-91.1$
km s
$-91.1$
km s $^{-1}$
) show a broadly similar pattern in intensity across our observations: the intensities first increase until reaching a local maximum on or just after MJD
$^{-1}$
) show a broadly similar pattern in intensity across our observations: the intensities first increase until reaching a local maximum on or just after MJD $\approx 59375$
(10 June 2021), followed by a drop in intensity before another local maximum on or around MJD
$\approx 59375$
(10 June 2021), followed by a drop in intensity before another local maximum on or around MJD $\approx 59505$
(18 October 2021).
$\approx 59505$
(18 October 2021).
G330.953 $-$
0.182 – In addition to the single feature mentioned previously, 14 features are identified with significant variability at 1 665 and 1 667 MHz. The features can be divided into two groups in velocity: from
$-$
0.182 – In addition to the single feature mentioned previously, 14 features are identified with significant variability at 1 665 and 1 667 MHz. The features can be divided into two groups in velocity: from $-91.5$
to
$-91.5$
to $-83.0$
km s
$-83.0$
km s $^{-1}$
, and from
$^{-1}$
, and from $-65.8$
to
$-65.8$
to $-60.8$
km s
$-60.8$
km s $^{-1}$
. With the exception of the features at 1 665 MHz at
$^{-1}$
. With the exception of the features at 1 665 MHz at $-85.7$
and
$-85.7$
and $-83.0$
km s
$-83.0$
km s $^{-1}$
, no strong correlations are seen between the intensities of the features in the first velocity range. On the other hand, all of the features in the second velocity range show strong positive correlations, between and across the two transitions.
$^{-1}$
, no strong correlations are seen between the intensities of the features in the first velocity range. On the other hand, all of the features in the second velocity range show strong positive correlations, between and across the two transitions.
G331.278 $-$
0.188 – In addition to the single feature mentioned previously, two features are identified with significant variability at 1 665 MHz at
$-$
0.188 – In addition to the single feature mentioned previously, two features are identified with significant variability at 1 665 MHz at $-87.7$
km s
$-87.7$
km s $^{-1}$
and at 1 667 MHz at
$^{-1}$
and at 1 667 MHz at $-87.8$
km s
$-87.8$
km s $^{-1}$
. The intensities of these two features are almost perfectly positively correlated in our observations. This taken with their proximity in on-sky position and velocity implies that they may be associated.
$^{-1}$
. The intensities of these two features are almost perfectly positively correlated in our observations. This taken with their proximity in on-sky position and velocity implies that they may be associated.
G339.622 $-$
0.121 – In addition to the six features mentioned previously, four features are identified with significant variability at 1 612 MHz in a narrow velocity range from
$-$
0.121 – In addition to the six features mentioned previously, four features are identified with significant variability at 1 612 MHz in a narrow velocity range from $-34.4$
to
$-34.4$
to $-33.0$
km s
$-33.0$
km s $^{-1}$
. The intensities of all these features have very strong positive correlations. This, along with their proximity in on-sky position and velocity implies that they may be associated.
$^{-1}$
. The intensities of all these features have very strong positive correlations. This, along with their proximity in on-sky position and velocity implies that they may be associated.
G339.884 $-$
1.259 – In addition to the 13 features mentioned previously, one feature is identified with significant variability at 1 665 MHz at
$-$
1.259 – In addition to the 13 features mentioned previously, one feature is identified with significant variability at 1 665 MHz at $-35.7$
km s
$-35.7$
km s $^{-1}$
.
$^{-1}$
.
G345.003 $-$
0.224 – In addition to the three features mentioned previously, three features are identified with significant variability at 1 612 MHz at
$-$
0.224 – In addition to the three features mentioned previously, three features are identified with significant variability at 1 612 MHz at $-25.3$
,
$-25.3$
, $-25.2$
, and
$-25.2$
, and $-22.8$
km s
$-22.8$
km s $^{-1}$
. Aside from a drop in average intensity of the feature at
$^{-1}$
. Aside from a drop in average intensity of the feature at $-25.2$
km s
$-25.2$
km s $^{-1}$
at MJD
$^{-1}$
at MJD $\approx 59410$
(15 July 2021), the three features keep relatively constant intensity.
$\approx 59410$
(15 July 2021), the three features keep relatively constant intensity.
G351.417+0.645 – In addition to the four features mentioned previously, 12 features are identified with significant variability at 1 665, 1 667, and 1 720 MHz. There are some strong positive correlations between the intensity of the features, though only within the transitions (i.e. not across transitions). The strongest correlation is between the two features identified at 1 720 MHz at $-10.5$
and
$-10.5$
and $-9.8$
km s
$-9.8$
km s $^{-1}$
. The features at 1 667 MHz show more strong positive correlations than do the features at 1 665 MHz.
$^{-1}$
. The features at 1 667 MHz show more strong positive correlations than do the features at 1 665 MHz.
G351.775 $-$
0.536 – In addition to the eight features mentioned previously, eight features are identified with significant variability at 1 665 and 1 667 MHz. The only significant correlations are seen within the 1 665 MHz transition, between the features at
$-$
0.536 – In addition to the eight features mentioned previously, eight features are identified with significant variability at 1 665 and 1 667 MHz. The only significant correlations are seen within the 1 665 MHz transition, between the features at $-7.1$
and
$-7.1$
and $-6.2$
km s
$-6.2$
km s $^{-1}$
and between those at
$^{-1}$
and between those at $-9.0$
and
$-9.0$
and $3.7$
km s
$3.7$
km s $^{-1}$
. Interestingly, all of the features (some more than others) at 1 665 MHz appear to share a series of small flares at MJDs approximately 59415 (20 July 2021), 59510 (23 October 2021), 59625 (15 February 2022), and 59800 (9 August 2022).
$^{-1}$
. Interestingly, all of the features (some more than others) at 1 665 MHz appear to share a series of small flares at MJDs approximately 59415 (20 July 2021), 59510 (23 October 2021), 59625 (15 February 2022), and 59800 (9 August 2022).
G000.658 $-$
0.042 – In addition to the four features mentioned previously, 11 features are identified with significant variability at 1 612, 1 665, and 1 667 MHz. There are some strong positive correlations between some pairs of features seen at 1665 MHz, most notably those at
$-$
0.042 – In addition to the four features mentioned previously, 11 features are identified with significant variability at 1 612, 1 665, and 1 667 MHz. There are some strong positive correlations between some pairs of features seen at 1665 MHz, most notably those at $54.8$
and
$54.8$
and $60.2$
km s
$60.2$
km s $^{-1}$
, at
$^{-1}$
, at $60.2$
and
$60.2$
and $61.3$
km s
$61.3$
km s $^{-1}$
, and at
$^{-1}$
, and at $72.3$
and
$72.3$
and $72.5$
km s
$72.5$
km s $^{-1}$
(though this last example is not surprising due to the proximity of the features in velocity).
$^{-1}$
(though this last example is not surprising due to the proximity of the features in velocity).
G012.216 $-$
0.119 – In addition to the single feature mentioned previously, 12 features are identified with significant variability at 1 612 and 1 665 MHz. There are some strong positive correlations in the intensities of the features, most significantly the features identified at 1 612 MHz. These are also positively correlated to the features at 1 665 MHz between
$-$
0.119 – In addition to the single feature mentioned previously, 12 features are identified with significant variability at 1 612 and 1 665 MHz. There are some strong positive correlations in the intensities of the features, most significantly the features identified at 1 612 MHz. These are also positively correlated to the features at 1 665 MHz between $14.8$
and
$14.8$
and $15.9$
km s
$15.9$
km s $^{-1}$
. The intensities of the features between
$^{-1}$
. The intensities of the features between $19.5$
and
$19.5$
and $20.6$
km s
$20.6$
km s $^{-1}$
are also strongly positively correlated with one another.
$^{-1}$
are also strongly positively correlated with one another.
G024.329+0.144 – In addition to the two features mentioned previously, four features are identified with significant variability at 1 667 MHz. There is a strong correlation between the intensities of the features at $64.3$
and
$64.3$
and $64.8$
km s
$64.8$
km s $^{-1}$
, though this is not surprising due to their proximity in velocity.
$^{-1}$
, though this is not surprising due to their proximity in velocity.
5.5. Possible causes of variability seen in this data
Though future publications by this group will undertake detailed modelling of the environmental conditions that could give rise to the variability observed, we speculate here some broad mechanisms based on the work of others.
OH maser flares are a well-known phenomenon, having been observed for the first time (Weaver, Dieter, & Williams Reference Weaver, Dieter and Williams1968) not long after the first astrophysical maser was discovered (Weaver et al. Reference Weaver, Williams, Dieter and Lum1965). MacLeod & Gaylard (Reference MacLeod and Gaylard1996) observed a series of flares in the OH main lines towards G351.775 $-$
0.536 (observed in this work), as well as in 6.7 GHz methanol. They note phase lags between flares in different velocity channels and infer that this represents propogation of some effect through the HMSFR. They speculate that this effect could be in the pumping source, that is, non-thermal radio emission, ionised jets or dense stellar winds, or perhaps an effect within the masing gas itself, that is, density waves propogating through the gas. MacLeod et al. (Reference MacLeod2018) report a flaring event towards G351.417+0.645 (also observed in this work) in 10 different maser frequencies including OH, methanol, and water. They also reference previous flaring events towards the same region and speculate that these flares could be cause by repeating accretion events that lead to temporary increases in the local radiation field of the masing gas. Ashimbaeva et al. (Reference Ashimbaeva, Colom, Krasnov, Lekht, Pashchenko, Rudnitskii and Tolmachev2020) report correlated flaring in OH and water maser features toward IRAS 05358+3543, also noting velocity drifts in the observed components, more so for the water maser features. They attribute these observations to shocks due to protostellar activity. Long term changes in maser intensities have been reported in several observational projects (e.g. Lekht et al. Reference Lekht, Pashchenko and Rudnitskii2011; Colom et al. Reference Colom, Lekht, Pashchenko and Rudnitskij2015; Ashimbaeva et al. Reference Ashimbaeva, Colom, Lekht, Pashchenko, Rudnitskii and Tolmachev2018, in OH and water), though these are often referred to as flares by their respective authors and generally are attributed to a similar set of causes as flares. We note that the ‘long-term’ trends identified in this paper are not at all long compared to those identified in these studies, some extending 10–15 years or more. Therefore it is likely that the ‘long-term’ trends we identify here will not continue indefinitely, necessitating continuing observations.
$-$
0.536 (observed in this work), as well as in 6.7 GHz methanol. They note phase lags between flares in different velocity channels and infer that this represents propogation of some effect through the HMSFR. They speculate that this effect could be in the pumping source, that is, non-thermal radio emission, ionised jets or dense stellar winds, or perhaps an effect within the masing gas itself, that is, density waves propogating through the gas. MacLeod et al. (Reference MacLeod2018) report a flaring event towards G351.417+0.645 (also observed in this work) in 10 different maser frequencies including OH, methanol, and water. They also reference previous flaring events towards the same region and speculate that these flares could be cause by repeating accretion events that lead to temporary increases in the local radiation field of the masing gas. Ashimbaeva et al. (Reference Ashimbaeva, Colom, Krasnov, Lekht, Pashchenko, Rudnitskii and Tolmachev2020) report correlated flaring in OH and water maser features toward IRAS 05358+3543, also noting velocity drifts in the observed components, more so for the water maser features. They attribute these observations to shocks due to protostellar activity. Long term changes in maser intensities have been reported in several observational projects (e.g. Lekht et al. Reference Lekht, Pashchenko and Rudnitskii2011; Colom et al. Reference Colom, Lekht, Pashchenko and Rudnitskij2015; Ashimbaeva et al. Reference Ashimbaeva, Colom, Lekht, Pashchenko, Rudnitskii and Tolmachev2018, in OH and water), though these are often referred to as flares by their respective authors and generally are attributed to a similar set of causes as flares. We note that the ‘long-term’ trends identified in this paper are not at all long compared to those identified in these studies, some extending 10–15 years or more. Therefore it is likely that the ‘long-term’ trends we identify here will not continue indefinitely, necessitating continuing observations.
There has been significant attention paid to periodically varying masers (e.g. Goedhart et al. Reference Goedhart, van Rooyen, van derWalt, Maswanaganye, Maccleod, Sanna, Tarchi, Reid and Castangia2018, Reference Goedhart, van Rooyen, van der Walt, Maswanganye, Sanna, MacLeod and van den Heever2019), primarily of Class II methanol masers at 6.7 GHz, but since these and main-line OH masers share a similar radiative pumping mechanism, we may assume that these works may be broadly applied to the OH masers. Parfenov & Sobolev (Reference Parfenov2014) proposed that rotating spiral shocks within the accretion disc surrounding a protobinary star could periodically increase the dust temperature in the vicinity of Class II methanol masers, hence varying the local IR radiative field and therefore the intensity of the maser. Inayoshi et al. (Reference Inayoshi, Sugiyama, Hosokawa, Motogi and Tanaka2013) and Sanna et al. (Reference Sanna2015) propose that such periodic variation could be caused by a pulsating protostellar object with periodically increasing and decreasing IR radiation. van der Walt et al. (Reference van derWalt, Maswanganye, Etoka, Goedhart and van den Heever2016) propose an alternative in the form of a colliding-wind binary system and indeed conclude that this is more likely the cause of the variation of the specific maser described by Parfenov & Sobolev (Reference Parfenov2014) and by Sanna et al. (Reference Sanna2015).
The periodic variation seen in the 1612 MHz transition of OH – at least in the case of those showing the ‘double-horn’ profile indicative of an evolved stellar atmosphere – is likely to have a different physical mechanism. In these cases it is more likely that the variability of the maser intensity is due to variations in the central star, as the stars associated with these types of 1 612 MHz masers very often pulsate (Jiménez-Esteban et al. Reference Jiménez-Esteban, Engels, Aguado, González and Garca-Lario2021).
6. Conclusions
We present the first two years’ Stokes-I results of a programme to monitor the intensity variation of 18 cm OH masers using the ultra-wideband low receiver on the 64 m CSIRO Parkes radio telescope Murriyang. We identify 203 individual maser features with significant variability across the four 18 cm transitions and categorise them as flares, long-term changes, periodic and ‘other’. These observations represent a rich data set with the potential to provide new insights into the local environmental conditions and astrophysical phenomena common in HMSFRs. Future publications will examine individual HMSFRs (or groups of similar regions) with reference to full Stokes parameters and molecular excitation modelling.
Acknowledgements
The 64 m CSIRO Parkes radio telescope, Murriyang, is part of the Australia Telescope National Facility (https://ror.org/05qajvd42) which is funded by the Australian Government for operation as a National Facility managed by CSIRO. We acknowledge the Wiradjuri people as the traditional owners of the Observatory site. We also acknowledge the Wallumattagal people as the traditional owners of the Marsfield office where the computing resources used in this work are located. EP, DL, and AS were supported by the Russian Science Foundation grant 23-12-00258. AH is very grateful to George Hobbs of CSIRO for his assistance in calibrating the UWL data.
Data availability
Raw historical data from this project is available from https://atoa.atnf.csiro.au/ under the project number P1073. The reduced data presented in this work and raw data that is still subject to embargo are available upon reasonable request to the corresponding author.
Appendix A. Spectra
Figs. A1–A6 show all observed spectra for each sightline and transition, with the peaks of significantly varying maser features indicated along with their average velocities. The colours and marker symbols used are consistent across all plots of a given sightline and transition.
Plots of flux density vs velocity spectra at 1 612, 1 665, 1 667, and 1 720 MHz for sources between galactic latitudes 300.969 $^{\circ}$
and 322.158
$^{\circ}$
and 322.158 $^{\circ}$
. Spectra from each observation are overlaid to illustrate the range and spread of observed intensities. Peaks of individual features in the spectra are indicated with their average velocity given in the legend. The symbols and colours used correspond to those used in all other plots of the same source and transition.
$^{\circ}$
. Spectra from each observation are overlaid to illustrate the range and spread of observed intensities. Peaks of individual features in the spectra are indicated with their average velocity given in the legend. The symbols and colours used correspond to those used in all other plots of the same source and transition.

Same as Fig. A1 for sources between Galactic latitudes 323.459 $^{\circ}$
and 330.953
$^{\circ}$
and 330.953 $^{\circ}$
.
$^{\circ}$
.
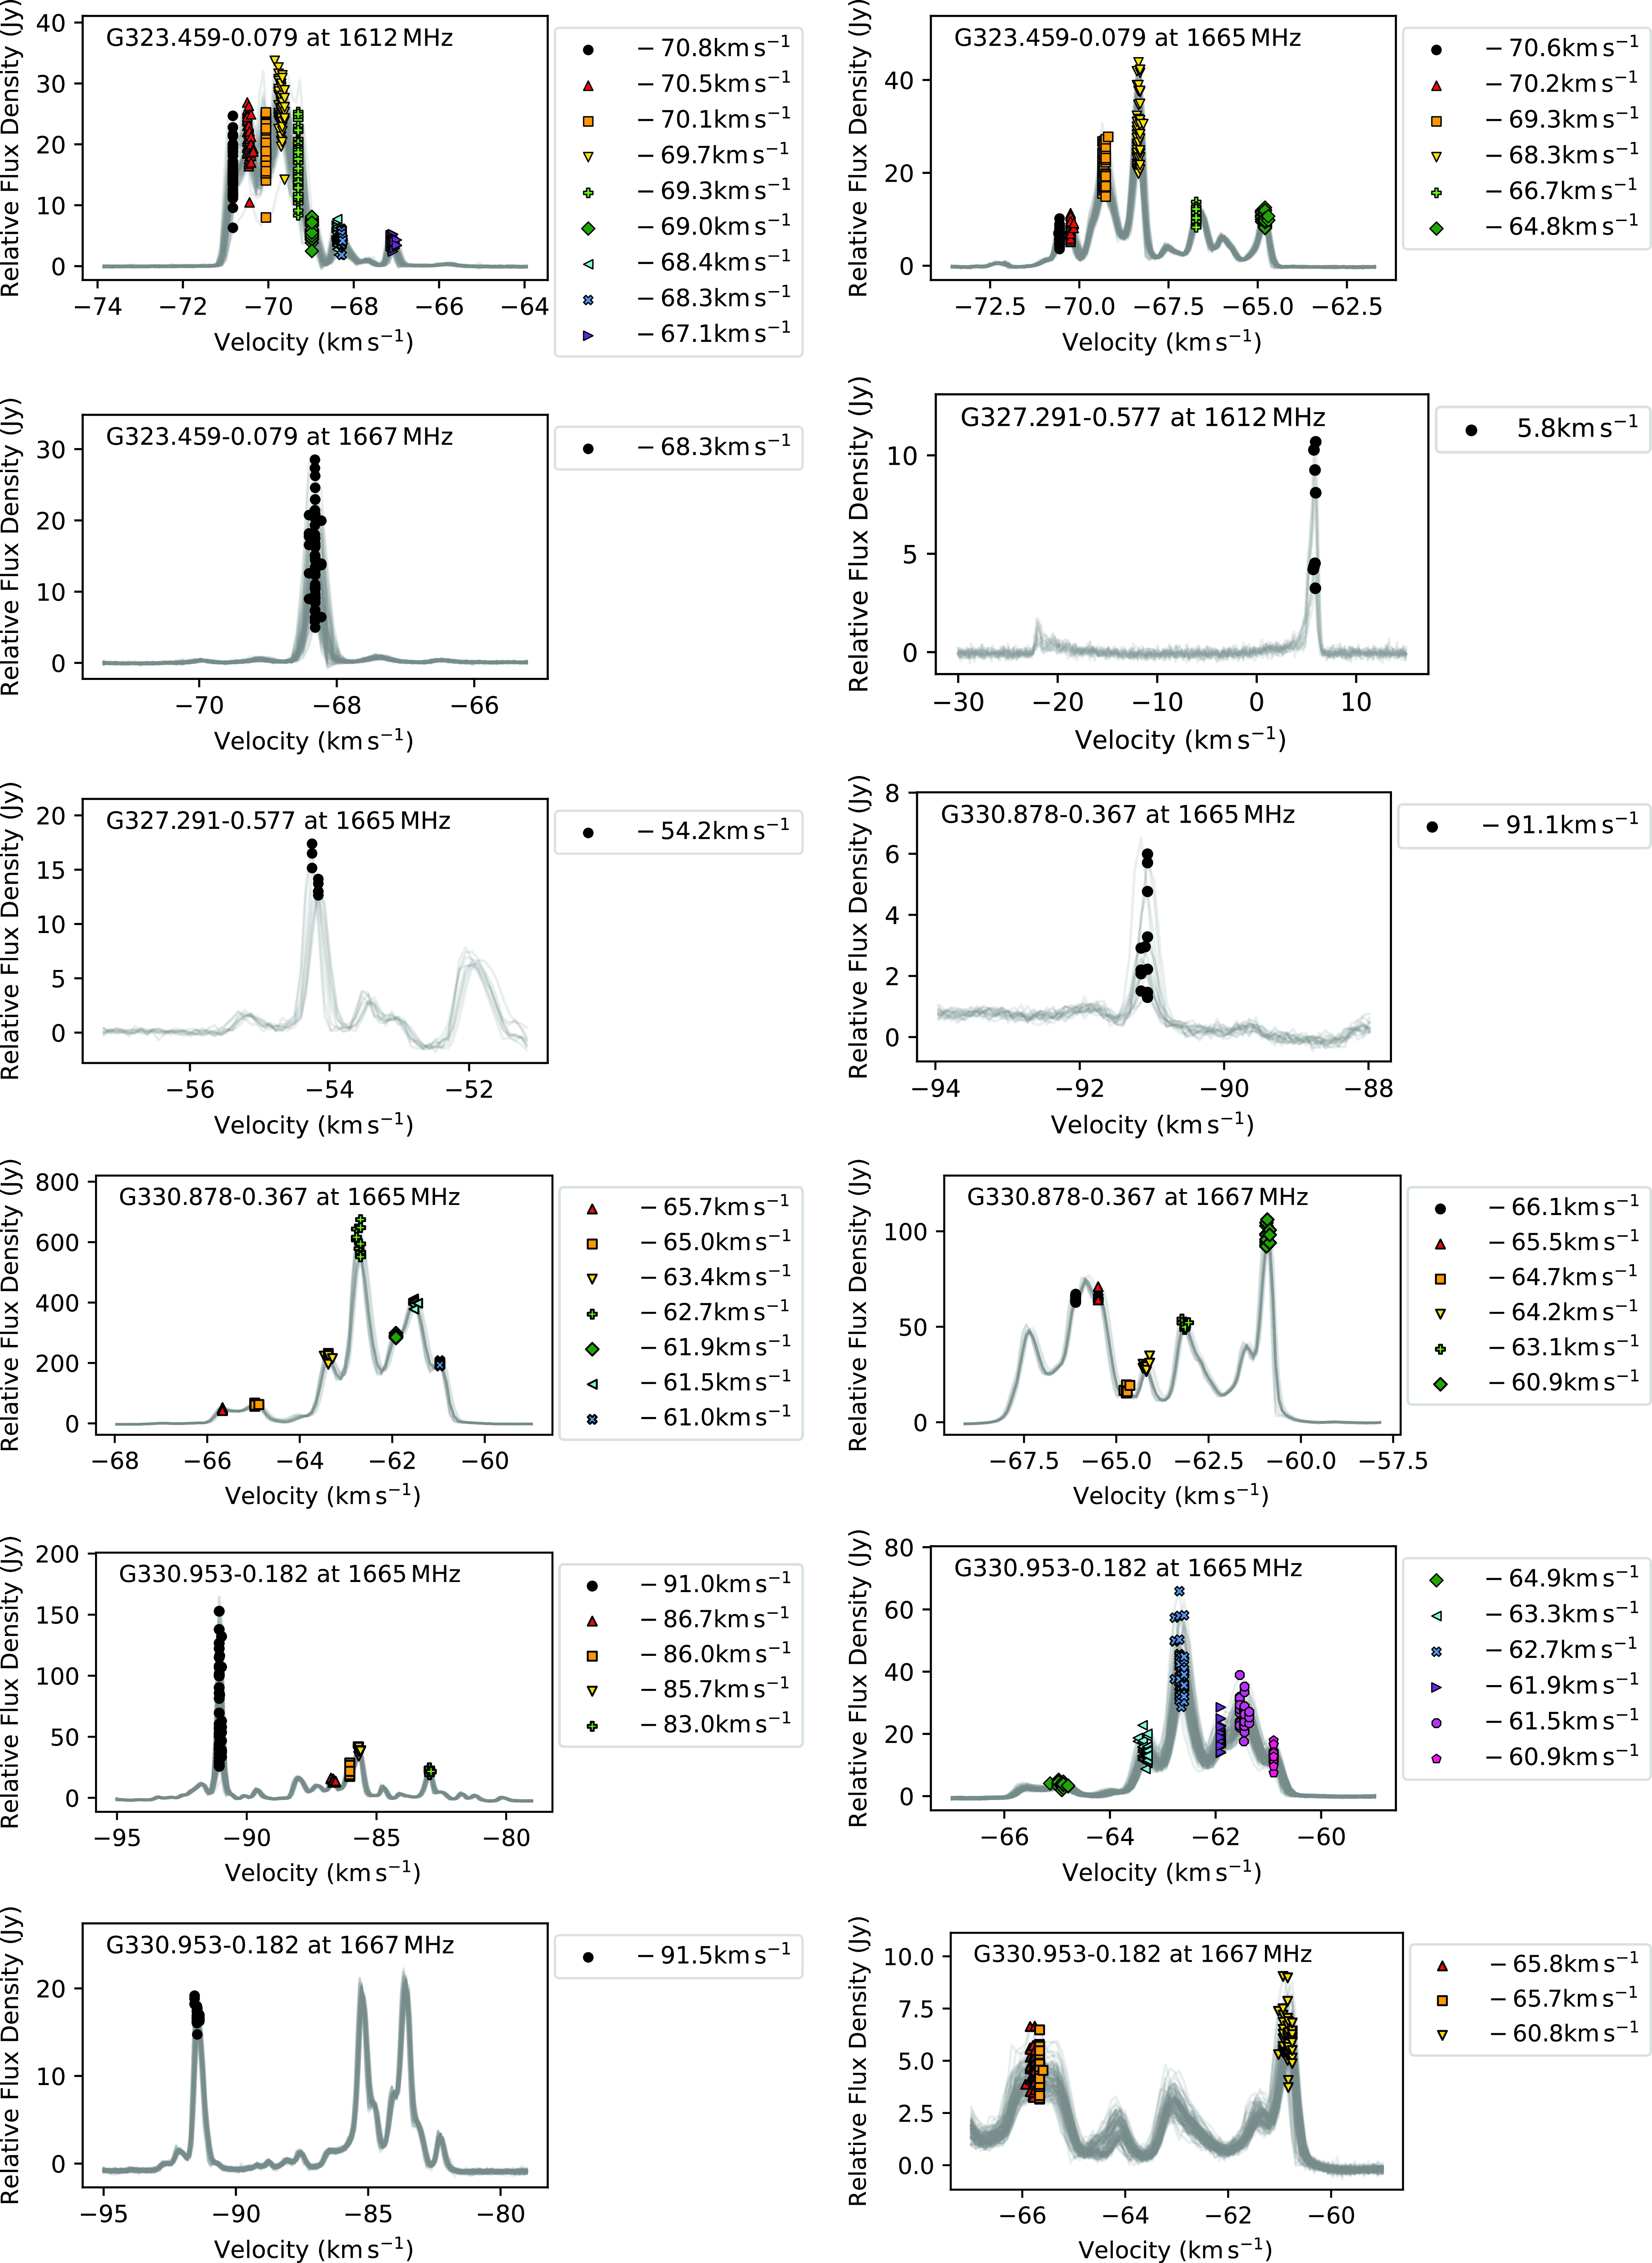
Same as Fig. A1 for sources between Galactic latitudes 331.278 $^{\circ}$
and 343.127
$^{\circ}$
and 343.127 $^{\circ}$
.
$^{\circ}$
.

Same as Fig. A1 for sources between Galactic latitudes 345.003 $^{\circ}$
and 351.775
$^{\circ}$
and 351.775 $^{\circ}$
(1 612, 1 665, and 1 667 MHz).
$^{\circ}$
(1 612, 1 665, and 1 667 MHz).

Same as Fig. A1 for sources between Galactic latitudes 351.775 $^{\circ}$
(1 720 MHz) and 12.216
$^{\circ}$
(1 720 MHz) and 12.216 $^{\circ}$
.
$^{\circ}$
.
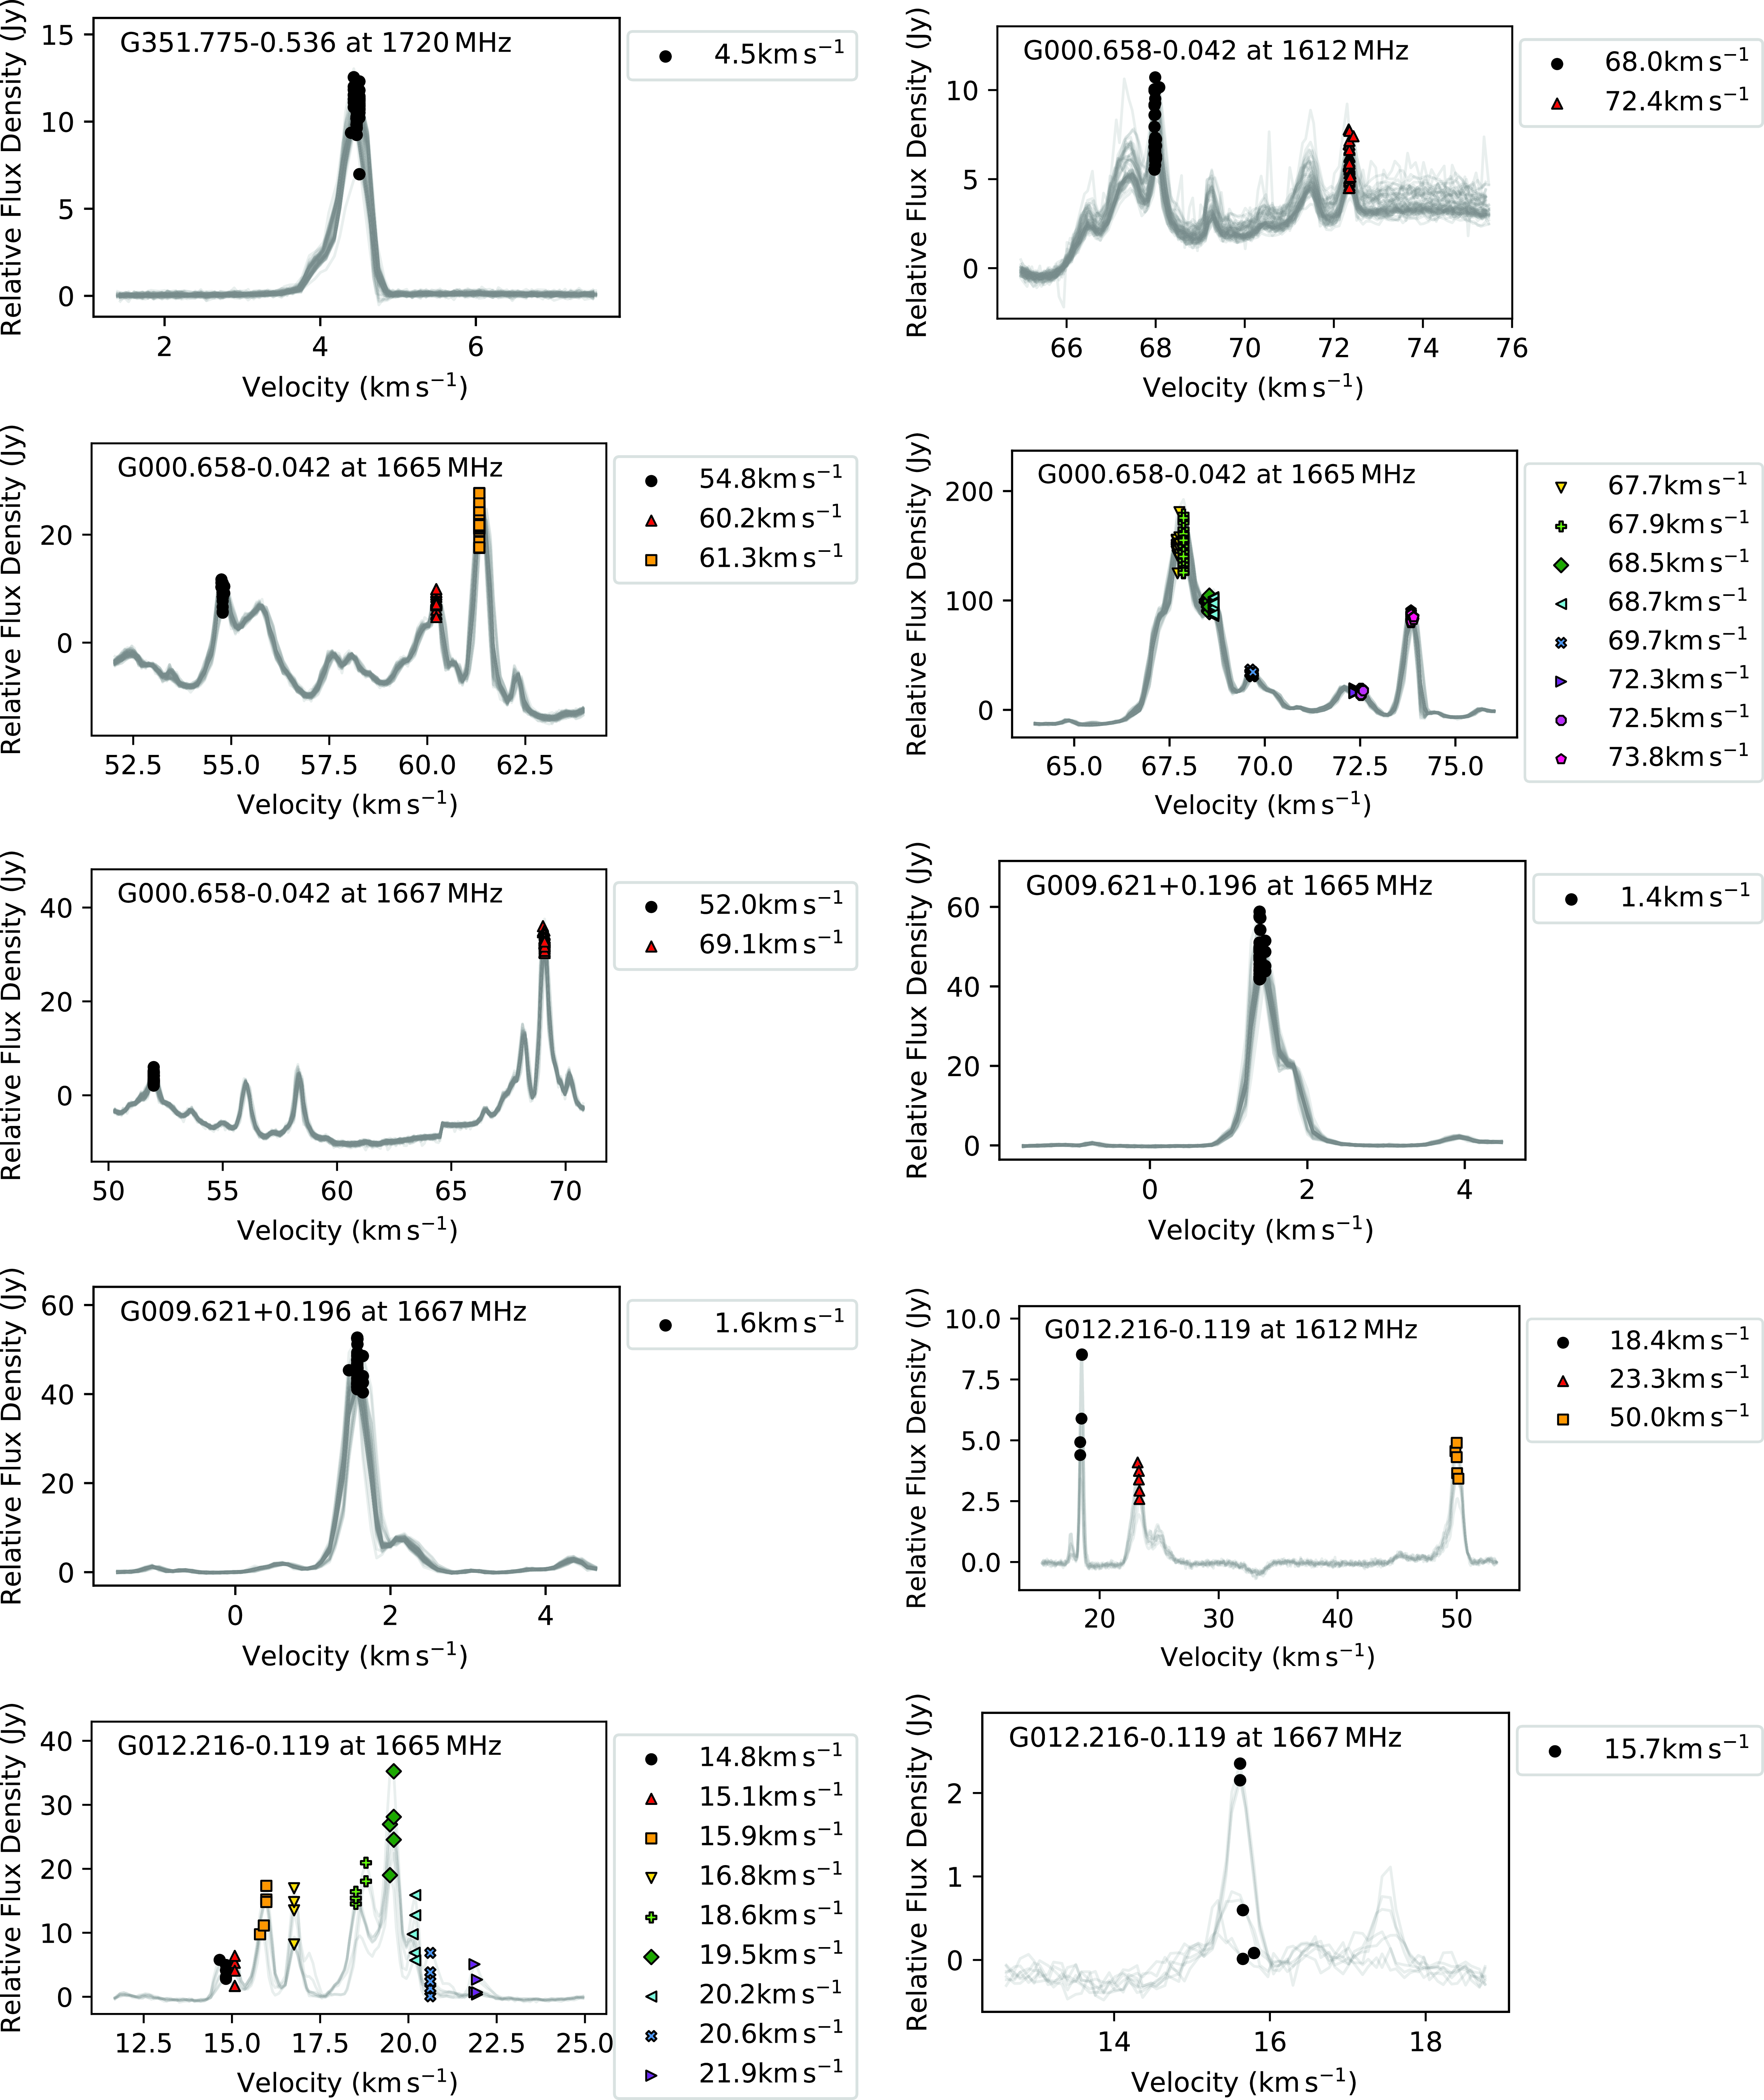
Same as Fig. A1 for sources between Galactic latitudes 23.010 $^{\circ}$
and 36.705
$^{\circ}$
and 36.705 $^{\circ}$
.
$^{\circ}$
.

Appendix B. Flares
Fig. B1 shows the behaviour of maser feature peak intensities over time for those features identified as ‘flares’.

Appendix C. Long-term trends
Figs. C1–C4 show the behaviour of maser feature peak intensities over time for those features identified as having ‘long-term trends’.
Plots of relative flux density over time of individual maser features identified as showing long-term trends. The colours, markers, and velocities correspond to those shown in Figs. A1–A6. Features identified towards some sources are shown in several plots (and with different vertical scales) in order to make clear their range of intensities. The features shown are for sources between Galactic latitudes 305.362 $^{\circ}$
and 331.278
$^{\circ}$
and 331.278 $^{\circ}$
.
$^{\circ}$
.
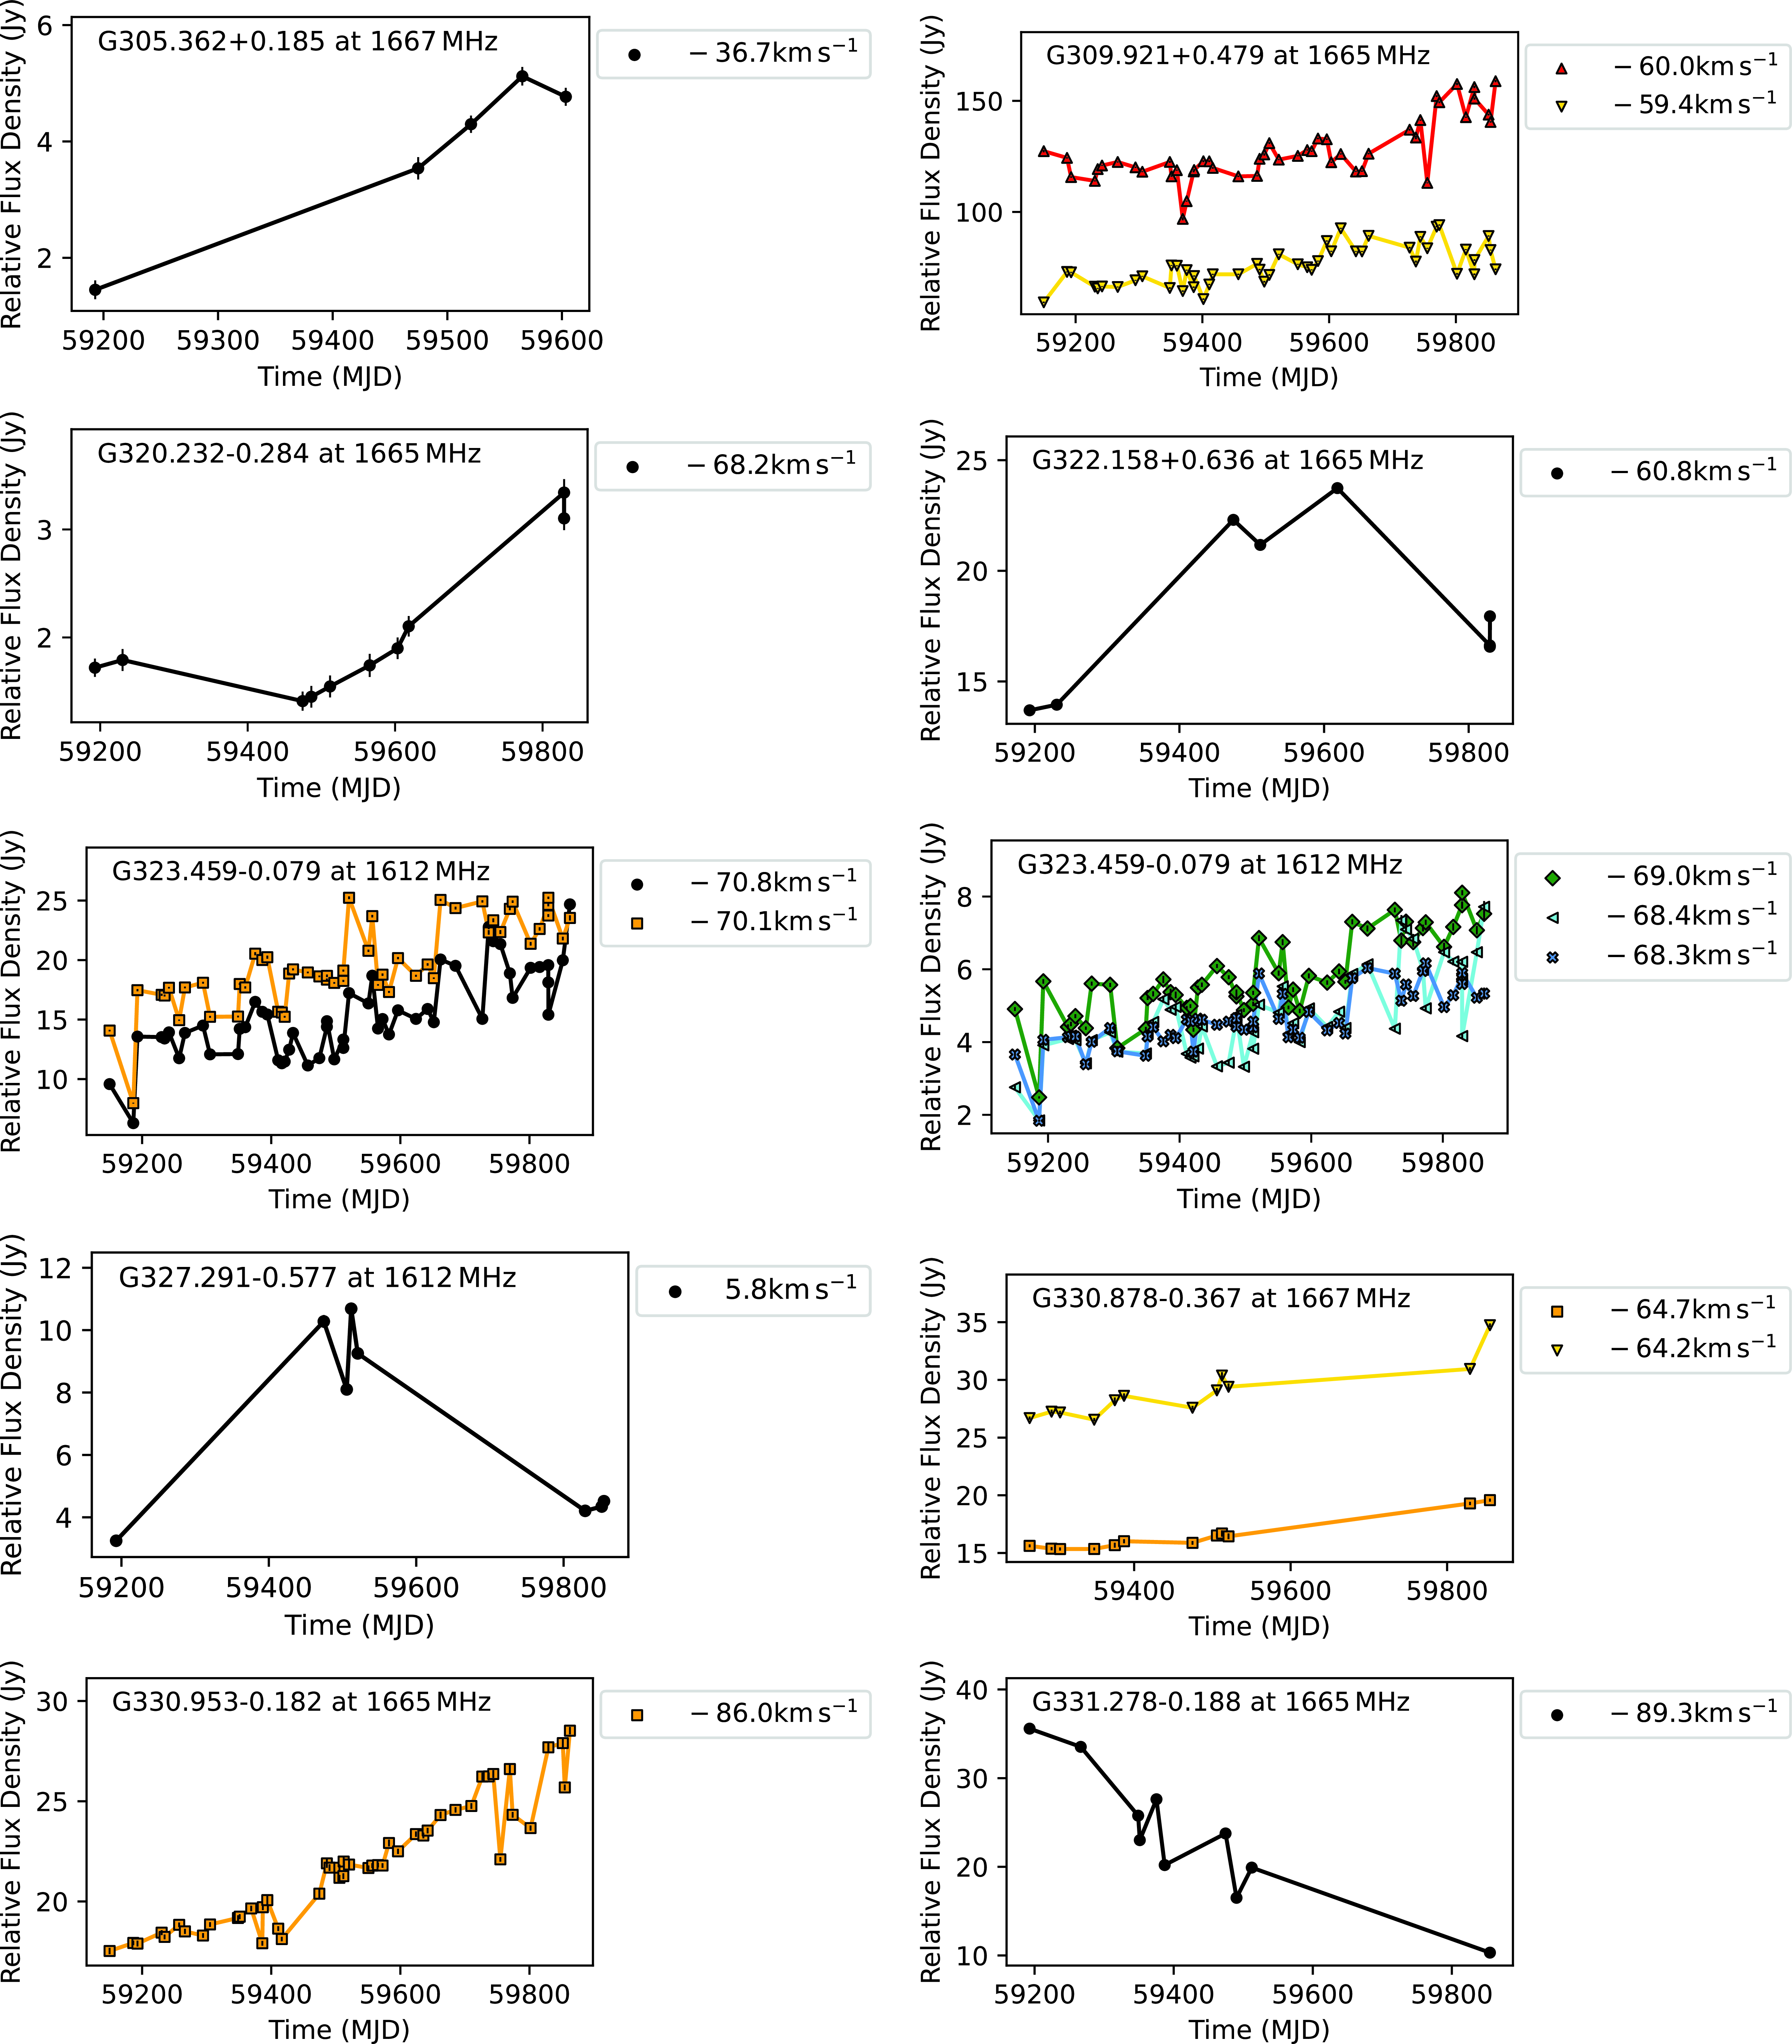
Same as Fig. C1 for sources between Galactic latitudes 338.925 $^{\circ}$
and 343.127
$^{\circ}$
and 343.127 $^{\circ}$
.
$^{\circ}$
.

Same as Fig. C1 for sources between Galactic latitudes 345.003 $^{\circ}$
and 0.658
$^{\circ}$
and 0.658 $^{\circ}$
(1 665 MHz).
$^{\circ}$
(1 665 MHz).

Same as Fig. C1 for sources between Galactic latitudes 0.658 $^{\circ}$
(1 665 and 1 667 MHz) and 30.703
$^{\circ}$
(1 665 and 1 667 MHz) and 30.703 $^{\circ}$
.
$^{\circ}$
.

Appendix D. Periodic
Figs. D1–D3 show the behaviour of maser feature peak intensities over time for those features identified as ‘periodic’.
Plots of relative flux density over time (right-hand panels) of individual maser features identified as possibly showing regular periodic variation in intensity. The colours, markers, and velocities correspond to those shown in Figs. A1–A6. Periodograms are also shown (left-hand panels) to illustrate possible periods of the observed variation. Features identified towards some sources are shown in several plots (and with different vertical scales) in order to make clear their range of intensities. The features shown are for sources between Galactic latitudes 300.969 $^{\circ}$
and 323.459
$^{\circ}$
and 323.459 $^{\circ}$
(1 665 MHz).
$^{\circ}$
(1 665 MHz).

Same as Fig. D1 for sources between Galactic latitudes 323.459 $^{\circ}$
(1 667 MHz) and 339.884
$^{\circ}$
(1 667 MHz) and 339.884 $^{\circ}$
.
$^{\circ}$
.
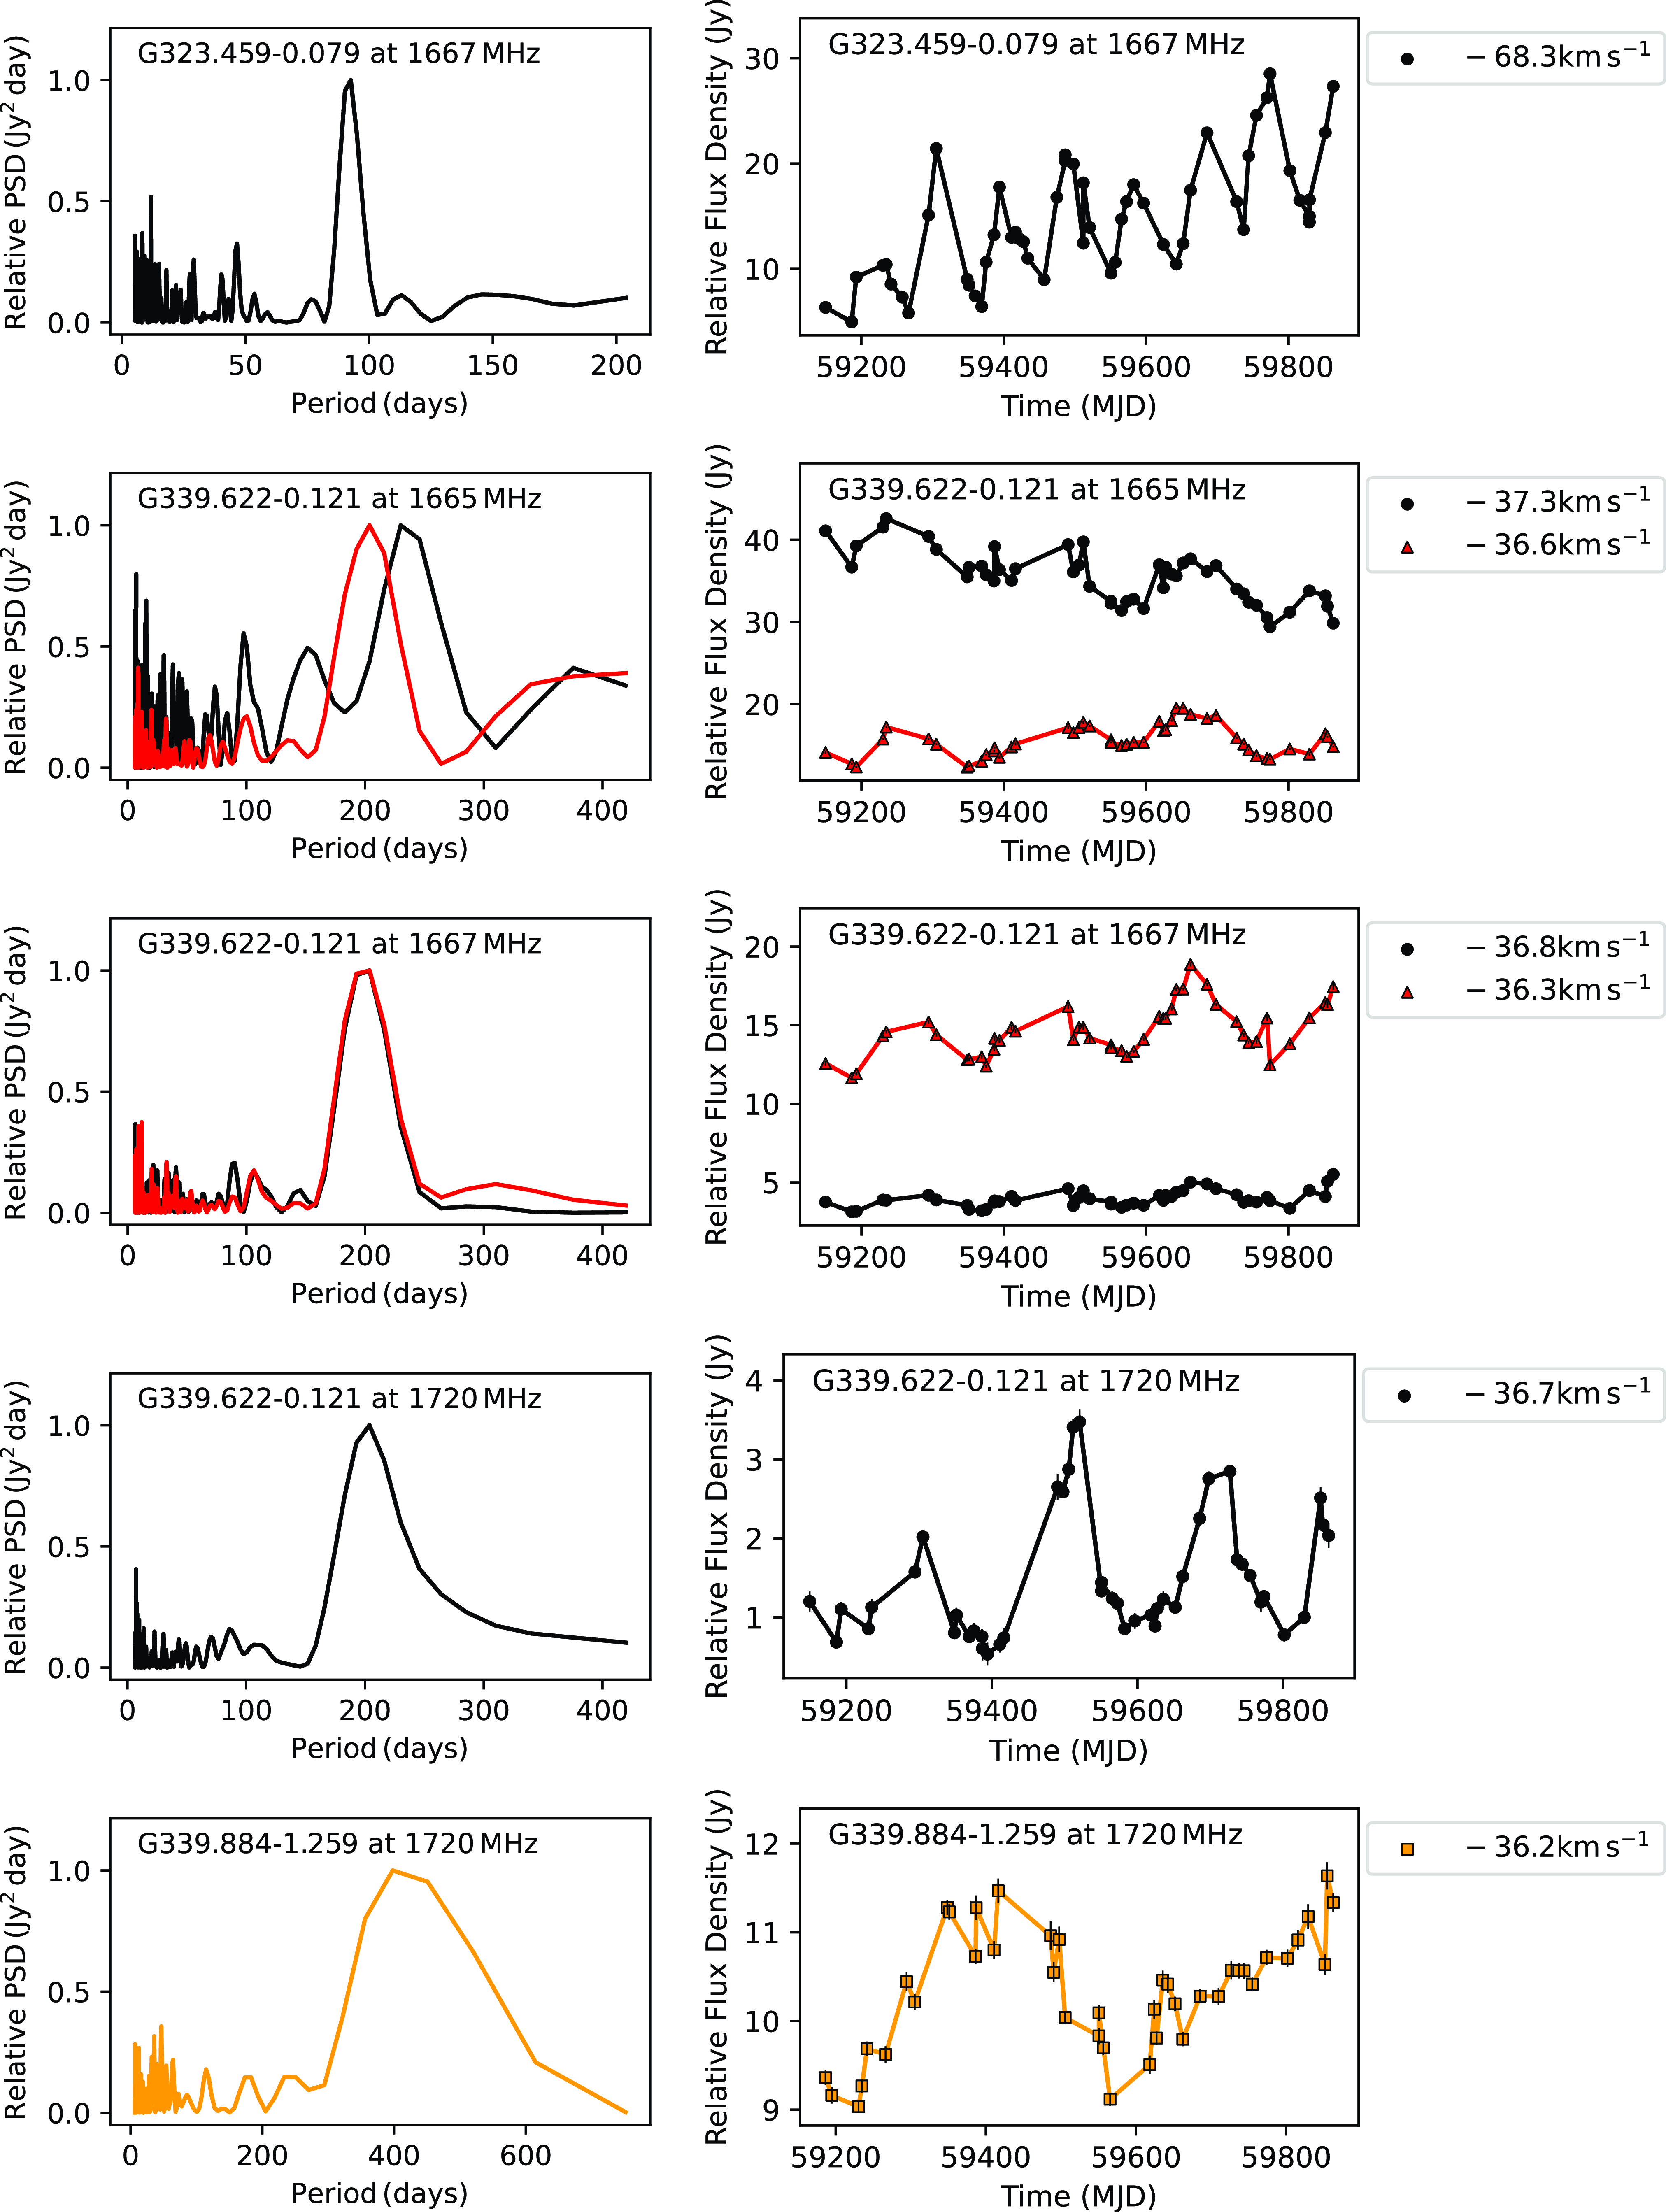
Same as Fig. D1 for G023.010 $-$
0.411
$-$
0.411 $^{\circ}$
.
$^{\circ}$
.
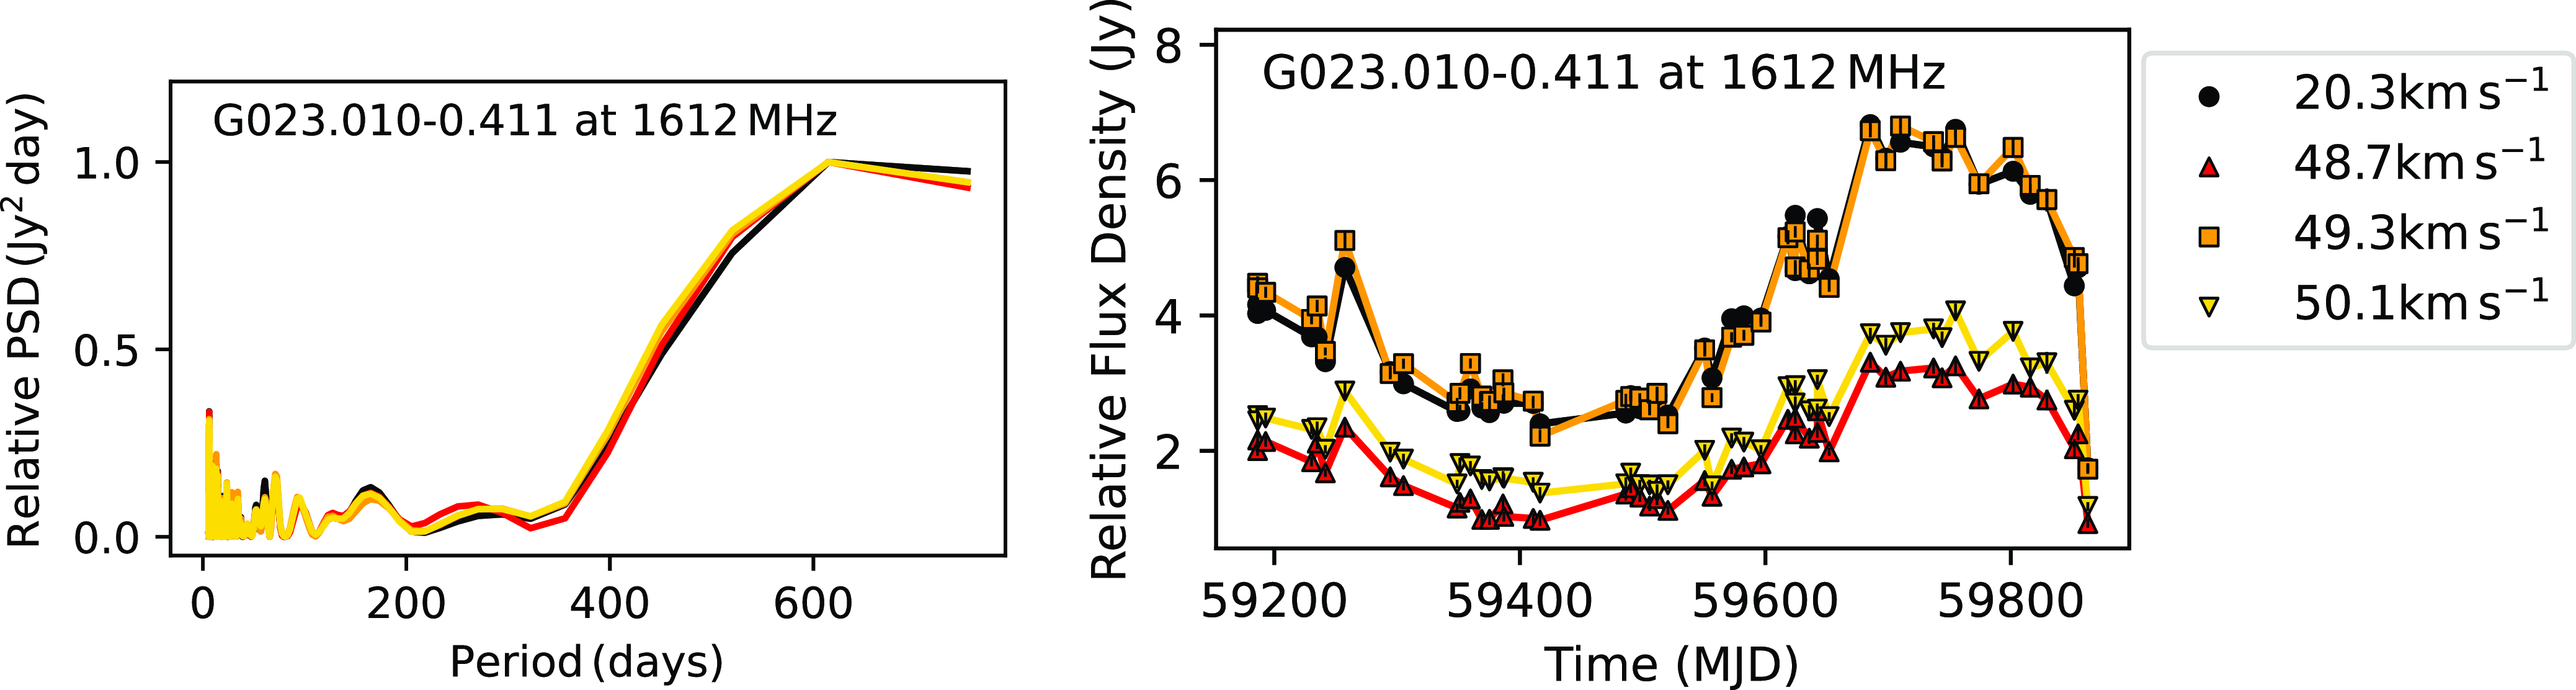
Appendix E. Other
Figs. E1–E5 show the behaviour of maser feature peak intensities over time for those features that did not fit well into the previously described categories.
Plots of relative flux density over time of individual maser features identified as showing significant variation in intensity but that did not fit well in the previously mentioned categories. The colours, markers, and velocities correspond to those shown in Figs. A1–A6. Features identified towards some sources are shown in several plots (and with different vertical scales) in order to make clear their range of intensities. The features shown are for sources between Galactic longitudes 309.921 $^{\circ}$
and 330.878
$^{\circ}$
and 330.878 $^{\circ}$
(1 665 MHz).
$^{\circ}$
(1 665 MHz).

Same as Fig. E1 for sources between Galactic latitudes 330.878 $^{\circ}$
(1 665 and 1 667 MHz) and 330.953
$^{\circ}$
(1 665 and 1 667 MHz) and 330.953 $^{\circ}$
.
$^{\circ}$
.
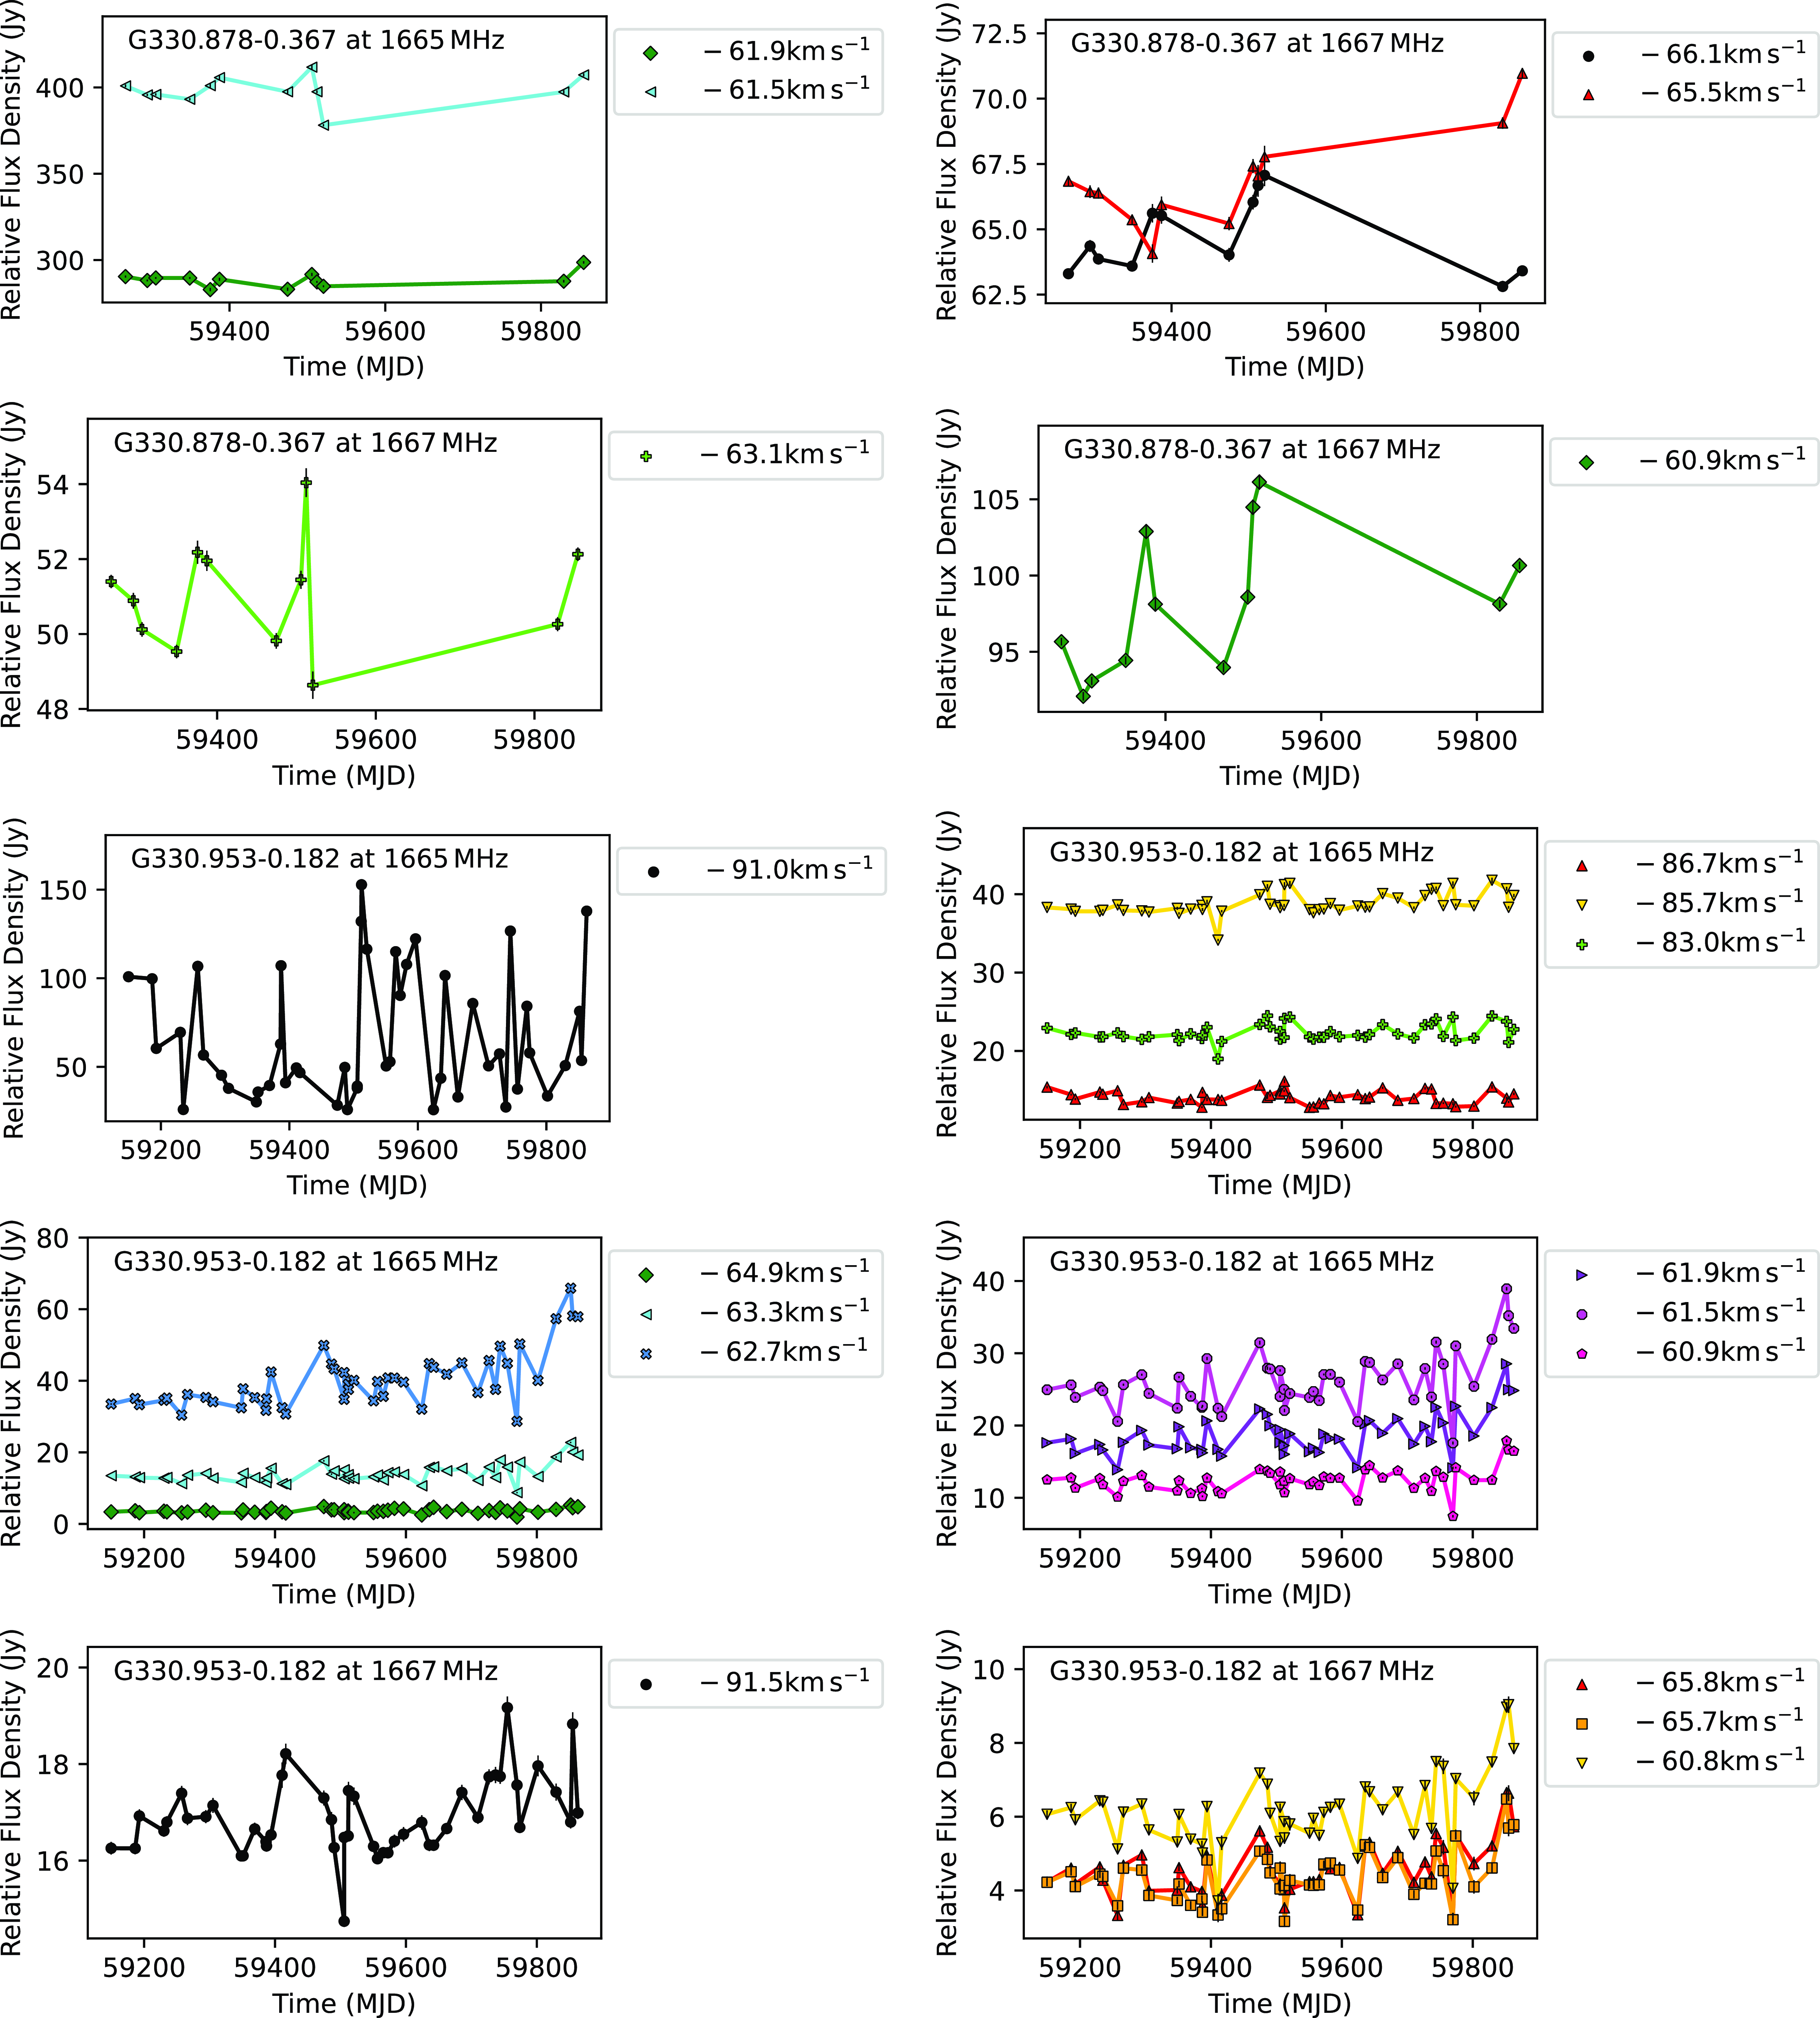
Same as Fig. E1 for sources between Galactic latitudes 331.278 $^{\circ}$
and 351.417
$^{\circ}$
and 351.417 $^{\circ}$
(1 665 and 1 667 MHz).
$^{\circ}$
(1 665 and 1 667 MHz).
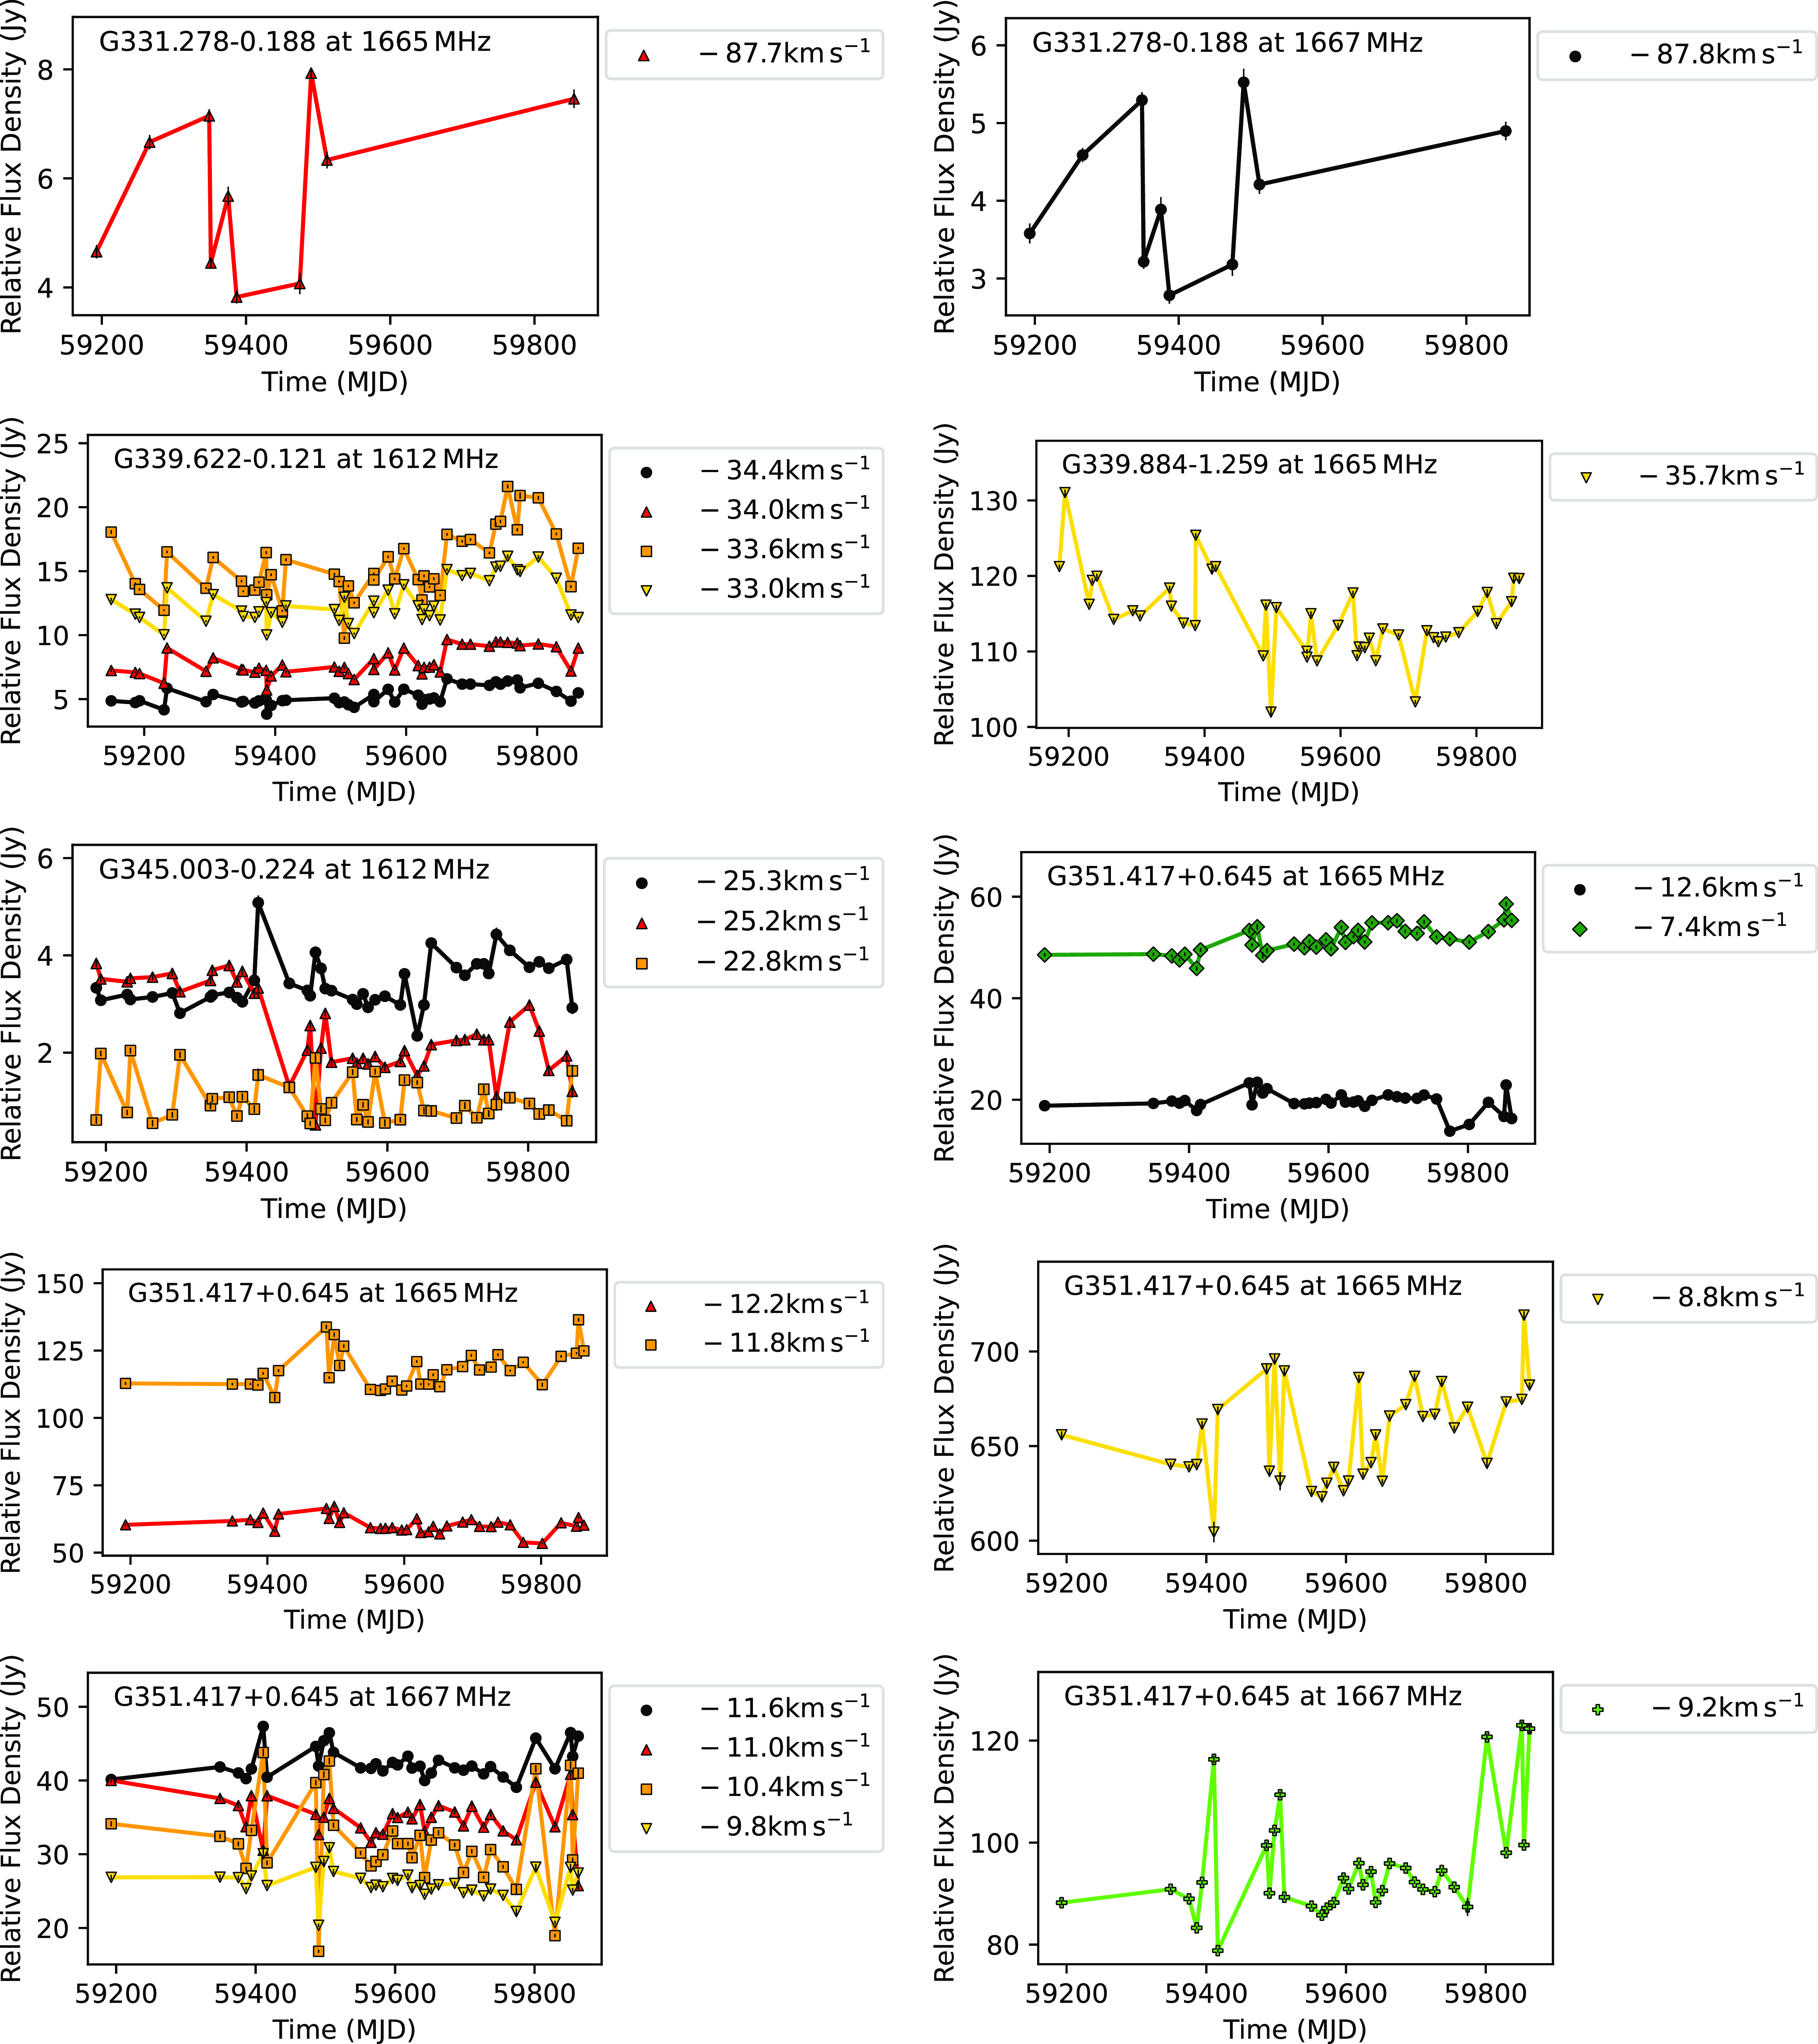
Same as Fig. E1 for sources between Galactic latitudes 351.417 $^{\circ}$
(1 720 MHz) and 12.216
$^{\circ}$
(1 720 MHz) and 12.216 $^{\circ}$
(1 612 MHz).
$^{\circ}$
(1 612 MHz).
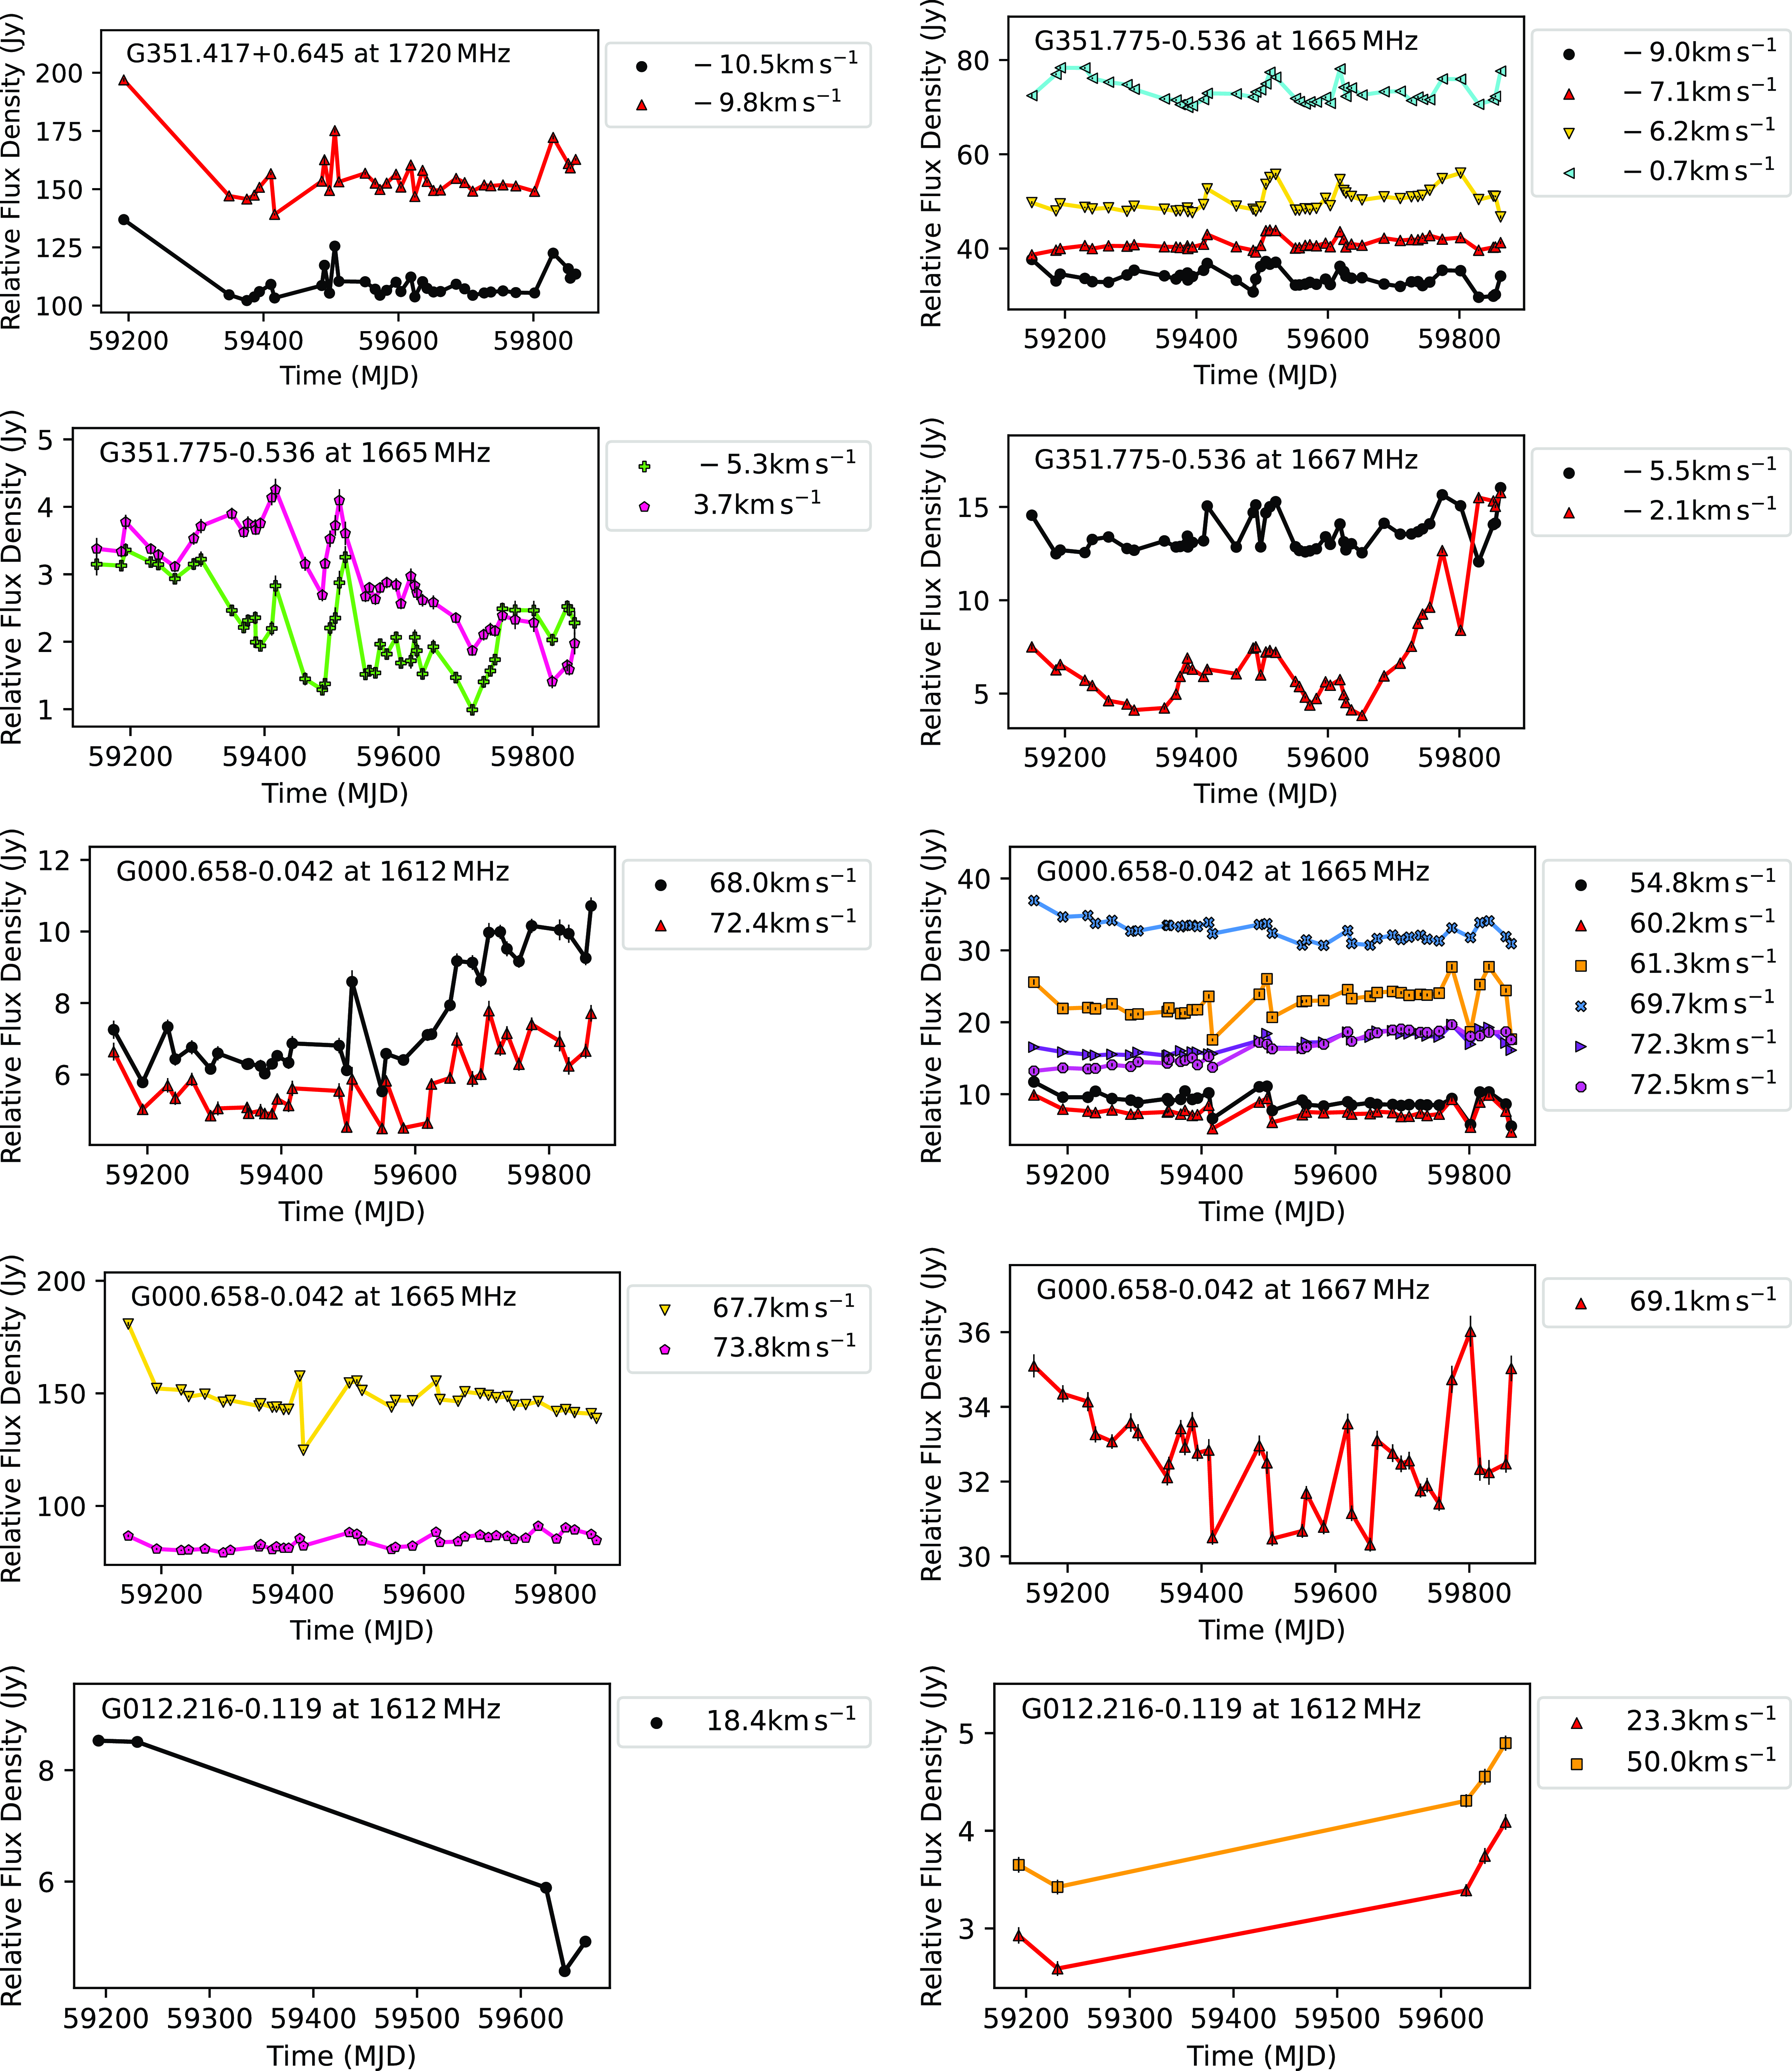
Same as Fig. E1 for sources between Galactic latitudes 12.216 $^{\circ}$
(1 665 MHz) and 24.329
$^{\circ}$
(1 665 MHz) and 24.329 $^{\circ}$
.
$^{\circ}$
.


 Open access

