


1. Introduction and background
The investigation of individual physiology and anthropometry has long been a cornerstone of ergonomic theory, commonly utilised in inclusive design principles when designing everyday tools and products (Reference Dianat, Molenbroek and CastellucciDianat et al., 2018). However, while these generalized measurements allow for broad accessibility, they often lack the resolution required to understand the nuances of individual product interaction. To overcome this, more dynamic performance measures can now be utilised, such as insights from camera tracking, sensorised prototypes and environments (Reference Snider, Kukreja and CoxSnider et al., 2025). This shift is particularly critical in high-stakes environments such as elite-sports, where the personalisation of training and equipment can yield substantial biomechanical advantages, leading to world records (Reference Eikevåg, Auernhammer, Elverum, Dybvik and SteinertEikevåg et al., 2024).
Where prior works have demonstrated the ability to accurately interpret user action from dynamic data, the subsequent analysis and interpretation is often left up to expert human interpretation, demanding substantial domain-specific knowledge. We look to investigate whether automated techniques can be used to not only assess individualised technique, but also reliably draw out and quantify insights related to performance. Specifically, we aim to establish the importance of considering individual physiology within rowing performance and to what extent accessible, low-cost methods can reliably detect and quantify these individual technical variations.
An era of personalisation in sport
Over the last several decades, sports engineering development has shifted over four generations: physical, equipment, system and biological (Reference ShanShan, 2023).
-
• (1950s+) Physical Fit - Equipment improvements are made based off holistic practitioner experience
-
• (1980s+) Equipment Fit - Engineering Design Dominated, improvements based on research, material science innovation and investigating aerodynamics
-
• (2015+) System Fit - Incorporating bio-mechanists to search for ideal equipment configurations. Descriptive/ statistical data is fed back to producers to make potential equipment modifications.
-
• (Future) Biological Fit - To consider sensory feedback and biological reactions, a multimodal interpretation of individual technique to make individual enhancements to motor skill and proprioception.
As we transition into the era of multimodal data, the focus on individual technique becomes critical. These future methods must not only accurately capture complex human-equipment interaction but also possess the ability to draw conclusive, actionable insights from an ever-increasingly large dataset. This necessity underscores the importance of developing tools that can reliably generate meaningful, individualised performance insights.
Digital human modelling
Now, there are many methods available that can help us understand individual movement and technique. Tools such as EMG (Electromyography) sensors, can give an understanding of muscle activity and load (Reference Dong, Ugalde, Figueroa and El SaddikDong et al., 2014), as well as sensorised equipment to look at the maximum power, direction of force generated by users, and behavioural data all in real-time to provide dynamic feedback (Reference Javaid, Haleem, Rab, Pratap Singh and SumanJavaid et al., 2021). On top of this many motion capture techniques have been utilised, such as MoCap, 2D and 3D Pose tracking (Reference Banerjee, Shkodrani, Moulon, Hampali, Zhang, Fountain, Miller, Basol, Newcombe, Wang, Engel and HodanBanerjee et al., 2024; Reference Lugaresi, Tang, Nash, McClanahan, Uboweja, Hays, Zhang, Chang, Yong, Lee, Chang, Hua, Georg and GrundmannLugaresi et al., 2019; Reference Uhlrich, Falisse, Kidziński, Muccini, Ko, Chaudhari, Hicks and DelpUhlrich et al., 2022) and Inertial based sensing (Reference Woodward, Stokes, Shefelbine and VaidyanathanWoodward et al., 2019). These techniques are now low-cost, require minimal setup and provide real-time feedback for users, expanding the breadth and depth of insight we can obtain to understand product interaction.
The established techniques have been used in human activity recognition (HAR) (Reference Qureshi, Shahid, Farhan and AlamriQureshi et al., 2025), and can be used to establish real-time tools to evaluate ergonomic rules of thumb such as RULA (Rapid Upper Limb Assessment) (Reference Nayak and KimNayak & Kim, 2021). However, these classification techniques often look to generalise human activity rather than investigate the differences between individuals. When looking to understand particularly users during personalisation, investigating these differences is key to marginal gains in performance, an obvious and tangible benefit within a sporting context (Reference Eikevåg, Auernhammer, Elverum, Dybvik and SteinertEikevåg et al., 2024). Not only this, but appropriate metrics must be developed alongside coaches and appropriate stakeholders to ensure their future adaption and usefulness to coaches and athletes (Reference Ormerod, Dybvik, Fraser and SniderOrmerod et al., 2024).
Utilising a personalised approach has provided substantial improvements in cycling performance. Here, insights into individual biomechanics showed that even small adjustments can drastically improve cycling performance. With an appreciation for individual physiology, more forward-thinking methods to personalisation can be utilised such as biomechanical modelling and predictive modelling of equipment interaction (Reference Otmani, Murray, Coste and BaillyOtmani et al., 2025) (Reference Clancy, Gatti, Ong, Maly and DelpClancy et al., 2023). These not only establish the best setups for optimal performance, but can be used to estimate joint torques, thus reducing injury risk (Reference Jin, Alvarez, Suitor, Swaminathan, Chin, Civici, Nuckols, Howe and WalshJin et al., 2024).
Rowing background
Whilst cycling is an established area of modelling and product personalisation, rowing presents a new challenge. The full body interaction involved allows for greater dependence not only on individual physiology (Reference Soper and HumeSoper & Hume, 2004), but also individual technique, the interaction between crew members (Reference Holt, Aughey, Ball, Hopkins and SiegelHolt et al., 2020), and the equipment itself. This makes rowing an ideal case to demonstrate the importance of individual technique within sport. Whilst many techniques have been qualitatively established, there is little established effort to identify quantitative differences between different philosophies. In 1977, Klavora defined 3 rowing styles (Reference Penichet-Tomas, Pueo, Selles-Perez and Jimenez-OlmedoPenichet-Tomas et al., 2021), later adapted by Kleshnev to produce a quadrant of technique as shown in Figure 1 (Reference KleshnevKleshnev, 2011).
The rowing stroke is divided into 4 distinct phases as illustrated in Figure 1. Firstly, is the catch, where rowers are at maximum compression. This is followed by the drive, in which rowers accelerate towards the finish at their maximum distance away from the footplate. Rowers then slide their seat back towards the catch position in the recovery phase. Depending on their philosophy, drive is typically started by pushing through the legs, then trunk and finally the arms. The subtleties in technique differences are summarised in Table 1.
Rowing technique quadrant and body movement summary

Figure 1 Long description
Panel A: A sequence diagram showing the phases of rowing. The phases include catch, drive phase, finish, recovery phase, and catch again. Each phase is represented by a stick figure in different positions, indicating the body movement during each phase. The direction of travel of the boat is indicated by an arrow. Panel B: A quadrant chart categorizing rowing styles based on trunk emphasis and legs emphasis. The quadrants are labeled as DDR style, Rosenberg style, Adam style, and Soviet style. Each quadrant shows stick figures demonstrating the specific rowing technique corresponding to the style.
Different rowing techniques and philosophies

Given that rowing performance is highly dependent on specific physiology, body geometry, and complex movement mechanics, alongside the diverse range of successful styles observed at the elite level, the direct quantitative measurement of these individual factors provides significant value to the sport. These substantial variations underscore the need for more groundwork in how they can be reliably quantified by available data-driven methods. Ultimately, while high-stakes environments like elite rowing inherently rely on equipment and technique, methods for exploring and quantifying the individual parameters critical for personalisation and determining optimal training philosophies often remain underdeveloped.
Summary
In summary, the ability to understand individual technique is becoming critically important in sports development. While numerous low-cost, real-time methods exist for data capture, the opportunity lies in developing criteria that translate this data into actionable insights for coaches, aiding in both training and equipment personalization. Rowing, with its complex kinematic chain and dependence on full-body movement, is an ideal domain to investigate this opportunity. Our work aims to explore whether we can reliably discern individual technique, establish what factors are most important in its interpretation, and demonstrate how this insight can be used proactively to inform personalization strategies.
In this paper, we address the value of individual data capture to determine technique for high level athletes. We conducted a user study, involving 9 elite level rowers, measuring their movement at different levels of rowing intensity. We establish criteria from literature and professional coaching input to illustrate the differences in performance for a physiologically diverse range of athletes, as well as a mapping to established rowing philosophies. We then conduct a 1-person pilot study to showcase how the established measurement techniques could be used to create actionable equipment personalisation strategies. The results are discussed to show the potential opportunities that understanding individual rowing technique may have on rowing equipment personalisation.
2. Methodology
In this section, a two-part method and analysis will be discussed in order interpret individual technique in rowing, and showcase that the analysis presented could be used to create actionable insights. Firstly, a multi-person study was run, establishing appropriate metrics to analyse rowing technique using 2D pose tracking, followed by a single person exploration of how these techniques could be used to assess the effect of personalised equipment for athletes. Both studies utilise the same data acquisition setup (Section 2.2) and measurement techniques detailed in Section 2.3.1. Results for both studies are presented separately.
2.1. User study
Our user study consisted of 9 elite level rowers, all of which had a minimum of 4 years competing at a national university level of rowing (n=9 (4F, 5M)). The study was completed on a RP3 Dynamic Ergometer. These rowing machines are used regularly by the rowers taking part in the study as part of their training regime. Rowers were asked to complete 6 one-minute intervals, consisting of 3 different intensities utilised in session split training sessions, with 2 x repeats (Low Intensity = 20 strokes per minute, medium intensity, 26 strokes per minute, High Intensity = 32 strokes per minute). Rowers were allowed to warm up appropriately, and these trials were placed in a random order. 54 trials were recorded in total. A second single-person study was conducted to illustrate the effect of parameterising different rowing setups on performance (1F). This study was performed on a different rowing machine (Concept 2 Static Ergometer, also regularly used by the rower) and thus not integrated with the multi-person study.
2.2. Data acquisition
Figure 2 presents the data processing workflow, illustrating how video and force data was utilised to describe movement in rowing. Videos were recorded at 30 fps, then fed into MediaPipe (Reference Lugaresi, Tang, Nash, McClanahan, Uboweja, Hays, Zhang, Chang, Yong, Lee, Chang, Hua, Georg and GrundmannLugaresi et al., 2019) for 2D body tracking (33 body-landmarks), using their highest fidelity pose-tracking model, a technique established for rowing in (Reference Johnston, Berg, Eikevåg, Ege, Kohtala and SteinertJohnston et al., 2022).
Data processing pipeline

In the analysis, videos were recorded from the left-hand side of participants, assuming bilateral symmetry of technique. The datasets that MediaPipe is trained on primarily consists of walking and running datasets (Reference Jin, Xu, Xu, Wang, Liu, Qian, Ouyang and LuoJin et al., 2020), and so to validate it appropriately for recording rowing activities, a preliminary study was recorded. A Goniometer was placed on a pilot participant’s knee, and the measurement compared against the recorded landmarks. After appropriate smoothing, the MAE was 3.2° (±2%). For all recorded strokes, the first 2 strokes and the last stroke were discarded from measurement as athletes accelerated/decelerated, and an average of the remaining strokes taken for the remaining measurements. The start and end of each stroke was defined as the lowest and height ranges of the trunk angle collected). Figure 3 shows the experimental setup for the user study with the pose-landmarks outputted from the pose tracking. The study was recorded with a plain background, to ensure pose-tracking consistency. Participants were instructed to wear plain clothing to assist with this further.
Experimental setup for user study a) Bird’s eye view of recording setup b) Participant at catch c) Participant at finish, with left-side of body landmarks displayed

2.3. Analysis methods
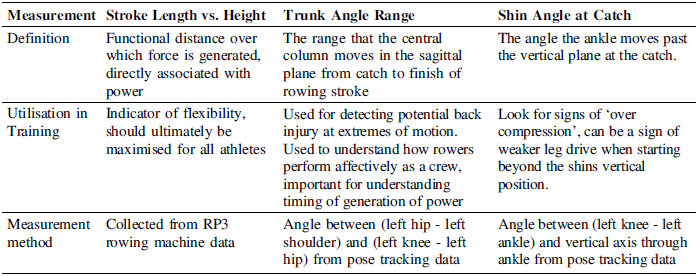
In order to develop insights that are both interpretable and actionable, the analysis methods chosen focus on commonly utilised criteria used in training and coaching. To develop these, both professional coaches and rowing literature were consulted to construct criteria of assessment. The analysis focuses on displaying these criteria across the cohort of participants, to demonstrate the individuality of technique that occurs. The collected measurement techniques were utilised to map rowers’ technique as explained in Table 1.
2.3.1. Measurement techniques
The metrics used to describe rowing performance are summarised in Table 2, accompanied by how they tend to be utilised in rowing training and how the measurement was obtained.
Summary of measurement techniques used

2.3.2. Technique classification
To further develop understanding of individual technique, rowers were mapped onto the quadrant diagram shown in Figure 1. Two metrics were developed, a Focus Ratio (FR) that quantifies the leg and trunk usage for power generation through the drive phase, and a Body Progress (BP) metric that represents how far through the total range of trunk angle an athlete is at during the transition point (where the internal knee angle is = 90°), determined to be the most efficient point for the trunk to begin to open (Reference KleshnevKleshnev, 2011). These are defined in Equations 1 and 2 respectively, where θ = Trunk Angle, and β = Knee Angle.


To establish the meaningfulness of this mapping, the coaching team were asked to appraise the method by qualitatively completing the mapping activity themselves. The coaching team were familiar with each athlete’s technique after having coached all participants for over a year. The maps from the data-driven technique and the coaches were then compared, and each participant was categorised based on the following 3 statements.
-
a) The participant has been plotted in the same quadrant in both the mathematical and the coaches’ mental model, indicating success in data-driven technique interpretation.
-
b) The participant has been plotted in a different quadrant in the mathematical and coaches’ mental model, however upon appraisal the coach agrees with the mathematical model over their original judgement. Indicates success in data-driven technique interpretation, exceeding the ability of coaches.
-
c) The participant has been plotted in a different quadrant in the mathematical and coaches’ mental model, and upon appraisal the coach agrees with their original mental model over the mathematical model. Indicates failure of data-driven technique interpretation.
3. Multi-person study
In this section, the results of the multi-person study are displayed. Here, we utilise the analysis methods discussed in Section 2.3 for the cohort of rowers and discuss how individual technique materialises from the data captured.
3.1. Technique measurements: results
In this section, the established criteria from Section 2.3 are presented. In Figure 4, the participants stroke length is plotted against their height. Whilst the focus of this work is on the value of data-driven insight from pose-tracking, this relationship provides important context to their interplay between physiology and rowing technique. Here, the data collected exhibits a roughly linear correlation between athlete height and stroke length. Both P3 and P8, were identified as particularly flexible rowers, thus having long stroke lengths for their associated height. If these are excluded, a clear inverse correlation between stroke length and participant height for every intensity is found (p<0.01) (
 $${\rho _{low}} = 0.$$
77,
$${\rho _{low}} = 0.$$
77,
 $${\rho _{med}} = 0.$$
79,
$${\rho _{med}} = 0.$$
79,
 $${\rho _{high}} = 0.$$
89).
$${\rho _{high}} = 0.$$
89).
Stroke length vs. height

Figure 4 Long description
A scatter plot representing the relationship between the height of participants and their average stroke length. The horizontal axis represents the height of participants in meters, ranging from 1.55 to 1.90 meters. The vertical axis represents the average stroke length in centimeters, ranging from 120 to 145 centimeters. The data points are color-coded and shaped according to different intensities (low, medium, high) and participants (P1 to P9). The plot shows clusters of data points for each participant, with visible trends indicating variations in stroke length based on height and intensity. The data points are actual values, and there are no clear outliers or gaps in the data.
In Figure 5a) the trunk angles for all participants is displayed. The range between athletes spanned 19.1° between P1 and P7, even though these rowers have relatively similar heights compared to the rest of the group. A statistically significant difference between the trunk angles at low and high intensities was found (t-2.65, p=0.029), indicating that the trunk angle range achieved at low intensity was consistently greater than the range at high intensity. In Figure 5b) The participants shin angle at the catch is displayed. As you can see, there is no clear trend with height, and that each participant’s individual technique and interaction with the rowing machine dominates. Whilst the average is displayed on the graph, participants 1,3 & 9 have significantly higher amounts of over-compression and were found to consistently over-compress for all strokes. These participants were identified as outliers in previous sections, all potentially contributing to their much higher degree of over-compression compared to other participants:
-
• Participant 1 - had the smallest range of trunk angle, likely due to their history in sculling. The coaches involved speculated that the symmetrical movement here leads to a smaller trunk angle.
-
• Participant 3 - has an abnormally long stroke length for their height due to their high flexibility.
-
• Participant 9 - Is the shortest participant.
a) Trunk angle b) Shin angle at the catch vs. height at different intensities

The insights developed from just 3 metrics showcase that we can reliably discern individual technique. Some trends occur but alongside expert interpretation, we can examine in more detail why these differences between athletes potentially occur. These differences are more than just anthropomorphic and benefit from the dynamic data system that was used to capture them.
Mapping of rower technique on the Kleshnev Quadrant

Figure 6 Long description
Panel A: A scatter plot shows the relationship between average BP and average FR for different rowers. The horizontal axis represents average BP, and the vertical axis represents average FR. Each data point is marked with a unique symbol and color representing different rowers (P1 to P9). Panel B: A quadrant chart categorizes rower techniques into four styles: DDR style, Rosenberg style, Adam style, and Soviet style. The horizontal axis represents timing (Simultaneous Timing to Consequent Timing), and the vertical axis represents emphasis (Legs Emphasis to Trunk Emphasis). Each rower's technique is marked with a unique symbol and color corresponding to the legend.
3.2. Technique classification: results
In this section, a mapping of rowing technique is presented and compared with the expert opinion of coaches, to evaluate the meaningfulness and objectivity of the data collected. In Figure 6a), The results of the technique classification are displayed. In Figure 6b), the styles are overlayed onto the original illustrative graph. It should be noted that this classification of styles only refers to the difference between the nine athletes involved in this study, and the centring of this graph would likely change once encompassing a larger set of rowers. When this mapping was compared to the coaches’ opinion as, 5 participants were marked as category a), the coaches’ prediction was the same as labelled by the data-driven technique, and 4 were marked as category b), which upon seeing the data-driven categorisation, the coaches changed their original prediction. No participants fell into category c). The coaches noted that their initial decisions may have been influenced by the order in which they recalled participants and that the numerical data mitigates this bias associated with comparing individual athletes between on another, allowing for a more objective and comprehensive view of the rowing stroke.
This mapping activity further demonstrates that the insights generated from these data-driven techniques are meaningful, both agreeing with and supplementing expert opinion. Mappings like this could be used to profile rowers and allow coaches to discern which rowers may work well together, and what might need to change to provide a well synchronised crew. This exemplifies how actionable insights could be drawn from the analysis techniques discussed, which is explored more thoroughly in Section 4.
4. Single person study
In this section, a single person pilot is presented, looking to highlight how the analysis techniques presented could be used to establish actionable insights into equipment personalisation for athletes. This is achieved through altering the available ranges of motion for a single rower, through parametric adjustment of the ergometer, as is common practice within training and standard boats. These different setups are then compared and described on what may be the optimum setup.
4.1. Setup
Adjustable foot plate for parametric exploration

To achieve parametric adjustment of the rowing setup, two adjustments were made to the ergometer shown in Figure 7. Firstly an adjustable footplate was utilised to shift the rowers foot position up by 10cm on a 45-degree footplate (7.1 cm forwards, 7.1cm upwards). Secondly, the rower’s seated position was adjusted using foam pads, adjusting the rowers seated position by 6cm upwards. 4 configurations were recorded, their nominal position (B), Footplate at maximum and seat nominal (A), Footplate at nominal and seat at maximum (C), and both footplate and seat at maximum (D).
4.2. Results
Below the results of the trunk, shin angles and stroke lengths for each iteration are presented in Table 3, along with the standard deviation (s.d.) of each measurement. It is important to note here, that the individuals’ musculoskeletal facets limit the breadth of change that was observed from participant to participant in Study 1 and thus the changes observed for each setup are smaller than previously observed. Trunk angle is relatively unchanged across each iteration, with a slight increase in consistency and angle within condition A. Across the studies as the rower’s seated position is raised along with foot position, we see an increase in participant stroke length, which is larger than the trial to trial variability observed in study 1 for individual rowers (largest observed difference of 1.9 cm average for P9). This logically makes sense, as the angle between where the ergometer tether attaches, and the rowers natural catch position increases as their seat raises (thus extending the distance travelled). A less evident shin angle at the catch is also observed in condition A, which also may contribute to a smaller stroke length due to a larger stretch observed through the rest of the leg at this higher foot position. In condition A, more consistent results are achieved across all results, potentially indicating this is a more reliable position for the rower.
These findings demonstrate that actionable insight can be drawn from just a few measures of rowing performance, although dependant on the goals of coaches and rowers involved, how this manifests is still open to interpretation. There is a potential trade-off between minimising shin angle at the catch and maximising stroke length for the different configurations. This trade-off is likely due to be treated differently depending on the goal, such as maximising individual effort by increasing stroke length, limiting injury, by decreasing shin angle at the catch, or synchronising with other rowing crews’ styles.
Measurements for different parametric positions

It is important to note that some of the other changes observed are comparable with the trial-to-trial differences seen in Study 1; therefore, a larger dataset must be collected to fully validate the trends illustrated in this pilot. While parametric studies of this type are experimentally expensive, these findings indicate a clear potential to further explore how rowing equipment configuration affects biomechanics on an individual level. By conducting more extensive trials to gain a granular understanding of which specific conditions drive these biomechanical changes, firmer conclusions regarding how individual rowing technique can be enhanced concretely using data-driven methods.
5. Discussion
This study looked to establish the ability to generate meaningful, data-driven individual insights, tied specifically to performance metrics within ergometer rowing. This objective was successfully met, revealing clear differences in kinematics for rowers of different physiologies. The measurement techniques explored showed trends that make anthropometric sense, but they also revealed trends that needed further expert interpretation, such as an understanding rowers’ flexibility, or previous rowing coaching style.
The further investigate the meaningfulness of this data, we involved professional coaches in a mapping exercise, asking them to compare their own opinion to our tools mapping of participant technique. It was found in all cases, that the coaches either completely agreed with the tool, or preferred the tools judgement over their own. It is important to note the potential for automation bias here, a documented phenomenon where individuals place undue trust in machine-generated metrics (Reference Klingbeil, Grützner and SchreckKlingbeil et al., 2024), which was not explored in this study. However, the coaches involved were probed on this topic, admitting that their own biases and not considering the cohort fully may have played into their initial ideas and the tool helped them be more objective. This activity demonstrated how tools could be developed that reflect expert opinion, potentially assist in coaching and equipment personalisation strategies by providing actionable insights through a data-driven approach.
This was explored in more-depth in a single-person pilot study, where equipment personalisation interventions were explored and the employed techniques used to provide actionable insights about which setup may be optimal. 4 setups were explored, finding that there is a likely a trade-off between maximising individual output, reducing injury risk, or choosing how rowers may need to synchronise with other crew members. This small illustration would likely need to be investigated for a larger dataset of rowers to truly establish these trade-offs, and further discussions with professionals would be needed to explore how to balance these competing goals in performance.
The experimental protocol was constrained to four configurations to mitigate the effects of subject fatigue. While a comprehensive exploration of the parameter space would ideally employ a Design of Experiments (DoE) methodology to identify the most salient parameters affecting performance, such an approach remains experimentally intensive (Reference Silseth, Sletten, Grøndahl, Eikevåg and SteinertSilseth et al., 2021). A potential alternative to this would utilise predictive modelling (Reference Clancy, Gatti, Ong, Maly and DelpClancy et al., 2023). This methodology utilizes a minimal set of experimental trials to calibrate and validate subject-specific models. By first understanding an individual’s technique and limitations, these predictive models can simulate how adjustments to equipment parameters will subsequently affect that individual’s technique, aiding with injury, performance and team synchronisation.
Study limitations
Whilst we showcase the usefulness and potential benefits in utilising 2D tracking methods when examining rowing performance, we address the following study limitations. Firstly, due to the planar camera angle, obtaining consistent arm movement data that was meaningful is not discussed in this paper. Some markerless 3D motion capture could be utilised to address this. We appreciate that back injuries are an issue of contention within rowing (Reference Arumugam, Ayyadurai, Perumal, Janani, Dhillon and ThiagarajanArumugam et al., 2020), however most 2D and 3D tracking datasets do not encompass back curvature of any sort. More recent specific spinal models are under development (Reference Khan, Krauß and StrickerKhan et al., 2025), that could be implemented in future analysis.
6. Conclusion
In this study, we looked to investigate how individual technique can be detected and analysed using automated processes, and how these insights could be utilised to make proactive changes with coaching or equipment personalisation. We established key biomechanical metrics informed by professional coaches, finding clear individual differences that correlated with anthropometrics, flexibility, and past training styles. Furthermore, the developed technique mapping tool proved its objectivity and was identified by coaches as a valuable supplement to their expert opinion. This groundwork highlights the significant potential of data-driven methods to capture individual technique nuances. While extensive parametric exploration remains experimentally intensive, future integration with predictive modelling can allow coaches to efficiently explore the optimal design space. This approach will enable proactive decision-making aligned with specific goals, such as maximizing individual performance, minimizing injury risk, or optimizing crew synchronization.








 Open access

