


Introduction: allostery in context – historical overview
Life costs energy. To preserve valuable resources, it is therefore essential that wasteful processes are limited to a minimum. Regulation is of the essence. Proteins are the workhorses of the cell. Their activity is tightly regulated by three main mechanisms: i) protein amount and lifetime, ii) direction to different compartments (e.g., organelles or membrane-less compartments in the cell), and iii) covalent modification or non-covalent binding of effectors; as so elegantly described in the textbook by Petsko and Ringe (Reference Petsko and Ringe2004). Regulation at the transcriptional level takes time, and protein degradation is wasteful and requires recycling of components. The most efficient means is the direct regulation of protein activity by covalent modification or by ligand binding. The latter is the topic of this review.
Effector binding can either occur at the binding sites of primary, endogenous ligands (the so-called orthosteric sites) or at another location, allos stereos (Greek). If binding to a remote site nevertheless affects the biological outcome, one speaks of ‘allostery’. Ligand or substrate (= reactant) binding can be allosterically up- or downregulated. This is often the case for enzymes catalyzing metabolic processes, prompting immediate response to elevated or depleted metabolite pools (Perutz, Reference Perutz1989), but also occurs in proteins without catalytic function.
The first protein structures determined were myoglobin and hemoglobin, by John C. Kendrew and Max Perutz in the late 1950s (Kendrew et al., Reference Kendrew, Bodo, Dintzis, Parrish, Wyckoff and Phillips1958, Reference Kendrew, Dickerson, Strandberg, Hart, Davies, Phillips and Shore1960; Perutz et al., Reference Perutz, Rossmann, Cullis, Muirhead, Will and North1960). Hemoglobin was also the first protein ever reported to be crystallized (Schultz, Reference Schultz1836). It became the poster child for allosteric regulation (Monod et al., Reference Monod, Wyman and Changeux1965; Koshland et al., Reference Koshland, Némethy and Filmer1966; Perutz, Reference Perutz1989; Changeux, Reference Changeux2013) and is featured in every biochemistry textbook. In contrast to myoglobin, hemoglobin adopts a multimeric structure: it is a tetramer composed of two α- and two β-subunits. Similar to catalytic substrates and orthosteric ligands, allosteric effectors often bind at subunit interfaces, along symmetry axes, where they trigger changes in subunit arrangement (Changeux and Edelstein, Reference Changeux and Edelstein2005). However, more recently, allostery has also been observed in monomeric proteins, including myoglobin (Frauenfelder et al., Reference Frauenfelder, McMahon, Austin, Chu and Groves2001; Ascenzi and Fasano, Reference Ascenzi and Fasano2010; Larion et al., Reference Larion, Salinas, Bruschweiler-Li, Miller and Brüschweiler2012), as well as in RNAs and ribozymes (Winkler and Dann III, Reference Winkler and Dann2006). In another twist, allostery has been observed to involve two different enzymes at once, referred to as ‘inter-enzyme allostery’ (Munack et al., Reference Munack, Roderer, Ökvist, Kamarauskaitė, Sasso, van Eerde, Kast and Krengel2016).
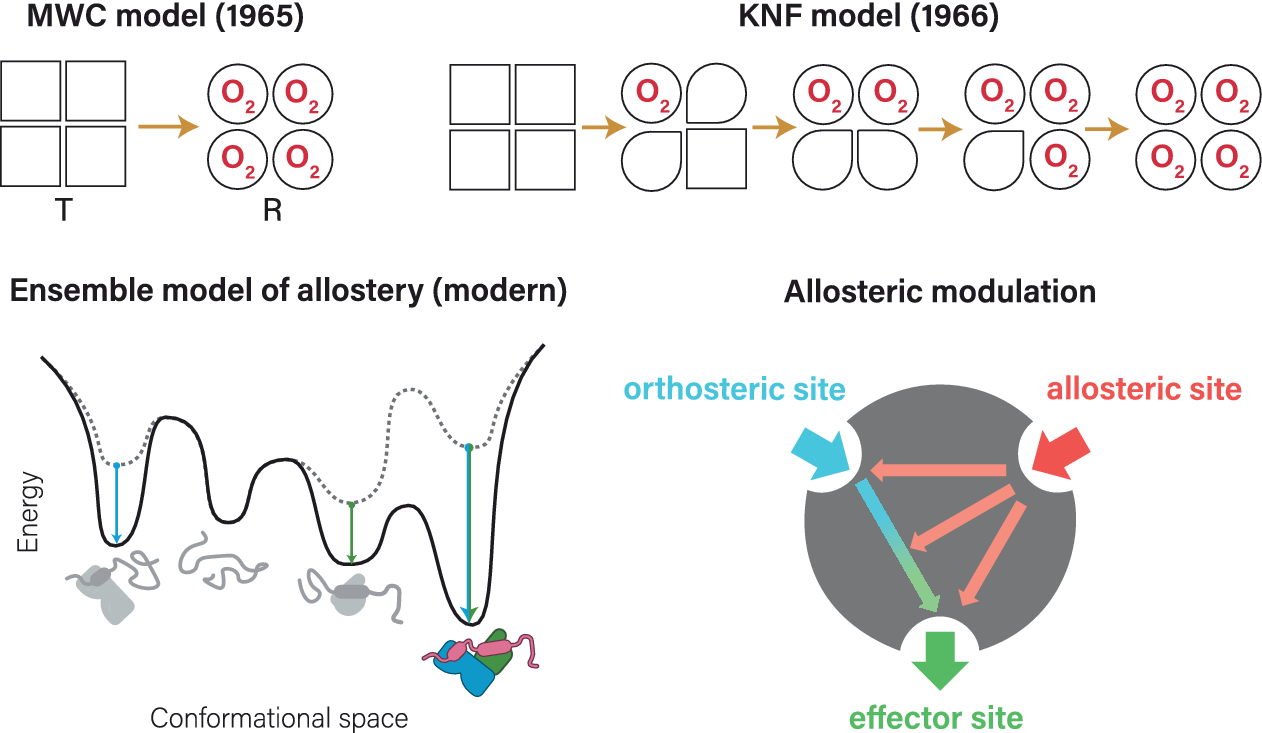
Already before the first protein structure was solved, there were indications of allosteric regulation in biological systems (Bohr, Reference Bohr1892; Bohr et al., Reference Bohr, Hasselbalch and Krogh1904; Novick and Szilard, Reference Novick, Szilard and Boell1954; Umbarger, Reference Umbarger1956; Yates and Pardee, Reference Yates and Pardee1956; Umbarger and Brown, Reference Umbarger and Brown1958). The term ‘allosteric’ was, however, first coined by Monod and Jacob (Reference Monod and Jacob1961) building on Changeux’s now classic experiments (Changeux, Reference Changeux1961). This work was further developed in 1963 (Monod et al., Reference Monod, Changeux and Jacob1963) and culminated in the famous Monod–Wyman–Changeux (MWC) model of allostery in 1965 (Monod et al., Reference Monod, Wyman and Changeux1965), characterized by the interconversion between tense (T) and relaxed (R) conformational states, exemplified for hemoglobin (Figure 1a). An alternative model (Koshland–Nemethy–Filmer (KNF); Figure 1b) (Koshland et al., Reference Koshland, Némethy and Filmer1966) described the observed data in terms of sequential changes of protein conformation. For a well-written historic account of the events we recommend the essay contributed by Morange (Reference Morange2012).
Classical allostery models for hemoglobin. (a) Monod–Wyman–Changeux model of allostery, put forward by Monod et al. (Reference Monod, Wyman and Changeux1965), here represented by a seesaw. This model is also known as ‘symmetry model’ (sometimes also as ‘concerted model’ or ‘conformational selection model’, although not initially described as such) and focuses on the conversion between two states: the inactive T (tense) state and the active R (relaxed) state poised for oxygen binding. Note the sigmoid curve for conversion between states. Panel adapted from Figure 1 in Tsai and Nussinov (Reference Tsai and Nussinov2014). (b) Koshland–Nemethy–Filmer model of allostery, published by Koshland et al. (Reference Koshland, Némethy and Filmer1966). This model is also known as ‘sequential model’ (or ‘domino model’), based on the assumption that conformational changes in one subunit likely affect the neighboring subunits, leading to a sequential change from T to R state. Panel adapted from Figure 1 in Kornev and Taylor (Reference Kornev and Taylor2015).

Although not initially described as such, the MWC model is commonly referred to as ‘conformational selection’ model, whereas the KNF model is also known as ‘induced-fit’ model. Both models originally focused on phenomenological changes, and not on the underlying stereochemical mechanism, which was first analyzed by Perutz in 1970 (Perutz, Reference Perutz1970; Perutz et al., Reference Perutz, Wilkinson, Paoli and Dodson1998). More recently, the role of dynamics and thermodynamics in allosteric regulation have also been appreciated (Jardetzky, Reference Jardetzky1996; Kern and Zuiderweg, Reference Kern and Zuiderweg2003; Popovych et al., Reference Popovych, Sun, Ebright and Kalodimos2006; Tsai et al., Reference Tsai, del Sol and Nussinov2008; Boehr et al., Reference Boehr, Nussinov and Wright2009; Tzeng and Kalodimos, Reference Tzeng and Kalodimos2012). Allostery can even occur without any obvious change in conformation (Cooper and Dryden, Reference Cooper and Dryden1984; Popovych et al., Reference Popovych, Sun, Ebright and Kalodimos2006; Tsai et al., Reference Tsai, del Sol and Nussinov2008; Tzeng and Kalodimos, Reference Tzeng and Kalodimos2012; McLeish et al., Reference McLeish, Rodgers and Wilson2013; Nussinov and Tsai, Reference Nussinov and Tsai2015). At the other end of the spectrum, very drastic conformational changes have been observed, for example, when intrinsically disordered proteins (IDPs) fold up upon binding to allosteric effectors (Ferreon et al., Reference Ferreon, Ferreon, Wright and Deniz2013). This can be explained by the influence of allosteric effectors on the relative energies of an ensemble of conformational states, a model that has gained traction only recently (Ma et al., Reference Ma, Kumar, Tsai and Nussinov1999; Lange et al., Reference Lange, Lakomek, Farès, Schröder, Walter, Becker, Meiler, Grubmüller, Griesinger and de Groot2008; Boehr et al., Reference Boehr, Nussinov and Wright2009; Ferreon et al., Reference Ferreon, Ferreon, Wright and Deniz2013; Hilser, Reference Hilser2013; Motlagh et al., Reference Motlagh, Wrabl, Li and Hilser2014; Wei et al., Reference Wei, Xi, Nussinov and Ma2016), even though its principle was essentially already represented by the MWC model (Monod et al., Reference Monod, Wyman and Changeux1965). Today, it is clear that both the conformational selection model and the induced-fit principles underlying the KNF model (Koshland, Reference Koshland1959; Koshland et al., Reference Koshland, Némethy and Filmer1966) are important features of allosteric regulation (Perutz, Reference Perutz1989; Silva et al., Reference Silva, Bowman, Sosa-Peinado and Huang2011; Motlagh et al., Reference Motlagh, Wrabl, Li and Hilser2014; Tsai and Nussinov, Reference Tsai and Nussinov2014). It has even been postulated that all dynamic proteins may be allosteric (Gunasekaran et al., Reference Gunasekaran, Ma and Nussinov2004) – and which proteins are not dynamic?
Classical example: hemoglobin
Hemoglobin is the major oxygen carrier in blood and responsible for transporting oxygen from the lungs to the rest of the body, where it is released to the tissues (Figure 2a). Oxygen uptake and release needs to be tightly regulated to preclude suffocation: in the lungs, oxygen uptake must be efficient, and in the tissues, oxygen must be promptly released. Oxygen binds to hemoglobin at four heme groups – one heme per subunit – to the iron ion at its center (Figure 2b) (Perutz et al., Reference Perutz, Rossmann, Cullis, Muirhead, Will and North1960, Reference Perutz, Muirhead, Cox and Goaman1968). In contrast to monomeric myoglobin, which binds and stores oxygen in muscle, oxygen binding to hemoglobin is positively cooperative, characterized by a sigmoidal curve (Theorell, Reference Theorell1934; Morgan and Chichester, Reference Morgan and Chichester1935) (Figure 2a): the more oxygen binds, the higher the protein’s affinity for it, until hemoglobin is loaded with four molecules of oxygen. This means that oxygen binding to one subunit affects oxygen binding to a distant site on another subunit. With this, hemoglobin is a perfect example of allostery and featured as the first of 24 examples in the publication by Monod et al. (Reference Monod, Wyman and Changeux1965), where they presented a relatively simple model of allostery that became known as ‘MWC’ or ‘symmetry model’ (Figure 1a). This model postulated that “allosteric effects are due to the displacement of an equilibrium between discrete states”, because ligands stabilize either one state or the other and “the conformation of each protomer is constrained by its association with the other protomers” (Monod et al., Reference Monod, Wyman and Changeux1965). This model was challenged by KNF shortly afterward, who noted that “the fact that a good fit to hemoglobin data was obtained with rather simple models does not mean that these simple models are necessarily correct” and “a partial change in the A conformation might be caused by a change in an adjacent B structure, thus giving a conformation intermediate between A and B” (Koshland et al., Reference Koshland, Némethy and Filmer1966). The KNF model is therefore also known as ‘sequential model’ of allostery (Figure 1b).
Allosteric transitions in hemoglobin. (a) Deoxy (T state, left; PDB ID: 5KSI) (Sun et al., Reference Sun, D’Alessandro, Ahmed, Zhang, Song, Ko, Nemkov, Reisz, Wu, Adebiyi, Peng, Gong, Liu, Huang, Wen, Wen, Berka, Bogdanov, Abdulmalik, Han, Tsai, Idowu, Juneja, Kellems, Dowhan, Hansen, Safo and Xia2017) and oxy forms of hemoglobin (R state, right; PDB ID: 3A0G (Etti et al., to be published), depicted in Irving–Geis-like drawings. The hemoglobin α-subunits are colored in orange and the β-subunits in deep violet, with heme groups bound. In the middle, the sigmoid oxygen uptake curve of hemoglobin is shown, which ensures oxygen transport from the lungs to the tissues (adapted from Tymoczko et al., Reference Tymoczko, Berg, Gatto and Stryer2018, Figure 9.1). (b, lower right) Oxygen (red) binding to the heme group (gray/orange, with iron sphere at its center) converts the deoxy (gray) to the oxy (colored) form of hemoglobin. Note the change in conformation of the heme group and its effect on the proximal histidine (gray/blue sticks), which is part of helix F. This helix is close to the interface between α- and β-subunits, as shown in panel (a) above. (c, lower left) The negatively charged allosteric hemoglobin inhibitor 2,3-bisphosphoglycerate (BPG, red sticks) binds to the center of the hemoglobin α2β2-heterotetramer and interacts with positively charged groups in its vicinity. Binding of BPG stabilizes the tense (T) deoxy state of hemoglobin shown in panel (a) above.

Both models eventually turned out to be too simplistic (Colombo et al., Reference Colombo, Rau and Parsegian1992; Silva et al., Reference Silva, Rogers and Arnone1992; Cui and Karplus, Reference Cui and Karplus2008; Fischer et al., Reference Fischer, Olsen, Nam and Karplus2011; Changeux, Reference Changeux2012). In a groundbreaking thermodynamic study in 1992, Parsegian et al. demonstrated the importance of solvation effects in allosteric regulation, and noted that the transition from deoxygenated T state to oxygenated R state in hemoglobin was accompanied by the binding of approximately 60 additional water molecules (Colombo et al., Reference Colombo, Rau and Parsegian1992), pointing to the effect of other factors than structure alone (reminiscent of the ‘hydrophobic effect’ underlying protein folding). In the same year, Arnone and coworkers reported a third quaternary structure of human hemoglobin (Silva et al., Reference Silva, Rogers and Arnone1992).
Allosteric control of hemoglobin is in fact quite sophisticated. In addition to the homotropic effect of oxygen binding to different subunits, oxygen binding and release is also regulated by heterotropic effects, that is, by binding of other molecules or ions. In most jawed vertebrates, release of oxygen from hemoglobin to myoglobin in muscle is regulated by BPG (2,3-bisphosphoglycerate), a highly negatively charged small molecule, which binds to the heterotetramer interface at the center of hemoglobin by electrostatic interactions (Arnone, Reference Arnone1972) (Figure 2c). Binding of BPG causes subtle conformational changes that cause a realignment of the protein subunits, promoting oxygen release by interfering with oxygen binding to the heme groups. In other words, although oxygen and BPG bind to hemoglobin at different sites, binding is mutually exclusive.
BPG is not the only heterotropic allosteric regulator of hemoglobin. Also protons (i.e., low pH), carbon dioxide, and chloride interfere with oxygen binding by allosteric mechanisms involving salt bridges and hydrogen bonds (Perutz, Reference Perutz1970, Reference Perutz1989). Inhibition of oxygen binding by protons is referred to as ‘Bohr effect’, after its discoverer Christian Bohr (the father of the famous Danish physicist Niels Bohr) (Bohr, Reference Bohr1892; Bohr et al., Reference Bohr, Hasselbalch and Krogh1904). Inhibition by carbon dioxide also involves protons (in addition to N-terminal carbamate formation), which are released upon dissolving of the gas in the blood (with concomitant formation of bicarbonate – a process catalyzed by carbonic anhydrase).
Allosteric regulation of hemoglobin relies on its tetrameric structure. This makes it interesting to compare hemoglobin to its monomeric ancestor, which likely resembles myoglobin (displaying a hyperbolic oxygen binding curve suggesting non-cooperativity) (Theorell, Reference Theorell1934). Even though myoglobin has also been suggested to have allosteric features (Frauenfelder et al., Reference Frauenfelder, McMahon, Austin, Chu and Groves2001), its regulation is clearly less sophisticated compared to tetrameric hemoglobin (Antonini and Brunori, Reference Antonini, Brunori, Neuberger and Tatum1971; Baldwin and Chothia, Reference Baldwin and Chothia1979). By constructing a phylogenetic tree and subsequent experimental characterization of “resurrected” family members, Pillai et al. were able to shed light on how complex regulation can arise from humble beginnings (Pillai et al., Reference Pillai, Chandler, Liu, Signore, Cortez-Romero, Benesch, Laganowsky, Storz, Hochberg and Thornton2020; Berenbrink, Reference Berenbrink2020). Their rigorous study showed that strikingly few mutations are required to turn a simple monomeric hemoglobin precursor via a non-cooperative homodimer “missing link” into a tetrameric protein with regulatory features like hemoglobin.
Other well-known examples
Aspartate transcarbamoylase
Aspartate transcarbamoylase (ATCase) catalyzes a key step in pyrimidine biosynthesis, with cytidine triphosphate (CTP) as the final product. This enzyme featured a prominent role under the development of the MWC model (Monod et al., Reference Monod, Wyman and Changeux1965) and is one of the best-known examples of allosteric regulation of enzymes. ATCase has a cage-like structure composed of six catalytic and six regulatory subunits (Kantrowitz and Lipscomb, Reference Kantrowitz and Lipscomb1988) (Figure 3). In the T state, the cage is collapsed and the active sites are occluded. Upon binding of the substrates, the enzyme “relaxes” by a concerted transition into the R state (Macol et al., Reference Macol, Tsuruta, Stec and Kantrowitz2001). Bringing the two substrates l-aspartate and carbamoyl phosphate in close proximity is essentially all that is needed for the reaction to occur, which is a prime example for a ‘propinquity’-driven reaction.
Allosteric transition in aspartate transcarbamoylase (ATCase). Left and right panels show the structure of the ATCase heterododecamer in its tense (PDB ID: 4KH1) and relaxed states (PDB ID: 4KH0), respectively (Cockrell et al., Reference Cockrell, Zheng, Guo, Peterson, Truong and Kantrowitz2013). The upper and middle panels provide side and top views of the complex, with catalytic and regulatory subunits in different colors (deep violet and orange, respectively). Interfaces that are altered by the allosteric transition are highlighted in red and yellow. The schematic representations are based on Figures 3–10 from the textbook by Petsko and Ringe (Reference Petsko and Ringe2004). A black square contour marks the region of the regulatory subunit bound to the allosteric regulators (either the feedback inhibitors CTP + UTP, in black/orange, or the feedforward activator adenosine triphosphate (ATP), in blue), shown in detail in the bottom panel (based on the graphical abstract by Cockrell et al., Reference Cockrell, Zheng, Guo, Peterson, Truong and Kantrowitz2013). Note the different conformations of the N-termini of the regulatory subunits (marked in magenta), which trigger opposite allosteric effects (inhibition or activation) through the same site. At bottom-center, the reaction catalyzed by ATCase and the feedback loop leading to its tense/relaxed transition are shown in schematic representation, with ATP as blue star and the smaller nucleotides CTP (black) and UTP (orange) represented by truncated stars.

ATCase is activated by feedforward control, provided by the end product of purine biosynthesis, adenosine triphosphate (ATP). Binding of CTP to the same regulatory sites inhibits the enzyme (Changeux et al., Reference Changeux, Gerhart and Schachman1968), preventing a waste of resources (Yates and Pardee, Reference Yates and Pardee1956). Feedback inhibition and feedforward control are common mechanisms of metabolic allosteric regulation (Monod et al., Reference Monod, Changeux and Jacob1963). The inhibitory effect of CTP has, however, been overestimated earlier and is rather weak on its own (Cockrell et al., Reference Cockrell, Zheng, Guo, Peterson, Truong and Kantrowitz2013). In vivo, full feedback inhibition requires the combination of CTP, uridine triphosphate (UTP), and a divalent ion (and also feedforward activation is enhanced by a divalent ion) (Cockrell et al., Reference Cockrell, Zheng, Guo, Peterson, Truong and Kantrowitz2013). This new paradigm for ATCase allosteric regulation reconciles previous inconsistencies; for example, the requirement of divalent ions (Cockrell and Kantrowitz, Reference Cockrell and Kantrowitz2012), the fact that ATP and CTP alone cannot induce the T to R transition (Howlett et al., Reference Howlett, Blackburn, Compton and Schachman1977) and that UTP contributes to feedback inhibition, but binds to a unique regulatory site on ATCase (Peterson et al., Reference Peterson, Cockrell and Kantrowitz2013). The question how binding of inhibitors and activators to the same regulatory sites can cause so different effects, is elucidated by the unique – and alternatively exclusive – conformations of the N-terminal regions, stabilizing either the T or R state (Cockrell et al., Reference Cockrell, Zheng, Guo, Peterson, Truong and Kantrowitz2013) (Figure 3).
Lac repressor
Bacterial genes are often organized in operons, which contain multiple genes under the control of a single promoter. Enzymes encoded by the lac operon enable cells to metabolize the disaccharide lactose when the bacteria’s preferred carbon source (glucose) is unavailable (Lewis, Reference Lewis2013). However, when glucose is plentiful or lactose is not present, transcription is shut down to avoid wasting resources. This is the function of the Lac repressor, a tetrameric protein, which prevents binding of RNA polymerase to the promoter by binding to specific DNA sequences upstream of the operon genes. The Lac repressor has two domains: one for binding DNA and the other for tetramerization (Lewis et al., Reference Lewis, Chang, Horton, Kercher, Pace, Schumacher, Brennan and Lu1996) (Figure 4). Release of the repressor is triggered by allosteric regulation when an inducer (often derived from lactose, such as isopropyl β-d-1-thiogalactopyranoside (IPTG), and therefore signaling its presence) binds to the repressor at the distal, tetramerization site (Figure 4). Other metabolites activate repression. Despite the availability of crystal structures of the Lac repressor in complexes with DNA, inducer, and other allosteric effectors (Lewis et al., Reference Lewis, Chang, Horton, Kercher, Pace, Schumacher, Brennan and Lu1996; Daber et al., Reference Daber, Stayrook, Rosenberg and Lewis2007), the precise allosteric model has only been elucidated recently, by high-resolution nuclear magnetic resonance (NMR) spectroscopy (Romanuka et al., Reference Romanuka, Folkers, Gnida, Kovačič, Wienk, Kaptein and Boelens2023). Their data showed that the Lac repressor in the absence of ligands exists in a dynamic equilibrium between two conformational states, and the equilibrium is subtly shifted to the one or other side by DNA or inducers (Figure 4) – in full agreement with the MWC model.
Allosteric transition of Lac repressor from E. coli. The scheme on top shows the equilibrium between tense (T, left) and relaxed states (R, right). The allosteric states are stabilized either by DNA binding to the promotor region of a gene (T), interfering with transcription, or by binding to an inducer (e.g., IPTG; R), permitting transcription, tipping the balance in the favor of one state or the other. The figure was adapted from Lewis (Reference Lewis2013, Figure 3) and is based on experimental results by the Boelens lab, which showed strong evidence for the conformational selection model (Romanuka et al., Reference Romanuka, Folkers, Gnida, Kovačič, Wienk, Kaptein and Boelens2023). The lower panel shows the structures of the E. coli Lac repressor in its tense (left; model based on PDB ID: 1EFA (Bell and Lewis, Reference Bell and Lewis2000) and PDB ID: 1LBG (Lewis et al., Reference Lewis, Chang, Horton, Kercher, Pace, Schumacher, Brennan and Lu1996) and relaxed states (right; PDB ID: 4RZS (Taylor et al., Reference Taylor, Garruss, Moretti, Chan, Arbing, Cascio, Rogers, Isaacs, Kosuri, Baker, Fields, Church and Raman2016)). The figure shows the homodimer, with the two protomers colored in orange and deep violet; in the biological unit, two homodimers associate with a homotetramer, shown in the insets at the bottom-center.

Regulation of the Escherichia coli lac operon was famously analyzed and understood by Jacob and Monod (Jacob and Monod, Reference Jacob and Monod1961). Today, it is commonly exploited in biochemistry laboratories and the biotechnology industry for recombinant expression of genes.
Kinases
Kinases are enzymes that catalyze the phosphorylation of molecules, either small or large. They serve important functions in metabolism and cell signaling. Their structure consists of two lobes or domains, separated by a catalytic cleft (Figure 5a). This makes them prime examples of the induced fit mechanism. While one domain serves to bind the substrate(s), the other acts like a lid, which clamps down on the substrate when it binds. Kinases can be subject to both covalent modification (predominantly by being phosphorylated themselves) and to non-covalent allosteric regulation, at their activation loop, which is positioned in the substrate-binding domain and serves as centerpiece of kinase allosteric regulation. Since allostery in protein kinases has been shown to involve dynamic interactions of clusters of amino acid (Masterson et al., Reference Masterson, Cheng, Yu, Tonelli, Kornev, Taylor and Veglia2010; Leroux and Biondi, Reference Leroux and Biondi2020) rather than simple residue-to-residue information transfer between substrate recognition and catalysis, the allosteric mechanism of kinases has recently been likened to harmonics in a violin (Kornev and Taylor, Reference Kornev and Taylor2015) (Figure 5a).
Allosteric transitions in protein kinases. (a) Transition between T and R states in protein kinases. The N-lobe is colored orange and the C-lobe deep violet, highlighting the stereotypical bilobal fold of protein kinases (here: EGFR kinase domain, with activation-induced dimerization indicated by second kinase, in gray). The activation loop, undergoing a conformational change during the transition, is highlighted in green. Allosteric transitions in protein kinases have been likened to the change in harmonics when playing a violin, now often referred to as ‘violin model’ (picture adapted from Kornev and Taylor, Reference Kornev and Taylor2015, Figure 1). The bottom panel shows the structure of the EGFR kinase domain in tense/inactive (PDB ID: 2GS7) and relaxed/active state (PDB ID: 2GS6) (Zhang et al., Reference Zhang, Gureasko, Shen, Cole and Kuriyan2006). (b) Ligand-induced EGFR dimerization leads to activation of one of its C-terminal tyrosine kinase domains, linked to the mitogen-activated protein kinase (MAPK) cascade. Ultimately, EGFR dimerization results in the activation of transcription factors.

One of the best-known examples of regulated kinases is phosphofructokinase 1 (PFK-1), a tetrameric enzyme that catalyzes the third step of glycolysis, from fructose-6-phosphate to fructose-1,6-bisphosphate (Schirmer and Evans, Reference Schirmer and Evans1990). This is one of the three irreversible steps of glycolysis (ΔG << 0), which needs to be “bypassed” by another enzyme (a phosphatase) in the reverse pathway, gluconeogenesis. At the interface of several pathways, it is of critical importance that the activity of PFK-1 is tightly controlled. PFK-1 consumes ATP and is therefore dependent on the energy state of the cell. Metabolites that signal the energy charge (ATP, ADP, AMP, as well as citrate and fructose-2,6-bisphosphate (F-2,6-BP), through hormone signaling) are therefore ideal allosteric regulators. As can be read up in every biochemistry textbook, metabolites signaling high energy charge (ATP and citrate) allosterically downregulate PFK-1 activity, whereas those associated with low energy (AMP, ADP, and F-2,6-BP) activate the enzyme’s activity by affecting the equilibrium between T and R states. The inactive T state binds ATP at the allosteric effector site, and the active R conformation has AMP or ADP bound to the same site. This conformation readily binds the enzyme substrate, fructose-6-phosphate. The structural basis for allosteric regulation of PFK-1 in bacteria is well described and serves as a textbook example of allostery (Schirmer and Evans, Reference Schirmer and Evans1990). In contrast, no structural information existed for the eukaryotic enzyme until very recently. PFK-1 from human liver has now been shown to exhibit a slightly different allosteric mechanism than bacteria, with allosteric inhibition by ATP at multiple sites in the T state, and the C-terminus contributing through autoinhibition (Lynch et al., Reference Lynch, Hansen, Salay, Cooper, Timr, Kollman and Webb2024). In addition to tetrameric PFK-1, higher-order PFK-1 filaments have been characterized by cryo–electron microscopy (cryo-EM) in the same study.
Another metabolically important enzyme is glucokinase, which phosphorylates glucose in the liver and pancreas. Also, this enzyme displays sigmoidal kinetics – despite exclusively functioning as a monomer (Cornish-Bowden and Cárdenas, Reference Cornish-Bowden, Cárdenas, Matschinsky and Magnuson2004). NMR data suggest that the cooperative kinetic response at low glucose concentrations is caused by millisecond disorder–order transitions of the lid domain, which is bypassed at high glucose concentrations (Larion et al., Reference Larion, Salinas, Bruschweiler-Li, Miller and Brüschweiler2012), but this is not the only allosteric activation mechanism of this unique enzyme. Hyperinsulinemia-associated disease variants display a second activation mechanism, in which the ensemble structure is not perturbed (Whittington et al., Reference Whittington, Larion, Bowler, Ramsey, Brüschweiler and Miller2015).
In addition to their function in metabolism, kinases are highly important transmitters of biological signals. Protein kinases are commonly organized in cascades, where one kinase phosphorylates the next (Figure 5b). This allows messages to be relayed extremely rapidly, due to signal amplification. Allosteric regulation of kinase cascades requires tight spatio-temporal control. This may be achieved and sped up in an interactive system of co-evolution based on co-localization, as suggested by Kuriyan and Eisenberg (Reference Kuriyan and Eisenberg2007). This hypothesis was bolstered by a study of serine kinase paralogs (and evolutionary related orthologs), one of which belongs to the MAP kinase cascade and is scaffold-dependent (i.e., co-localized with other kinases on the same scaffolding protein, which also contributes to allosteric regulation (Zalatan et al., Reference Zalatan, Coyle, Rajan, Sidhu and Lim2012), whereas the other is scaffold-independent (Coyle et al., Reference Coyle, Flores and Lim2013)). Intriguingly, even the evolutionary precursors showed weak allostery, suggesting that latent allostery is intrinsic to the kinases and can be exploited by exposure to a novel regulator to evolve new modes of allosteric regulation (Coyle et al., Reference Coyle, Flores and Lim2013). A similar conclusion was reached by the Kern lab in a study involving ancestor sequence reconstruction (Pauling and Zuckerkandl, Reference Pauling and Zuckerkandl1963) and experimental resurrection of a Ser/Thr kinase (Aurora A kinase) (Hadzipasic et al., Reference Hadzipasic, Wilson, Nguyen, Kern, Kim, Pitsawong, Villali, Zheng and Kern2020). Also, this study strongly suggests that evolution of allosteric regulation is already encoded in the kinase, and did not per se require co-localization.
Initiation of protein kinase cascades is usually triggered by a Tyr kinase, as in the case of the epidermal growth factor receptor (EGFR) (Figure 5b). After ligand binding, the receptor dimerizes and the signal is transmitted through the membrane, modulated by lipids (Coskun et al., Reference Coskun, Grzybek, Drechsel and Simons2011; Maeda et al., Reference Maeda, Tamagaki-Asahina, Sato, Yanagawa and Sako2022). This leads to auto-phosphorylation of tyrosine residues at the C-terminal tail on the other side of the membrane (Downward et al., Reference Downward, Parker and Waterfield1984; Arkhipov et al., Reference Arkhipov, Shan, Das, Endres, Eastwood, Wemmer, Kuriyan and Shaw2013; Kovacs et al., Reference Kovacs, Das, Wang, Collier, Cantor, Huang, Wong, Mirza, Barros, Grob, Jura, Bose and Kuriyan2015). Autophosphorylation was long thought to be a symmetric process, like dimerization itself, but has more recently been shown to be asymmetric, with one tail domain acting as an activator and the other as a receiver (Zhang et al., Reference Zhang, Gureasko, Shen, Cole and Kuriyan2006).
GPCRs, G-proteins and biased signaling
G-protein-coupled receptors (GPCRs) are the largest family of eukaryotic membrane receptors and the target of approximately one third of all small molecule drugs (Thal et al., Reference Thal, Glukhova, Sexton and Christopoulos2018). GPCRs respond to a wealth of external signals, from hormones and other chemicals to light. Like tyrosine kinase receptors, GPCRs allosterically relay signals through cell membranes (Figure 6a), and their activity is modulated by lipids (Oates and Watts, Reference Oates and Watts2011; Baccouch et al., Reference Baccouch, Rascol, Stoklosa and Alves2022). The first GPCR-like structure was of bacteriorhodopsin (Henderson and Unwin, Reference Henderson and Unwin1975), a protein responding to light (the first high-resolution structure of a GPCR was published by Palczewski et al. in Reference Palczewski, Kumasaka, Hori, Behnke, Motoshima, Fox, Le Trong, Teller, Okada, Stenkamp, Yamamoto and Miyano2000). This was also the very first membrane protein structure elucidated (by electron microscopy), and many years later led to the award of the Nobel prize in Chemistry to Richard Henderson (together with Dubochet and Frank) “for developing cryo–electron microscopy for the high-resolution structure determination of biomolecules in solution” (2017). As Editor in Chief of Quarterly Reviews of Biophysics (in which this review is published), Richard Henderson brought the journal to the respected status that it enjoys today.
Allosteric transitions in G-protein-coupled receptors (GPCRs). (a) Top left: general topology of a GPCR, with transmembrane helices, extracellular (ECL) and intracellular (ICL) loops labeled. The position of the ligand-binding pocket is highlighted in yellow (illustration adapted from Schneider et al., Reference Schneider, Korshunova, Musiani, Alfonso-prieto, Giorgetti and Carloni2018, Figure 2). Top right: NMR structure of β-2 adrenergic receptor (ADRB2; PDB ID: 6KR8 (Imai et al., Reference Imai, Yokomizo, Kofuku, Shiraishi, Ueda and Shimada2020)), with ICL3 loop sampling multiple conformations (magenta). Bottom left: ADRB2 structure in its tense/inactive (PDB ID: 2RH1 (Cherezov et al., Reference Cherezov, Rosenbaum, Hanson, Rasmussen, Thian, Kobilka, Choi, Kuhn, Weis, Kobilka and Stevens2007)) and relaxed/active states (PDB ID: 3P0G (Rasmussen et al., Reference Rasmussen, Choi, Fung, Pardon, Casarosa, Chae, DeVree, Rosenbaum, Thian, Kobilka, Schnapp, Konetzki, Sunahara, Gellman, Pautsch, Steyaert, Weis and Kobilka2011b)), colored in deep violet and orange, respectively. An inverse agonist (carazolol, yellow) is bound to the ligand pocket of the T state, whereas the agonist BI-167107 (cyan) is bound to the same pocket in the R state. The C-terminus of bovine Gαs is shown in green (structural superposition using the Gα coordinates from PDB ID: 3SN6 (Rasmussen et al., Reference Rasmussen, DeVree, Zou, Kruse, Chung, Kobilka, Thian, Chae, Pardon, Calinski, Mathiesen, Shah, Lyons, Caffrey, Gellman, Steyaert, Skiniotis, Weis, Sunahara and Kobilka2011a)). Bottom right: allosteric communication network underlying activation, as reconstructed by Zhou et al. (Reference Zhou, Yang, Wu, Guo, Guo, Zhong, Cai, Dai, Jang, Shakhnovich, Liu, Stevens, Lambert, Babu, Wang and Zhao2019) and mapped on the backbone of human ADRB2 in its active conformation (PDB ID: 3P0G (Rasmussen et al., Reference Rasmussen, Choi, Fung, Pardon, Casarosa, Chae, DeVree, Rosenbaum, Thian, Kobilka, Schnapp, Konetzki, Sunahara, Gellman, Pautsch, Steyaert, Weis and Kobilka2011b)). Key functional signal relay hubs – including ‘toggle switch’ and ‘ionic lock’ – are labeled, a bound agonist molecule (BI-167107) is shown in cyan, and Gα in green (PDB ID: 3SN6 (Rasmussen et al., Reference Rasmussen, DeVree, Zou, Kruse, Chung, Kobilka, Thian, Chae, Pardon, Calinski, Mathiesen, Shah, Lyons, Caffrey, Gellman, Steyaert, Skiniotis, Weis, Sunahara and Kobilka2011a)). (b) G protein activation cycle. In their inactive GDP-bound form (top), G proteins exist as a trimeric complex attached to the cytoplasmic side of the cell membrane. Ligand-bound GPCRs, transitioning from T to R state, promote G protein activation by GDP–GTP nucleotide exchange in the Gα subunit (left). The activated trimeric complex dissociates, allowing its components to interact with cellular effectors (here: Gα with adenylate cyclase, AC, generating cAMP, and Gβγ with an ion channel). Return to the inactive state occurs by GTP hydrolysis to GDP, promoted by RGS (Regulator of G-protein-signaling; not shown). Figure adapted from Rasmussen et al. (Reference Rasmussen, DeVree, Zou, Kruse, Chung, Kobilka, Thian, Chae, Pardon, Calinski, Mathiesen, Shah, Lyons, Caffrey, Gellman, Steyaert, Skiniotis, Weis, Sunahara and Kobilka2011a, Figure 1) and Petsko and Ringe (Reference Petsko and Ringe2004, Figures 3–14).

The basic structural unit of GPCRs is a monomeric 7-transmembrane helix fold (Dixon et al., Reference Dixon, Kobilka, Strader, Benovic, Dohlman, Frielle, Bolanowski, Bennett, Rands, Diehl, Mumford, Slater, Sigal, Caron, Lefkowitz and Strader1986) (Figure 6a). Upon agonist binding (or light capturing) on the extracellular side, a so-called ‘toggle’ helix kinks and conveys the signal through an allosteric network to the cytosolic side of the membrane, where an ‘ionic lock’ opens (Sprang, Reference Sprang2007). In addition, oligomerization has been shown to be important for the function of some GPCRs (Audet and Bouvier, Reference Audet and Bouvier2012), giving rise to both positive and negative allosteric modulation (referred to as PAM and NAM, respectively). Importantly, GPCRs are often involved in more than one pathway, and signaling can be biased by different ligands, triggering either one signaling pathway or another (Liu et al., Reference Liu, Horst, Katritch, Stevens and Wüthrich2012; Hua et al., Reference Hua, Li, Wu, Iliopoulos-Tsoutsouvas, Wang, Wu, Shen, Brust, Nikas, Song, Song, Yuan, Sun, Wu, Jiang, Grim, Benchama, Stahl, Zvonok, Zhao, Bohn, Makriyannis and Liu2020; Suomivuori et al., Reference Suomivuori, Latorraca, Wingler, Eismann, King, Kleinhenz, Skiba, Staus, Kruse, Lefkowitz and Dror2020; Wingler et al., Reference Wingler, Skiba, McMahon, Staus, Kleinhenz, Suomivuori, Latorraca, Dror, Lefkowitz and Kruse2020).
As their name suggests, GPCRs are well-known to activate heterotrimeric G-proteins on the cytosolic side of the membrane. Like their smaller cousins (small G-proteins, with ras-p21 as their prototype) (Pai et al., Reference Pai, Kabsch, Krengel, Holmes, John and Wittinghofer1989; Schlichting et al., Reference Schlichting, Almoh, Rapp, Wilson, Petratos, Lentfer, Wittinghofer, Kabsch, Pai, Petsko and Goody1990; Lu et al., Reference Lu, Jang, Muratcioglu, Gursoy, Keskin, Nussinov and Zhang2016), heterotrimeric G-proteins also cycle between an active GTP-bound conformation and an inactive GDP form, subject to allosteric regulation (Audet and Bouvier, Reference Audet and Bouvier2012; Zhou et al., Reference Zhou, Yang, Wu, Guo, Guo, Zhong, Cai, Dai, Jang, Shakhnovich, Liu, Stevens, Lambert, Babu, Wang and Zhao2019) (Figure 6b). When the signal arrives, the G-protein dissociates from the GPCR and prompts a response (actually, there are two responses: one conveyed through Gα and one through Gβγ). The signal is switched off when Gα gets deactivated by GTP hydrolysis, either through its intrinsic GTPase activity or by effector regulation, and the G-protein reassembles, ready to enter the next cycle. Instrumental for elucidating this mechanism were in particular two scientists, Lefkowitz and Kobilka (Dixon et al., Reference Dixon, Kobilka, Strader, Benovic, Dohlman, Frielle, Bolanowski, Bennett, Rands, Diehl, Mumford, Slater, Sigal, Caron, Lefkowitz and Strader1986; Rasmussen et al., Reference Rasmussen, Choi, Rosenbaum, Kobilka, Thian, Edwards, Burghammer, Ratnala, Sanishvili, Fischetti, Schertler, Weis and Kobilka2007, Reference Rasmussen, DeVree, Zou, Kruse, Chung, Kobilka, Thian, Chae, Pardon, Calinski, Mathiesen, Shah, Lyons, Caffrey, Gellman, Steyaert, Skiniotis, Weis, Sunahara and Kobilka2011a), who shared the Nobel prize in 2012.
In recent years, the molecular mechanism of GPCRs has been elaborated in more detail. Not only can GPCRs signal through different G-proteins; intriguingly, GPCRs can also use alternative signaling partners, like β-arrestins and others (Audet and Bouvier, Reference Audet and Bouvier2012; Zhou et al., Reference Zhou, Yang, Wu, Guo, Guo, Zhong, Cai, Dai, Jang, Shakhnovich, Liu, Stevens, Lambert, Babu, Wang and Zhao2019). In a recent NMR analysis, by Kleist et al., the recruitment of either G-proteins or β-arrestins was shown to be guided by conformational selection at an allosteric hub (Kleist et al., Reference Kleist, Jenjak, Sente, Laskowski, Szpakowska, Calkins, Anderson, McNally, Heukers, Bobkov, Peterson, Thomas, Chevigné, Smit, McCorvy, Babu and Volkman2022), and Förster resonance energy transfer (FRET) analysis revealed the importance of the third intracellular loop in biased GPCR signaling (Sadler et al., Reference Sadler, Ma, Ritt, Sharma, Vaidehi and Sivaramakrishnan2023) (Figure 6a). Moreover, different pockets in GPCRs were shown to be tuned by receptor activation and ligand recruitment (Kleist et al., Reference Kleist, Jenjak, Sente, Laskowski, Szpakowska, Calkins, Anderson, McNally, Heukers, Bobkov, Peterson, Thomas, Chevigné, Smit, McCorvy, Babu and Volkman2022) (Figure 6a), suggesting that signaling through GPCRs is less straightforward than earlier anticipated, and may resemble the ‘violin model’ more than the traditional ‘domino model’.
ATP synthase
As its name suggests, ATP synthase is the molecular machine responsible for synthesizing the main cellular energy currency ATP. In order to achieve this, it requires an energy supply itself (otherwise it functions in reverse, consuming ATP). Energy is provided in the form of protons that flow from one side of the membrane to the other, with the proton gradient, maintained by the electron-transport chain. In mitochondria, ATP synthase forms dimer ribbons, which likely act as proton traps (Strauss et al., Reference Strauss, Hofhaus, Schröder and Kühlbrandt2008), enhancing the proton-motive force. The flow of protons through the membrane protein part of ATP synthase is directed through two half channels, driving the γ-subunit (Lau and Rubinstein, Reference Lau and Rubinstein2012), which rotates asymmetrically like a child playing hula hoop (Abrahams et al., Reference Abrahams, Leslie, Lutter and Walker1994; Kato-Yamada et al., Reference Kato-Yamada, Noji, Yasuda, Kinosita and Yoshida1998; Rastogi and Girvin, Reference Rastogi and Girvin1999; Stock et al., Reference Stock, Gibbons, Arechaga, Leslie and Walker2000; Stewart et al., Reference Stewart, Laming, Sobti and Stock2014) (Figure 7a). The ATP synthase heterohexameric α3β3 ring represents the hoop (itself associated with one or several stalks) and cycles through alternating conformations during this process (O = open, L = loose, and T = tight), forcing ADP and phosphate to react and generate ATP (Figure 7b). This allosteric mechanism is referred to as ‘binding-change mechanism’ and functions through alternating sites cooperativity (Hackney et al., Reference Hackney, Rosen and Boyer1979; Boyer, Reference Boyer1993). The main credit for elucidating this intricate molecular mechanism goes to Boyer and Walker, who were awarded the Nobel prize in 1997 (Boyer, Reference Boyer1997; Walker, Reference Walker1998). More recently, this asymmetric mechanism has been beautifully visualized by single-molecule FRET over the millisecond timescale, both for ATP synthesis and hydrolysis (Diez et al., Reference Diez, Zimmermann, Börsch, König, Schweinberger, Steigmiller, Reuter, Felekyan, Kudryavtsev, Seidel and Gräber2004) (Figure 7c; for a description of the method, see section ‘FRET’). Nature itself has provided hundreds of exogenous allosteric regulators, which provide an exciting starting point for novel therapeutics (e.g., Cofas-Vargas et al., Reference Cofas-Vargas, Mendoza-Espinosa, Avila-Barrientos, Prada-Gracia, Riveros-Rosas and García-Hernández2022).
Allostery of ATP synthase. (a) Schematic representation of the mitochondrial ATP synthase, with subunits marked. The proton flow through the membrane subunits provides the mechanical force to rotate the γ subunit (green) in hula-hoop-like fashion, which promotes allosteric changes in the three αβ units (colored orange, α, and deep violet, β), driving ATP synthesis. (b) For every rotation of γ, each αβ unit cycles through open (O), loose (L), and tight (T) conformations, catalyzing the condensation of ADP and phosphate to ATP. This mechanism is referred to as ‘binding-change mechanism’ (Boyer, Reference Boyer1993). (c) Side and top views of ATP synthase structure (PDB ID: 8F39 (Sharma et al., Reference Sharma, Luo, Patel, Mueller and Liao2024)). FRET fluorescent probes on the rotor (green) and stator (red) were used to visualize the rotary motion (Diez et al., Reference Diez, Zimmermann, Börsch, König, Schweinberger, Steigmiller, Reuter, Felekyan, Kudryavtsev, Seidel and Gräber2004; right panel reproduced from Diez et al., Reference Diez, Zimmermann, Börsch, König, Schweinberger, Steigmiller, Reuter, Felekyan, Kudryavtsev, Seidel and Gräber2004, Figure 2a with permission). As highlighted in the middle, the direction of rotation is opposite for ATP synthesis (counterclockwise, looking at ATP synthase from the top) and hydrolysis (clockwise).

Chaperonin
Cells are crowded with proteins and other molecules, making it challenging for proteins to fold. Chaperones and heat-shock proteins come to their rescue. They work like chambers or clamps and provide a suitable environment for protein folding. The best-characterized chaperone is the chaperonin GroEL/GroES from E. coli, which is an example of the chamber-like chaperones (Xu et al., Reference Xu, Horwich and Sigler1997) present in all kingdoms (Figure 8). It is composed of two types of subunits, GroEL and GroES (where L stands for large and S for small), both of which form heptameric rings. The large subunits form two heptameric cages, which are arranged back to back and have an opening at either end. Most of the time, one of these openings is capped by a heptameric GroES lid. It is in this closed chamber (the so-called cis ring) that a polypeptide has a chance to fold; in fact, GroEL/GroES has been caught in the act of encapsulating a folding protein (Chen et al., Reference Chen, Madan, Weaver, Lin, Schröder, Chiu and Rye2008; Clare et al., Reference Clare, Bakkes, van Heerikhuizen, van der Vies and Saibil2009), providing a vivid image of ‘Anfinsen’s cage’ (Anfinsen, Reference Anfinsen1973; Ellis, Reference Ellis1994).
Allosteric transition in the GroEL–GroES chaperone. The scheme in the top panel shows the GroEL chaperonin double ring cycling between its tense (T, dark violet) and relaxed (R, orange) states, while folding a client protein (magenta). The process is driven by adenosine triphosphate (ATP) hydrolysis, serving as a timer for alternate cycling between cis ring (R state, where folding occurs) and trans ring (empty T state). The space enclosed by the GroEL ring in its R state and a GroES chaperonin cap (called ‘Anfinsen’s cage’ after Christian Anfinsen) serves as “safe space” for folding. The bottom panel shows the conformational transition of the GroEL ring from its tense (PDB ID: 4HEL (Meena and Saxena, Reference Meena and Saxena2016), deep violet) to its relaxed state (PDB ID: 8BL2 (Torino et al., Reference Torino, Dhurandhar, Stroobants, Claessens and Efremov2023), orange) upon ATP binding (cyan).

In this cage, the polypeptide enjoys a secluded environment and can fold undisturbed, without risking aggregation through exposed hydrophobic patches. The chaperonin also actively participates in protein folding (Lin and Rye, Reference Lin and Rye2004; Horwich and Fenton, Reference Horwich and Fenton2009; Hayer-Hartl et al., Reference Hayer-Hartl, Bracher and Hartl2016): a large ATP-driven conformational change not only increases the size of the cavity, but additionally switches the properties of the cage walls from hydrophobic to hydrophilic. In this way, the polypeptide, which may get stuck to the cage wall, is pulled apart and given a new chance to fold. The folding trajectory itself is the same inside the chaperone as in solution (Horst et al., Reference Horst, Fenton, Englander, Wüthrich and Horwich2007).
The time in the cage is not random. It is timed by ATP hydrolysis, and coordinated between cis and trans rings in an interesting example of ‘nested’ allostery, with positive allostery (characterized by a sigmoid curve) within each ring, and negative allostery between cis and trans rings (Yifrach and Horovitz, Reference Yifrach and Horovitz1995; Dyachenko et al., Reference Dyachenko, Gruber, Shimon, Horovitz and Sharon2013; Saibil et al., Reference Saibil, Fenton, Clare and Horwich2013; Gruber and Horovitz, Reference Gruber and Horovitz2016). This antagonistic behavior between the two rings is driven by α-helix pistons at the inter-ring interface (Lorimer et al., Reference Lorimer, Fei and Ye2018). Signaling networks and dynamic allosteric transitions in GroEL have been described in a review by Thirumalai and Hyeon (Reference Thirumalai and Hyeon2018).
The overall molecular mechanism of the GroEL/GroES chaperonin was already reported in Horwich and Sigler’s insightful publication in 1997 (Xu et al., Reference Xu, Horwich and Sigler1997). Another important structural paper was published in 2013, where the GroEL–ADP complex structure was resolved in the R state to 2.7 Å resolution (Fei et al., Reference Fei, Yang, LaRonde-LeBlanc and Lorimer2013). Unexpectedly, it revealed that the apical domains, which bind the peptide substrate, do not obey the strict sevenfold symmetry; in fact, their arrangement is strikingly asymmetric. This flexibility may allow GroEL to bind to different substrates. Recently, it was found that the two rings transiently separate between cycles, and either reattach or assemble with a new partner (Yan et al., Reference Yan, Shi, Bracher, Miličić, Singh, Hartl and Hayer-Hartl2018). Ring separation was found to enable an efficient flux of folding polypeptides through the chaperonin system and convert the negative allosteric coupling of GroEL rings into a functionally efficient reaction cycle (Yan et al., Reference Yan, Shi, Bracher, Miličić, Singh, Hartl and Hayer-Hartl2018) – overcoming ‘Levinthal’s paradox’ (that most proteins fold quickly and reliably despite the astronomically high number of alternative conformations) (Levinthal, Reference Levinthal1969).
Interesting cases at the “extremes”
Monomeric allostery
In their classic article introducing the MWC model of allostery, also known as symmetry model, Monod et al. Reference Monod, Wyman and Changeux1965 stated as point 1 of the general properties of allosteric systems that “Most allosteric proteins are polymers, or rather oligomers, involving several identical units”. This opened for monomeric allostery from the very beginning. In this review, two cases have already been mentioned, regarding myoglobin (Frauenfelder et al., Reference Frauenfelder, McMahon, Austin, Chu and Groves2001) and glucokinase (Larion et al., Reference Larion, Salinas, Bruschweiler-Li, Miller and Brüschweiler2012). Glucokinase is special among kinases, since its kinetics shows cooperative behavior for homotropic effects. However, many other kinases also function as monomers and are subject to heterotropic allosteric regulation. Myoglobin is generally known as a non-allosteric protein, functioning as an oxygen storage protein; however, it also interacts with a variety of small molecules, for example, NO and CO (Antonini and Brunori, Reference Antonini, Brunori, Neuberger and Tatum1971). There is evidence that myoglobin functions as a miniature chemical reactor, subject to allosteric regulation, and the protein is likely to have various other physiological functions than oxygen storage, including protection against oxidative damage (Galaris et al., Reference Galaris, Cadenas and Hochstein1989; Frauenfelder et al., Reference Frauenfelder, McMahon, Austin, Chu and Groves2001).
Another intriguing example of monomeric allostery is serum albumin (Ascenzi and Fasano, Reference Ascenzi and Fasano2010), which is the most abundant protein in mammalian plasma and serves as a carrier and depot for steroids, fatty acids, and thyroid hormones. Serum albumin also binds heme and many other molecules, including drugs, which can bind to many different places in its structure (affecting pharmacokinetics). In fact, serum albumin has an extraordinary ligand binding capacity (Fasano et al., Reference Fasano, Curry, Terreno, Galliano, Fanali, Narciso, Notari and Ascenzi2005). It also exhibits (pseudo-)enzymatic activity (Yang et al., Reference Yang, Bian, Zhu, Zhao, Huang and Huang2007; Ascenzi and Gianni, Reference Ascenzi and Gianni2013) and plays a key role in NO homeostasis and detoxification of reactive oxygen species (Fasano et al., Reference Fasano, Fanali, Fesce, Ascenzi, Bolognesi, Prisc and Verde2008; Fanali et al., Reference Fanali, di Masi, Trezza, Marino, Fasano and Ascenzi2012), similar to myoglobin (Frauenfelder et al., Reference Frauenfelder, McMahon, Austin, Chu and Groves2001). Serum albumin is a monomeric protein with three domains that interact with each other, forming a heart-shaped structure (He and Carter, Reference He and Carter1992). Heme binding and reactivity have been shown to be allosterically modulated by different serine albumin ligands, and vice versa (reviewed by Fasano et al., Reference Fasano, Fanali, Fesce, Ascenzi, Bolognesi, Prisc and Verde2008; Ascenzi and Fasano, Reference Ascenzi and Fasano2010). Transient heme binding to this non-classical heme protein can thus modulate the pharmacokinetics of administered drugs, for example, the blood-thinner warfarin, which can lead to severe or even fatal outcomes.
Given that latent allostery and allosteric potential has been observed in proteins without a strong allosteric profile (Coyle et al., Reference Coyle, Flores and Lim2013; Hadzipasic et al., Reference Hadzipasic, Wilson, Nguyen, Kern, Kim, Pitsawong, Villali, Zheng and Kern2020; Pillai et al., Reference Pillai, Chandler, Liu, Signore, Cortez-Romero, Benesch, Laganowsky, Storz, Hochberg and Thornton2020), as evident from resurrection studies discussed in the sections ‘Classical example: hemoglobin’ and ‘Other well-known examples’, the possibility has to be considered that also many other monomeric proteins are subject to allosteric regulation, if only weakly.
Inter-enzyme allostery
Allostery is common to many multimeric proteins and enzymes, and very important for the regulation of metabolic pathways, for example, in the form of feedback inhibition or feedforward activation, as originally proposed by Novick and Szilard (Reference Novick, Szilard and Boell1954) and first observed by Umbarger (Reference Umbarger1956). Less well known is that allosteric regulation can even involve independent enzymes. Such a system has recently been discovered in the shikimate pathway (Blackmore et al., Reference Blackmore, Nazmi, Hutton, Webby, Baker, Jameson and Parker2015; Munack et al., Reference Munack, Roderer, Ökvist, Kamarauskaitė, Sasso, van Eerde, Kast and Krengel2016), which links carbohydrate metabolism to the synthesis of important aromatic compounds in bacteria, fungi, and plants. The first enzyme of this pathway is 3-deoxy-d-arabino-heptulosonate-7-phosphate (DAHP) synthase. This enzyme forms a complex with chorismate mutase (CM), a key branch point enzyme toward the synthesis of phenylalanine and tyrosine, and away from tryptophan (Sasso et al., Reference Sasso, Ökvist, Roderer, Gamper, Codoni, Krengel and Kast2009). CMs of some bacteria, for example, in Mycobacterium tuberculosis, have sub-optimal catalytic activity, but can be boosted to normal levels by their DAHP synthase partners (Sasso et al., Reference Sasso, Ökvist, Roderer, Gamper, Codoni, Krengel and Kast2009; Burschowsky et al., Reference Burschowsky, Thorbjørnsrud, Heim, Fahrig-Kamarauskaitė, Würth-Roderer, Kast and Krengel2018). This involves the formation of a heterooctameric enzyme complex, where the DAHP synthase homotetramer is decorated by two CM dimers (Figure 9a). CM activity is subsequently switched off by enzyme release from the complex, preventing a waste of energy. Regulation of CM activity is even more intricate: Intriguingly, DAHP synthase was found to serve as a platform for feedback regulation of both enzymes (Blackmore et al., Reference Blackmore, Nazmi, Hutton, Webby, Baker, Jameson and Parker2015; Munack et al., Reference Munack, Roderer, Ökvist, Kamarauskaitė, Sasso, van Eerde, Kast and Krengel2016; Burschowsky et al., Reference Burschowsky, Thorbjørnsrud, Heim, Fahrig-Kamarauskaitė, Würth-Roderer, Kast and Krengel2018) – despite the fact that the allosteric regulators bind approximately 30 Å from the enzyme interface. Apart from very small realignments of subunits (<5°), no major structural changes were found, suggesting that this regulatory principle may be driven by dynamics (Munack et al., Reference Munack, Roderer, Ökvist, Kamarauskaitė, Sasso, van Eerde, Kast and Krengel2016). This is not the only time that this classic allosteric protein has surprised us (Sapienza et al., Reference Sapienza, Bonin, Jinasena, Li, Dieckhaus, Popov, Aubé and Lee2023).
Fringe examples of allosteric regulation. (a) ‘Inter-enzyme allosteric’ regulation of chorismate mutase (CM) from M. tuberculosis (Munack et al., Reference Munack, Roderer, Ökvist, Kamarauskaitė, Sasso, van Eerde, Kast and Krengel2016). CM is only active when in complex with DAHP synthase. Upon binding of the allosteric feedback inhibitors Tyr and Phe to the partner enzyme, CM is released from the complex and rendered inactive. Intriguingly, the feedback inhibitors bind far from the CM–DAHP synthase interface, and induce hardly any conformational changes (Munack et al., Reference Munack, Roderer, Ökvist, Kamarauskaitė, Sasso, van Eerde, Kast and Krengel2016). (b) Adenovirus early region 1A (E1A) is an intrinsically disordered oncoprotein. Upon binding to the host regulators CREB binding protein (CBP) and retinoblastoma protein (pRb), E1A becomes structured and elicits responses through the host proteins (Ferreon et al., Reference Ferreon, Ferreon, Wright and Deniz2013).

Low-activity CMs also provided a golden opportunity to probe if their activity could be increased through directed evolution. Indeed, this was possible and the achieved k cat/K m even twice exceeded those of high-activity CMs (Fahrig-Kamarauskaitė et al., Reference Fahrig-Kamarauskaitė, Würth-Roderer, Thorbjørnsrud, Mailand, Krengel and Kast2020). The fact that the evolutionary trajectories reached a plateau at the level of the best natural CMs furthermore exposed the natural limits of CM catalysis.
Allostery of intrinsically disordered proteins
It is estimated that more than 30% of all eukaryotic proteins are fully or to a large extent disordered (Ward et al., Reference Ward, Sodhi, McGuffin, Buxton and Jones2004; Uversky and Dunker, Reference Uversky and Dunker2010). It may therefore seem surprising that such proteins can be functional and fold up upon ligand binding, but this is exactly what many IDPs do (Wright and Dyson, Reference Wright and Dyson1999; Chouard, Reference Chouard2011). None of the classical models of allostery, neither the symmetry model nor sequential adaptation, could explain such an effect, suggesting that other mechanisms must be at play. One extreme example of an IDP is the tumor suppressor p53, which is frequently implicated in human cancer and serves as an extraordinarily well-connected hub in multiple signaling networks (Oldfield et al., Reference Oldfield, Meng, Yang, Yang, Uversky and Dunker2008). Another hub protein, adenovirus early region 1A (E1A) oncoprotein, was the target of the compelling allostery investigation by the Wright and Deniz labs (Ferreon et al., Reference Ferreon, Ferreon, Wright and Deniz2013; Hilser, Reference Hilser2013) (Figure 9b). Intriguingly, complexes with two different interaction partners, a transcriptional co-activator (CBP) and the retinoblastoma protein (pRb), led to the structuring of different segments of E1A, as determined by ensemble fluorescence spectroscopy and single-molecule FRET. Moreover, the binding of both proteins to E1A was positively cooperative, each increasing the probability that the other component binds. Remarkably, a truncated version of the E1A hub protein was found to switch cooperativity from positive to negative coupling (Ferreon et al., Reference Ferreon, Ferreon, Wright and Deniz2013).
The same transcriptional co-activator, CREB binding protein (CBP), was the target of another interesting investigation of IDP allosteric regulation, also by the Wright lab (Berlow et al., Reference Berlow, Dyson and Wright2017; Chong and Forman-Kay, Reference Chong and Forman-Kay2017): CBP is known to bind the α-subunit of hypoxia-inducible factor 1 (HIF-1), the transcriptional master regulator of cellular response to hypoxia (Dames et al., Reference Dames, Martinez-Yamout, de Guzman, Dyson and Wright2002; Freedman et al., Reference Freedman, Sun, Poy, Kung, Livingston, Wagner and Eck2002). Another effector of CBP is the protein CITED2, a negative feedback regulator of HIF-1, which binds to the same region on CBP as HIF-1α, as revealed by NMR spectroscopy (Berlow et al., Reference Berlow, Dyson and Wright2017). Both binding partners of CBP are intrinsically disordered when unbound. Counterintuitively, binding of CITED2 increases binding affinity for HIF-1α in a concentration-dependent manner, despite binding to the same site. The authors could show that positive cooperativity involves a transient ternary complex of all three proteins. Apparently, CITED2 gets a foothold on CBP, on a partial overlapping sequence, and then squeezes HIF-1α out of the binding site, thereby rapidly and efficiently attenuating the hypoxic response.
Dynamics, entropy, and ensemble nature of allostery
The fact that not all allosteric proteins exhibit changes of conformation, and that IDPs can also be subject to allosteric regulation, as described in several examples in the sections ‘Other well-known examples’ and ‘Interesting cases at the “extremes”’, challenges the classical models of allostery.
It has long been suspected that allostery can occur without conformational change (Cooper and Dryden, Reference Cooper and Dryden1984) (Figure 10a). The first experimental evidence of such a system was provided by the Kalodimos lab in 2006, for the transcription factor CAP (catabolite activator protein) (Popovych et al., Reference Popovych, Sun, Ebright and Kalodimos2006). CAP is a homodimeric DNA-binding protein, which binds cAMP with negative cooperativity: binding of cAMP to one subunit decreases the probability of cAMP binding to the second subunit of CAP. This occurs without conformational change, as verified by NMR spectroscopy (Popovych et al., Reference Popovych, Sun, Ebright and Kalodimos2006). Instead, the dynamics of the system was modulated, with the first molecule of cAMP partially enhancing protein motions and the second molecule completely quenching the dynamics. By isothermal titration calorimetry (ITC), it was shown that the observed negative cooperativity was entirely driven by an unfavorable change in entropy, despite the enthalpic contribution favoring positive cooperativity (Popovych et al., Reference Popovych, Sun, Ebright and Kalodimos2006; Tzeng and Kalodimos, Reference Tzeng and Kalodimos2009, Reference Tzeng and Kalodimos2012).
Modern models of allostery. (a) Allostery without conformational change can occur due to a difference in dynamics between apo and holoproteins. The most stable conformation does not change upon ligand binding, but the energetic landscape around it does. (b) The ensemble model of allostery understands protein conformations as a complex thermodynamic landscape that is altered upon ligand binding, illustrating the process in Figure 9b. Figure adapted from Hilser (Reference Hilser2013).

A more recent example, from the Pai lab, on fluoroacetate dehydrogenase (FAcD), shows how such allosteric communication may be achieved (Mehrabi et al., Reference Mehrabi, Schulz, Dsouza, Müller-Werkmeister, Tellkamp, Miller and Pai2019). FAcD is a homodimeric enzyme and exhibits half-of-the sites reactivity. Time-resolved serial crystallography revealed breathing motions in the enzyme, which correlated with catalytic snapshots of structural states, from substrate binding and the formation of a covalent intermediate, to placement of a hydrolytic water molecule and product release (Mehrabi et al., Reference Mehrabi, Schulz, Dsouza, Müller-Werkmeister, Tellkamp, Miller and Pai2019). These conformational changes of the protein framework were correlated with the binding and release of surplus water molecules (Kim et al., Reference Kim, Mehrabi, Ren, Sljoka, Ing, Bezgninov, Ye, Pomès, Prosser and Pai2017; Mehrabi et al., Reference Mehrabi, Schulz, Dsouza, Müller-Werkmeister, Tellkamp, Miller and Pai2019), reminiscent of the case of hemoglobin (Colombo et al., Reference Colombo, Rau and Parsegian1992).
The allosteric regulation of IDPs is at the opposite end of the spectrum compared to allosteric systems not displaying a conformational change. However, also here, the conceptual challenge was to leave the traditional structure-centered view of allostery. The first discussion of allostery in terms of conformational transitions and ‘energy landscapes’ was in 1999 by the Nussinov lab (Tsai et al., Reference Tsai, Ma and Nussinov1999). An interesting early example was myoglobin (Frauenfelder et al., Reference Frauenfelder, McMahon, Austin, Chu and Groves2001). This paved the way to the ensemble model of allostery (Boehr et al., Reference Boehr, Nussinov and Wright2009; Hilser, Reference Hilser2013; Motlagh et al., Reference Motlagh, Wrabl, Li and Hilser2014; Wei et al., Reference Wei, Xi, Nussinov and Ma2016), which is now broadly accepted (additionally to structure-based factors, dynamics and kinetics) (Henzler-Wildman and Kern, Reference Henzler-Wildman and Kern2007). The ensemble model describes allostery in terms of conformational selection (Ma et al., Reference Ma, Kumar, Tsai and Nussinov1999; Boehr et al., Reference Boehr, Nussinov and Wright2009), that is, that ligand binding changes the thermodynamics of the system and with it the equilibrium (Figure 10b). This makes the requirement for conformational change, induced or not, obsolete. Thus, the classical allostery models can be understood as special cases of ensemble-based allostery.
It can be argued that the ensemble-based allostery model has an emphasis on thermodynamics and overlooks the role of kinetics. In contrast to thermodynamics, kinetics relates to the energy barriers between the states and to the energies and timescales required to overcome them. Not much is known about the kinetics in allosteric systems and it is possible that for some (if not many) processes, the rate-limiting steps are not governed by the absolute energies of special states, but by the ability of allosteric systems to reach them. This will be an interesting line of investigation for the future.
Methods to probe allostery
A plethora of methods are used to probe allostery. Many of these have been mentioned along with examples of allosteric regulation above. Below, we describe several of these methods, and their strengths and weaknesses, in somewhat more detail.
X-ray crystallography
The first protein structures were solved by X-ray crystallography (Kendrew, Reference Kendrew1959): for the first time, protein structures could be directly visualized, including important cofactors and ligands. To date, 85% of all macromolecular structures have been solved by this method, which has the highest precision of all structural biology methods. As the name suggests, X-ray crystallography relies on the formation of protein crystals and their ability to diffract X-rays (Figure 11a), as a basis to generate electron density maps (good textbooks are, e.g., Blow, Reference Blow2002; Rupp, Reference Rupp2009). This method yields the average structures of molecules constrained in a crystal lattice and is useful to the study of allostery when large conformational changes can be stabilized, for example, by the presence of an allosteric effector. Important examples are the initial allostery studies of hemoglobin (Baldwin and Chothia, Reference Baldwin and Chothia1979), described in the section ‘Classical example: hemoglobin’ of this review.
Experimental methods to study allostery. (a) X-ray diffraction relies on the ability of macromolecular crystals to diffract X-rays. After ‘phasing’ of the X-ray data (indicated by dashed arrow), the electron density is calculated, into which the model is built. Shown here: oxygen binding site of myoglobin (1 Å resolution; PDB ID: 1A6M (Vojtěchovský et al., Reference Vojtěchovský, Chu, Berendzen, Sweet and Schlichting1999)). One of the main strengths of this method is its high precision. For allostery studies, crystallography is invaluable for the detailed study of ligands in protein pockets. (b) Time-resolved crystallography is a powerful tool to study dynamic processes occurring at timescales up to femtoseconds. Here: migration of carbon monoxide (CO) and subsequent structural relaxation of myoglobin (Figure adapted from Schotte et al., Reference Schotte, Soman, Olson, Wulff and Anfinrud2004). Recently, serial crystallography (using a series of micro- or nanocrystals) has evolved as powerful alternative for time-resolved studies. (c) Cryo-EM data processing and algorithms are increasingly efficient at separating conformational subpopulations in a sample and characterizing dynamic processes. A simplified example for the intrinsic motions described for the soluble angiotensin I-converting enzyme is shown (Lubbe et al., Reference Lubbe, Sewell, Woodward and Sturrock2022). (d) NMR spectroscopy is particularly useful to study conformational selection mechanisms underlying allostery. Here: example of Lac repressor (see section ‘Lac repressor’), where the individual spectral peaks for the ligand-bound conformations can be observed and compared to the peaks in the absence of ligands (Romanuka et al., Reference Romanuka, Folkers, Gnida, Kovačič, Wienk, Kaptein and Boelens2023). (e) Hydrogen-deuterium exchange mass spectrometry (HDX-MS) examines the exchange of labile hydrogens for deuterium over time and can thus reveal where in a protein a ligand binds. The exchange rate can be used as a proxy for dynamics since it is correlated with solvent exposure. (f) Förster resonance energy transfer (FRET) allows the study of binding events or conformational changes using two fluorescent probes: if the two sites are sufficiently close (but only then), they can transfer energy between them and transmit a read-out signal.

In most cases, X-ray crystallography provides only static snapshots of the structures in action. Recently, however, the traditional view of X-ray crystallography as a static enterprise has been shifting. Already in the 1980s and 1990s, Laue diffraction from protein crystals (using polychromatic X-rays) enabled time-resolved studies after triggering of conformational changes by a jump in pH or by flashing ‘caged’ compounds with laser light (Moffat et al., Reference Moffat, Szebenyi and Bilderback1984). Higher-quality X-ray data sets were obtained by trapping reaction intermediates and collecting data with monochromatic techniques (Johnson, Reference Johnson1992; Hajdu and Andersson, Reference Hajdu and Andersson1993; Hajdu et al., Reference Hajdu, Neutze, Sjögren, Edman, Szöke, Wilmouth and Wilmot2000). In addition, information on dynamic processes and non-equilibrium states in proteins can be obtained from the characterization of alternative and low occupancy conformational states (Keedy, Reference Keedy2019) and from crystallographic B-factors (also referred to ‘temperature factor’ or ‘Debye–Waller factor’); however, characterizing dynamics and relating this information to specific functional outcomes is not trivial.
Since 2009, with the availability of the extremely intense beams produced by X-ray free-electron lasers (XFELs) and their femtosecond pulses, the era of serial femtosecond crystallography (SFX) has begun (Neutze et al., Reference Neutze, Wouts, van der Spoel and Weckert2000; Johansson et al., Reference Johansson, Arnlund, White, Gergely, DePonte, Weierstall, Doak, Shoeman, Lomb, Malmerberg, Davidsson, Nass, Liang, Andreasson, Aquila, Bajt, Barthelmess, Barty, Bogan, Bostedt, Bozek, Caleman, Coffee, Coppola, Ekeberg, Epp, Erk, Fleckenstein, Foucar, Graafsma, Gumprecht, Hajdu, Hampton, Hartmann, Hartmann, Hauser, Hirsemann, Holl, Hunter, Kassemeyer, Kimmel, Kirian, Maia, Marchesini, Martin, Reich, Rolles, Rudek, Rudenko, Schlichting, Schulz, Seibert, Sierra, Soltau, Starodub, Stellato, Stern, Strüder, Timneanu, Ullrich, Wahlgren, Wang, Weidenspointner, Wunderer, Fromme, Chapman, Spence and Neutze2012; Schlichting and Miao, Reference Schlichting and Miao2012), enabling molecular movies. In serial crystallography, a segmented flow of microdroplets containing microcrystals is exposed to the X-ray pulses. Currently, access to XFEL technology is still limited by the number of available X-ray sources. Promisingly, however, the developments and insights obtained from XFELs and serial crystallography have supported the parallel development of time-resolved X-ray diffraction studies in the much more available synchrotron X-ray sources. Although these limit the timescales that can be studied to nano- and microseconds, this is not a critical limit to most allostery studies, since most changes relevant for allostery such as binding and catalysis occur at such timescales (Henzler-Wildman and Kern, Reference Henzler-Wildman and Kern2007).
One example of time-resolved serial crystallography has been discussed in the section ‘Dynamics, entropy, and ensemble nature of allostery’ (Mehrabi et al., Reference Mehrabi, Schulz, Dsouza, Müller-Werkmeister, Tellkamp, Miller and Pai2019). Two other very exciting studies concern the pico-second time-resolved CO-migration analysis in myoglobin (Schotte et al., Reference Schotte, Soman, Olson, Wulff and Anfinrud2004) (Figure 11b) and time-resolved studies of a cooperative dimeric hemoglobin (Knapp et al., Reference Knapp, Pahl, Šrajer and Royer2006). Another alternative to study allosteric mechanisms crystallographically is through multi-temperature crystallography (Keedy et al., Reference Keedy, Hill, Biel, Kang, Rettenmaier, Brandaõ-Neto, Pearce, von Delft, Wells and Fraser2018; Keedy, Reference Keedy2019). Most importantly, however, due to the high precision of X-ray crystal structures, this technique excels at identifying and characterizing the binding of allosteric ligands and fragments (reviewed in the section ‘Allostery and drug discovery’).
Cryo-EM
In many aspects, cryo-EM provides very similar information to X-ray crystallography, except that it additionally reveals information about charges. Traditionally, EM provided only low-resolution information; however, with the advent of more sensitive detectors (and other technological developments), this has changed (Kühlbrandt, Reference Kühlbrandt2014; Tan and Carragher, Reference Tan and Carragher2020). Today, the resolution of cryo-EM structures is often on par with X-ray crystallography, especially for large complexes. For this reason, and because this technique does not depend on crystals and requires only small amounts of sample, cryo-EM has quickly become one of the most important techniques for structural biology.
Cryo-EM relies on the freezing of macromolecules in vitreous ice, ideally imaging natively solvated molecules using a powerful electron microscope (reviewed by Nogales and Scheres, Reference Nogales and Scheres2015; Nogales, Reference Nogales2018). Like X-ray crystallography, this technique visualizes averages of many individual, aligned particles; however, since cryo-EM is not limited by a crystal lattice, the whole conformational space is accessible. Information about dynamics can often be obtained directly, from the quality of the density (in EM based on Coulomb potentials) in different regions of a cryo-EM reconstruction. In addition, cryo-EM excels at separating conformational subpopulations of sufficient abundance in the sample (Figure 11c). New improvements in data processing algorithms, often involving machine learning (ML) approaches (Punjani and Fleet, Reference Punjani and Fleet2023; Jamali et al., Reference Jamali, Käll, Zhang, Brown, Kimanius and Scheres2024; Song et al., Reference Song, Bao, Feng, Huang, Zhang, Gao and Han2024), are pushing the limits on the intrinsic dynamics that can be observed in cryo-EM reconstructions. No two single protein particles have the exact same conformation, and the separation into smaller and smaller subpopulations yield cryo-EM models of increasing detail that reveal intrinsic, dynamic molecular processes. Since cryo-EM is a rapidly developing field, further advances are expected in the near future that will enable improved characterization of protein dynamics and the underlying biological processes, including allostery.
Time-resolved cryo-EM (Amann et al., Reference Amann, Keihsler, Bodrug, Brown and Haselbach2023) provides another valuable tool to understand macromolecular dynamics for processes that can be triggered simultaneously for a whole population of molecules. Many different approaches have been tested for freezing cryo-EM samples at desired time points. These range from manual freezing, allowing the study of processes occurring within seconds or more, to automatically controlled thawing and refreezing within milliseconds. The field, however, still lacks standardized and commercially available solutions that make the different proof of concept methods available to the broader scientific community.
Systems benefiting most from cryo-EM methodology are large molecular complexes and membrane proteins, which are difficult to crystallize. It is therefore of no surprise that GPCRs (Zhang et al., Reference Zhang, Mobbs, May, Glukhova and Thal2023), but also ATCase, RTKs, ATP synthase, chaperonin, and many other proteins are highly amenable to this technique, as described in the section ‘Other well-known examples’. A beautiful example of time-resolved cryo-EM concerns the allosteric regulation of the human proteosome (Zhang et al., Reference Zhang, Zou, Yin, Zhao, Finley, Wu and Mao2022).
NMR spectroscopy
NMR spectroscopy is a powerful tool to study biomolecular structures and dynamics, including transient conformations, and is thus a prime method to study allostery. A range of reviews have been dedicated to the topic (Tzeng and Kalodimos, Reference Tzeng and Kalodimos2011; Manley and Loria, Reference Manley and Loria2012; Boulton and Melacini, Reference Boulton and Melacini2016; Grutsch et al., Reference Grutsch, Brüschweiler and Tollinger2016; Lisi and Loria, Reference Lisi and Loria2016; Gampp et al., Reference Gampp, Kadavath and Riek2024). NMR spectroscopy is most commonly used to characterize the structures of molecules in solution at physiological temperatures. It relies on the reorientation of atomic nuclei with a spin different from 0 (preferably with a spin of ½) in a strong magnetic field, giving resonance frequencies that are dependent on the characteristic electronic environment of each nucleus. NMR-active nuclei include 1H, 15N, and 13C. The main limitation of the technique is the size of amenable targets: since large molecules exhibit slower tumbling rates in solution, this leads to peak broadening and overlap, and, ultimately, the loss of signal. Development of procedures for site-specific isotope labeling (Tugarinov et al., Reference Tugarinov, Kanelis and Kay2006) as well as special pulse sequences (Pervushin et al., Reference Pervushin, Riek, Wider and Wüthrich1997; Xu and Matthews, Reference Xu, Matthews, Heise and Matthews2013) have enabled the application of NMR spectroscopy to larger biomolecules; however, these are specialized techniques performed in expert labs.
The simplest NMR experiment to study allostery is chemical shift perturbation upon titration of an allosteric ligand, while more sophisticated structure determination can provide crucial information in 3D space. Importantly, structure determination with NMR spectroscopy yields an ensemble of states that can be described with high precision with the exact nuclear Overhauser enhancer method (Vögeli et al., Reference Vögeli, Kazemi, Güntert and Riek2012). Recent developments allow the establishment of unbiased structural correlations between different states (Ashkinadze et al., Reference Ashkinadze, Klukowski, Kadavath, Güntert and Riek2022a), providing an exhaustive description of protein dynamics. Recently, these techniques were used to characterize the dynamic nature of allostery in a PDZ domain (Ashkinadze et al., Reference Ashkinadze, Kadavath, Pokharna, Chi, Friedmann, Strotz, Kumari, Minges, Cadalbert, Königl, Güntert, Vögeli and Riek2022b).
In addition to 3D-structural information, NMR spectroscopy provides residue-specific information about the dynamics and thermodynamics. Particularly useful to the study of allostery are relaxation-dispersion experiments, which can characterize the exchange to lowly populated excited states occurring in the microsecond to millisecond timescale (Farber and Mittermaier, Reference Farber and Mittermaier2015). Other techniques allow the study of both the exchange at slower timescales and the faster dynamic processes occurring in the picosecond to nanosecond scale. For a thorough review of NMR methods to study allostery and dynamics at different timescales, we recommend Grutsch et al., Reference Grutsch, Brüschweiler and Tollinger2016 or Lisi and Loria, Reference Lisi and Loria2016.
NMR spectroscopy is particularly well suited to decide if conformational selection is sufficient to explain allostery (Figure 11d) – as for the Lac repressor (Romanuka et al., Reference Romanuka, Folkers, Gnida, Kovačič, Wienk, Kaptein and Boelens2023), ubiquitin (Lange et al., Reference Lange, Lakomek, Farès, Schröder, Walter, Becker, Meiler, Grubmüller, Griesinger and de Groot2008), and the recruitment of β-arrestins by GPCRs (Kleist et al., Reference Kleist, Jenjak, Sente, Laskowski, Szpakowska, Calkins, Anderson, McNally, Heukers, Bobkov, Peterson, Thomas, Chevigné, Smit, McCorvy, Babu and Volkman2022) – or if the mechanism is more complicated, as for protein kinases, the protagonists of the ‘violin model’ (Kornev and Taylor, Reference Kornev and Taylor2015). NMR spectroscopy is also essential to the study of IDPs (see, e.g., Berlow et al., Reference Berlow, Dyson and Wright2017) and for the experimental characterization of molecular dynamics (MD), as for the CAP protein (Popovych et al., Reference Popovych, Sun, Ebright and Kalodimos2006), which are two other important examples in this review (see sections Other well-known examples’, ‘Interesting cases at the “extremes”’, and ‘Dynamics, entropy, and ensemble nature of allostery’).
HDX mass spectrometry
Hydrogen-deuterium exchange mass spectrometry (HDX-MS) is a powerful biophysical technique that is used to study ligand binding and other dynamic biomolecular processes (Masson et al., Reference Masson, Burke, Ahn, Anand, Borchers, Brier, Bou-Assaf, Engen, Englander, Faber, Garlish, Griffin, Gross, Guttman, Hamuro, Heck, Houde, Iacob, Jørgensen, Kaltashov, Klinman, Konermann, Man, Mayne, Pascal, Reichmann, Skehel, Snijder, Strutzenberg, Underbakke, Wagner, Wales, Walters, Weis, Wilson, Wintrode, Zhang, Zheng, Schriemer and Rand2019). HDX-MS involves the dilution of a protein in a D2O-based buffer, followed by monitoring of the exchange of labile hydrogen atoms (usually amide hydrogens) for deuterium. The exchange kinetics are directly dependent on solvent accessibility, influenced by dynamics and conformational changes upon perturbation, such as those caused by the binding of allosteric ligands (Figure 11e). The technique is limited to the study of processes occurring within seconds to hours. HDX-MS is often used in addition to other biophysical and structure determination techniques, as a complementary method. It works well for large biomolecular complexes and can also provide information about regions too dynamic to be studied with NMR spectroscopy (Peacock and Komives, Reference Peacock and Komives2021). More details and examples of its application can be found in recent reviews (Masson et al., Reference Masson, Burke, Ahn, Anand, Borchers, Brier, Bou-Assaf, Engen, Englander, Faber, Garlish, Griffin, Gross, Guttman, Hamuro, Heck, Houde, Iacob, Jørgensen, Kaltashov, Klinman, Konermann, Man, Mayne, Pascal, Reichmann, Skehel, Snijder, Strutzenberg, Underbakke, Wagner, Wales, Walters, Weis, Wilson, Wintrode, Zhang, Zheng, Schriemer and Rand2019; Hodge et al., Reference Hodge, Benhaim and Lee2020).
Interestingly, other footprinting methods for probing solvent exposure can also be used. These include, for example, photochemical oxidation, which allows the study of much faster processes occurring in the microsecond time scale (Johnson et al., Reference Johnson, di Stefano and Jones2019).
FRET
FRET is a technique that depends on the communication of two fluorescent probes that are introduced either in two potential partner molecules or in distant places within a single molecule (Algar et al., Reference Algar, Hildebrandt, Vogel and Medintz2019) (Figure 11f). If the two probes are sufficiently close, energy is transferred between them, and a signal can be read out. Since the efficiency of this energy transfer is inversely proportional to the sixth power of the distance between the chromophores, the method is very sensitive. Therefore, the technique can give very valuable information, despite its low resolution. Some examples from this review, where FRET was used, are the binding-change mechanism of ATP synthase (Diez et al., Reference Diez, Zimmermann, Börsch, König, Schweinberger, Steigmiller, Reuter, Felekyan, Kudryavtsev, Seidel and Gräber2004; Figure 7c) and biased signaling by GPCRs (Sadler et al., Reference Sadler, Ma, Ritt, Sharma, Vaidehi and Sivaramakrishnan2023) (both in the section ‘Other well-known examples’) as well as the study of the intrinsically disordered oncoprotein E1A (Ferreon et al., Reference Ferreon, Ferreon, Wright and Deniz2013) (section ‘Interesting cases at the “extremes”’). On a similar topic, a variation of the technique was used, bioluminescence resonance energy transfer (Galés et al., Reference Galés, Rebois, Hogue, Trieu, Breit, Hébert and Bouvier2005), for in-depth pharmacological profiling of a large library of GPCR mutants (Heydenreich et al., Reference Heydenreich, Marti-Solano, Sandhu, Kobilka, Bouvier and Babu2023). This systematic study revealed an elaborate signaling network in GPCRs – much more extensive than previously anticipated – that represents a treasure trove for drug development.
Other biophysical techniques
Other structural biology techniques that can be useful to obtain information about biomolecular structure and interactions include small-angle scattering of X-rays (SAXS) (Brosey and Tainer, Reference Brosey and Tainer2019) or neutrons (SANS) (Mahieu and Gabel, Reference Mahieu and Gabel2018). Both techniques provide low-resolution information of biomolecules in solution, with no upper limit for their size. As such, information from SAXS can, for example, be combined with NMR spectroscopy to characterize conformational ensembles (Venditti et al., Reference Venditti, Egner and Clore2016), and SANS allows contrast matching studies, where individual partners can be visualized in a biomolecular complex (Krueger, Reference Krueger2022).
Structural biology methods are, however, time- and resource-consuming techniques, and also simpler biophysical techniques can provide crucial information on ligand binding kinetics, thermodynamics, and stoichiometry. Different techniques exploit distinct properties of biomolecules and provide complementary information. These include ITC (Bastos et al., Reference Bastos, Abian, Johnson, Ferreira-da-Silva, Vega, Jimenez-Alesanco, Ortega-Alarcon and Velazquez-Campoy2023), biolayer interferometry (Sultana and Lee, Reference Sultana and Lee2015), surface plasmon resonance (Nguyen et al., Reference Nguyen, Park, Kang and Kim2015), microscale thermophoresis (El Deeb et al., Reference El Deeb, Al-Harrasi, Khan, Al-Broumi, Al-Thani, Alomairi, Elumalai, Sayed and Ibrahim2022), and differential scanning fluorimetry (Scott et al., Reference Scott, Spry, Abell, Erlanson and Jahnke2016) as well as various spectroscopic techniques (electron paramagnetic resonance) (Galazzo and Bordignon, Reference Galazzo and Bordignon2023), Raman (Kuhar et al., Reference Kuhar, Sil and Umapathy2021), Fourier-transform and 2D infrared spectroscopy (Tumbic et al., Reference Tumbic, Hossan and Thielges2021)), and other fluorescence-based techniques (Martino and Ferrone, Reference Martino and Ferrone1989). Cooperativity between binding sites can be studied through dose/response curves and the calculation of Hill coefficients (where a Hill coefficient of 1 indicates independent binding, a value greater than 1 positive cooperativity, and a value below 1 negative cooperativity) (Hill, Reference Hill1910; Prinz, Reference Prinz2010). This analysis, however, provides no information on the nature of the binding – allosteric or orthosteric – which requires additional, complementary studies.
For enzymes, a detailed kinetic analysis is invaluable for the characterization of the molecular mechanism.
Deep mutational scanning, directed evolution, “resurrection” of evolutionary origins, and allosteric engineering
Site-directed mutagenesis is a well-known tool to test hypotheses regarding protein catalysis and binding sites. For probing allosteric mechanisms, in particular, two mutagenesis-based methods are useful: deep mutational scanning (Fowler and Fields, Reference Fowler and Fields2014; Faure et al., Reference Faure, Domingo, Schmiedel, Hidalgo-Carcedo, Diss and Lehner2022) and directed evolution (Zeymer and Hilvert, Reference Zeymer and Hilvert2018; Yang et al., Reference Yang, Wu and Arnold2019). The latter method can also be used for protein design (Jäckel et al., Reference Jäckel, Kast and Hilvert2008), with a beautiful example of allosterically switchable protein assemblies published recently by 2024 Nobel prize winner David Baker (Pillai et al., Reference Pillai, Idris, Philomin, Weidle, Skotheim, Leung, Broerman, Demakis, Borst, Praetorius and Baker2024).
In deep mutational scanning, the amino acid residues of a protein are substituted systematically one by one, usually by replacement with alanine (or glycine if the native residue is alanine). Interpretation of the results is a complex task (Carlson and Fenton, Reference Carlson and Fenton2016) and can be further complicated by compensatory effects and structural changes induced by the mutations. The large volume of data makes the application of computational approaches (Kalescky et al., Reference Kalescky, Liu and Tao2015, Reference Kalescky, Zhou, Liu and Tao2016), particularly deep learning approaches, highly valuable (Verkhivker et al., Reference Verkhivker, Alshahrani, Gupta, Xiao and Tao2023). Exciting recent examples are the mapping of allosteric landscapes of a GTPase switch (Mathy et al., Reference Mathy, Mishra, Flynn, Perica, Mavor, Bolon and Kortemme2023) and pharmacological profiling of a GPCR (Heydenreich et al., Reference Heydenreich, Marti-Solano, Sandhu, Kobilka, Bouvier and Babu2023), the latter described in the section ‘Allostery and drug discovery’.
Directed evolution mimics natural selection, where the selective pressure is applied by the researchers in various smart ways. This method was independently developed by the Arnold and Hilvert groups (Kast et al., Reference Kast, Asif-Ullah, Jiang and Hilvert1996; Moore and Arnold, Reference Moore and Arnold1996), although Hilvert appears to have been forgotten for the 2018 Nobel prize. Interesting results have been obtained for tryptophan synthase (Buller et al., Reference Buller, Brinkmann-Chen, Romney, Herger, Murciano-Calles and Arnold2015, Reference Buller, van Roye, Cahn, Scheele, Herger and Arnold2018), where directed evolution mimicked allosteric activation by stepwise tuning the conformational ensemble. In another example related to amino acid synthesis, directed evolution was applied by the Kast lab to the CM of M. tuberculosis, which requires activation by a partner enzyme (DAHP synthase) for full activity (Sasso et al., Reference Sasso, Ökvist, Roderer, Gamper, Codoni, Krengel and Kast2009) (see section ‘Inter-enzyme allostery’). After four cycles of directed evolution, the catalytic efficiency of the enzyme was boosted 250-fold, to a stand-alone enzyme rivaling naturally top-performing CMs (Fahrig-Kamarauskaitė et al., Reference Fahrig-Kamarauskaitė, Würth-Roderer, Thorbjørnsrud, Mailand, Krengel and Kast2020).
Instead of applying directed or systematic mutagenesis, allosteric mechanisms can also be mapped by comparing evolutionary-related proteins from genome sequencing data, and exploring their ancient origins, as pioneered by Pauling and Zuckerkandl (Reference Pauling and Zuckerkandl1963). Interesting examples of such studies concern the PDZ domain (Lockless and Ranganathan, Reference Lockless and Ranganathan1999), protein kinases (Coyle et al., Reference Coyle, Flores and Lim2013; Hadzipasic et al., Reference Hadzipasic, Wilson, Nguyen, Kern, Kim, Pitsawong, Villali, Zheng and Kern2020), GPCRs (Süel et al., Reference Süel, Lockless, Wall and Ranganathan2003), and hemoglobin (Süel et al., Reference Süel, Lockless, Wall and Ranganathan2003; Pillai et al., Reference Pillai, Chandler, Liu, Signore, Cortez-Romero, Benesch, Laganowsky, Storz, Hochberg and Thornton2020). Similarly, the origin of protein interactions and allostery in colocalization has been investigated, in an elegant study by Kuriyan and Eisenberg (Reference Kuriyan and Eisenberg2007). It is also possible to engineer allosteric regulation, as exemplified by metabolic engineering by the Parker group (Cross et al., Reference Cross, Allison, Dobson, Jameson and Parker2013). A general strategy for engineering allosteric regulation was published by the Reynolds lab (Pincus et al., Reference Pincus, Resnekov and Reynolds2017).
MD simulations, other computational methods, and AI
Computational methods have become powerful and popular tools for the study of protein allostery (for recent reviews, see Schueler-Furman and Wodak, Reference Schueler-Furman and Wodak2016; Greener and Sternberg, Reference Greener and Sternberg2018; Ni et al., Reference Ni, Chai, Wang, Li, Yu, Liu, Lu and Zhang2022a, Reference Ni, Liu, Kong, Yu, Lu and Zhang2022b; Colombo, Reference Colombo2023). Many different approaches exploiting different principles have been developed. These range from simple topology-based methods and normal mode analysis (NMA) to more complex MD simulations coupled to a plethora of algorithms and pipelines for the analysis of their results. Artificial intelligence (AI)-based methods and algorithms have also gained popularity in recent years and hold great promise for the near future (Xiao et al., Reference Xiao, Verkhivker and Tao2023).
Topology-based models approximate protein structure as a network of nodes and edges. The nodes represent structural elements of the protein such as residues, while the edges are weighted based on the strength of interactions, allowing the study of perturbations and their propagation (Amor et al., Reference Amor, Schaub, Yaliraki and Barahona2016). Although simple, this approach has been validated on several important allosteric targets (Amor et al., Reference Amor, Schaub, Yaliraki and Barahona2016). For a review on emerging graphical representations of allostery, see Arantes et al., Reference Arantes, Patel and Palermo2022. NMA-based approaches for studying allostery provide detailed characterization of protein low-frequency normal modes at a reasonable computational cost. This is often achieved by using simple elastic or Gaussian network models. For example, NMA-based methods uncovered a novel allosteric site on matrix metalloproteinase-12, for which a highly specific allosteric inhibitor could be designed (Udi et al., Reference Udi, Fragai, Grossman, Mitternacht, Arad-Yellin, Calderone, Melikian, Toccafondi, Berezovsky, Luchinat and Sagi2013). NMA has also been successfully applied to map allosteric communication in large systems like the GroEL-GroES complex (Zheng et al., Reference Zheng, Brooks and Thirumalai2007).
MD simulations aim to fully characterize molecular trajectories over a time scale up to milliseconds. MD is computationally expensive, and different approaches have been developed to overcome the limitations of insufficient sampling through accelerated MD, replica-exchange MD, steered MD, or the use of coarse-grained models (Lazim et al., Reference Lazim, Suh and Choi2020). MD simulations are limited by the quality of the initial experimental models as well as the approximations intrinsic to the force fields used to govern interactions in the simulation, which are always an approximation of the underlying quantum mechanics principles (Lazim et al., Reference Lazim, Suh and Choi2020). Combining the results of MD with experimental data is a good way to mitigate these limitations. Both equilibrium and non-equilibrium processes can be studies with MD, and many different perturbations can be introduced in the system to study specific dynamic processes.
Crucially, a well-set-up MD simulation potentially reveals conformational couplings between distal regions, which are key to allosteric regulation. In practice, however, it can be difficult to filter these signals among the noisy dynamics inherent to MD. The analysis of correlated motions in the simulation is the most common analysis performed to extract information from MD trajectories, but many other strategies and variations can be used (Schueler-Furman and Wodak, Reference Schueler-Furman and Wodak2016; Ni et al., Reference Ni, Chai, Wang, Li, Yu, Liu, Lu and Zhang2022a), including AI-based methods (Tsuchiya et al., Reference Tsuchiya, Taneishi and Yonezawa2019; Do et al., Reference Do, Wang, Bhattarai and Miao2022). A graph theory approach can be used to evaluate dynamic networks created by MD trajectory analysis. Clustering residues in communities with high intercorrelation, representing functional and structural regions of a protein, it is possible to evaluate how some areas couple and decouple, inferring the propagation of the allosteric signal (Arantes et al., Reference Arantes, Patel and Palermo2022; Gheeraert et al., Reference Gheeraert, Lesieur, Batista, Vuillon and Rivalta2023). In addition, strategies for identifying allosteric binding sites have been developed based on the highly correlated motions occurring in the orthosteric and allosteric sites (Xu et al., Reference Xu, Wang, Hu, Gao, Ma, Zhang, Shen, Chen, Lai and Pei2018; Chen et al., Reference Chen, Zhang, Peng, Wang, Xu, Chen, Shi and Zhu2019).
While a theory allowing accurate de novo prediction of allosteric sites is still out of reach, ML methods offer a viable alternative. Several research groups have developed computational frameworks aimed at predicting allosteric sites in proteins. Available tools have been reviewed by Nerín-Fonz and Cournia (Reference Nerín-Fonz and Cournia2024) in a recent issue of Current Opinion in Structural Biology. Computational strategies to elucidate allosteric communication relevant for drug design were reviewed by Ni et al. (Reference Ni, Liu, Kong, Yu, Lu and Zhang2022b). The most common type of ML methods is based on supervised classifiers, which are trained on a starting set of reference data. In this case, the classification algorithms are trained on databases collecting allosteric information (e.g., the Allosteric Database (ASD) (He et al., Reference He, Liu, Zhu, Zha, Li, Zhao, Wei, Li, Wu, Wang, Jiao, Ning, Zhou, Hong, Liu, He, Chen, Li, He, Wu, Lu, Song, Lu and Zhang2024); accessible online at http://mdl.shsmu.edu.cn/ASD). As the structural properties of a protein are encoded in its primary sequence, the recent advances in AI, including large language models (LLMs), have been successfully applied to proteins (e.g., AlphaFold (Jumper et al., Reference Jumper, Evans, Pritzel, Green, Figurnov, Ronneberger, Tunyasuvunakool, Bates, Žídek, Potapenko, Bridgland, Meyer, Kohl, Ballard, Cowie, Romera-Paredes, Nikolov, Jain, Adler, Back, Petersen, Reiman, Clancy, Zielinski, Steinegger, Pacholska, Berghammer, Bodenstein, Silver, Vinyals, Senior, Kavukcuoglu, Kohli and Hassabis2021; Abramson et al., Reference Abramson, Adler, Dunger, Evans, Green, Pritzel, Ronneberger, Willmore, Ballard, Bambrick, Bodenstein, Evans, Hung, O’Neill, Reiman, Tunyasuvunakool, Wu, Žemgulytė, Arvaniti, Beattie, Bertolli, Bridgland, Cherepanov, Congreve, Cowen-Rivers, Cowie, Figurnov, Fuchs, Gladman, Jain, Khan, Low, Perlin, Potapenko, Savy, Singh, Stecula, Thillaisundaram, Tong, Yakneen, Zhong, Zielinski, Žídek, Bapst, Kohli, Jaderberg, Hassabis and Jumper2024; Lyu et al., Reference Lyu, Kapolka, Gumpper, Alon, Wang, Jain, Barros-Álvarez, Sakamoto, Kim, DiBerto, Kim, Glenn, Tummino, Huang, Irwin, Tarkhanova, Moroz, Skiniotis, Kruse, Shoichet and Roth2024), RoseTTaFold (Baek et al., Reference Baek, DiMaio, Anishchenko, Dauparas, Ovchinnikov, Lee, Wang, Cong, Kinch, Schaeffer, Millán, Park, Adams, Glassman, DeGiovanni, Pereira, Rodrigues, van Dijk, Ebrecht, Opperman, Sagmeister, Buhlheller, Pavkov-Keller, Rathinaswamy, Dalwadi, Yip, Burke, Garcia, Grishin, Adams, Read and Baker2021; Krishna et al., Reference Krishna, Wang, Ahern, Sturmfels, Venkatesh, Kalvet, Lee, Morey-Burrows, Anishchenko, Humphreys, McHugh, Vafeados, Li, Sutherland, Hitchcock, Hunter, Kang, Brackenbrough, Bera, Baek, DiMaio and Baker2024), and ESMFold (Lin et al., Reference Lin, Akin, Rao, Hie, Zhu, Lu, Smetanin, Verkuil, Kabeli, Shmueli, dos Santos Costa, Fazel-Zarandi, Sercu, Candido and Rives2023)). These algorithms can successfully be exploited to generate information relevant to allostery (Fang et al., Reference Fang, Jiang, Wei, Ma, Ren, Yuan and Wei2023; Jing et al., Reference Jing, Berger and Jaakkola2023; Vani et al., Reference Vani, Aranganathan, Wang and Tiwary2023).
Allostery and drug discovery
Dysregulation of protein allostery leads to pathology (Nussinov and Tsai, Reference Nussinov and Tsai2013). While drug discovery traditionally targets orthosteric sites, the idea of employing allosteric effectors as drug molecules, either to rescue a malfunctioning protein (Foster et al., Reference Foster, Coffey, Morin and Rastinejad1999; Liu and Nussinov, Reference Liu and Nussinov2008) or to modulate/inhibit the activity of a selected target, is as old as the concept of allostery itself (DeDecker, Reference DeDecker2000; Nussinov and Tsai, Reference Nussinov and Tsai2013; Tee and Berezovsky, Reference Tee and Berezovsky2024). Like traditional drug discovery, allosteric drug design strategies often depend on structure-based analysis methods (structure-based drug design, referred to as SBDD) (Śledź and Caflisch, Reference Śledź and Caflisch2018), with allosteric effectors having the advantage of targeting evolutionarily less-conserved sites, leading to increased specificity and decreased side effects (Chatzigoulas and Cournia, Reference Chatzigoulas and Cournia2021). This is especially relevant for drugs that affect several different cellular pathways, like GPCRs (Figure 12) (Smith and Milligan, Reference Smith and Milligan2010; Kenakin and Christopoulos, Reference Kenakin and Christopoulos2013; Wang et al., Reference Wang, Yu, Xiao, Lu and Zhang2021; Filizola and Javitch, Reference Filizola and Javitch2023; Heydenreich et al., Reference Heydenreich, Marti-Solano, Sandhu, Kobilka, Bouvier and Babu2023) – for this reason, GPCR-targeting drugs such as beta-blockers commonly have considerable side effects. Most importantly, however, the use of allosteric drugs expands the ‘targetome’, overcoming the “undruggability” of orthosteric sites. One such “undruggable” target is the ras oncogene (Weng et al., Reference Weng, Faure, Escobedo and Lehner2024), which is mutated in approximately 25% of human cancers (Karnoub and Weinberg, Reference Karnoub and Weinberg2008). Recently, an allosteric pan-K-ras inhibitor has been developed that shows broad therapeutic potential (Kim et al., Reference Kim, Herdeis, Rudolph, Zhao, Böttcher, Vides, Ayala-Santos, Pourfarjam, Cuevas-Navarro, Xue, Mantoulidis, Bröker, Wunberg, Schaaf, Popow, Wolkerstorfer, Kropatsch, Qu, de Stanchina, Sang, Li, McConnell, Kraut and Lito2023) – in this context, it is interesting to note that both activating mutations and treatment may modulate signaling pathway and strength (Nussinov et al., Reference Nussinov, Zhang, Maloney, Liu, Tsai and Jang2022b). Another key advantage of allosteric drugs is that they can help overcome drug resistance (Ni et al., Reference Ni, Li, Qiu, Pu, Lu and Zhang2020).
Allostery-based drug design. G-protein-coupled receptors are archetypal allosteric drug targets, as exemplified by ADRB2, shown on the left (and in Figure 6). The panel shows ADRB2 in its R state in surface representation (PDB ID: 3P0G (Rasmussen et al., Reference Rasmussen, Choi, Fung, Pardon, Casarosa, Chae, DeVree, Rosenbaum, Thian, Kobilka, Schnapp, Konetzki, Sunahara, Gellman, Pautsch, Steyaert, Weis and Kobilka2011b)), with agonist BI-167107 (cyan) bound to its orthosteric site (‘O’) and Gα (green) bound to the effector site (‘E’, superimposed using PDB ID: 3SN6 (Rasmussen et al., Reference Rasmussen, Choi, Fung, Pardon, Casarosa, Chae, DeVree, Rosenbaum, Thian, Kobilka, Schnapp, Konetzki, Sunahara, Gellman, Pautsch, Steyaert, Weis and Kobilka2011b)). The allosteric binding sites (‘A1’ and ‘A2’) for a positive (compound-6FA, blue; PDB ID: 6N48 (Liu et al., Reference Liu, Masoudi, Kahsai, Huang, Pani, Staus, Shim, Hirata, Simhal, Lefkowitz and Kobilka2019)) and negative allosteric inhibitor (AS408, red; PDB ID: 6OBA (Liu et al., Reference Liu, Kaindl, Korczynska, Stößel, Dengler, Stanek, Hübner, Clark, Mahoney, Matt, Xu, Hirata, Shoichet, Sunahara, Kobilka and Gmeiner2020)) were mapped onto the ADRB2 surface. The scheme on the right summarizes interactions among orthosteric, effector, and allosteric sites.

Tailgating the increased understanding of allostery, drug discovery employing allosteric effectors and modulators is maturing into a promising research field (DeDecker, Reference DeDecker2000; Nussinov and Tsai, Reference Nussinov and Tsai2013; Lu et al., Reference Lu, Li and Zhang2014; Tan et al., Reference Tan, Tee and Berezovsky2022;Tee and Berezovsky, Reference Tee and Berezovsky2024). The ASD (https://mdl.shsmu.edu.cn/ASD/m) now counts 538 allosteric drugs, with status ranging from pre-clinical to approved (He et al., Reference He, Liu, Zhu, Zha, Li, Zhao, Wei, Li, Wu, Wang, Jiao, Ning, Zhou, Hong, Liu, He, Chen, Li, He, Wu, Lu, Song, Lu and Zhang2024) (July 2024); between 2018 and 2022, 24 out of 188 drugs approved by the Food and Drug Administration were allosteric effectors (Nerín-Fonz and Cournia, Reference Nerín-Fonz and Cournia2024). Given that the first purposely designed allosteric drug was approved only in 2004, this is a rather impressive development.
Traditional drug development, targeting orthosteric sites, often starts with the screening of derivatives of the primary endogenous effector in search of an effective inhibitor (Bofill et al., Reference Bofill, Jalencas, Oprea and Mestres2019). Alternative starting points are provided by high-throughput screening or fragment-based screening, which may also yield allosteric effectors or modulators (Erlanson et al., Reference Erlanson, Fesik, Hubbard, Jahnke and Jhoti2016; Gong et al., Reference Gong, Hu, Li, Liu, Wang, Zhang, Xiong, Li, Xu, Ma, Chen and Li2017). However, given that allosteric ligands often bind to shallow, nonpolar binding sites (Tan et al., Reference Tan, Tee and Berezovsky2022) and have low affinities, they pose considerable challenges to drug discovery (Chatzigoulas and Cournia, Reference Chatzigoulas and Cournia2021). Several allosteric effectors fit the profile of ‘beyond the Rule of Five’ (Doak et al., Reference Doak, Giordanetto and Kihlberg2014; Lipinski, Reference Lipinski2016; Doak and Kihlberg, Reference Doak and Kihlberg2017) (bRo5) molecules, an extension of the Lipinski’s ‘rule of five’ (Lipinski et al., Reference Lipinski, Lombardo, Dominy and Feeney1997) (Ro5), a set of requirements on drug absorption and permeability. Relaxing the Ro5 criteria to include macromolecules and biologics, such as macrocycles and other larger compounds, dramatically expanded the toolbox available for allosteric drug discovery (Doak et al., Reference Doak, Giordanetto and Kihlberg2014). Moreover, allosteric ligands often work best in concert with traditional drugs and depend on combinatorial optimization (Ni et al., Reference Ni, Li, Qiu, Pu, Lu and Zhang2020). Important examples of such combinatorial treatment strategies concern oxygen uptake by hemoglobin targeting cancer, cardiovascular diseases, and sickle cell disease (Duarte et al., Reference Duarte, Greferath, Nicolau and Lehn2010; Moody et al., Reference Moody, Narula and Maurer2024), the latter caused by pathogenic hemoglobin fibers.
The allosteric drug discovery workflow presents additional challenges compared to traditional drug development (Guarnera and Berezovsky, Reference Guarnera and Berezovsky2020; Fan et al., Reference Fan, Liu, Kong, Ni, Yu, Lu and Zhang2021; Pan and Mader, Reference Pan and Mader2022), including the reverse perturbation analysis of allosteric signaling (Tee et al., Reference Tee, Guarnera and Berezovsky2018; de Vries et al., Reference de Vries, Meijer, Doveston, Leijten-van de Gevel and Brunsveld2020). Additionally, the complementary effects of mutations (Guarnera and Berezovsky, Reference Guarnera and Berezovsky2020) need to be considered as well as the bias of compound libraries toward orthosteric sites, the high number of false negatives and the crosstalk among different allosteric sites in the same target (Jiao et al., Reference Jiao, Hutton, Cross, Jameson and Parker2012). The latter is both an obstacle and an opportunity, as the sites can be exploited through a combinatorial approach, designing medicines that combine the effect of two or more drugs on the same target (Kenakin and Christopoulos, Reference Kenakin and Christopoulos2013). This calls for the application of new approaches, including those involving AI (Wu et al., Reference Wu, Yaliraki and Barahona2022; Cichońska et al., Reference Cichońska, Ravikumar and Rahman2024; Lin et al., Reference Lin, Guan and Li2024; Tee and Berezovsky, Reference Tee and Berezovsky2024), as described in section ‘MD simulations, other computational methods, and AI’. Another factor that needs to be considered is the evaluation of allosteric drugs: since these compounds often have a modulatory effect and bias signaling, one pharmacological parameter – efficacy – is insufficient to judge their potency, and concentration-response curves are more meaningful (Kenakin and Christopoulos, Reference Kenakin and Christopoulos2013). This will potentiate the needed effort but likely pay substantial dividends.
Several research groups have developed allosteric drug discovery pipelines, often combining experimental and computational methods, testing them on model systems with a recognized role in disease (Wagner et al., Reference Wagner, Lee, Durrant, Malmstrom, Feher and Amaro2016). Recently, a full issue of the Journal of Molecular Biology, edited by Nussinov and Berezovsky, was entirely dedicated to allosteric drug design, covering topics from the identification of allosteric sites to the discovery or design of effectors targeting them (Berezovsky and Nussinov, Reference Berezovsky and Nussinov2022). For example, Tan et al. (Reference Tan, Tee and Berezovsky2022) reported the use of an in-house-developed structure-based statistical mechanical model of allostery to derive an allosteric fingerprint for MAP kinase 7 and the GPCR rhodopsin and, based on their results, proposed a generic protocol for the design of allosteric drugs. Another article in the collection describes innovative allosteric drugs, like molecular glues and proteolysis targeting chimera (PROTACs), which couple a target-binding module with a molecular warhead that prompts degradation (Nussinov et al., Reference Nussinov, Tsai and Jang2022a). Current Opinion in Structural Biology regularly publishes articles related to allostery, and a good overview of rationally designed allosteric modulators was recently published by Chatzigoulas and Cournia (Reference Chatzigoulas and Cournia2021). Especially impressive examples are allosteric inhibitors against two important cancer targets: an inhibitor of the epidermal growth factor (EGFR) that is 1,000-fold more selective against an EGFR mutant that showed drug resistance (Jia et al., Reference Jia, Yun, Park, Ercan, Manuia, Juarez, Xu, Rhee, Chen, Zhang, Palakurthi, Jang, Lelais, DiDonato, Bursulaya, Michellys, Epple, Marsilje, McNeill, Lu, Harris, Bender, Wong, Jänne and Eck2016) and an inhibitor that enabled dual targeting against BCR-ABL1 (Wylie et al., Reference Wylie, Schoepfer, Jahnke, Cowan-Jacob, Loo, Furet, Marzinzik, Pelle, Donovan, Zhu, Buonamici, Hassan, Lombardo, Iyer, Palmer, Berellini, Dodd, Thohan, Bitter, Branford, Ross, Hughes, Petruzzelli, Vanasse, Warmuth, Hofmann, Keen and Sellers2017).
Summary and outlook
There is increasing evidence for large-scale latent allostery in proteins, particularly from the study of protein homologs and ancestor resurrection studies, as discussed in this review for hemoglobin, protein kinases, and GPCRs (Süel et al., Reference Süel, Lockless, Wall and Ranganathan2003; Pillai et al., Reference Pillai, Chandler, Liu, Signore, Cortez-Romero, Benesch, Laganowsky, Storz, Hochberg and Thornton2020) (in sections ‘Introduction: allostery in context – historical overview’, ‘Classical example: hemoglobin’, and ‘Other well-known examples’). It is even possible that all (dynamic) proteins are allosteric (Gunasekaran et al., Reference Gunasekaran, Ma and Nussinov2004). In combination with gene duplication and co-localization, either in organelles or pseudo-organelles, such as protein micro-compartments, membrane-less organelles, or the periplasm, allosteric regulation is subjected to selective pressures, allowing strong allosteric networks to evolve (Kuriyan and Eisenberg, Reference Kuriyan and Eisenberg2007; Mathy and Kortemme, Reference Mathy and Kortemme2023). The reward for the cell and for life is a very efficient regulation system, which requires minimal input of energy to directly and rapidly respond to various environmental challenges.
Given that allostery is everywhere in biological systems, it is no surprise that allosteric drugs and modulators have enormous potential for the treatment of diseases – from cancer and other noncommunicable diseases to infectious diseases of bacterial and viral origin (section ‘Allostery and drug discovery’). The growing interest in allostery is also reflected by an enormous increase in publications on this topic, raising from approximately 10 publications annually before 2000 to >200 today. Due to the challenges in finding and characterizing allosteric binding sites and mechanisms, this field has long been lagging behind conventional drug discovery; however, with new technologies, including machine-based learning algorithms (section ‘Methods to probe allostery’), the future for allostery-based drug discovery looks bright. Already, the first mutant-selective drugs are entering the market, “undruggable” targets are being tackled, and allosteric modulators are countering drug resistance. The next frontier is the application of allosteric drugs in personalized medicine. Concerning mechanistic insights (sections ‘Interesting cases at the “extremes”’ and ‘Dynamics, entropy and ensemble nature of allostery’), we expect the next breakthroughs to be related to the kinetic characterization of allostery.
The genetic code provides the blueprint for the synthesis of proteins, and allostery the basis for protein communication and interaction. It is therefore fully deserved that allostery has been referred to as the “second secret of life” (Monod, Reference Monod1971; Fenton, Reference Fenton2008). Approaching its 60th anniversary (Monod et al., Reference Monod, Wyman and Changeux1965), allostery has not lost its appeal and is as relevant as ever.
Acknowledgements
We would like to thank Peter Kast, who is the main PI of the grant financing the salary of M.M.-C.
Author contribution
U.K. suggested the topic, conceptualized the review including the figures, and wrote most of the text. M.M.-C. and G.C. drafted the ‘Methods to probe allostery’ and the ‘Allostery and drug discovery’ sections, respectively. In addition, M.M.-C. and G.C. prepared the figures and drafted the figure legends. The manuscript was finalized by all the authors.
Financial support
The salary of M.M.-C. was funded by a grant from the Swiss National Science Foundation (Grant No. 310030M_219998).
Competing interest
The authors declare no competing interests.
Use of artificial intelligence tools
AI tools have not been used to generate text, images, or to analyze or extract insights. However, they are likely part of the literature search engines.


 Open access