


1. Introduction
Once a mainstay of land-grant universities (LGUs) and federal research laboratories, U.S. plant breeding programs underwent privatization in the latter half of the past century. Applied cultivar development programs merged with international corporations for major U.S. field crops, including maize (Zea mays L.), soybean (Glycine max (L.) Merr.), and cotton (Gossypium hirsutum L.) (USDA-AMS, 2023). This realignment was driven primarily by hybrid seed technology (for maize), genetically modified, trait-centric breeding strategies, and intellectual property (IP) rights.
One notable exception is U.S. wheat (T. aestivum L., T. turgidum ssp. durum). Wheat breeding programs continue to operate as public resources, albeit with IP protection, wherever commercial wheat production is significant to a state’s agricultural economy. Some of the larger wheat-producing states maintain two or more breeding programs that serve different subregions of the state or different market classes.
Private corporations either engage directly in U.S. wheat cultivar development or invest in it by licensing public germplasm. The latter sometimes obscures which sector performed the breeding work. As many as five private breeding programs target the southern and central Great Plains, including Kansas, Nebraska, Oklahoma, and parts of Colorado, Texas, and New Mexico. However, most wheat acres in these states remain seeded with publicly sourced and marketed genetics. For the 2025 wheat crop, the top three or more planted cultivars in Texas, Oklahoma, and Colorado, as well as two of the top four planted cultivars in Kansas, were developed and commercialized by long-standing LGU breeding programs (United States Department of Agriculture-National Agricultural Statistics Service [USDA-NASS], 2021).
The yield and economic impacts of public wheat breeding programs are largely understudied. This research estimates changes in farm wheat yields and the economic impact of an LGU wheat-breeding program. The focus is on Oklahoma State University’s (OSU) wheat breeding program and the varieties used from 2007 to 2023. The study uses publicly available data on wheat acres planted to publicly and privately produced varieties from USDA-NASS. The marginal impact of OSU varieties on Oklahoma wheat yields is first estimated. Then, economic returns are estimated as the change in wheat yield from planting acres to OSU varieties, multiplied by the marketing-year average price. We find that the University’s wheat breeding program generated $99 million in revenue (in 2023 dollars) for producers over the study period. The introduction of herbicide-tolerant varieties also stabilizes variability in wheat returns. However, the magnitude of this reduction varies geographically.
2. Background
The longevity and success of public wheat breeding can be attributed to several factors, even amid the familiar erosion of state and federal formula funding (Coe et al., Reference Coe, Evans, Gasic and Main2020). First, this non-competitive funding source was partially replaced by a form of “competitive” funding tied to royalties from seed sales, proportional to wheat farmers’ cultivar preferences. However, this funding source would not have been possible without a dramatic shift, beginning in the early 2000s, in LGUs’ mindset toward plant varieties as licensable and enforceable intellectual property, primarily based on the Plant Variety Protection (PVP) Act (U.S. Congress, 1970). In retrospect, this shift created two beneficiaries: public wheat breeding programs and a PVP-incentivized, robust seed industry that would work to the economic benefit of both public and private breeding programs.
A second factor was investments by the local stakeholder community through checkoff funds collected at the farm gate and administered by state wheat commissions. Outside the soft red winter wheat region (except Ohio and Maryland), most wheat-producing states maintain a wheat commodity board that reinvests in wheat marketing, research, and cultivar development. These boards use the resident breeding program to align with state-specific priorities, which, in turn, guide the program’s allocation of genetic resources to support those priorities, thereby fostering genetic diversity among state programs. Finally, a nationwide, decade-long network of federal research laboratories enables public and private wheat breeders to access a wide array of genetic resources (i.e., germplasm) and trait information (Widmer and Costa, Reference Widmer and Costa2021). Specific examples in the U.S. Great Plains include germplasm with enhanced and diversified disease and insect resistance, gene-specific or genome-wide DNA information, and food-functional quality analysis that ensures farmers and the broader wheat industry remain financially strong (USDA ARS undated (n.d.a); USDA ARS undated (n.d.b)).
The OSU wheat breeding program has operated continuously since the mid-1940s, initially fueled by the bequeathed “Triumph”-based germplasm developed by farmer-breeder Joseph Danne in the early 1920s (Carver, Reference Carver2009). Nationwide, the longest-standing wheat breeding programs are in the public sector, a crucial feature, as an intermittent program, or worse yet, a dormant one, degrades the nation’s competitiveness in the global wheat market. Like others in major wheat-producing states, the OSU wheat breeding program is financed through the state’s checkoff program and seed-based royalties, with personnel and infrastructure supported by state experiment station formula funding. In addition, the OSU program is directly supported by a multimillion-dollar endowment established in the late 1980s through investments in the wheat industry.
The OSU program’s technical details and breeding priorities are described in Marburger et al. (Reference Marburger, Silva, Hunger, Edwards, Van der Laan, Blakey and Kan2021). Briefly, the breeding program has centered on, but is not limited to, a selection strategy that incorporates a dual-purpose (beef cattle grazing plus grain production) management environment at key points in the 10-to 13-year breeding cycle (Thapa et al., Reference Thapa, Carver, Horn and Goad2010). This feature distinguishes the OSU breeding program as the only one in the U.S. that uses cattle and simulated grazing as an early-generation selection agent rather than merely testing finished pure lines in a grazed environment. Attributes directly and indirectly targeted by this selection method include stand establishment and canopy closure, tillering capacity, drought and cold tolerance, tolerance to barley yellow dwarf (BYD) and to aphids that transmit BYD, resistance to Hessian fly (Mayetiola destructor), strong retention of winter dormancy, and stem carbohydrate remobilization to promote grain filling. This selection strategy has operated continuously since 1997.
Approximately 200,000 to 350,000 data points are generated during the development and identification of a cultivar worthy of release. About one-third of those data points inform selection for resistance to about 12 fungal and viral diseases common to the southern U.S. Plains. While improving yield potential is an obvious breeding priority, a significant part of the breeding effort protects the yield potential accrued in previous breeding cycles. Beyond reducing reliance on crop protectants, farmers view this as a stabilizing force for wheat yields amid a changing climate, evolving pathogen populations, and weed pressure. Clearfield® wheat varieties, released in 2005, are non-GMO and bred for tolerance to imidazolinone herbicides and drought (OSU CES, 2025). The OSU Clearfield variety, Doublestop, is most relevant to this study. It was released in 2013.
The hybridization program is the engine that drives genetic gain and diversity in any plant breeding program. The OSU wheat breeding program annually produces 1,000 unique crosses, of which about one-third are not intended to produce commercial progeny from unadapted parentage. Instead, they provide the necessary genetic bridge to commercialization in a second or third breeding cycle. This bridge highlights a key balancing act routinely played out in publicly supported wheat breeding programs: ensuring long-term genetic gains through perpetual investments in genetic diversity versus the immediate gratification of short-term gains.
To what extent does this financial support and wheat breeding strategy translate into economic value, including increased revenue and decreased yield variation, for those at the front of the grain supply chain, i.e., the wheat farmer? Economic value is the preferred success metric for any plant breeding program, not necessarily the planted acreage occupied by its cultivars. We answer this question by estimating the change in yield attributable to the adoption of OSU wheat varieties and the returns to OSU’s wheat breeding program and yield variability from 2007 to 2023. Our focus is on wheat acres planted to OSU and OSU Clearfield varieties, and on changes in wheat yield that improve producer revenue and stabilize revenue variability.
2.1. Data
Wheat yields, acres planted, acres harvested, and marketing-year-average price, as reported by USDA-NASS (2024a) for Oklahoma’s nine Agricultural Statistics Districts (ASDs) and the state average for 2007 to 2023, were collected. The nine ASDs include the Panhandle, South Central, North Central, West Central, Southwest, and Northwest regions (Supplementary materials Figure 1). An “Other” ASD includes most counties in the state’s eastern portion. The primary production regions are in the western and northern parts of the state.
Percentages of wheat acres planted to various varieties are from USDA-NASS (2007 to 2023).Footnote 1 There were 100 unique varieties planted during the 17-year study period. (“Unknown” varieties were dropped from the analysis.) Fifty-nine percent of the varieties planted were from LGU breeding programs, with the remainder from private breeding companies, including Syngenta, Bayer, Trio, and Limagrain Cereal Seeds (Supplementary materials Figure 2). Varieties appeared in multiple years. After counting all instances of variety use, there were 4,212 cases. The most frequently planted varieties were OSU varieties (29 percent of 4,212). Most varieties planted (64 percent) were from LGUs.
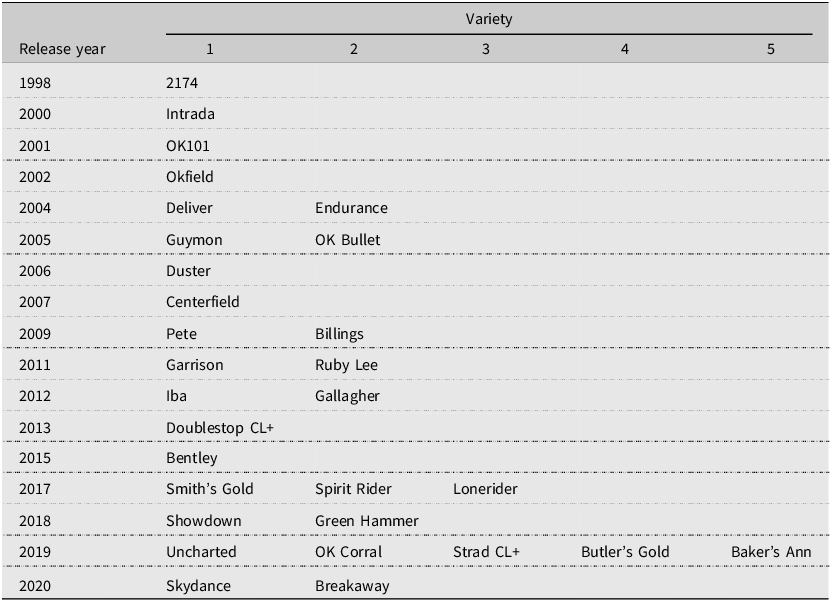
Release dates for the OSU varieties were also collected from the United States Department of Agriculture-Agricultural Marketing Service USDA-AMS, (n.d.) (Table 1). The earliest release date available for this study was 1998 (variety 2,174), and the last two varieties were released in 2020. The release dates and the percentage of acres planted were used to construct a “genetic vintage indexFootnote 2 ” (GVI), which isolates genetic progress from general time trends (Brennan, Reference Brennan1984). Its construction is discussed in the Methods and Procedures. The GVI of 2007.45 (Table 2) suggests that the ‘average’ wheat acre over the study period planted to OSU varieties was essentially a mix of mid-2000s varieties like Duster and OK Bullet, and Endurance, with enough 2009 genetics like Billings to move the index past the 2007 mark. The index stops at 2016, likely because the 2017–2020 varieties had relatively very low market share during the study period.
Oklahoma State University wheat variety release dates (Oklahoma State University Wheat Improvement Team, n.d.)1

Table 1. Long description
The table has 12 rows and 6 columns. The columns are labeled Release year and Variety 1 to Variety 5. The rows list the release years and corresponding wheat varieties released by Oklahoma State University. Row 1: Release year, 1998, 2,174. Row 2: Release year, 2000, Intrada. Row 3: Release year, 2001, OK101. Row 4: Release year, 2002, Okfield. Row 5: Release year, 2004, Deliver, Endurance. Row 6: Release year, 2005, Guymon, OK Bullet. Row 7: Release year, 2006, Duster. Row 8: Release year, 2007, Centerfield. Row 9: Release year, 2009, Pete, Billings. Row 10: Release year, 2011, Garrison, Ruby Lee. Row 11: Release year, 2012, Iba, Gallagher. Row 12: Release year, 2013, Doublestop CL+. Row 13: Release year, 2015, Bentley. Row 14: Release year, 2017, Smith’s Gold, Spirit Rider, Lonerider. Row 15: Release year, 2018, Showdown, Green Hammer. Row 16: Release year, 2019, Uncharted, OK Corral, Strad CL+, Butler’s Gold, Baker’s Ann. Row 17: Release year, 2020, Skydance, Breakaway.
Notes: Oklahoma State University heirloom varieties are excluded. These data were used to construct the genetic vintage index, which tracks variety release dates.
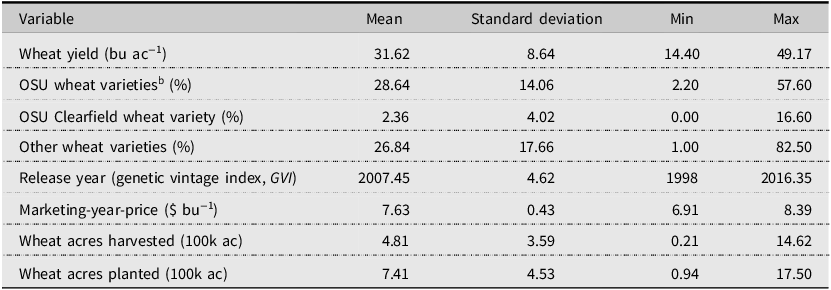
Summary statistics for Oklahoma wheat varieties a , 2007 to 2023 (n = 114)
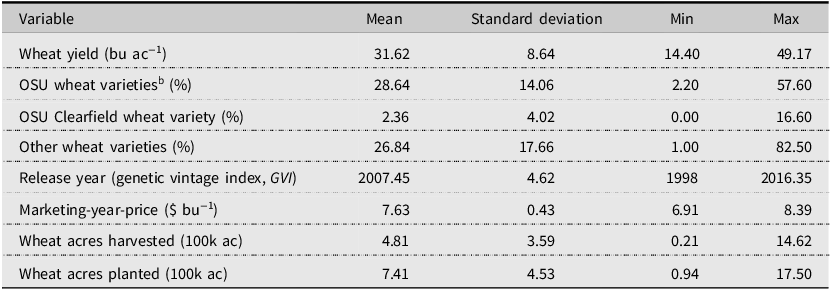
Table 2. Long description
A table summarizing statistics for Oklahoma wheat varieties from 2007 to 2023. The table has 9 rows and 5 columns. The columns are labeled Variable, Mean, Standard deviation, Min, and Max. The rows are labeled with different variables related to wheat yield, varieties, release year, marketing-year price, and wheat acres harvested and planted. Row 1: Wheat yield (bu ac-1), 31.62, 8.64, 14.40, 49.17. Row 2: OSU wheat varieties (%), 28.64, 14.06, 2.20, 57.60. Row 3: OSU Clearfield wheat variety (%), 2.36, 4.02, 0.00, 16.60. Row 4: Other wheat varieties (%), 26.84, 17.66, 1.00, 82.50. Row 5: Release year (genetic vintage index, GVI), 2007.45, 4.62, 1998, 2016.35. Row 6: Marketing-year price ($ bu-1), 7.63, 0.43, 6.91, 8.39. Row 7: Wheat acres harvested (100k ac), 4.81, 3.59, 0.21, 14.62. Row 8: Wheat acres planted (100k ac), 7.41, 4.53, 0.94, 17.50.
a Authors’ calculations based on USDA-NASS and BLS data.
b OSU varieties include OSU Clearfield wheat varieties.
USDA-NASS aggregates variety data to the ASD and state levels. OSU varieties, except OSU Clearfield (COSU) varieties, were aggregated annually to obtain the total unadjusted percentage of wheat acres planted to OSU varieties by ASD and statewide. The planted acres for each variety were calculated by multiplying the percentages reported in the NASS wheat variety files by the wheat acres in an ASD. NASS percentages for name-specified varieties do not add up to 100% because non-specified varieties are included. The non-specific varieties are identified as “unknown.” The varieties were enumerated in the survey but not voluntarily reported. Therefore, the true acreage occupied by an identified variety is underestimated. ASD wheat acres were the sum of the acres planted across counties within an ASD. We separated the Clearfield varieties from others due to their herbicide resistance and perceived broader adaptation at the time of release. We hypothesized that these varieties would reduce yield and return variability by mitigating adverse outcomes. Due to USDA-NASS confidentiality rules, Oklahoma ASDs 7, 8, and 9 were combined into a single reporting district (“others”). Aggregating the planted acres in ASDs 7–9 was necessary because data were not reported disaggregated in all years. (Aggregate yields were reported for some years and some districts.) A composite ASD was generated by calculating a weighted average yield, with harvested acres in ASDs serving as the weighting factor. The “other” ASD then has yields for all years in the dataset. Similarly, percentages were computed for OSU Clearfield varieties by location and year.
Wheat marketing-year prices (MYP) are from the USDA-Agricultural Marketing Service (USDA-NASS, 2025). Prices were benchmarked to 2023 dollars using the United States Bureau of Labor Statistics (US BLS) producer price index for hard red winter wheat (US BLS, 2025). Wheat acres planted (AP) and harvested (AH) are from USDA-NASS (2025). Wheat production data are from USDA-NASS (2025). County wheat yields were calculated as county wheat production in bushels divided by wheat acres harvested. The complete dataset contained 119 observations. After constructing the GVI (the South Central region had 5 missing years), 114 observations were available for the study. Summary statistics for the data are reported in Table 2.
Adoption of OSU varieties is shown in Figure 1. Before 2008, “Jagger,” a Kansas State University variety, dominated Oklahoma wheat acreage, accounting for over 40%. From 2008 to 2011, the share of wheat acres planted with OSU varieties rose sharply. This increase was largely driven by the release and adoption of “Duster” and “Endurance” and the decline of Jagger. In 2008, Duster was planted on only 0.3% of the state’s wheat acres, while Endurance was grown on 2.1%. By 2011, Duster and Endurance accounted for 22.2% and 16.5% of Oklahoma wheat acres, respectively. In the Western Central region, Duster was grown on more than 31% of wheat acres in 2011 and 2012. Similarly, Endurance was used on about a quarter of Panhandle and South Central acres in 2011 and 2012. Conversely, Jagger had fallen to 9.4% of Oklahoma acres by 2011.
Variety adoption for wheat.
Notes: OSU = Oklahoma State University; Clearfield is an OSU variety.

As new disease and pest pressures developed and resistant varieties were released, Jagger’s share of acres slid to just 1.6% of acres by 2012, and Duster and Endurance’s shares of acres fell rapidly after 2015. By 2023, Duster’s share was just 0.5%, Endurance was down to 2.1%, and the once dominant Jagger was last reported planted on 1.0% of Oklahoma wheat acres. As of 2023, “Green Hammer,” “Gallagher,” “Doublestop CL,” and “Smith’s Gold” varieties are the most frequently planted OSU varieties, at 5.3%, 7.3%, 8.5%, and 8.4% of Oklahoma acresFootnote 3 . OSU-planted varieties peaked in 2016, accounting for over 46% of the state’s wheat acres. In 2023, over 39% of planted acres were OSU varieties. However, the percentage of OSU variety-specified acres (in the NASS survey) has not declined at all. OSU varieties have placed in the top 10 spots of each survey since 2016.
OSU Clearfield varieties are showing a steady increase in utilization. Beginning in 2016 at 2.6% of harvest acres, their use exceeded 9% in 2023. OSU Clearfield is rapidly gaining acres, though at a slower growth rate than Duster and Endurance from 2008 to 2011. Their properties go beyond tolerance to imidazolinone herbicides. They are also more drought-tolerant than many other varieties, a trait essential in a state with endemic drought.
In the last panel of Figure 1, the orange line shows OSU variety coverage (excluding OSU Clearfield varieties), the blue line shows OSU Clearfield variety use, and the green line shows all other varieties. Other varieties have declined from over 75% of Oklahoma acres in 2007 to just over 20% in 2023. Conversely, when the two OSU lines are combined, OSU-released varieties have accounted for over 39% of planted acres since 2011. Some regions of the state, namely West Central and Southwest, typically use OSU varieties on more than 50% of harvest acres. These two regions have all but stopped using “Other” varieties.
One region with low OSU-varietal adoption is the Panhandle, which receives low rainfall. While the use of other varieties has declined since 2007, non-OSU varieties are typically on par with OSU varieties and were much higher in 2023. Varieties released by other states may have production advantages over some OSU varieties. For example, Texas A&M (TAMU) varieties originating in the breeding program located in the northern Texas panhandle were used on over 6% of Oklahoma Panhandle acres in the later years of the study. TAMU use exceeded 10% in several years. TAMU use peaked in the Panhandle in 2023 at 20.4%. For comparison, the state’s highest aggregate use of TAMU varieties peaked in 2021 at 3.7% of acres, which was obviously skewed by the Panhandle’s 18.6% utilization. The largest TAMU utilization by any other ASD was just 3% in the South Central ASD in 2016.
2.2. Methods and procedures
We identify the effects of OSU and OSU Clearfield varieties (COSU) and breeding program vintage on wheat yields by regressing yields on ASD fixed effects (ASD), the percentage of wheat acres planted with OSU, OSU Clearfield, and Other wheat varieties (SH, 0 to 100 percent), average release date (GVI). A polynomial trend is also included to account for the effects of technological changes beyond wheat varieties. We are also interested in the impacts of wheat varieties on yield and return (marketing price times yield) variability.
The standard method for calculating GVI, which tracks breeding program progress, is to use the varietal release indices of Brennan (Reference Brennan1984) and Brennan and Byerlee (Reference Brennan and Byerlee1991). The concept of “vintage effects” on technological change was originally developed by Arrow (Reference Arrow1962). Various forms of the index have been used to measure the effects of varietal improvement on agricultural productivity (Traxler et al., Reference Traxler, Falck-Zepeda, Ortiz-Monasterio, J and Sayre1995) and the economic value of rice breeding programs (Shew et al., Reference Shew, Durand, Nalley and Moldenhauer2018). In this study, we have only the area shares of district acres planted with an OSU variety and the release year of that variety. The weighted average release variable is calculated as: $GVI_{it}={\sum _{v\in {\Omega _{OSU}}}s_{v,it}\times R_{v} \over \sum _{v\in {\Omega _{OSU}}}s_{v,it}}$
where s v, it is the acreage share of OSU variety v planted in crop reporting district i, year t, and R v is the release year of variety v (Table 1). The GVI represents the embodied technology for the release year of OSU’s wheat breeding program (Shew et al., Reference Shew, Durand, Nalley and Moldenhauer2018).
We include GVI, along with acreage-variety shares and polynomial trends (as shown below), in a linear yield model. Doing so isolates the effects of breeding program innovations on wheat yields from other technological advances in fertilizers, machinery, and precision input management. We interpret GVI as the intensive effect of continuous varietal innovation (the genetic gain in bu ac−1 per year) on wheat yields, holding the market share of OSU varieties and other unobserved technological change constant. In contrast, the OSU acreage shares planted capture the extensive margin of varietal diffusion and changes in market share, holding technology change and genetic gain constant. This distinction between the intensive margin (genetic improvement) and the extensive margin (adoption) is central to interpreting the economic contribution of the breeding program. The estimated genetic gain reflects potential productivity improvements embodied in newer varieties. Realized gains depend on the extent of their diffusion across production regions.
We use a linear, multiplicative heteroskedastic model, an adaptation of Just and Pope’s (Reference Just and Pope1978, Reference Just and Pope1979) production function approach. Their method allows us to isolate the effects of wheat genetics on yield from those of new varieties on yield variance. The model is: ${yield}_{it}=\beta _{0}+{\sum }_{i=1}^{7}\delta _{i}\cdot ASD_{i}+{\sum }_{k=1}^{3}\beta _{k}\cdot SH_{ikt}+\beta _{GVI}\cdot GVI_{it}+{\rm Poly}({{\tau _{p}}\cdot t^{p}})+u_{it}$
where i indexes the ASD, t = 2007…2023, and k indexes the OSU, OSU Clearfield, and Other wheat varieties. An orthogonal restriction was used to code the ASD dummy variables. Therefore, the δ i are deviations in ASD wheat yields from the overall state average of wheat yields (β 0). These deviations proxy regional comparative advantages for wheat production. The wheat varieties are reported as percentages of wheat acres planted in an ASD or the percentages aggregated to the state level. These β k parameters are therefore the average change in wheat yield resulting from a 1-percent increase in the acres planted to OSU and other varieties, relative to the reference group. Thus, estimated effects represent relative yield differences across varietal groups, not absolute productivity levels. The coefficient on GVI measures the additional yield gain in bu ac−1 per year from using newer OSU wheat varieties.
The u
it
are independent and identically distributed stochastic errors with an expected value of zero and a multiplicative-heteroskedastic variance, ${\rm var}({yield}_{it})=\exp (\alpha _{0}+{\sum }_{k=1}^{3}\alpha _{k}\cdot SH_{ikt}+\alpha _{GVI}\cdot GVI_{it})$
. The exponential function is used because it ensures that the variance due to wheat varieties is positive (Harvey, Reference Harvey1976). If the partial derivative of var(yield
it
) with respect to a wheat variety is negative, then that variety decreases the variability of wheat yields. The converse holds if the partial derivative is positive. The yield variance is constant when the parameters are jointly zero. The percentage change in yield variability due to a wheat variety or genetic gain is 100 ⋅ [exp(α̂
k
)−1].
${\rm var}({yield}_{it})=\exp (\alpha _{0}+{\sum }_{k=1}^{3}\alpha _{k}\cdot SH_{ikt}+\alpha _{GVI}\cdot GVI_{it})$
. The exponential function is used because it ensures that the variance due to wheat varieties is positive (Harvey, Reference Harvey1976). If the partial derivative of var(yield
it
) with respect to a wheat variety is negative, then that variety decreases the variability of wheat yields. The converse holds if the partial derivative is positive. The yield variance is constant when the parameters are jointly zero. The percentage change in yield variability due to a wheat variety or genetic gain is 100 ⋅ [exp(α̂
k
)−1].
The Poly(τ p ⋅t p ) is a polynomial expansion operator. For example, a linear and a quadratic trend are included in Equation (2) if P is set to two. The polynomial trend proxies the effects of all other technological advancements on wheat yields from 2007 to 2023. A likelihood ratio (LR) test is used to select the best-fitting polynomial trend. A fourth-degree polynomial (four terms) is the unrestricted model. It nests yield models with three-, two-, and single-term trends. Rejection of the null hypothesis suggests that the unrestricted polynomial trend is favored over the restricted trend combinations.
The empirical strategy relies on within-ASD variation over time, after controlling for time-invariant regional characteristics and common technological trends. Identification, therefore, comes from changes in varietal composition and genetic vintage within each ASD over time. Because varietal adoption is not randomly assigned and may respond to time-varying agronomic or economic conditions, the identifying assumption is: $\mathbb{E}\left[u_{it}| SH_{ikt},GVI_{it},ASD_{i},{\rm Poly}({\tau _{p}}\cdot t^{p})\right]=0$
Under this condition, the estimated coefficients capture conditional associations among varietal adoption, genetic advancement, and yield outcomes at the regional level. These estimates should be interpreted not as causal treatment effects but as economically meaningful measures of the contribution of OSU varieties to changes in wheat productivity.
The wheat yield regression is estimated using maximum likelihood. Observations are weighted by wheat acres planted in each ASD and year to correct for year-to-year differences in acreage. Without weights, years with fewer acres planted or harvested would have the same influence on the results as years with more acres. Wheat acres harvested are not used as the weighting factor because the dependent variable (wheat yield) is calculated using acres harvested.
2.3. Revenue impacts
The impact of OSU and OSU Clearfield varieties on wheat producer revenue is estimated as:
 $$\eqalign{& \widehat{\Delta {revenue}}_{it}=AH_{it}\cdot MYP_{t}\cdot (MS_{it}+GG_{it}), \cr & MS_{it}={{\hat{\!\beta}} }_{OSU}\cdot SH_{OSU,it}+{\hat{\!\beta}}_{COSU}\cdot SH_{COSU,it},\cr & GG_{it}=S_{it}\cdot {\hat{\!\beta}}_{GVI} \cdot [GVI_{it}-1998],}$$
where the “^” are estimates, S it = (SH OSU, it +SH COSU, it )/100, MS is the market share effect of OSU wheat varieties (adoption/diffusion effect), GG is the genetic gain component of revenue change (innovation effect), AH is harvested acres, and MYP is the average of the marketing-year-wheat price (bu ac−1, 2023 dollars). The innovation effect, GVI, is benchmarked to 1998, which serves as a technological counterfactual. OSU’s breeding program underwent transformative changes with the introduction of varietal 2174 in 1998. This lineage led indirectly to the Endurance and Duster varieties. The per-bushel genetic gain, β̂ GVI ⋅ [GVI it −1998], measures the additional bushels produced by an OSU variety relative to the 1998 baseline. This gain must be weighted by the OSU market share, S it , as genetic gains from the breeding program only realize their value on the harvested acres planted to OSU varieties. Standard errors of these predicted values are used to calculate 95-percent confidence intervals to track year-to-year variability in wheat yields for each ASD and the state.
Similarly, the risk impact of OSU varieties is calculated as the change in the standard deviation of revenue resulting from genetic advancements, relative to the 1998 baseline. To ensure consistency with the revenue impact, this volatility change is scaled by the total OSU acreage share, S it . The predicting equation is: $\Delta Risk_{it}={S_{it}}\cdot AH_{it}\cdot MYP_{t}\cdot \left[\sqrt{\exp \left({\bf z}_{it}\hat{{\bf \alpha }}\right)}-\sqrt{\exp \left({{\bf z}}_{it}^{{\bf 0}}\hat{{\bf \alpha }}\right)}\right]$
where ΔRisk is the net contribution of the OSU wheat breeding program to revenue risk in ASD i and year t, and ${\bf z}_{it}\hat{{\bf \alpha\ }}$
is the linear predictor from the variance equation using all observed variety shares and the current genetic vintage index. The linear predictor
${\bf z}_{it}\hat{{\bf \alpha\ }}$
is the linear predictor from the variance equation using all observed variety shares and the current genetic vintage index. The linear predictor ${{\bf z}}_{it}^{{\bf 0}}\hat{{\bf \alpha\ }}$
is a counterfactual where OSU and Clearfield share coefficients set to zero, and GVI is set to the 1998 baseline. A lowess regression (Cleveland and Loader, Reference Cleveland and Loader1996) was used to fit a line to the annual changes in return volatility for the OSU and OSU Clearfield varieties.
${{\bf z}}_{it}^{{\bf 0}}\hat{{\bf \alpha\ }}$
is a counterfactual where OSU and Clearfield share coefficients set to zero, and GVI is set to the 1998 baseline. A lowess regression (Cleveland and Loader, Reference Cleveland and Loader1996) was used to fit a line to the annual changes in return volatility for the OSU and OSU Clearfield varieties.
3. Results
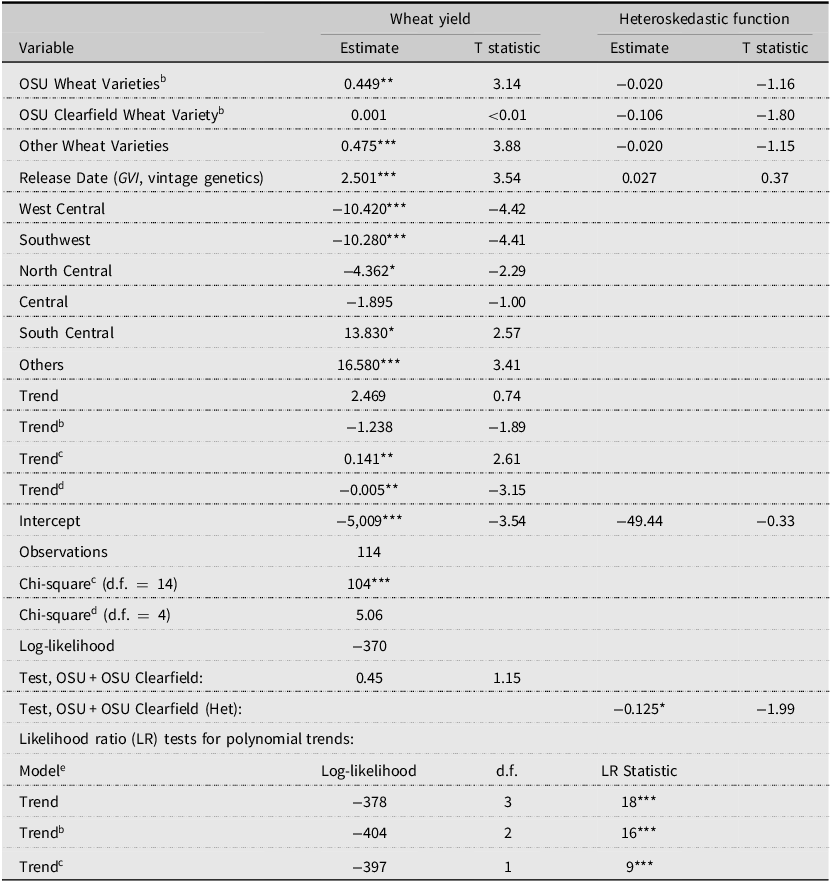
Log-likelihood tests indicated that the fourth-degree polynomial trend was the best-fitting model, with the quadratic, cubic, and quartic terms significant at p = 0.059 (Table 3). Higher-order polynomials inherently introduce structural multicollinearity, so we evaluated whether they affected the standard errors or signs of the coefficients for the main variables of interest. Initially, the Belsley et al. (Reference Belsley, Kuh and Welsch1980) collinearity diagnostic for the linear terms, including the linear trend, was 11.27, well below the threshold of 30 (Supplementary Material Table 1). The average VIF was 6.33. The VIFs for the vintage index (GVI) and the linear trend were initially 16.49 and 18.34, respectively. Expanding the model to include second-, third-, and fourth-order polynomials increased the collinearity index to 466 and the average VIF to 2,781.
Wheat yield and variety regression. a
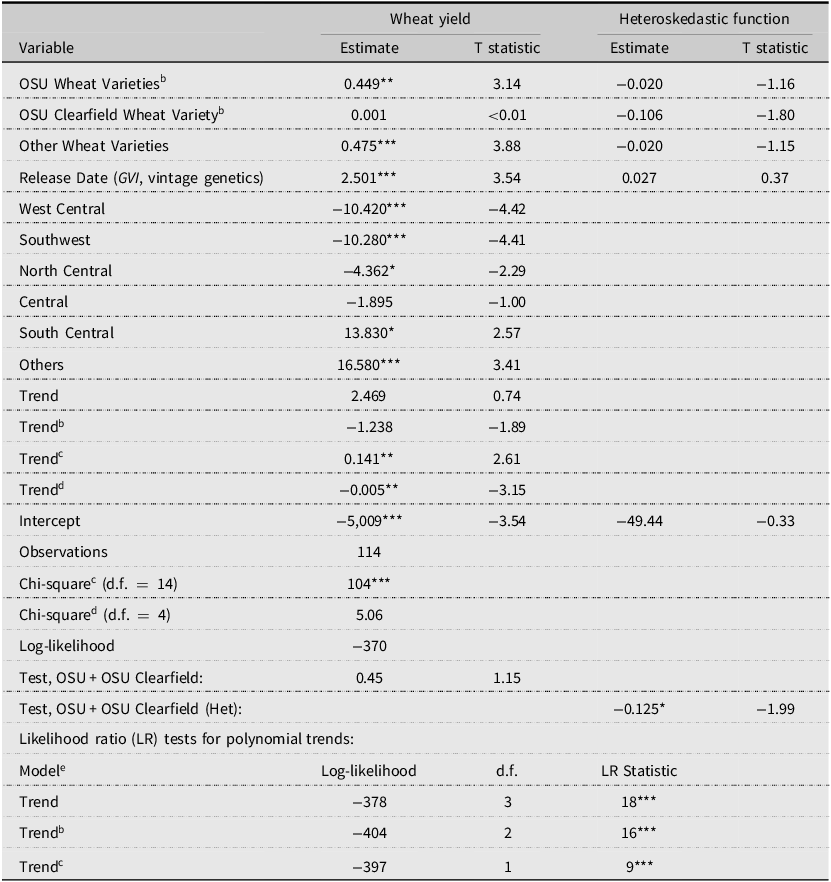
Table 3. Long description
A table with 15 rows and 6 columns comparing wheat yield and heteroskedastic function estimates. The columns are labeled Variable, Wheat yield Estimate, Wheat yield T statistic, Heteroskedastic function Estimate, and Heteroskedastic function T statistic. The table includes variables such as OSU Wheat Varieties, OSU Clearfield Wheat Variety, Other Wheat Varieties, Release Date (GVI, vintage genetics), and various regions. Each row provides estimates and T statistics for wheat yield and heteroskedastic function. Notable trends include significant estimates for OSU Wheat Varieties, Other Wheat Varieties, Release Date, and regions like West Central, Southwest, and Others. The table also includes chi-square values, log-likelihood, and likelihood ratio tests for polynomial trends.
a Standard errors are estimated with a heteroskedastic-robust covariance estimator: * p ≤ 0.05, ** p ≤ 0.01, *** p ≤ 0.001. Regression weighted by agricultural statistics district (ASD) planted wheat acres.
b The reference variety is “unknown” and the reference location is the Panhandle ASD. The ASD estimates are differences from the state average yield because the ASD dummy variables are orthogonally restricted.
c Null hypothesis: estimates jointly equal to zero for wheat yield.
d Null hypothesis: estimates jointly equal to zero for the heteroskedastic function.
e Each model is nested in the model with a fourth-degree polynomial trend. Rejection of the null supports the fourth-degree trend polynomial.
This additional inflation was confined almost entirely to the polynomial trends. The VIF for the GVI actually decreased to 17.31. When trend variables were excluded from the average VIF calculation, the average VIF dropped to 5.43. The high collinearity is a localized artifact of the polynomial model. It does not adversely affect the stability of the other estimates. This conclusion is further supported by the high significance (p < 0.001) of the OSU varieties and genetic vintage variables, indicating that the model retains sufficient power despite the mechanical collinearity.
3.1. Regional effects
ASD fixed effects capture persistent yield differences across regions. These effects are time-invariant, so they do not affect the identification of the varietal coefficients and provide a benchmark for interpreting regional heterogeneity in production conditions.
Wheat yield impacts varied across ASDs. West Central, North Central, and Southwest wheat yields were 10, 4, and 10 bu ac−1 below the state average. Panhandle and Central wheat yields were not significantly different from the state average. South Central and the “other” group yields were 14 and 16 bu ac−1 above the state average. These differences are consistent with known spatial variation in rainfall, soil quality, and production conditions across Oklahoma.
3.2. Extensive margin: Varietal adoption and yield
The estimated coefficients for the variety composition variables are interpreted as relative yield differences across varietal groups. Compared with the reference variety (“unknown”), OSU wheat varieties (non-Clearfield) increased wheat yields over the study period.Footnote 4 A 1-percent increase in wheat acres planted with non-Clearfield OSU seed varieties resulted in a 0.45 bu ac−1 increase in wheat yields, a modest but significant gain from 2007 to 2023 (Table 3).
The OSU Clearfield variety was not a predictor of wheat yields. This null finding is likely due to its late introduction and relatively slow, geographically specific uptake (Figure 1), which limits the variation available to estimate its mean yield effect at the ASD level. The combined effect of OSU Clearfield and all other OSU varieties was not significant (estimate, 0.45 bu ac−1, p = 0.25). Other wheat varieties were also a significant predictor of wheat yield. A 1-percent increase in acres planted to other varieties resulted in a 0.48 bu ac−1 increase in wheat yields relative to the unknown varietal group.
3.3. Intensive margin: Genetic vintage
The estimated coefficient for the genetic vintage index (2.50 bu ac−1, p < 0.001; Table 3) indicates the marginal yield increase associated with a one-year advancement in OSU’s germplasm portfolio, reflecting the potential gain or intensive-margin impact of the breeding program. It identifies an upward shift in the production function observed specifically on acreage where modern OSU genetics are adopted. However, the aggregate impact of this 2.50 bu ac−1 boost in productivity is moderated by adoption levels of OSU varieties (the extensive-margin impact). When scaled by the study-period average 30% market share of OSU varieties (Table 2), the realized annual contribution to the state’s total wheat output is about 0.75 bu ac−1 per year (30% × 2.50 bu ac−1 + 70% × 0).
The modern-era OSU breeding program significantly outperforms long-term regional yield gains. To put 0.75 bu ac−1 per year into perspective, Fischer et al. (Reference Fischer, Byerlee and Edmeades2014) provide wheat breeding program yield-gain benchmarks ranging from 0.30 to 0.45 bu ac−1 per year across a variety of growing conditions and periods, including the Southern Great Plains. Graybosch and Peterson (Reference Graybosch and Peterson2010) reported a potential yield gain of 0.50 bu ac−1 per year from wheat breeding programs for hard red winter wheat in the Plains region. Regressing Oklahoma wheat yields from NASS-USDA QuickStats (USDA-NASS, 2024b) from 1990 to 2024 on a linear trend yielded an estimated increase of 0.40 bu ac−1 per year. This estimate is a “business as usual” reference rate because it includes acres planted to public and private non-OSU varieties and older, heirloom seedstock. This narrowing of the yield gap attributable to the OSU breeding program may be due to advances in Clearfield technology and to targeting traits like grazing tolerance in a dual-purpose system and resistance to viruses, fungi, low pH, and drought.
3.4. Yield variability
The heteroskedastic specification provides evidence on the relationship between varietal composition and yield variability. The Wald test for heteroskedasticity could not be rejected at any conventional level of significance (p = 0.281; Table 3), suggesting that the error variance is generally homoskedastic across the panel. However, individual coefficients in the variance function suggest economically meaningful patterns. Intriguingly, the model detected an impact of the OSU Clearfield varieties, despite the relatively few years since their release. Model degrees of freedom were corrected for years and ASDs with Clearfield use. Thus, there is reason to be confident that these varieties are risk-reducing. While the market share of non-OSU varieties did not significantly explain model variance, the combined market share of OSU varieties was associated with a significant decrease in yield variance over the study period (−0.13, p = 0.046; Table 3).
This stabilizing effect is particularly pronounced in the OSU Clearfield lineage. A one-percentage-point increase in the share of acreage planted to OSU Clearfield varieties reduced yield volatility by 10.03% (p = 0.057). Furthermore, the joint contribution of Clearfield and traditional OSU varieties reduced yield volatility by 11.77% (p = 0.034). These findings suggest that the OSU breeding program provides a dual economic benefit: raising the yield frontier (as evidenced by the 2.50 bu ac−1 intensive margin) while lowering production risk by narrowing the distribution of yield outcomes. Given the relatively short diffusion period and the aggregate nature of the data, these findings should be interpreted as suggestive rather than definitive.
3.5. Revenue impacts
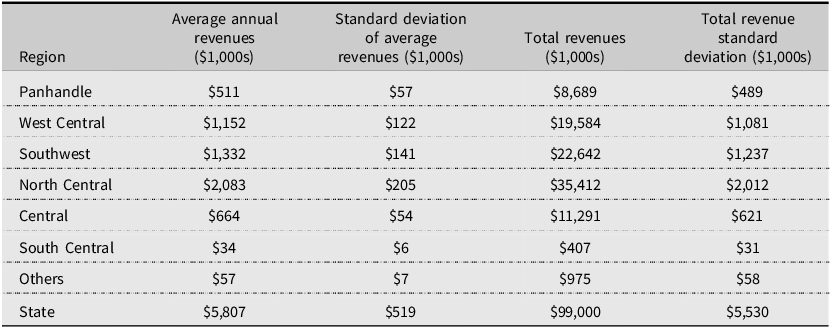
Figure 2 shows the evolution of added revenue from the state’s wheat breeding program from 2007 to 2023, as calculated using Equation (4). Table 4 reports the average and cumulative revenues to the wheat breeding program, ordered by region. Differences among ASDs were driven by harvested acres and the percentages of OSU varieties used. The largest economic impact occurred in the Northcentral ASD. This ASD averaged 1.1 million acres harvested annually during the study period, accounting for about 35% of statewide acres harvested. The combined impact of OSU varieties and their diffusion (Figure 1) generated $2.08 million in additional annual revenue for the Northcentral ASD. Conversely, the South Central ASD had the smallest impact. Acres harvested in the South Central ASD accounted for less than 1% of Oklahoma wheat acres, ranging from a high of 71,550 acres in 2008 to a low of 12,730 acres in 2020. Low harvested acres, combined with a statewide low of 14% utilization of OSU varieties (Figure 1), resulted in an annual average impact of just $34,000 for the South Central ASD.
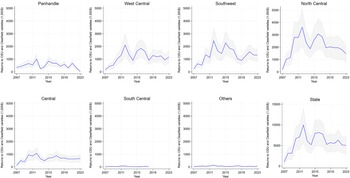
Economic impact on revenue by OSU and OSU-Clearfield wheat varieties and breeding program genetic gain (2023 $s).
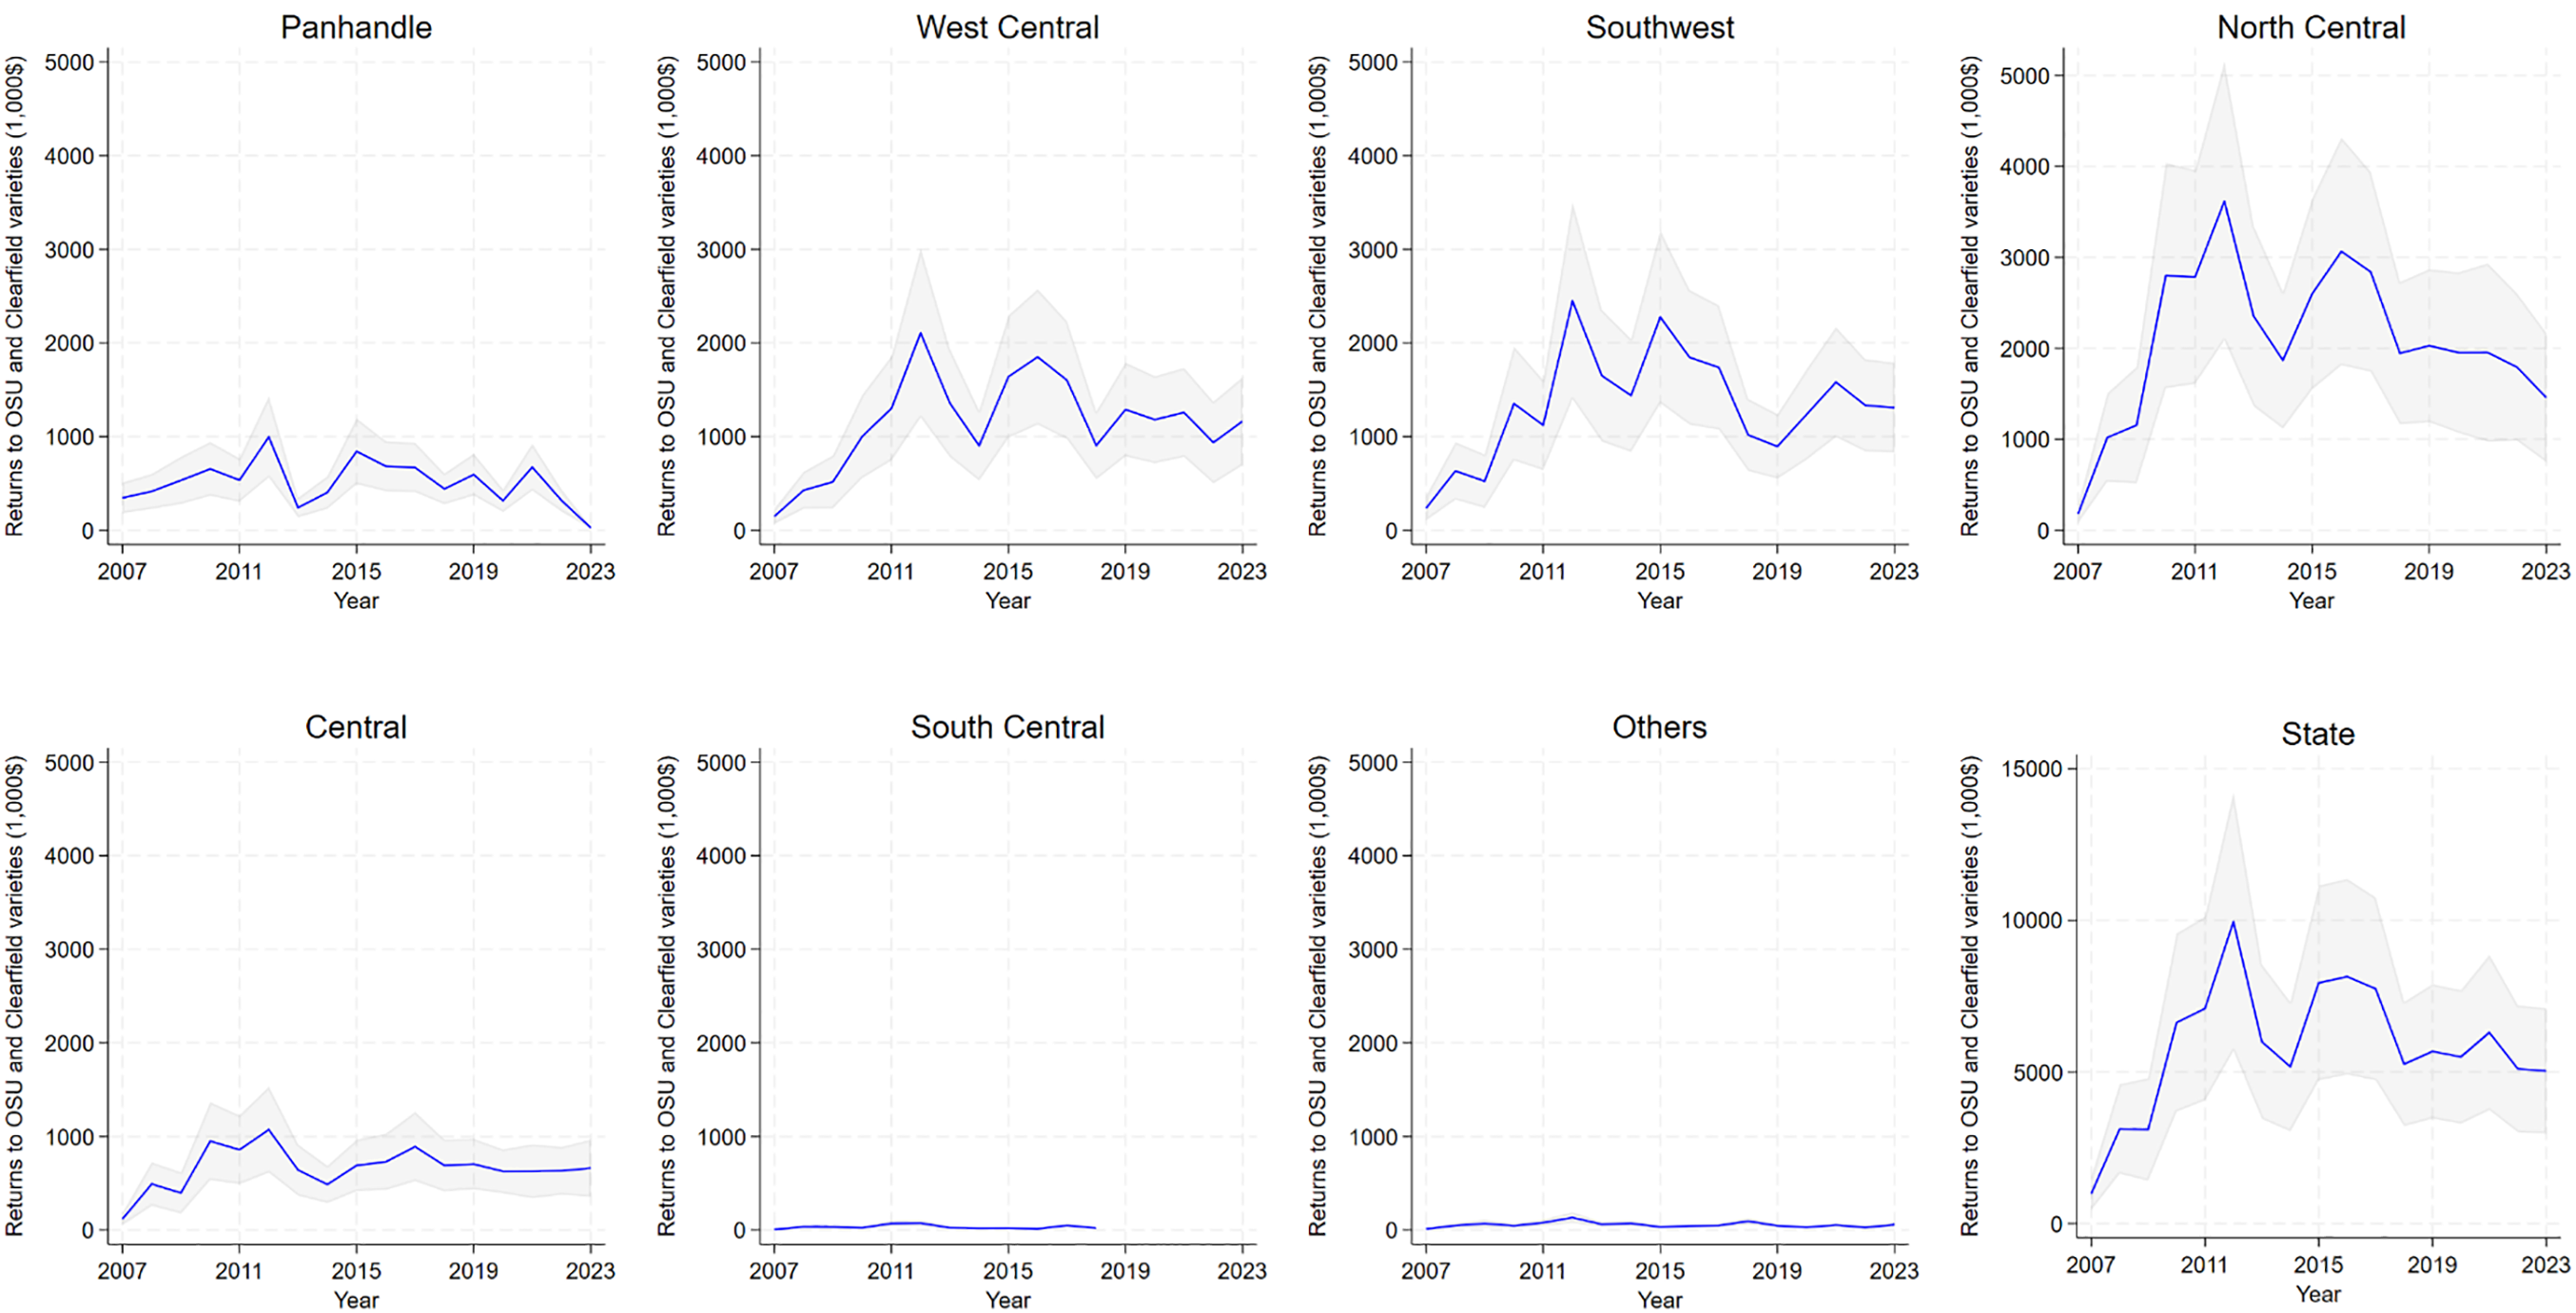
Total revenues to OSU and OSU Clearfield wheat varieties, 2007-2023 (in 2023 dollars)

Table 4. Long description
A table comparing average annual revenues, standard deviation of average revenues, total revenues, and total revenue standard deviation across different regions. The table has 10 rows and 4 columns. The columns are labeled as follows: Region, Average annual revenues (1,000s), Standard deviation of average revenues (1,000s), Total revenues (1,000s), and Total revenue standard deviation (1,000s). The regions listed are Panhandle, West Central, Southwest, North Central, Central, South Central, Others, and State. Row 1: Panhandle, $511, $57, $8,689, $489. Row 2: West Central, $1,152, $122, $19,584, $1,081. Row 3: Southwest, $1,332, $141, $22,642, $1,237. Row 4: North Central, $2,083, $205, $35,412, $2,012. Row 5: Central, $664, $54, $11,291, $621. Row 6: South Central, $34, $6, $407, $31. Row 7: Others, $57, $7, $975, $58. Row 8: State, $5,807, $519, $99,000, $5,530.
The aggregate state impact averaged $5.81 million per year and totaled $99 million over the 17 years covered by the data. These values reflect the combined effects of adoption (changes in acreage shares) and innovation (genetic improvement). This result, while a fraction of the state’s $504 million wheat revenue from 2023 (USDA-NASS, 2024b), represents a remarkable return on investment. Annual expenses of the Oklahoma Wheat Improvement Team (salaries and operating costs, including land rent) totaled $527,055 for the 2023–2024 fiscal year. In direct effects, the Team generated 11.02 times its expenses in additional producer revenue. For every dollar spent on the breeding program, $10.02 (11.02 – 1) is returned to the state’s producers as additional revenue. (Annual benefit-cost ratios are reported in Supplementary Materials Table 3.) Additional revenues not included in the direct impact include licensing royalties paid by Oklahoma Genetics, Inc. to OSU for the right to market OSU wheat varieties. Additional producer revenues are also associated with protein content, baking quality, and grazing tolerance for dual-purpose wheat. These revenues cannot be observed or collected from publicly available data, so our results should be considered lower bounds on the direct revenue impact.
Figure 2 graphs the revenue impacts of the ASD and the state. The shaded areas are 95% confidence intervals. The impact of the 2011-2012 drought on returns in the Panhandle is evident. The impacts are calculated (properly) on harvested acres of OSU-planted varieties. During the extended 2011–2012 drought, wheat acres were left unplanted, abandoned due to crop failure, or baled (or grazed) for livestock forage. This impact is present across all regions and the state total, but is most visually evident in the Panhandle. Panhandle annual impacts have trended sharply downward as utilization of OSU varieties has declined rapidly (Figure 1). Most regions also show a downward trend since 2015. The primary factor is the decline in wheat acres. Planted acres peaked at 5.9 million in 2007 and bottomed out at 4.2 million in 2019. Wheat acres planted had not substantially rebounded by 2023 to 4.55 million acres. Similarly, harvested acres peaked at 4.6 million in 2008 and bottomed out at 2.45 million in 2022 and 2023. With declining wheat acres, the impact of OSU varieties is diluted across fewer acres, resulting in a smaller effect.
3.6. Revenue risk
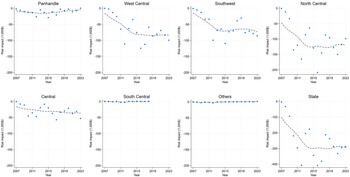
Figure 3 illustrates the annual impact of OSU varieties on revenue variability from 2007 to 2023. The marginal risk contribution of OSU variety diffusion and genetic yield gains was calculated using Equation (5), which measures the economic value of avoided volatility by comparing the realized revenue standard deviation with a counterfactual scenario: the variability in returns expected in the absence of the OSU breeding program. The regional decomposition of this risk impact (Figure 3) identifies 2013, the release year of the high-performance, two-gene Clearfield variety Doublestop CL+, as an important inflection point. As shown by the downward trajectories of the dashed trend lines, the economic value of avoided volatility appears to have increased following this release, particularly in the West Central, Southwest, North Central, and Central districts. These core wheat-producing regions saw the most rapid adoption of late-vintage Clearfield genetics between 2013 and 2015. Interestingly, the figure shows that while risk reduction intensified during this adoption phase, the impact has since leveled off; revenue variability is no longer actively decreasing but has reached a significantly lower, stabilized equilibrium compared to the pre-2013 baseline. Conversely, the Panhandle district exhibits a relatively subdued trend in revenue risk reduction. This finding aligns with localized adoption patterns, in which producers use varieties adapted to the specific environmental conditions of Texas and Kansas. At the state level, the cumulative effect of the OSU germplasm has resulted in an annual reduction in production risk valued at approximately $300,000 by 2023. These findings suggest that the breeding program provides two economic dividends: raising the productivity ceiling through the research-driven intensive margin and providing a cushion against yield shocks inherent to the Southern Great Plains.
Risk impact of OSU and Clearfield wheat varieties and genetic gain (2023 $s).
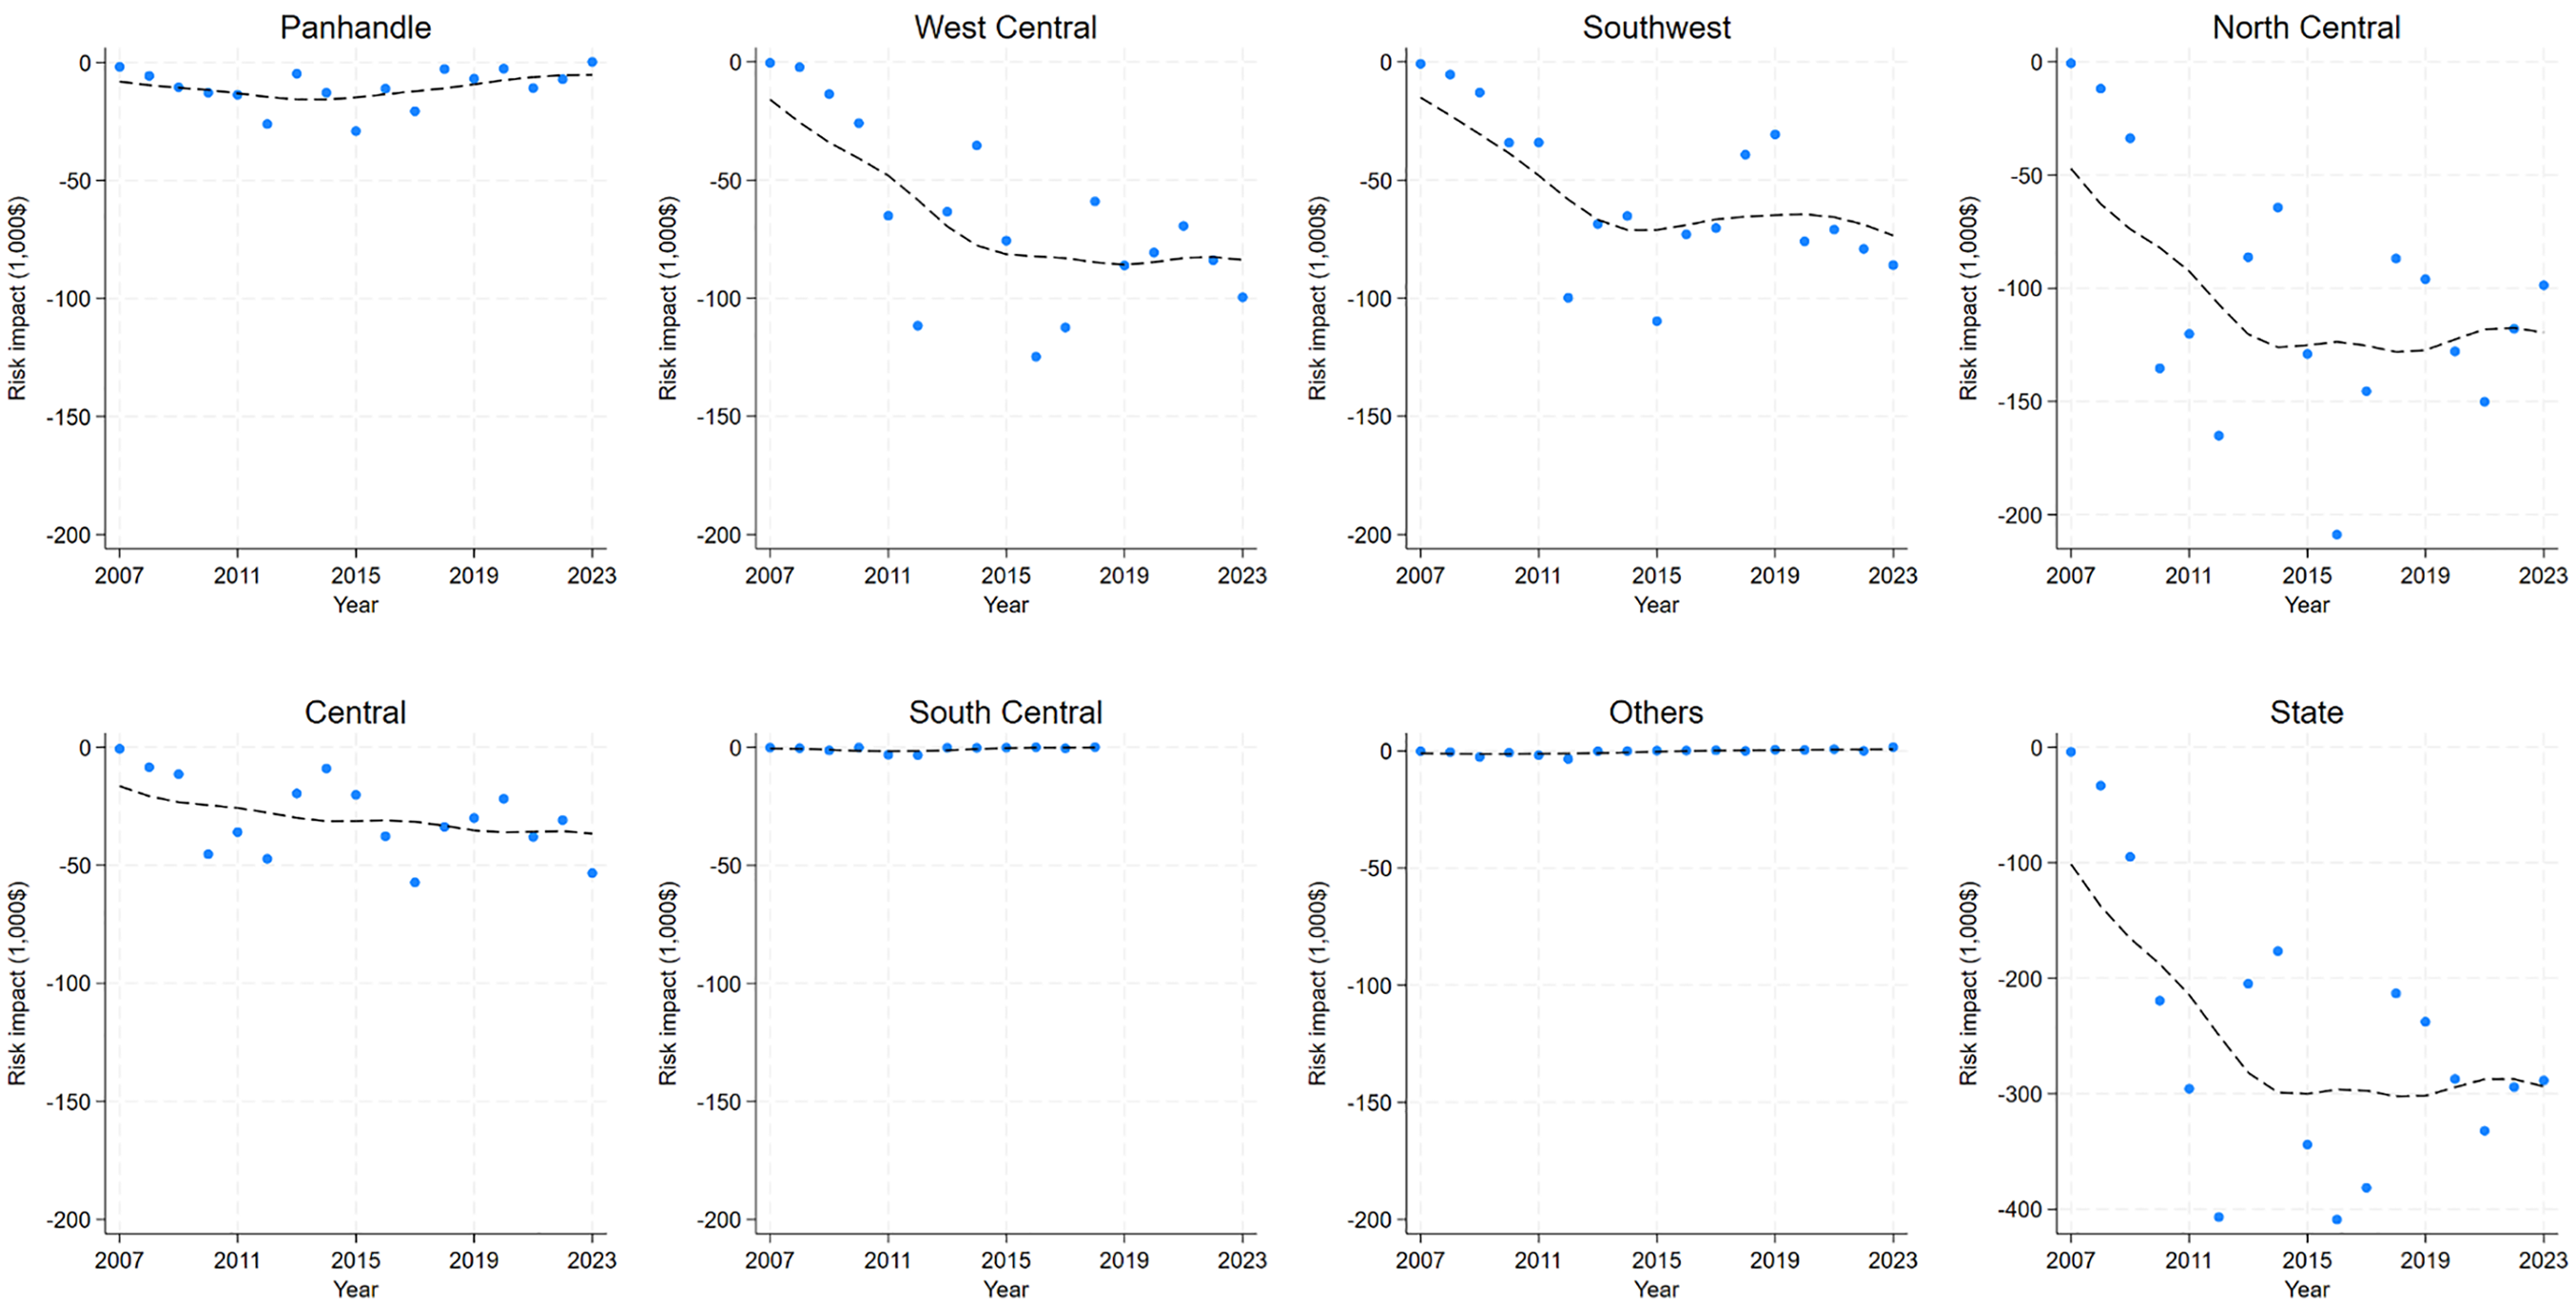
As shown in the adoption trends (Figure 1), the post-2013 period marked a shift in Oklahoma’s wheat acreage, with OSU Clearfield varieties displacing OSU and other varieties. This varietal turnover continued through 2023, but the reduction in revenue variability shifted from decline to stabilization after 2015. This stability suggests that the “risk dividend” from OSU varietal diffusion and genetic yield gains from the breeding program aligns with the introduction of late-Clearfield varieties, such as Doublestop CL+. Subsequent genetics in both OSU Clearfield and OSU varieties continue to raise the productivity ceiling (the intensive margin) while reducing return uncertainty.
The magnitude of risk reduction is tied to the regional importance of wheat production. The districts with the largest absolute reductions in revenue variability, such as the North Central and Southwest, have the highest concentrations of wheat acreage. Conversely, reductions in revenue variability are smallest in regions where wheat plays a less dominant role in the agricultural sector, and, consequently, demand for OSU varieties is lower. This spatial correlation underscores the study’s main findings: the economic “dividend” of the OSU breeding program is highest in regions where high adoption rates overlap with regional comparative advantage in wheat production. In these high-density production regions, the stabilizing traits of later-vintage genetics, specifically the improved resilience of Clearfield varieties, affect a larger aggregate volume of regional farm income and magnify the program’s impact on regional revenue stability.
4. Conclusions
Public investment in wheat breeding programs is common at LGUs. Until this research, state-and regional-level impacts of these programs had largely been undocumented. Our purpose was to measure the impact of the land-grant’s wheat breeding program. This analysis focused on Oklahoma State University’s Wheat Improvement Team. Data were collected from USDA-NASS publications to create a database containing wheat harvest acres and yields, percentages of use for various wheat varieties, and market prices by Oklahoma agricultural statistical district. ASD-level yield was regressed on the percentage of OSU varieties (excluding Clearfield varieties) grown, a genetic vintage index tracking variety release years, the percentage of OSU Clearfield varieties, the percentage of “other” varieties, and a polynomial trend to capture the impact of other technological adoptions from 2007 to 2023.
The findings highlight two pathways through which the breeding program contributes to productivity gains. Results show that a 1-percentage-point increase in the adoption of OSU (non-Clearfield) varieties increased yields by more than 0.45 bushels per acre relative to a reference variety, an extensive-margin effect of the breeding program. The yield gain attributable to genetic improvements in wheat germplasm was 0.75 bu ac−1 per year, an intensive-margin effect of the breeding program. Impacts varied across agricultural statistical districts, primarily due to differences in regional comparative advantage in wheat production. In addition to these productivity gains, the results indicate that OSU varietal adoption, particularly for Clearfield varieties, is associated with reduced yield variability, suggesting a stabilizing effect on production outcomes and revenue.
In economic terms, the OSU wheat breeding program is estimated to generate an average of $5.81 million per year in additional producer revenue, totaling roughly $99 million over the study period (in 2023 dollars). With program expenses, including salaries, operating expenses, and land rents totaling about $527,000 per yearFootnote 5 , the Team’s efforts generated over $5.81 million in additional wheat revenue for Oklahoma’s wheat producers. Results clearly show that the OSU Wheat Improvement Team generates almost 11.02 times as much revenue for Oklahoma producers as it costs to operate the wheat breeding program. For every dollar spent on wheat breeding research, $10.02 is returned to the state’s wheat growers. These findings underscore the continuing economic relevance of public plant breeding programs, particularly for crops such as wheat. The results suggest that sustained funding for public breeding programs can yield measurable gains in productivity and risk reduction, especially in regions with a strong comparative advantage in wheat production.
Despite providing new evidence on the economic contribution of a public wheat breeding program, several limitations should be acknowledged. The analysis relies on ASD-level aggregated data, which masks within-region heterogeneity and implies that the results reflect regional-average relationships rather than farm-level responses. Because varietal adoption is not randomly assigned and may respond to time-varying agronomic and economic conditions, the estimates are interpreted as conditional associations rather than causal effects, even after controlling for fixed regional effects and time trends. The compositional nature of acreage shares implies that estimated varietal effects are relative to an omitted category (“unknown” varieties). They do not represent absolute productivity gains. The genetic vintage index captures average release-year advancement, but it does not isolate specific biological traits driving yield improvements. Finally, revenue estimates are based on observed prices and direct yield effects. They omit quality premiums, royalty flows, and broader value-chain impacts. Additionally, due to limitations with the NASS variety data survey and reporting, actual acres planted to OSU varieties are underestimated. As such, the impacts are conservative estimates of the program’s total economic contribution.
Supplementary material
The supplementary material for this article can be found at https://doi.org/10.1017/aae.2026.10054.
Acknowledgments
The material in the manuscript does not infringe upon other published material protected by copyright. The material in the manuscript (or modification thereof) has not been published, is not being published, and is not simultaneously under consideration for publication in any other journal.
Author contribution
Conceptualization, E.A.D, D.L., B.C.; Methodology, D.L., E.A.D. Formal analysis, D.L. E.A.D.; Writing—original draft, D.L., E.A.D., B.C.; Writing—review & editing, D.L., E.A.D., B.C.
Financial support
Willard Sparks Chair in Agricultural Sciences and Natural Resources, Rainbolt Chair, Wheat Genetics Chair in Agriculture.
Competing interests
None.



 Open access

