


Introduction
A century ago the US Congress completed a striking process of modernization (Polsby Reference Polsby1968). Many state legislatures followed, transforming from “18th-century anachronisms” to become as “professional as many national legislatures” (Mooney Reference Mooney1995, 47). Variations in professionalism have since proven central to state legislative studies, especially after Squire (Reference Squire1992) united the field around a common measure. He combined three indicators—legislator salary, staff, and session length—each measured relative to the US House. If a state paid legislators 15% of the House salary, with a session 12% as long and 13% as much staff, he averaged these to 0.13. Squire’s measure soon displaced others, and he later extended it to cover 1979, 1986, 1996, 2003, 2009, 2015, and 2021 (Squire Reference Squire2017; Reference Squire2024).Footnote 1 From 2000 through 2009, 60% of publications using a measure of professionalism used Squire’s, rising to 69% in the 2010s.Footnote 2
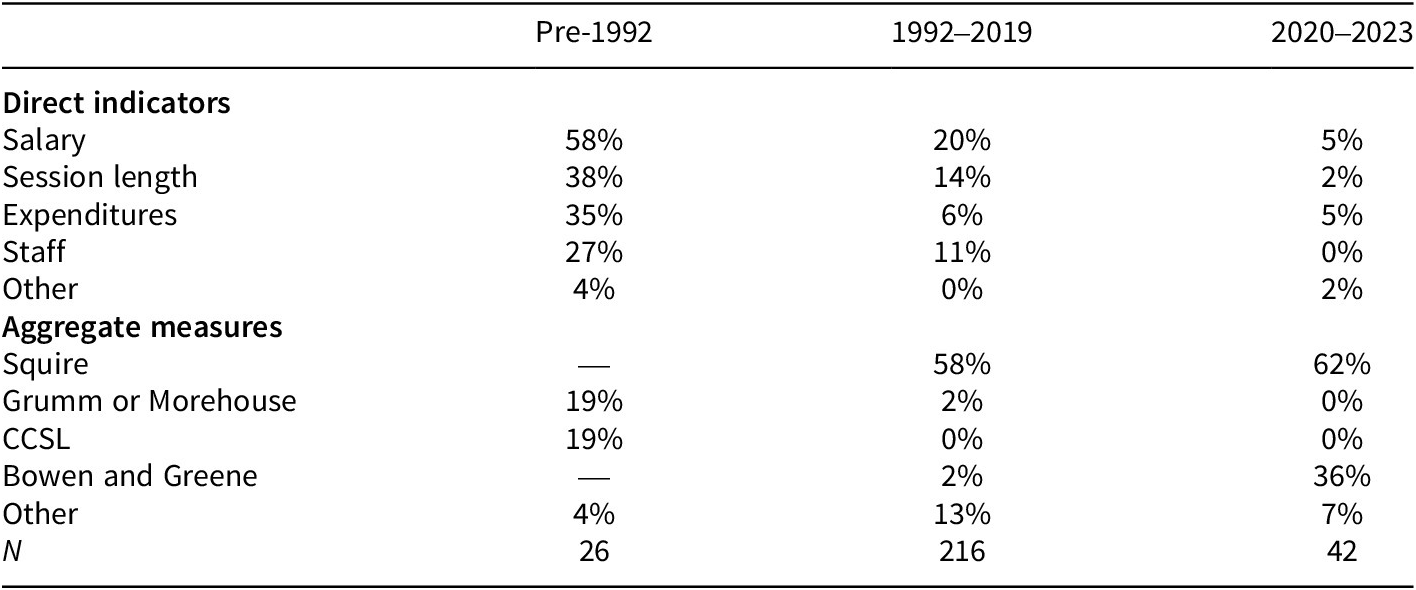
Bowen and Greene (Reference Bowen and Greene2014b) later proposed a reformulation. First, to cover more years they replaced staffing with non-salary legislative operating expenditures per seat; thus, their three components were salary expenditures, non-salary expenditures, and session length. Second, they measured each indicator without reference to Congress. Third, they estimated two latent dimensions via multidimensional scaling. Their first dimension (“MDS1”) captures the most variance and correlates with Squire’s index; their second (“MDS2”) captures residual differences among professional legislatures. From 2020 through 2023, 36% of relevant publications used MDS1/MDS2 and 62% used Squire’s index, as shown in Table 1.
Usage of professionalism measures

Note. Use of multiple measures pushes totals above 100. “Expenditures” includes both non-salary expenditures and total expenditures.
Here, we compare these popular measures to an alternative: legislative operating expenditures per member, adjusted for inflation and logged. Variants of this measure once enjoyed some currency, appearing in 35% of pre-1992 articles. It has retained occasional defenders, with some calling it “the purest measure of the total resources available to a legislature’s members and … thus the best indicator of professionalism” (Berry, Berkman, and Schneiderman Reference Berry, Berkman and Schneiderman2000; see also Van Dunk and Weber Reference Van Dunk and Weber1997; Carsey, Winburn, and Berry Reference Carsey, Winburn and Berry2017; Brown and Garlick Reference Brown and Garlick2024). Operating expenditures include any appropriation toward staff, research databases, salary, information technology, office space, and so on. Any increase in Squire’s or Bowen and Greene’s inputs necessarily increases expenditures.
Conveniently, the Census Bureau has collected annual operating expenditures data for decades. We have footnoted details about how we compiled state-year data from 1977 through 2020.Footnote 3 After adjusting for inflation, we use the natural logarithm to account for the diminishing marginal impact of additional resources, thereby prioritizing proportional increases over dollar increases. In 2020 dollars, expenditures per member in the median state-biennium were $549 k, with a range from $49 k (New Hampshire 1977–1978) to $6,983 k (California 2019–2020); logged, the median is 6.3 with a range from 3.9 to 8.9. For brevity, we call this measure “expenditures.”
This article compares Squire’s index, MDS1/MDS2, and expenditures. We begin with replications of 18 recent articles that included a measure of professionalism. The choice of measure makes little difference in cross-sectional work, but we find significant differences in almost every study spanning eight or more time periods. Divergent results cannot show which measure is best, only that the choice demands reflection.
We then identify four differences among the measures that may explain these results. First, missingness in MDS1/MDS2 may contribute to subtle selection effects. Second, outliers in Squire’s index and MDS1/MDS2 may drive results. Third, Squire’s benchmarking to Congress prevents longitudinal analysis from disentangling changes in state and Congressional resources. Fourth, difficulties in measuring session length affect Squire’s index and MDS1/MDS2. These latter two differences lead the three measures to manifest different longitudinal trends. On balance, we believe these differences favor expenditures over Squire’s index or MDS1/MDS2, especially for longitudinal analysis. Of course, the choice hinges on the aspects of professionalism a particular theory emphasizes.
Replications
We first compare these measures by replicating as many studies as possible that (1) included a measure of professionalism, whether theoretical or as a control; (2) were published since 2015; (3) had working replication materials; and (4) did not have so many interactions as to preclude straightforward comparison. We chose one model from each of the resulting 18 articles, replicating it once using Squire’s index (interpolated longitudinally), once using MDS1/MDS2 (reporting only MDS1, relegating MDS2 to a supplement), and once using expenditures.Footnote 4 We standardize each measure (as z-scores) to render coefficients comparable. To avoid selection bias we report all attempted replications (cf. Harden, Sokhey, and Wilson Reference Harden, Sokhey and Wilson2019).
Figure 1 summarizes our replications in coefficient plots having 84% and 95% confidence intervals, with studies ordered by average time periods t per state.Footnote 5 We label studies pseudonymously since our focus is not on these articles but on comparing these measures; details about each study appear in a supplement.Footnote 6 Coefficients differ significantly from zero (p < 0.05 two-tailed) if their 95% confidence interval does not cross the dotted vertical zero line. Coefficients differ significantly from one another (p < 0.05 two-tailed) if their 84% confidence intervals do not overlap (cf. Goldstein and Healy Reference Goldstein and Michael1995; Knol, Pestman, and Grobbee Reference Knol, Pestman and Grobbee2011); studies labeled in boldface have at least one such difference. We give each study’s functional form and original measure; asterisks mark studies that reported significance for their chosen measure (p < 0.05 two-tailed).Footnote 7 Some studies naturally have larger coefficients than others, but what matters here is only whether the coefficients for a particular study differ; to use all visual space, the horizontal axis thus has a unique range for each study.
Coefficient plots with 84% and 95% confidence intervals.

In studies, D, F, H, I, L, N, and P, some measures of professionalism yield a coefficient significantly different from zero while others do not. The more pertinent question, though, is whether the three professionalism coefficients differ from one another. No significant differences arise when t < 8—unsurprisingly, since all three measures correlate at any cross-sectional moment, as illustrated in Figure 2. However, significant differences arise in six of the seven studies having t ≥ 8, even though all six included longitudinal corrections such as year fixed effects. In studies M and N, expenditures and MDS1 align against Squire’s index; in studies P and Q, Squire’s index and MDS1 align against expenditures; in study L, Squire’s index and MDS1 differ significantly; in study R, expenditures and Squire do.
Cross-sectional scatterplots with linear trend and 95% confidence interval.

Critically, in four of these six studies, the choice of measure affects the article’s central conclusion. In studies L and N, professionalism itself is a central variable. In study P, the central variable (term limits) retains significance only with Squire’s index and expenditures, not MDS1/MDS2. In study R, the central variable (legislative partisan swing) retains significance only with MDS1 and expenditures, not Squire’s index. Only in studies M and Q do the central findings retain significance regardless of the measure, though their magnitude wobbles.
To be clear, we most emphatically do not claim to have debunked these studies. First, most of them include several models, but we have tested only one from each. Second, we need not expect findings to be robust to all three measures. After all, “scholars should take care to choose the appropriate measure of the concept that best fits the causal relationships under examination” (Bowen and Greene Reference Bowen and Greene2014b, 279). If a paper’s theory requires longitudinal benchmarking to Congress, for example, then it makes sense to consider only the Squire index. We therefore do not claim to have debunked these studies, only to have shown that the choice of professionalism measure matters. We now consider features of each measure that might affect this choice.
Properties of each measure
Using data from 1977–2020, we compare these measures in terms of missingness, vulnerability to outliers, and longitudinal trends, with the latter reflecting difficulties in measuring session length as well as Squire’s decision to benchmark to Congress.
Missingness
Figure 3 plots each measure’s coverage by state-biennium since 1977. Expenditures have no missingness. Squire’s index is available for only the seven years given above, though researchers often apply linear interpolation. MDS1/MDS2 miss several state-biennia, especially in the 1990s. Missingness is not benign; listwise deletion of incomplete observations causes “loss of valuable information at best and severe selection bias at worst” (King et al. Reference King, Honaker, Joseph and Scheve2001).
Data availability.

Vulnerability to outliers
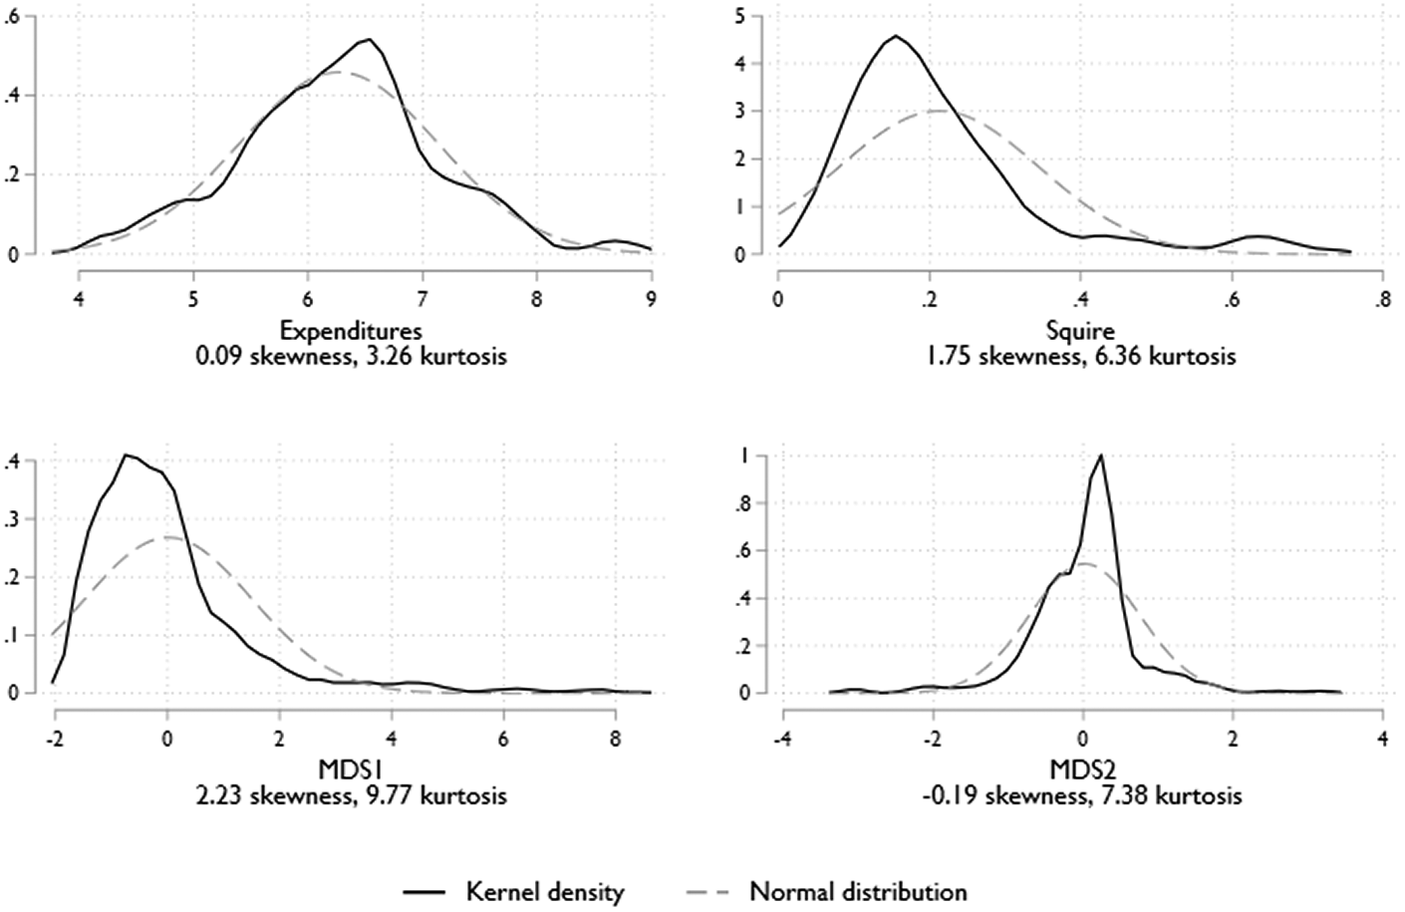
Figure 4 contains density plots for each measure overlaid on normal distributions having the same mean and standard deviation, with 1,110 state-biennia for expenditures, 350 for Squire’s index, and 999 for MDS1/MDS2. A normal distribution has a kurtosis of 3; higher kurtosis in Squire, MDS1, and MDS2 implies potential outliers. Expenditures have no observations more than three standard deviations from the mean, but Squire’s index has 13 such observations, MDS1 has 24, and MDS2 also has 24. California is especially problematic, lying 3+ standard deviations from the mean in four of the seven periods for Squire, 17 of 19 for MDS1, and 10 of 19 for MDS2. Researchers using these measures should test whether outliers like California affect their results.
Density plots.

Longitudinal properties
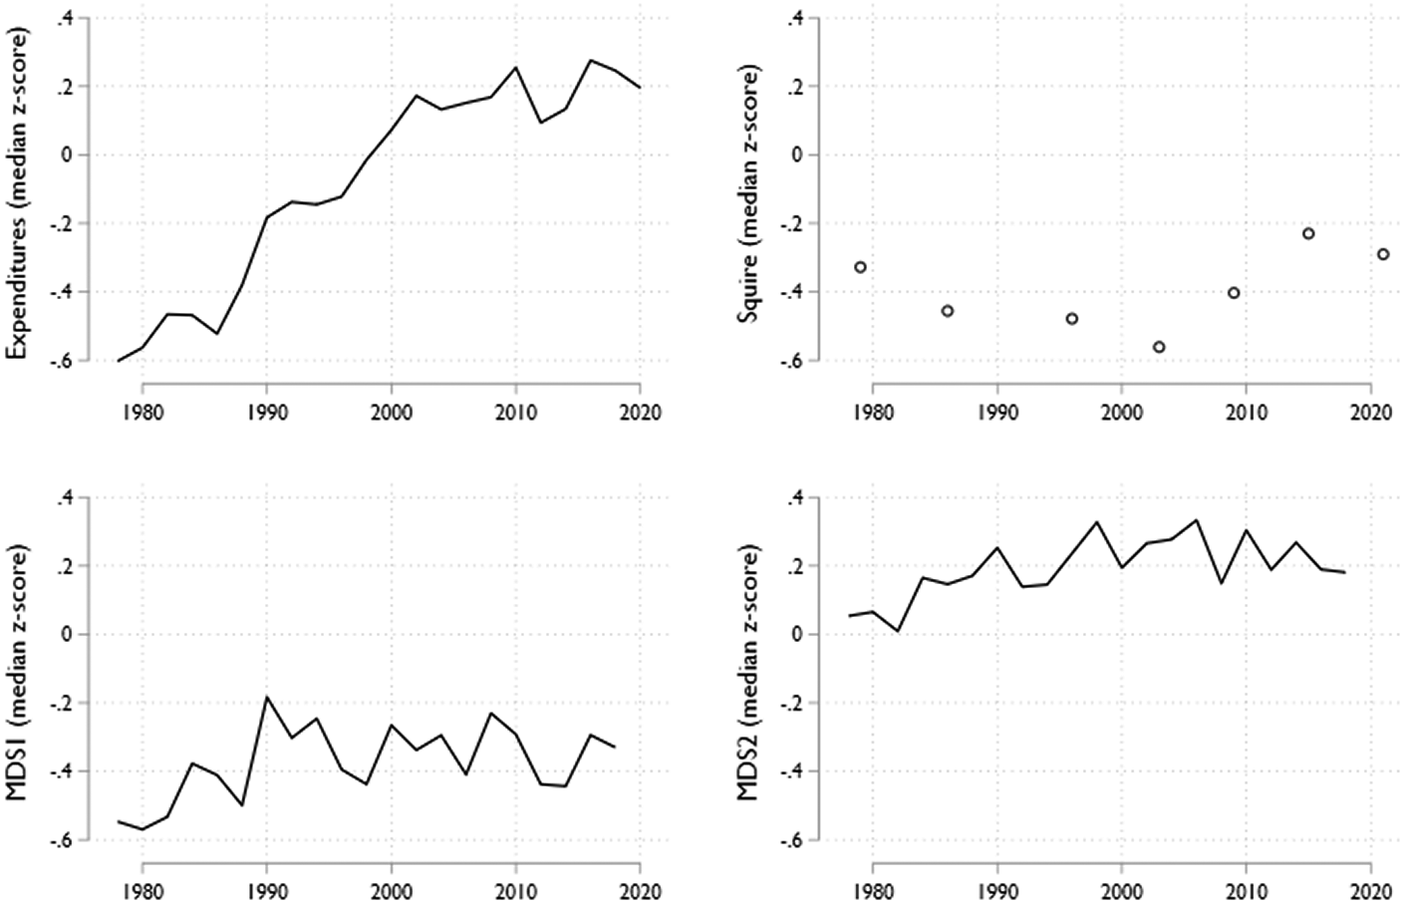
Figure 5 plots biennial medians for each (standardized) measure. Scholars claim that legislatures began modernizing in the 1960s–1970s (Mooney Reference Mooney1994, 70) until provoking backlash in the 1990s–2000s (Kousser Reference Kousser2005). Expenditures follow this expectation, rising before leveling off. By contrast, Squire’s index declines until 2003, rises, then declines. MDS1 and MDS2 show no trend. (We limit these charts to the 27 states with the least missingness in MDS1. Trends are similar elsewhere.)
Biennial medians.

Two issues drive these differences. First, Squire’s benchmarking to Congress means the median state’s score can rise (1) if the median state increases its resources or (2) if Congress decreases its own. Indeed, his index’s 2009–2015 increase reflects “decisions at the congressional level,” where “both the House and Senate met for far fewer days … than in earlier decades” (Squire Reference Squire2017, 367). In cross-sectional analysis, Squire’s benchmarking may ease interpretation, benefiting readers. In longitudinal analysis, however, it conflates state and Congressional professionalism, leaving it unclear whether “state legislatures [are] getting more professional or [Congress is] just stagnating” (Squire Reference Squire2024, 5). As shown earlier, Squire’s index yields significantly different results in six of the seven studies with t > 8, even though all these studies included year fixed effects or other corrections. We infer that such techniques cannot account for Congressional benchmarking.
Second, both Squire’s index and MDS1/MDS2 face difficulties in measuring session length, affecting their longitudinal trends. Both measures begin by pulling session lengths from annual editions of the Book of the States (e.g., Council of State Governments 2021). Though invaluable, “BOS coding of session length can be problematic” (Bowen and Greene Reference Bowen and Greene2014b, 284), requiring “caution … in employing [BOS] session data” (Squire Reference Squire2017, 364). For starters, in states with a constitutional limit on session length Book of the States reports, for example, “100C” (100 calendar days) or “100 L” (100 legislative days). To align these scales Squire and MDS1 multiply calendar days by 5/7 to eliminate weekends, but this fix “does not account for legislatures that begin their schedules at a leisurely pace and only in the last … few weeks meet every weekday” (Rosenthal Reference Rosenthal1996, 174).
Greater difficulties arise in states without a constitutional limit. In these cases, Book of the States sometimes reports only each session’s start and end dates. In the 2021 edition, for example, Wisconsin reports a general session spanning January 7, 2019, through January 4, 2021. In this case, multiplying by 5/7 will produce an overestimate—a problem that “escalate[s] dramatically” in states reporting the lengthiest sessions (Squire Reference Squire2017, 364).
There is a separate question of which days to count. Squire counts days in general sessions, while Bowen and Greene add special sessions. Either approach “omits work done during the … interim, and therefore exaggerates the time disparity between legislatures with longer and shorter sessions” (Rosenthal Reference Rosenthal1996, 174).Footnote 8 For these and other reasons, estimates of session length are noisy, even erratic; close inspection reveals many cases where the estimate for some state changes by 50% or more from one biennium to the next even as the number of bills remains steady.Footnote 9
In sum, expenditures have less missingness and fewer outliers than Squire’s index and MDS1/MDS2; moreover, Squire’s benchmarking to Congress and the unreliability of session length cause MDS1/MDS2 and Squire’s index to yield longitudinal trends differing from expectations.
Conclusion
Squire’s index helped make professionalism a critical feature of state legislative studies. The discipline is indebted to him for sharing and updating his index and to Bowen and Greene for similar labors. We have compared these measures to an older alternative: Legislative operating expenditures per member, adjusted for inflation and logged. Replications show that results for professionalism and other independent variables often hinge on the choice of measure, at least in longitudinal analysis.
Diverging replications cannot show which measure is best, only that the choice matters. We have explored each measure’s missingness, vulnerability to outliers, and longitudinal trends, with the latter reflecting difficulties in measuring session length and whether to benchmark to Congress. In some cases, we can link these differences to specific replications. For example, omitting California or constraining all models to the same non-missing observations changes the results for studies D, K, and R; in these cases, outlying observations mingle with the selection effects caused by missingness.Footnote 10
Still, missingness and outliers affect only these three studies in this manner, suggesting that longitudinal differences bear most responsibility for the conflicting results in studies L, M, N, P, and Q. These differences apparently reflect Squire’s benchmarking to the US House and the use of session length in Squire’s index in MDS1/MDS2. Measuring professionalism as expenditures avoids both problems. Indeed, expenditures may be seen as a cleaner version of Bowen and Greene’s measure; it keeps two of their components (salary expenditures per member and non-salary expenditures per member) while discarding the third, problematic one (session length).
Best scientific practice requires developing a clear conceptual definition before deriving a valid and reliable operational measure (Jackman Reference Jackman, Box-Steffensmeier, Brady and Collier2008). If a study’s conceptualization of professionalization requires direct consideration of session length, salary, or some other indicator, then that study would be best served by setting aside all three measures considered here in favor of direct indicators. Likewise, if a study’s theoretical conceptualization compares state legislative resources to those of Congress, then it would be appropriate to use a measure benchmarked to Congress. However, most studies replicated here sought only a general, unidimensional measure. In those cases, this analysis favors expenditures rather than Squire’s index or MDS1/MDS2. Expenditures have no missingness, low vulnerability to outliers, and longitudinal trends consistent with the literature’s expectations. As a perk, this measure is portable outside the states, creating intriguing opportunities for comparative analysis.
Supplementary material
The supplementary material for this article can be found at http://doi.org/10.1017/spq.2024.23.
Data availability statement
Replication materials are available on SPPQ Dataverse at https://doi.org/10.15139/S3/TK7MAU (Brown and Mitchell Reference Brown and Mitchell2024).
Funding statement
The authors received no financial support for the research, authorship, and/or publication of this article.
Competing interest
The authors declared no potential conflicts of interest with respect to the research, authorship, and/or publication of this article.
Author biographies
Adam R. Brown is an Associate Professor of Political Science at Brigham Young University and Faculty Scholar at the BYU Center for the Study of Elections and Democracy.
Ellie M. Mitchell is an undergraduate at Brigham Young University and plans to graduate in April 2025.


 Open access