


Introduction
In general, snow stiffness increases with density; however, snowpack microstructure strongly influences its mechanical behavior, in particular its elastic moduli (e.g., Young’s modulus, bulk modulus, shear modulus and p-wave modulus), which can vary by orders of magnitude for a given density (Shapiro and others, Reference Shapiro, Johnson, Sturm and Blaisdell1997). These moduli, along with the geometry of a loading test, define the macro-scale stiffness of the snowpack and its mechanical behavior (e.g., elastic deformation) under applied stresses (Petrenko and Whitworth, Reference Petrenko and Whitworth1999). The mechanical behavior of snow is highly dependent on the rate of deformation, and over a wide range of strain-rates, snow has both elastic and viscous behavior, in addition to both plastic and brittle failure (McClung and Schaerer, Reference McClung and Schaerer1993; Löwe and others, Reference Löwe, Mosinger and Schleef2020).
From a mobility perspective, it is critical to know about the nearly instantaneous elastic response of a snowpack during high-strain-rate activities, for example, compressive loading due to a vehicle driving over a snowpack. The elastic moduli controlling this response are difficult to measure, and therefore, bulk density and hardness are often used as an index for snow stiffness. However, snow grains in a snowpack continuously undergo changes in size and shape and bonds between grains, a process known as metamorphism, driven by vapor pressure and temperature gradients caused by both the surrounding conditions and curvature effects. This means that snowpacks are dynamic, and their stiffness and mechanical behavior change with time.
Numerous studies have worked to build up the knowledge of various elastic moduli in ice and snow see
Petrenko and Whitworth (Reference Petrenko and Whitworth1999). This is often done via studies of mechanical wave propagation and corresponding wave velocities or via deformation experiments in a cold lab. Recent wave-related studies include Gerling and others (Reference Gerling, Löwe and van Herwijnen2017), who sieved lab-made snow crystals and created a cylindrical snow sample with a diameter of 150 mm and studied the p-wave modulus as a function of snow density. The modulus is inferred from p-wave velocity ( $V_p$) and density ( $\rho$) observations via e.g.,
Mavko and others (Reference Mavko, Mukerji and Dvorkin2009):
$\rho$) observations via e.g.,
Mavko and others (Reference Mavko, Mukerji and Dvorkin2009):
 \begin{equation}
V_p = \sqrt{\frac{c_{33}}{\rho}},
\end{equation}
\begin{equation}
V_p = \sqrt{\frac{c_{33}}{\rho}},
\end{equation}where  $c_{33}$ is the p-wave modulus in the axial direction of a transverse isotropic material. Gerling and others (Reference Gerling, Löwe and van Herwijnen2017) prepared samples of different densities and inferred a single p-wave modulus in the axial direction from ultrasound data collected after 7 days (168 hours) of sintering, concluding that the modulus increased with density following a power law. Capelli and others (Reference Capelli, Kapil, Reiweger, Or and Schweizer2016) also studied p-wave velocity from the perspective of porous media and determined relationships between density and elastic modulus from previous studies and wave propagation experiments.
From a dynamic point of view, we still lack a full understanding of how the p-wave modulus changes with time as the snowpack evolves, especially right after snow deposition. Thus, in the study presented here, we investigate the role of a process known as snow sintering on the temporal evolution of the p-wave modulus. When the temperature remains below the melting point and there is no temperature gradient, the snow is dry and the grains evolve through equilibrium metamorphism (isothermal metamorphism) (Colbeck, Reference Colbeck1982), where curvature effects dominate, grains round and bonds grow. Sintering further drives the isothermal metamorphism of snow by considering the internal pressure that reduces the surface free energy at the ice–air interfaces and grain boundaries. Physically, this manifests itself as the migration of water vapor from convex to concave surfaces, leading to the rounding of snow grains (Petrenko and Whitworth, Reference Petrenko and Whitworth1999; DeWalle and Rango, Reference DeWalle and Rango2008) and the formation of new bonds between adjacent grains e.g., Colbeck (Reference Colbeck1997).
Sintering, the process by which intergranular bonds are formed in a powder or porous material such as snow, dry or wet, reducing the surface energy of the material, is a key mechanism in this evolution (Fierz and others, Reference Fierz2009). In dry snow, direct deposition of water vapor diffused through the pore space usually dominates the bond growth process, but several other mechanisms may contribute depending on the prevailing conditions. These include surface, volume and grain boundary diffusion, as well as plastic flow. Externally applied pressures, such as overburden pressure due to additional snow accumulation, also facilitate bond formation.
This bonding process is a larger phenomenon that encompasses mechanisms such as surface diffusion, volume diffusion, grain boundary diffusion, viscous flow, plastic flow and condensation of vapor e.g., Blackford (Reference Blackford2007); Kaempfer and Schneebeli (Reference Kaempfer and Schneebeli2007).
In the absence of temperature gradients, sintering induces mass redistribution through these mechanisms, promoting densification and strengthening of the snow structure (Maeno and Ebinuma, Reference Maeno and Ebinuma1983; Fierz and others, Reference Fierz2009). Essentially, sintering acts to minimize the system’s free energy by encouraging the bonding and coalescence of ice grains, gradually transforming loose, fresh snow into a more compacted, dense form. In wider contexts, such as the densification of seasonal snow, sintering operates alongside external pressures such as overburden stress, collectively facilitating the natural evolution and densification of snow and ice structures.
The most extensively studied example of sintering in snow is the case of rounded grains in isothermal dry snow, where the snow grains grow slowly while forming intergranular bonds (Colbeck, Reference Colbeck1997). These bonds are typically described as necks with concave geometry, driven by vapor pressure differences over the convex (grain) and concave (bond) surfaces (Colbeck, Reference Colbeck1997). The sintering process creates stronger bonds between snow grains (Gubler, Reference Gubler1982; Colbeck, Reference Colbeck1997; Fauve and others, Reference Fauve, Rhyner, Lüthi, Schneebeli and Lehning2008), resulting in increased snow stiffness and elastic moduli (Kaempfer and Schneebeli, Reference Kaempfer and Schneebeli2007; DeWalle and Rango, Reference DeWalle and Rango2008; van Herwijnen and Miller, Reference van Herwijnen and Miller2013). This process is temperature dependent, with rapid changes occurring near the melting point and slower bond formation as the snow temperature becomes colder.
In this study, we observe the equilibrium metamorphism and sintering process through time under isothermal conditions via p-wave velocity observations. We aim to quantify the effect of a micro-structural process, that is, isothermal metamorphism and sintering, on the bulk p-wave modulus. To achieve this, we use a laser ultrasound system (LUS) (McCaslin and others, Reference McCaslin, Mikesell and Marshall2024a) to investigate the effect of sintering in four artificially grown snow crystal types. We assess how the ultrasonic p-waves change over a 72 hour period to infer how initial snow crystal type impacts the evolution of mechanical properties.
To measure the snow crystal type, density and porosity, we use several instruments, including the SnowMicroPenetrometer (Schneebeli and Johnson, Reference Schneebeli and Johnson1998; Marshall and Johnson, Reference Marshall and Johnson2009), InfraSnow (FPGA Company GmbH, n.d.) and high-resolution microscope photography. We first introduce the methods and the experiment. We then summarize the results and discuss them in the context of past studies.
Methodology
Before describing the experiment and results, we first describe the methodologies used in this study. The fundamental idea is to create a sample of snow with an initial known density consisting of lab-made snow of a single grain type. We then probe that sample non-destructively for 72 hours under isothermal conditions. The probing methods we use include i) ultrasonic p-wave propagation across the sample to observe changes in p-wave velocity; ii) specific surface area (SSA) observations at the same location on the top surface of the snow sample using the InfraSnow; iii) repeated mass and volume measurements to ensure no mass is being lost; and iv) internal destructive measurements of density along the length of the sample using a SnowMicroPen (SMP) at the end of the experiment to check for density variations throughout the sample. In the remainder of this section, we describe each of these steps.
Sample creation
Snow crystals nucleate in the atmosphere at specific combinations of supersaturation, temperature and cloud condensation nuclei. Specific combinations of these parameters lead to the formation of four major types of snow crystals: plates, needles, columns and dendrites (Nakaya, Reference Nakaya1954; Libbrecht, Reference Libbrecht2005; Schleef and others, Reference Schleef, Jaggi, Löwe and Schneebeli2014a).
In this study, we create these four snow crystal types (dendrites, columns, plates and needles) by growing them in our cold lab using the parameters in Table 1. An artificial snow maker, created by Montana State University and based on Schleef and others (Reference Schleef, Jaggi, Löwe and Schneebeli2014a), controls the nucleation temperature and supersaturation. The snow maker has a temperature-controlled water basin that produces the water vapor that is moved into the nucleation chamber with fans. Simultaneously, the temperature-controlled cold lab, paired with the temperature of the water basin, provides the desired temperature within the nucleation chamber. The water basin temperature and the cold lab temperatures are calculated using a model obtained from (Schleef and others, Reference Schleef, Jaggi, Löwe and Schneebeli2014a), which takes into account the elevation of the cold laboratory in Boise, Idaho. In Schleef and others (Reference Schleef, Jaggi, Löwe and Schneebeli2014a), sensors were placed within the snow maker to measure the temperature. Schleef and others (Reference Schleef, Jaggi, Löwe and Schneebeli2014a) found a 0.2 $^{\circ}$C variation within the snow maker during experiments, which sometimes led to irregular growth of snow. The results of the water basin temperature and cold lab temperature are presented in Table 1. The wire mesh where snow grains grow within the nucleation chamber is shaken every few hours by an automated motor that rotates the mesh, causing the snow crystals to fall into a container below.
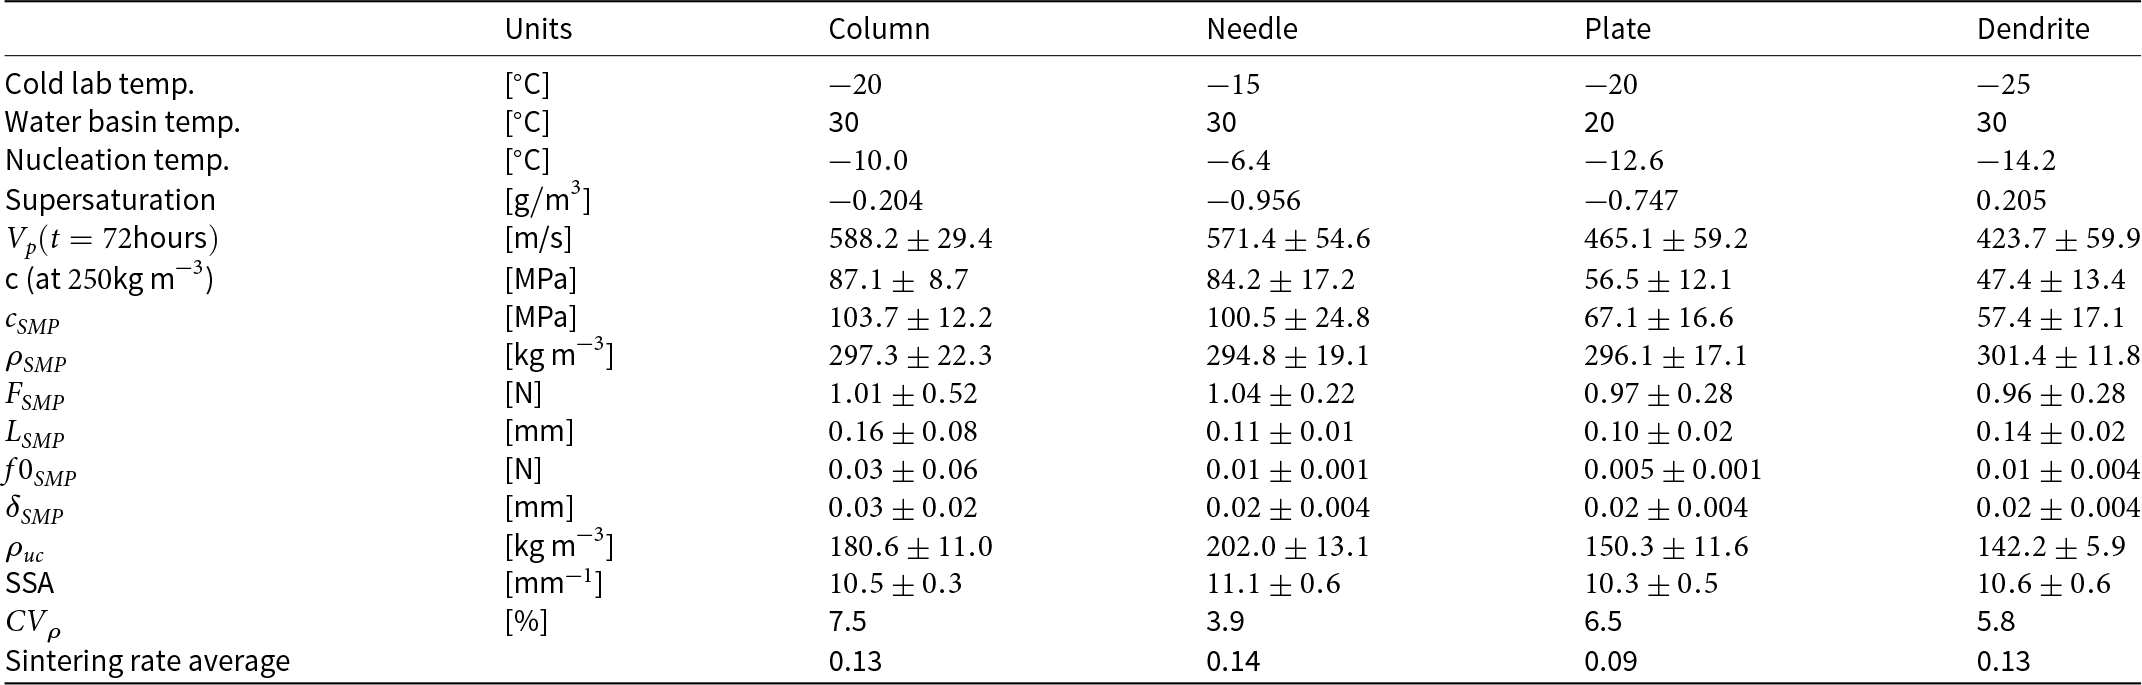
Summary of cold lab and water basin temperatures calibrated for the Boise State University cold lab to obtain the nucleation temperature and supersaturation for each crystal type, as well as the means and standard deviations of inferred snowpack properties after 72 hours at isothermal conditions (p-wave velocity ( $V_p$), stiffness ( $c$) using $250~\mathrm{kg\ m}^{-3}$ initial density, stiffness using SMP density ( $c_{SMP}$), SMP density ( $\rho_{SMP}$), SMP penetration force ( $F_{SMP}$), SMP derived structural element size ( $L_{SMP}$), SMP derived rupture force ( $f0_{SMP}$), SMP derived deflection at rupture ( $\delta_{SMP}$), uncompacted density $\rho_{uc}$, SSA and coefficient of variation (CV) for density). The uncompacted gravimetric density is the density before compacting to $250~\mathrm{kg\ m}^{-3}$.

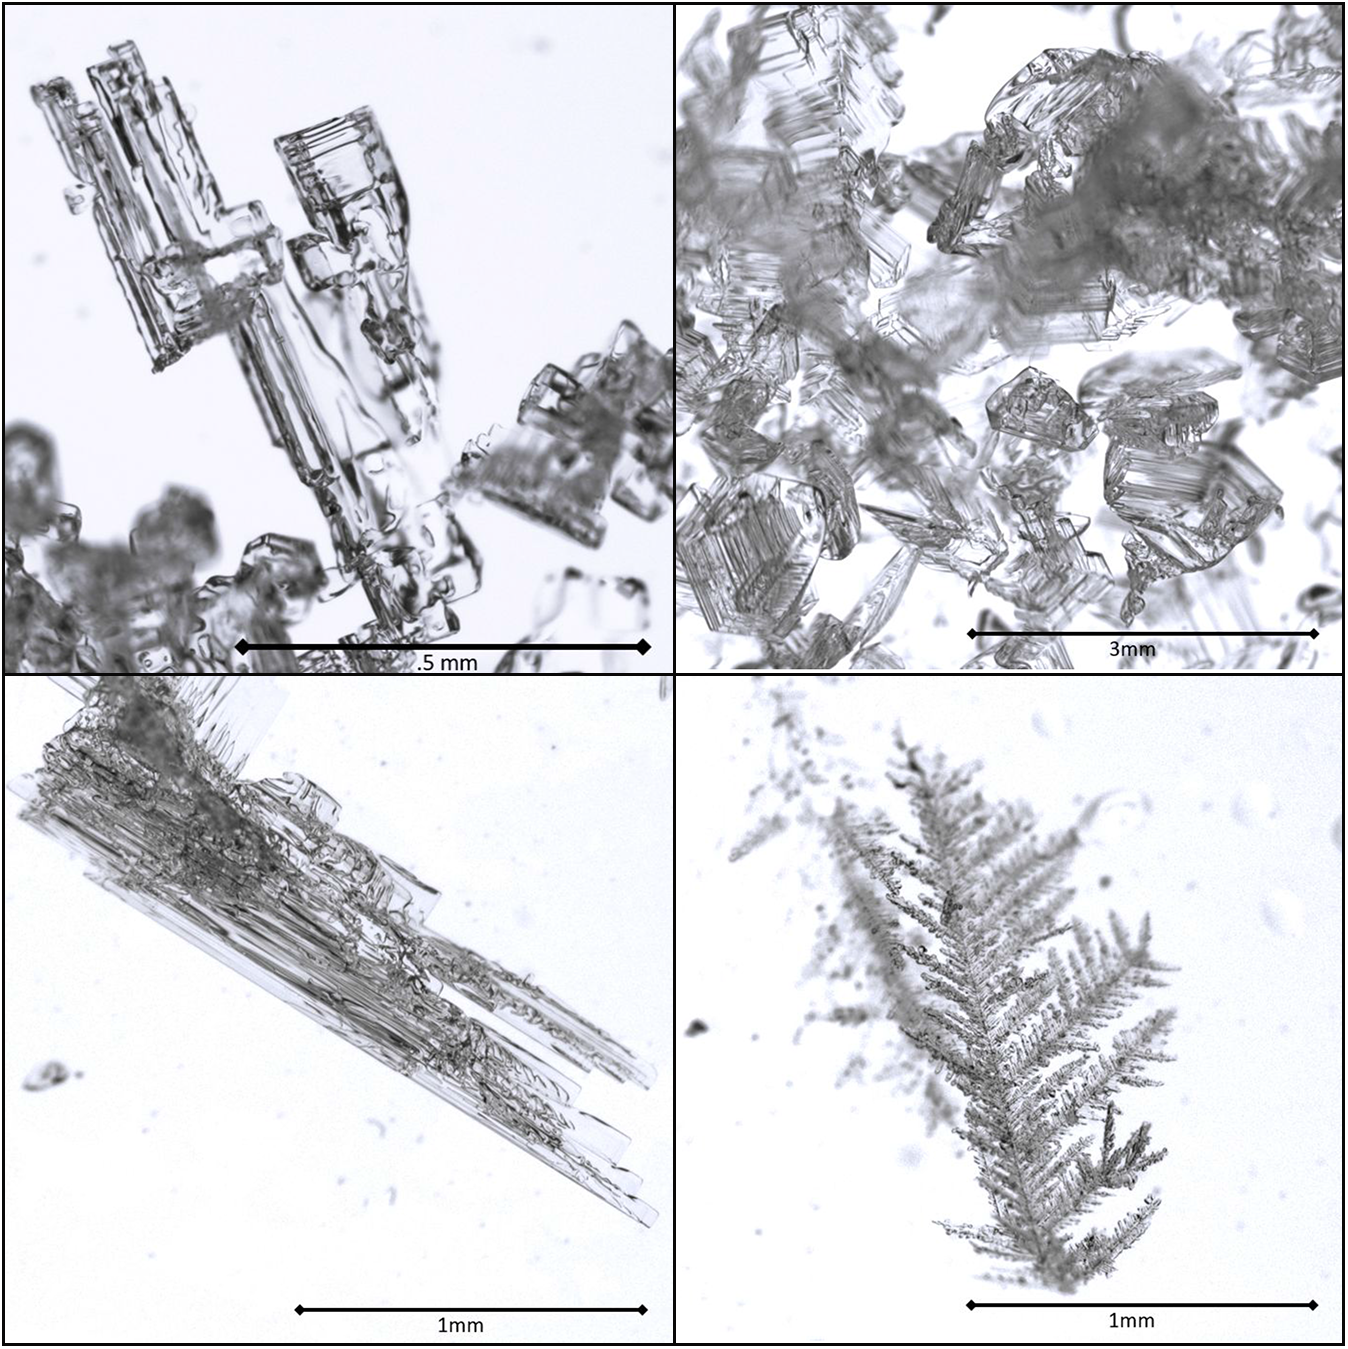
The shapes of the crystals vary from elongated needle- or column-like structures to plate- or branch-like structures (Fig. 1), depending on whether  $a$-axis or $c$-axis growth dominated during formation. These different shapes create different mass-to-volume ratios; thus, uncompacted snow density varies depending on the crystal type (Table 1). Once snow is collected in the snow container, a 100 mm diameter steel cylindrical mold is placed within the container, and is filled with snow from the bottom as the container is pressed into the snow sample. More snow is then gently placed within the cylinder until the desired mass is achieved. The sample is then compacted to a gravimetric density of $\sim250~\mathrm{kg\ m}^{-3}$. In contrast to many other studies, the snow is not sieved when creating the snow samples, so as not to change the snow grain shapes. We achieve the desired snow density using a compaction apparatus built in our lab, and the same compaction technique as McCaslin and others (Reference McCaslin, Mikesell and Marshall2024a) is used. Based on the initial snow mass and volume of the steel cylinder, we compute how much compaction is needed to reach $250~\mathrm{kg\ m}^{-3}$. In this study, we assume compaction banding e.g.,
Barraclough and others (Reference Barraclough2016) is negligible. Once the samples are made, they are stored at
$250~\mathrm{kg\ m}^{-3}$. In this study, we assume compaction banding e.g.,
Barraclough and others (Reference Barraclough2016) is negligible. Once the samples are made, they are stored at  $-$20
$-$20 $^{\circ}$C within the sample mold and covered to prevent mass loss due to sublimation.
High-resolution photos of individual snow crystals created in this study. Clockwise from upper left: hollow columns, sector plates, dendrites and needles. Photos from an SZH10 Olympus microscope with an Infinity8 Lumenera camera attachment.

Sample characterization
Obtaining the bulk density of the snow sample is crucial for this study, and two methods are employed to determine the density of the snow samples. The first is the gravimetric snow density, which is simply the density computed from sample mass and volume. To determine the initial gravimetric density of the snow sample, the sample mass and volume are measured. The measurement of the snow sample mass has an uncertainty of 1 g, and the measurement of the snow sample height after compaction has an uncertainty of 1 mm. The diameter of the snow sample mold is well characterized, and that uncertainty is neglected here. For the desired initial density of  $250~\mathrm{kg\ m}^{-3}$, we allow the initial calculated gravimetric density to vary from 247 to $252~\mathrm{kg\ m}^{-3}$ due to the measurement uncertainties.
The second method to determine density is from Snow MicroPenetrometer (SMP) measurements taken at the end of each experiment. The SMP measures the penetration resistance (force) with a 5 mm diameter cone tip, at a resolution of 0.04 mm. This force signal is a superposition of many snow bond ruptures, snow compaction and snow friction in a vertical direction along the penetration path (Schneebeli and Johnson, Reference Schneebeli and Johnson1999). To infer density from the SMP data, the penetration data is analyzed using software provided by the WSL Institute for Snow and Avalanche Research SLF (SLF) (Grimm and others, Reference Grimm, Löwe, Theile, Schoch and Reisecker2018), which provides density estimates at 1 mm resolution. This second approach allows us to evaluate how homogeneous the density was throughout the sample at the end of the experiment, while the gravimetric density measurements are repeated each time an observation is conducted throughout the experiment. While the SMP was not originally designed for density, and has density errors that are higher than the gravimetric approach, this tool is used to estimate how much variation in density exists within the sample.
Grain shape (crystal type) and size are two more important parameters in this study. SSA is a parameter that represents the surface-area-to-volume ratio of snow. This parameter is influenced by the shape and size of the crystal. For example, dendrites have a larger SSA due to their branches. As a result, dendrite snow crystals have the highest surface-to-volume ratio within a snowpack (McClung and Schaerer, Reference McClung and Schaerer1993). Under isothermal conditions, as snow grains undergo metamorphism and bond formation, sublimation occurs, leading to an increase in vapor pressure near the small particles, branches, or ends of the crystal. Water vapor tends to condense in areas with lower vapor pressure or vapor density (McClung and Schaerer, Reference McClung and Schaerer1993). Consequently, the water vapor deposits preferentially in the concave regions, causing the surface area of the crystal and the SSA to decrease rapidly at first, then slow down at later times (Schleef and Löwe, Reference Schleef and Lowe2013).
We use the InfraSnow SSA Sensor developed by SLF and made by the FPGA Company to measure the SSA of our snow samples non-destructively. The sensor, a lightweight and compact device, is carefully positioned on the top surface of the cylindrical snow sample to ensure that it does not damage the snow surface or sample. The optical sensor within the InfraSnow measures the NIR reflectance by integrating the radiation reflected from the snow surface over a sphere. This integrated value after calibration is used to estimate the SSA (Gergely and others, Reference Gergely, Wolfsperger and Schneebeli2014). The system operates at a wavelength of 950 nm, which is selected to maximize sensitivity to SSA and minimize the influence of impurities within the snow grains (Gergely and others, Reference Gergely, Wolfsperger and Schneebeli2014). The NIR signal effectively penetrates the uppermost few centimeters of the snow, aligning with the area designated for the LUS measurements. It is important to note that the relative uncertainty for SSA measurements taken by the InfraSnow SSA Sensor is estimated to range between 15% and 25% (Gergely and others, Reference Gergely, Wolfsperger and Schneebeli2014). During our experiments, we collected four SSA measurements at each time step and subsequently averaged them to obtain a more reliable result.
Laser ultrasound system
We use an LUS to remotely measure the surface particle velocity normal to the cylindrical snow sample surface as an ultrasonic wave passes by and elastically deforms the surface e.g.,
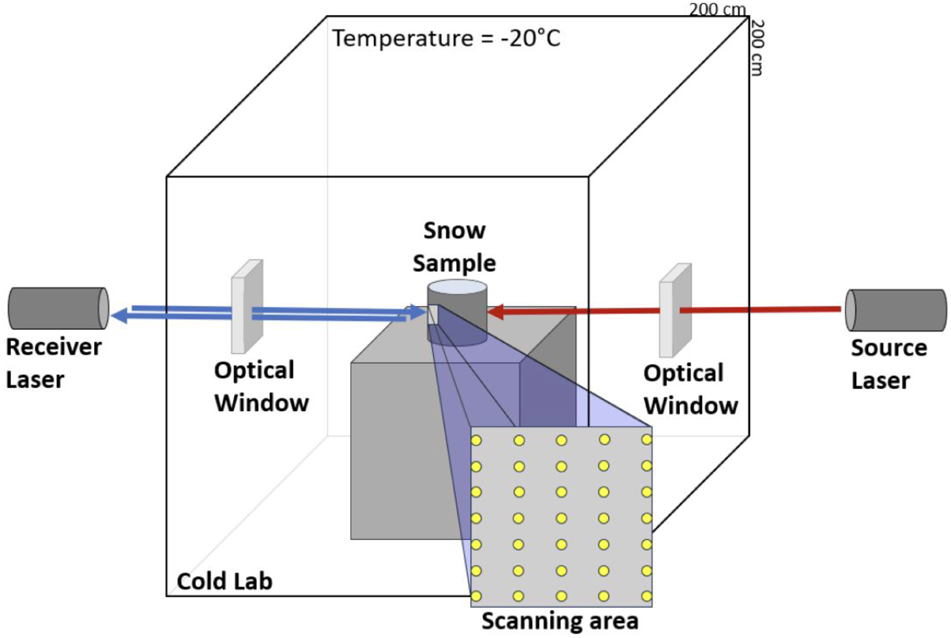
McCaslin and others (Reference McCaslin, Mikesell and Marshall2024a). The LUS consists of a source laser and a receiver laser, with the sample-receiver standoff distance being 0.52 m. The source laser is a pulsed 1064 nm Nd:YAG (yttrium aluminum garnet) laser, model INDI from Spectra-Physics; the pulse repetition rate is 10 Hz. This source laser pulses energy up to 450 mJ with durations from 6 to 9 ns. The radiation emitted from the source laser is absorbed at the surface of the snow sample where the laser is focused (Fig. 2). This absorption causes rapid heating in short intervals, which does not cause melting of the sample; however, the heated region undergoes thermal expansion, and thermoelastic stresses and strains are generated, which propagate as ultrasound (with the range of interest being 1–1000 kHz) throughout the snow sample (Scruby and Drain, Reference Scruby and Drain1990). The receiver laser is a Polytec PSV-400 Scanning Vibrometer (PSV) (McCaslin and others, Reference McCaslin, Mikesell and Marshall2024a), which uses interferometry to measure  $\mu \mathrm{m}$-scale displacements and has a linear frequency response from the acoustic range to the high ultrasonic range.
A LUS measurement is collected after removing the cylindrical sample mold used for storage. The first time the mold is removed, we gently place reflective tape on the snow surface to increase the reflected PSV laser light and thus signal-to-noise ratio (SNR) (McCaslin and others, Reference McCaslin, Mikesell and Marshall2024a); after a short time, this tape adheres to the sample surface and remains attached to the same sample area throughout the entire experiment. The PSV spot size is  $1~\mathrm{mm}^2$, and a motorized PSV laser head can move this spot with an accuracy well below the spot size. The LUS scanning region on the snow sample covers an area of $1~\mathrm{cm}^2$, and we collect an ultrasound time-series at 35 different points over this scanned area (Fig. 2). The Polytec acquisition software controls the scanning laser head, triggers the source and enables further data processing and visualization. Because the source and receiver lasers are time synced, we average 100 acquisitions at each of the 35 points to suppress incoherent measurement noise.
Diagram of the receiver and source laser outside of the cold lab. The 35 scan points on the snow sample are represented as yellow dots and cover an area of  $1~\mathrm{cm}^2$.

P-wave velocity estimation
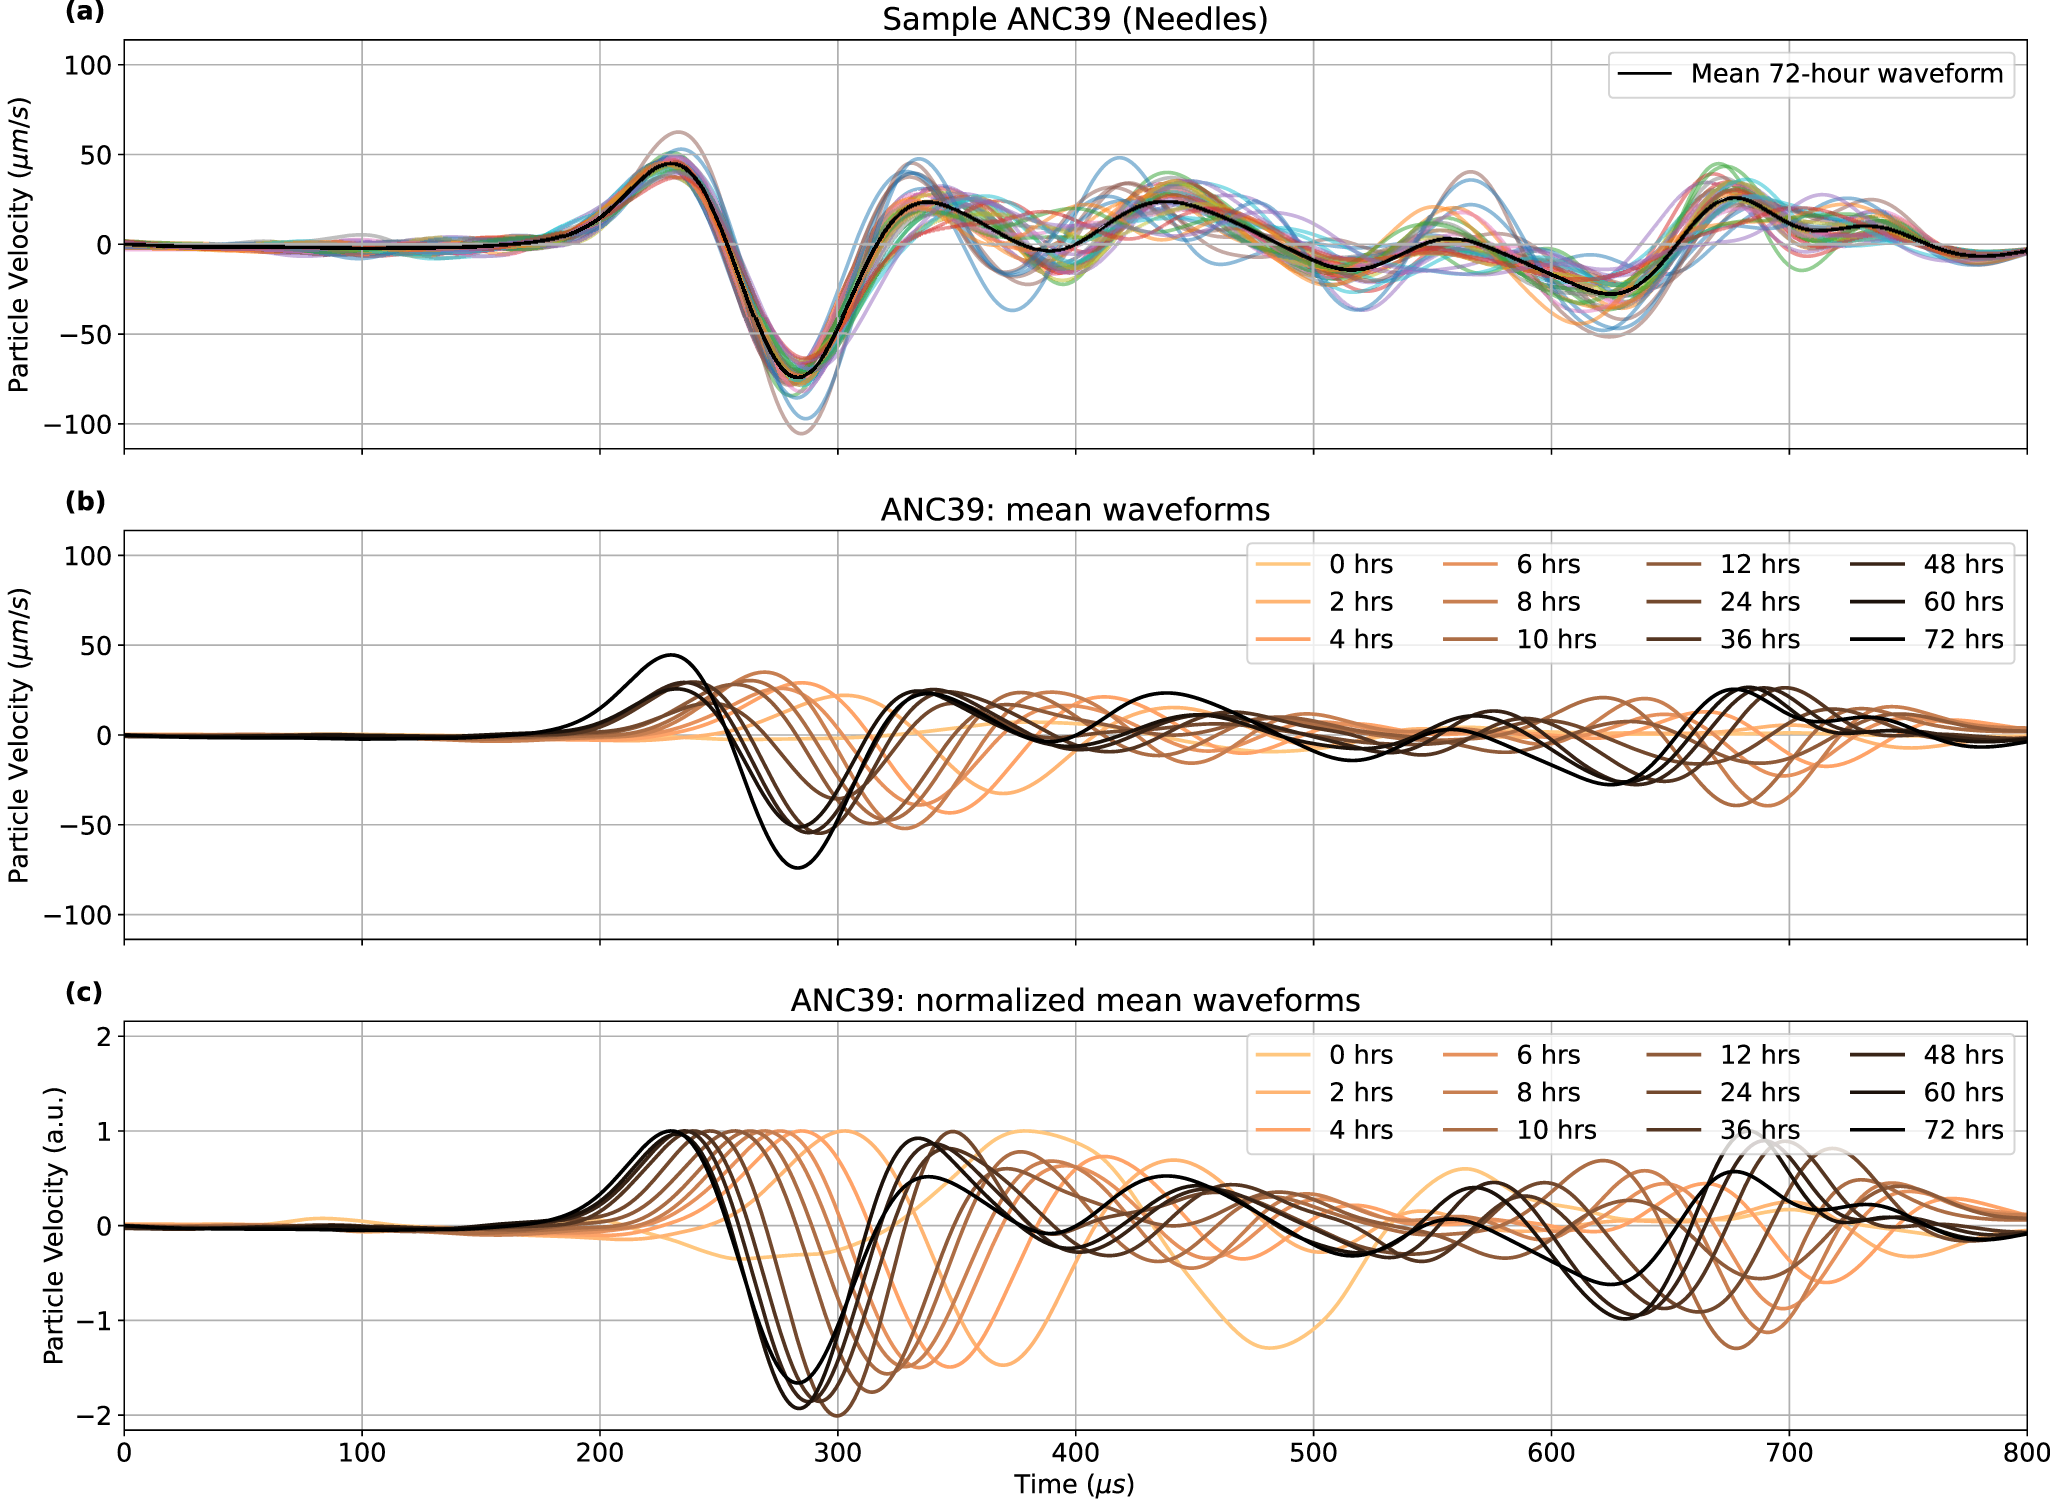
The LUS provides times series of the surface particle velocity at each of the 35 scan points throughout the sintering experiment (Fig. 3a). To further enhance the direct p-wave SNR, the waveforms from all 35 points are averaged together after tapering 30% on each end of the waveform using a cosine taper and then bandpass filtering between 3 and 20 kHz. Figure 3a shows the mean waveform (black) from one sample of needle crystals (ANC39) after 72 hours of sintering. It is apparent from the 35 individual waveforms (colored) that the direct p-wave is quite consistent and that the later arriving waves, which have reflected from the boundaries of the cylinder, vary considerably. This is because the direct p-wave can be assumed as a plane wave over the  $1~\mathrm{cm}^2$ scanning area, while the reflected waves arrive from quite different angles at different points in the scanning area.
(a) All 35 waveforms in multiple colors and the mean waveform (black) for sample ANC39 after 72 hours of sintering. (b) The mean waveforms for samples ANC39 at each of the measured sintering times. (c) The normalized mean waveforms.

To infer the p-wave velocity, the p-wave arrival time must be estimated, and using the known propagation distance (i.e., the diameter of the cylindrical snow sample), the velocity can be computed. To estimate the p-wave arrival time, we compared both automated and hand-picked p-wave arrivals. For automated picking, we used the Akaike Information Criterion (AIC) method (Kurz and others, Reference Kurz, Grosse and Reinhardt2004), which has been shown to be effective for detecting ultrasound wave propagation through concrete. Kurz and others (Reference Kurz, Grosse and Reinhardt2004) highlight that AIC is particularly reliable for ultrasound applications due to its ability to enhance SNR, making it a preferred choice for picking in this context.
Equilibrium experiments
To observe the equilibrium metamorphism and sintering process and its effects, observations (i.e., mass, volume, SSA and LUS) are recorded periodically over 72 hours after the sample is created, with the sample being created immediately after there are enough snow crystals produced to fill the mold. To capture the variability within each snow crystal type and its effect on p-wave velocities, six samples are tested for each snow crystal type (i.e., we complete the 72 hour test on six different samples made of the same crystal type). All samples are created with a gravimetric density of  $250~\pm 3 \mathrm{kg\ m}^{-3}$ (Table 1).
Within the first 12 hours, observations are made every 2 hours because of the rapid initial metamorphism, which we expect to slow as the sintering process progresses and the grains become more rounded (van Herwijnen and Miller, Reference van Herwijnen and Miller2013) and stable. After the first 12 hours, observations are collected every 12 hours and cease at 72 hours. During the very first LUS acquisition, the reflective tape is attached to the receiver side of the snow sample, and the snow sample is not moved after that. An example of repeated mean LUS times series for sample ANC39 is presented in Fig. 3b and c. Figure 3b displays the raw amplitudes, while Fig. 3c displays the amplitudes normalized to the maximum of the first arrival. In this study, we analyze only the normalized data for arrival time information, and we neglect the absolute amplitude information.
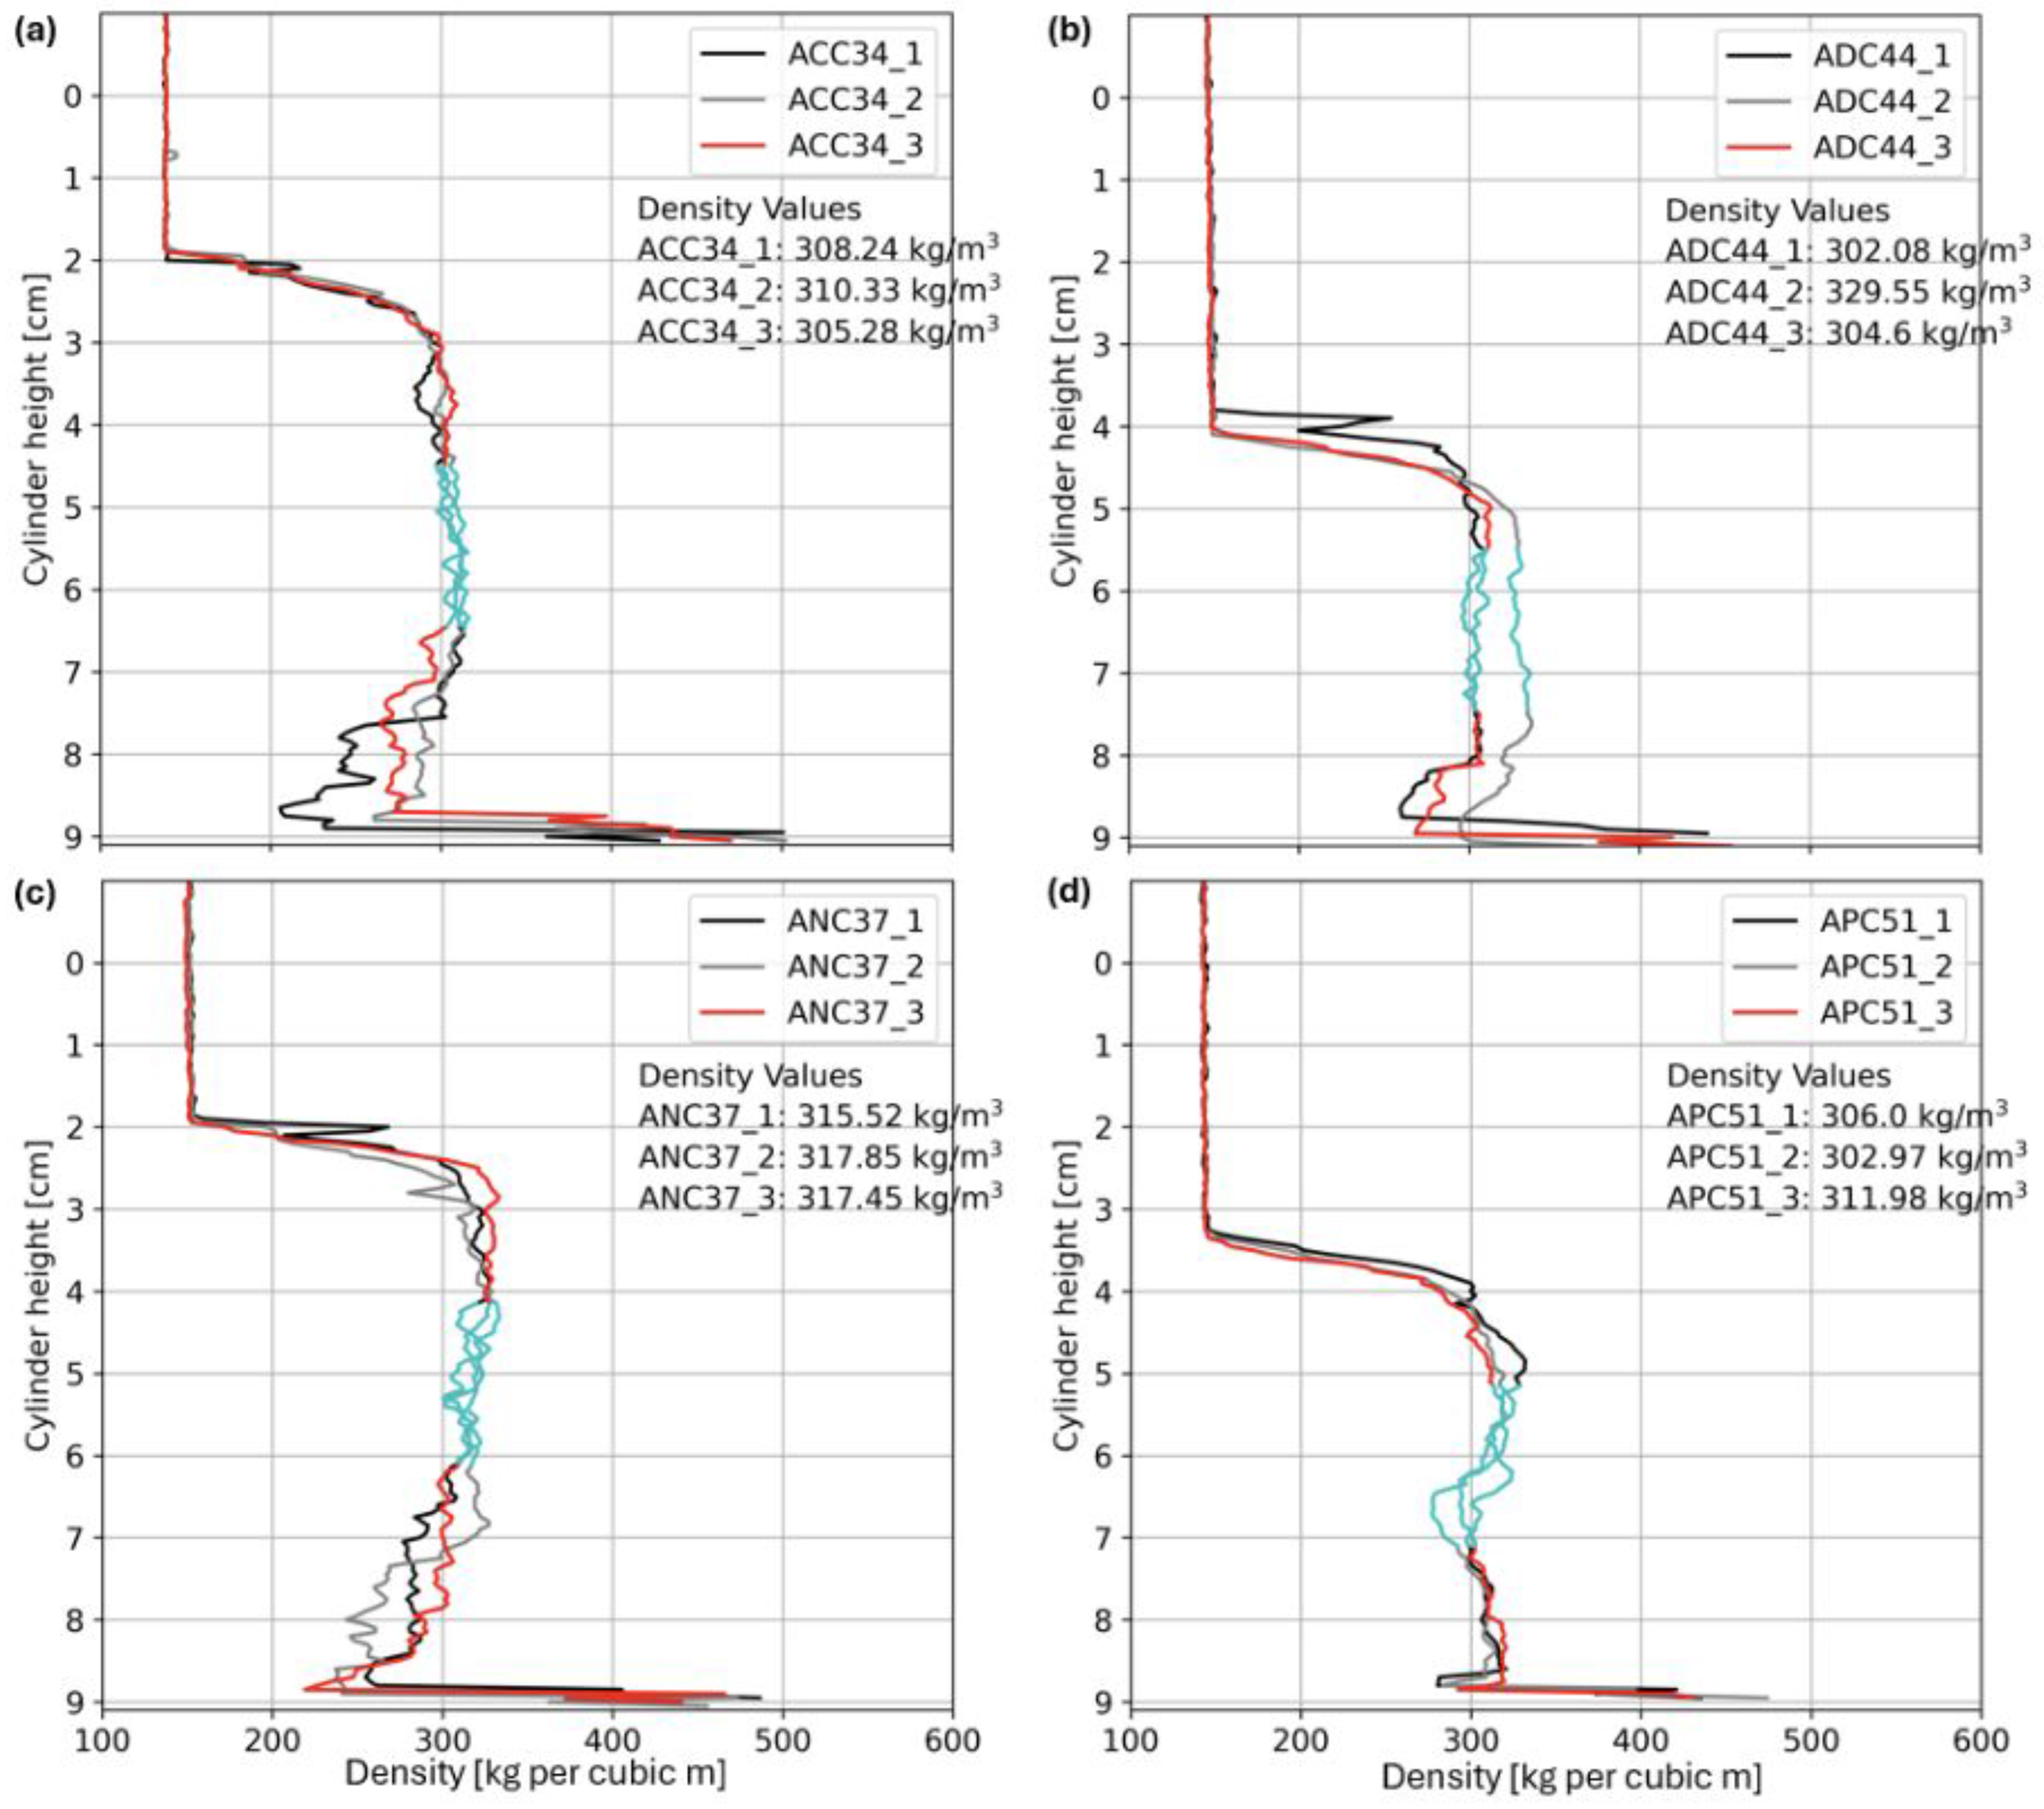
The SSA data are collected immediately after each LUS data collection. The SSA measurements are reported in Table 1. To ensure that no mass is lost during the sintering processes (i.e., in between measurements), the snow sample is encased by a Styrofoam container. The container is then removed during each observation period. At the end of each 72 hour experiment, gravimetric density measurements were again taken, followed by destructive SMP observations in each sample, which were used to infer final average density values in the area  $\pm1~\mathrm{cm}$ above/below the LUS data collection point height (McCaslin and others, Reference McCaslin, Mikesell and Marshall2024a). To characterize the density variability in the sample, we considered the coefficient of variation (CV) of the density of each snow crystal type at 72 hours using the SMP density. For each crystal type, we calculated the mean density at three penetration points, providing a total of 15 penetration points for each crystal type. Using these mean values, we compute the crystal type mean and standard deviation and then the coefficient of variation (Table 1). Additionally, examples of these SMP density profiles are presented in Fig. 4. Additional parameters derived from the SMP measurements (Löwe and van Herwijnen, Reference Löwe and van Herwijnen2012) are also provided in Table 1.
Three vertical density profiles collected with the SMP on the same sample of (a) column, (b) dendrite, (c) needle and (d) plate snow crystals. Cyan coloring indicates the  $\pm1~\mathrm{cm}$ zone above and below the LUS data point. The density mean $\rho_{SMP}$ and coefficient of variation $CV_{\rho}$ (Table 1) are computed in this zone using all three profiles over this height range.

Results
We measured mass and volume during each data acquisition period, and we observed no significant changes in values across any sample. Thus, the gravimetric density of each sample did not change. The SMP density measurement after 72 hours gave mean values in the range 290–300  $\mathrm{kg\ m}^{-3}$ (Fig. 4). For each snow crystal type, the CV values are small, a max of 7.5%, indicating a consistent density throughout the SMP profiles. However, because these values were above the gravimetric calculation of $250~\mathrm{km\ m}^3$, we checked the expected isothermal densification under the experimental conditions. We use a densification model from Marshall and others (Reference Marshall, Conway and Rasmussen1999) to predict the expected isothermal densification of the snow samples over 72 hours. The model predicts that the initial $250~\mathrm{kg\ m}^{-3}$ snow samples experienced a minimal densification to $252~\mathrm{kg\ m}^{-3}$ over 72 hours, largely due to the lack of overburden stress, the cold temperature ( $T_{air}=-20^oC$), and relatively high initial density.
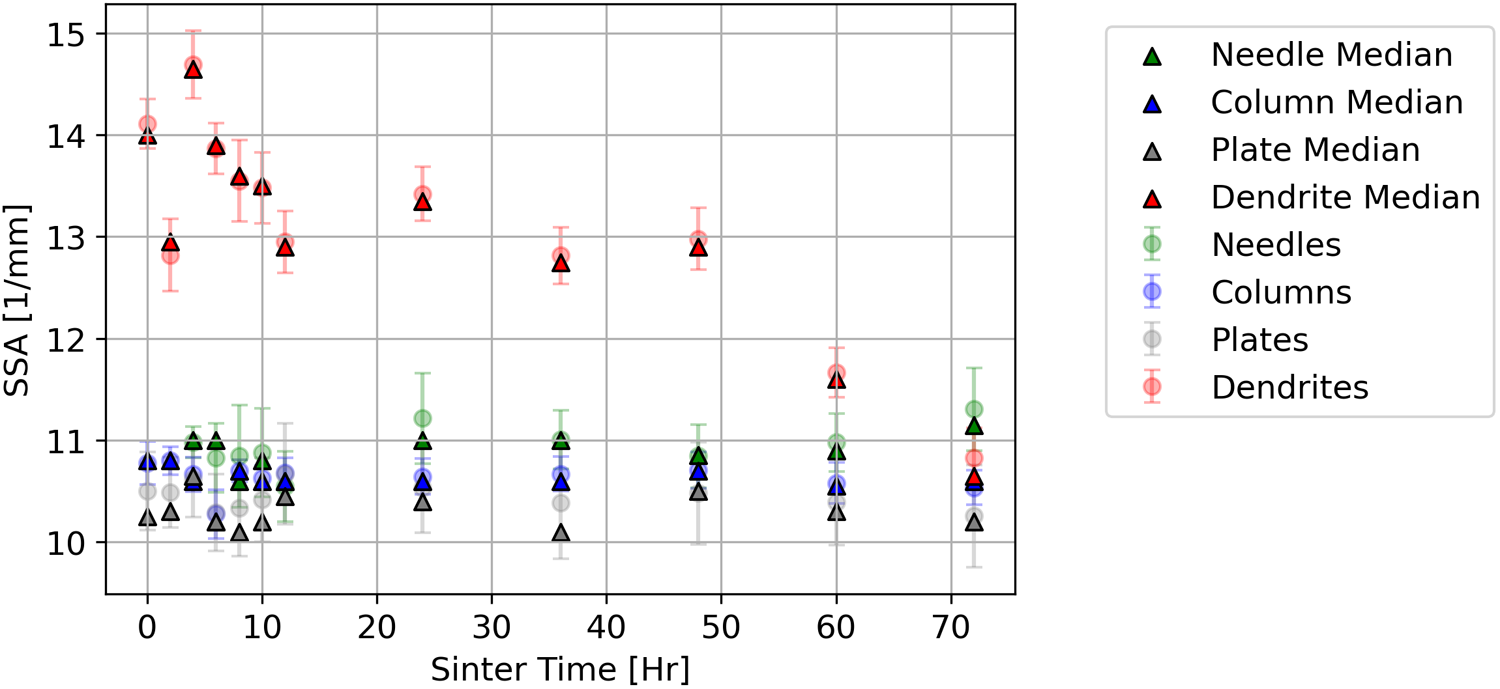
Because equilibrium metamorphism leads to more rounded grains and bond formation, we expect to see changes in microstructure and p-wave velocity throughout the sintering experiments. To assess the temporal changes in snow crystals, we examined the SSA data collected over a 72 hour period across four different snow crystal types (Fig. 5). We plotted the mean value and standard deviation derived from 4 repeat measurements at a given observation time from 6 repeated experiments for each snow crystal type, hence 24 measurements per crystal type at one observation time. The mean SSA values for needles, columns and plates remain relatively constant throughout the duration of each experiment. In contrast, dendritic snow had a higher initial SSA, which decreased rapidly with time, ultimately converging to an SSA value similar to the other crystal types after 72 hours. The vapor pressure gradients present in the unstable branch-like shape of dendritic snow crystals lead to the rapid destruction of the original structure. Simultaneously, new bonds formed between existing crystals as water vapor was deposited. In contrast, the other three crystal types do not undergo large changes in SSA; the final SSA values after 72 hours are presented in Table 1. We see that all crystal types reach a stable SSA of approximately 10–11 mm $^{-1}$ under the $-$20
$-$20 $^{\circ}$C isothermal conditions, with a max standard deviation of $\pm~0.6~\mathrm{mm}^{-1}$.
The mean and standard deviation of SSA from the SLF InfraSnow Sensor are analyzed as a function of sintering time. Each snow crystal type is based on data from six repeat experiments, with four separate SSA measurements taken during each experiment at various observation times. This results in a total of 24 SSA measurements for each observation time, from which the mean and standard deviation are calculated. Additionally, the triangles on the graph represent the median value for each set of measurements, providing a clear overview of the SSA trends across different snow crystal types as sintering progresses.

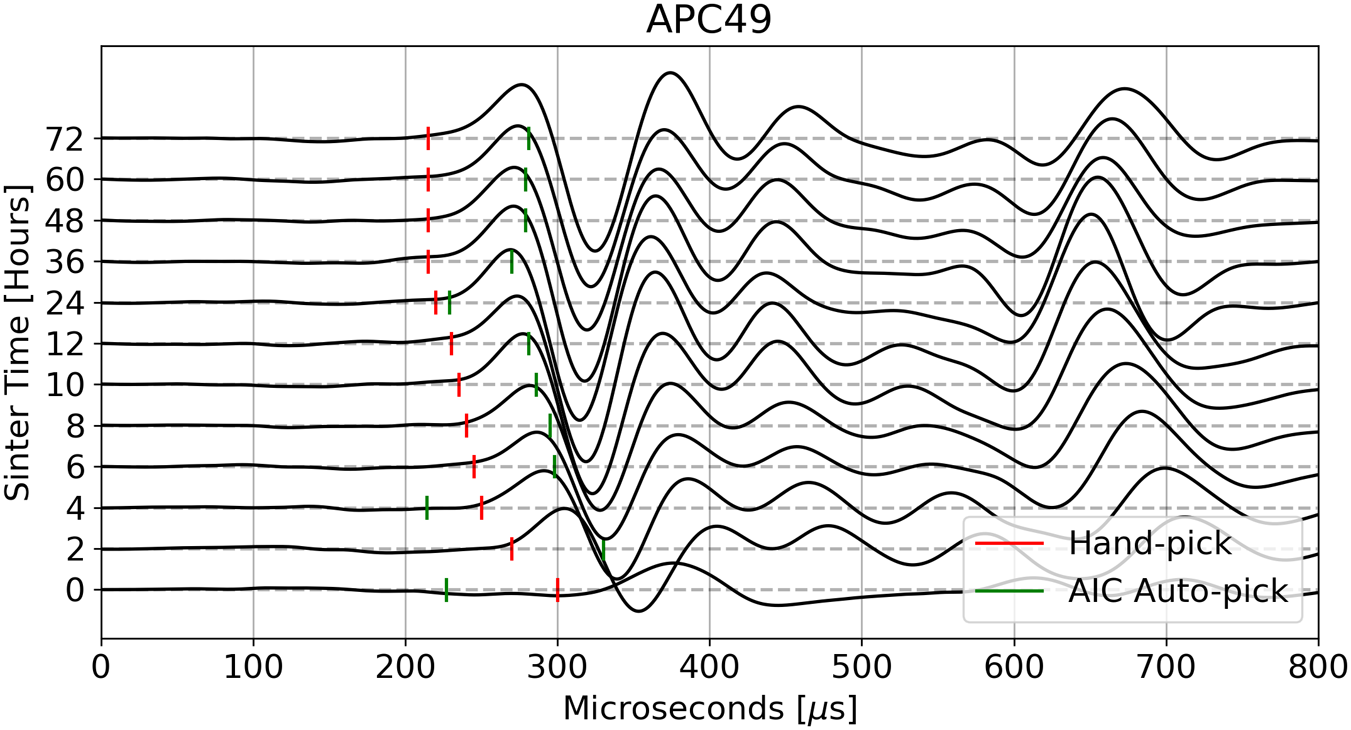
In addition to potential changes in SSA, we are also interested in grain bond formation, which would lead to greater p-wave velocities; thus, we investigated the p-wave velocity as a function of time. We first performed a comparison between the AIC automatic picking algorithms with hand-picked p-wave arrivals for dendritic samples. We optimized the parameters for the AIC auto-picking process. We determined that the AIC method produced consistent results at later sintering times. However, at shorter sintering times, there was a maximum deviation of 45% compared to the manually selected values (e.g., Fig. 6). The large differences associated with the AIC method at early observation times suggest that AIC picks could lead to inaccuracies in velocity estimations compared to hand picks.
Example of p-wave first arrival picks for sample APC49 (plate snow sample). The green line represents the AIC pick, and the red represents the hand-picked p-wave arrivals.

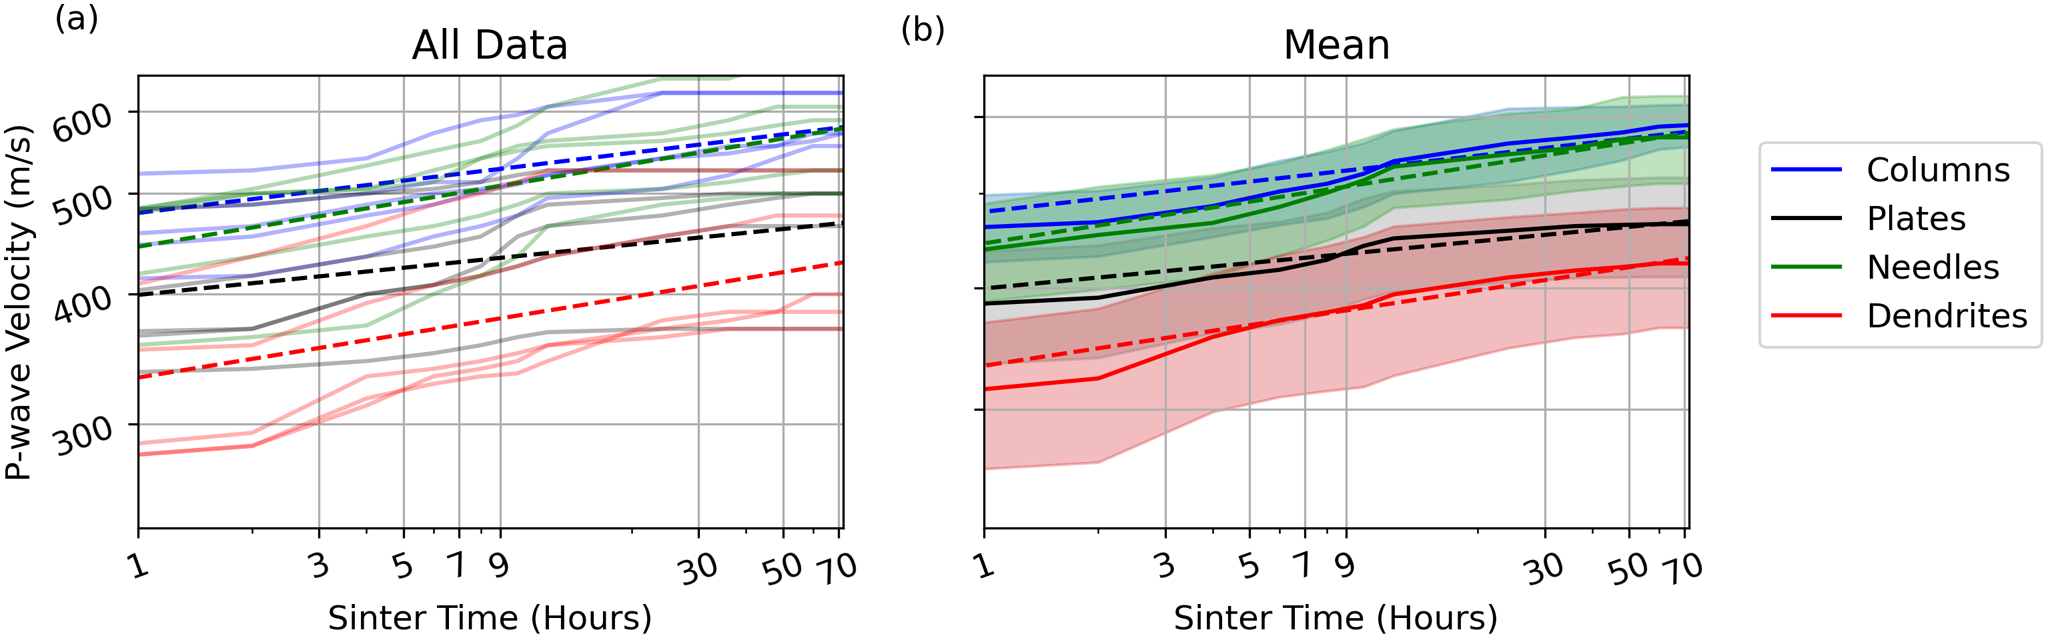
We expect bond formation during sintering to increase the snow stiffness and thus the p-wave velocity. At each observation time, we averaged the 35 independent p-wave velocity measurements in one snow sample (Fig. 7a). At each observation time, we have six repeated average p-wave velocities from the six samples of each snow crystal type.
(a) Mean p-wave velocities of the six individual samples per grain type versus sintering time. The p-wave velocity at a given time is the average of the sample’s 35 measurement points. (b) Mean p-wave velocities by snow crystal type versus sintering time (i.e., mean value from the six individual samples) with the shaded areas indicating the one-sigma standard deviation. The dashed lines in (a) and (b) represent the power law fits for each snow type in (b).

We observe that p-wave velocities increase in all snow crystal types and all samples over time under isothermal conditions.
To simplify interpretation, we averaged the mean values at each time point across the six repeated snow samples for each crystal type (Fig. 7b). The shaded regions indicate the one-sigma standard deviation around each mean. During the initial approximately 20 hours, all crystal types showed an increase in p-wave velocity. As time progressed, the rate of change slowed for each type, but not all reached the same velocity. Specifically, dendrites and plates exhibited a slower increase, while columns and needles continued to show increases even after 72 hours. After this period, columns and needles attained a mean velocity of about 580 m/s, whereas plates reached 465 m/s and dendrites 423 m/s (Table 1).
We fit a power law to the p-wave modulus versus sintering time data, employing the same methodology as van Herwijnen and Miller (Reference van Herwijnen and Miller2013). The sintering rate is  $b$ in the power law $c = at^{b}$, with $c$ the p-wave modulus and $t$ the sintering time. $b$ exhibited average values that varied by grain type. Specifically, the plates had the lowest sintering rate at $b=0.09$, while the needles had the highest at $b=0.14$. These sintering rate values for samples with a density of $250~\mathrm{kg\ m}^{-3}$ are comparable, albeit slightly lower, to the
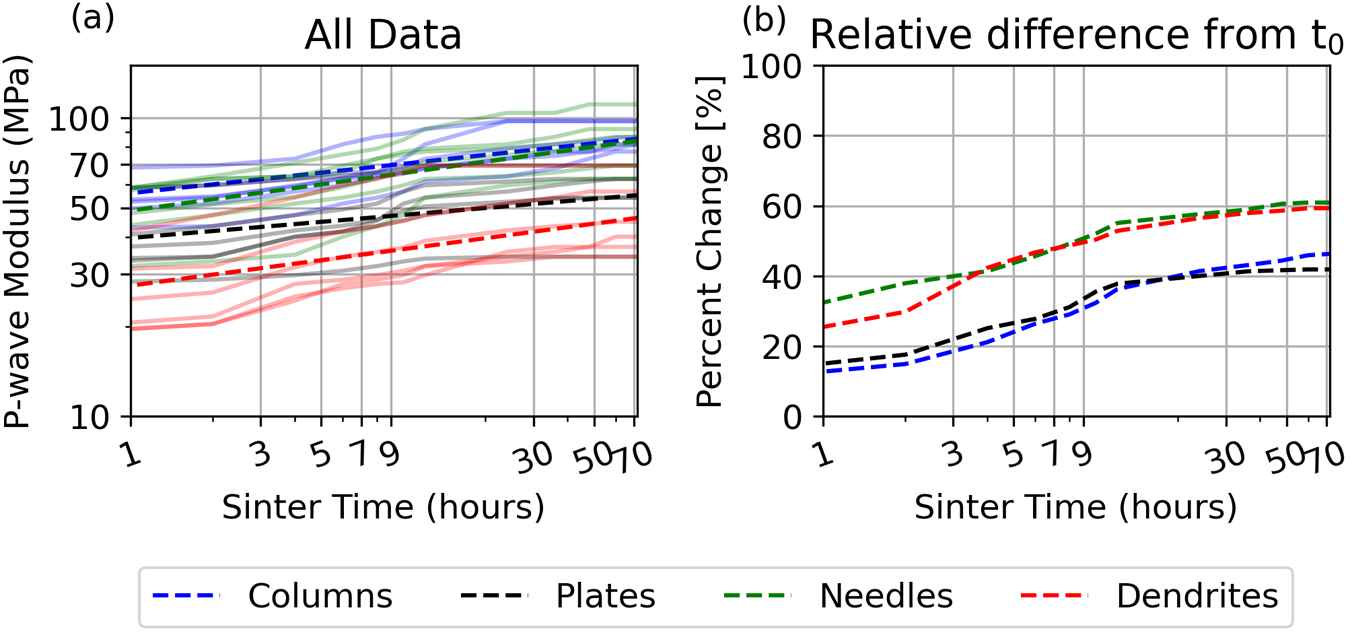
  $200~\mathrm{kg\ m}^{-3}$ sintering rates reported by van Herwijnen and Miller (Reference van Herwijnen and Miller2013), who demonstrated that sintering rates decrease as density increases. All p-wave moduli are listed in Table 1. Furthermore, we plotted the relative sintering difference with time as a percentage of the initial rate at time zero, displayed in Fig. 8b.
(a) Represents mean p-wave modulus ( $c$) estimated from mean p-wave velocity and density of $250~\mathrm{kg\ m}^{-3}$, with dashed lines representing the power law fitting. (b) Represents the relative p-wave modulus difference through time for each snow grain type.

Discussion
Compared to the gravimetric density measurements at the beginning and end of the experiment, the measured SMP density is more dense, likely due to bond formation, since the SMP directly measures penetration force, rather than density. This could indicate an increase in stiffness independent of density, but more SMP measurements throughout the time series, possibly using larger or more samples, would be required to show this conclusively. The SMP is designed to measure snow micromechanical properties, not density, and density is derived from the penetration force signal and recorded in Table 1.
It is interesting that samples of different grain types all reach approximately the same SMP density value and SSA value. According to Schleef and others (Reference Schleef, Löwe and Schneebeli2014b), this likely occurs as a result of the increased densification coming from snow metamorphism.
To give further insight into stiffness, we assessed the p-wave velocity measurements and the associated modulus. Our experiment provides a complementary dataset to Gerling and others (Reference Gerling, Löwe and van Herwijnen2017), whereby we hold density constant (using initial manual compaction) and investigate changes in p-wave modulus during the 72 hours following formation of different initial snow grain types.
In our study, we do not use a sieve, and we do not expect significant anisotropy in the bulk snow samples due to the assumed random grain orientation during deposition and isothermal environmental conditions. In contrast to Gerling and others (Reference Gerling, Löwe and van Herwijnen2017), we measured the p-wave speed in the cross-axial direction, and we simplified the velocity-modulus relationship to
 \begin{equation}
V_p = \sqrt{\frac{c}{\rho}},
\end{equation}
\begin{equation}
V_p = \sqrt{\frac{c}{\rho}},
\end{equation}where  $c$ is the general isotropic p-wave modulus, as discussed in (Gerling and others, Reference Gerling, Löwe and van Herwijnen2017). Within this framework, we measured changes in the p-wave modulus as they increase throughout the experiment (Fig. 8) and discuss the p-wave values observed after 72 hours of sintering for each snow crystal type (Table 1).
As evidenced in Fig. 8, the p=wave modulus in each snow crystal type increased with sintering time, indicating that bond formation occurs. What is striking is that even though the SSA (Fig. 5) reached a similar value after 72 hours of sintering for all snow crystal types, the mean p-wave modulus values do not achieve similar values (Table 1), with significant differences to crystals that grew preferentially along the  $a$-axis compared to the $c$-axis. The p-wave modulus of columns and needles is nearly 50% larger than that of dendrites.
The variation in sintering rate observed in the results can be attributed to the differences in crystal type. As illustrated in Fig. 1, needle-shaped snow grains are smaller in surface area size compared to plate-shaped grains; while the length of the needle grains is similar to that of the plates, their width is significantly narrower. The van Herwijnen and Miller (Reference van Herwijnen and Miller2013) model states that sintering rates decrease with increasing grain size; here we show significant differences between needles/columns and plates/dendrites, indicating that the predominant crystal axis of growth during formation can impact the modulus. Having more detailed microstructural information, such as scans from a microCT, which can be performed non-destructively throughout the experiment, would have allowed information about bond growth to be used. While this study indicates that grain morphology of new snow can impact mechanical properties due to a potential grain shape control on sintering and evolution of elastic modulus, more work is needed with non-destructive microstructure techniques that are sensitive to bond growth.
Snowpack models that track changes in microstructure and mechanical properties, such as SNOWPACK and CROCUS, might be improved by including information about estimated new snow precipitation particle type. Other conditions in the snowpack, such as temperature gradient metamorphism and melt events, can change mechanical properties to a greater degree than the modulus changes observed in this study, and therefore, future LUS experiments should target these snow types as well. Future LUS experiments should couple the p-wave velocity observations with non-destructive tests that are sensitive to bond formation, such as microCT. Kinetic metamorphism that occurs when snow is under a large temperature gradient condition would be a logical next step with this technique, and since this approach creates anisotropic crystals, observations will need to be made along different axes as well.
Under the conditions in this study ( $-$20
$-$20 $^{\circ}$C constant temperature), we note that the p-wave modulus achieved after 72 hours appears to depend on the initial snow crystal type. Thus, empirical relationships to estimate moduli from density/porosity alone e.g.,
Sidler (Reference Sidler2015); Capelli and others (Reference Capelli, Kapil, Reiweger, Or and Schweizer2016) may not represent snow stiffness with sufficient accuracy for some applications. Several of these models have been developed using sieved and/or rounded snow, which leads to highly homogeneous initial grains.
$^{\circ}$C constant temperature), we note that the p-wave modulus achieved after 72 hours appears to depend on the initial snow crystal type. Thus, empirical relationships to estimate moduli from density/porosity alone e.g.,
Sidler (Reference Sidler2015); Capelli and others (Reference Capelli, Kapil, Reiweger, Or and Schweizer2016) may not represent snow stiffness with sufficient accuracy for some applications. Several of these models have been developed using sieved and/or rounded snow, which leads to highly homogeneous initial grains.
Conclusion
We utilized a non-contacting LUS to non-destructively infer snow p-wave modulus through time during a sintering experiment under isothermal conditions. An artificial snow maker was used to create homogeneous cylindrical snow samples consisting of a single snow crystal type (dendrite, needle, plate or column). Each snow crystal type was validated with high-resolution photography. Each snow sample was manually compacted to create an initial density of  $250~\mathrm{kg\ m}^{-3}$, and an SMP was used at the end of the experiment to infer the vertical density profile over the region probed by the LUS. For each snow sample, LUS and SSA were regularly collected over 72 hours. The p-wave first arrival times from the LUS time series were used to infer p-wave velocity. The p-wave velocities were then used to calculate the p-wave modulus. The p-wave modulus ( $c$) increased with sintering time and appeared linear when approaching 72 hours. The initial p-wave modulus depends on the crystal type, with significant differences in the moduli values after 72 hours. These results suggest that the microstructure (specifically the snow crystal type) and the sintering process affect the absolute value of elastic moduli within the environmental conditions studied here.
Although density can be used to infer the elastic modulus (Gerling and others, Reference Gerling, Löwe and van Herwijnen2017), we show that the microstructure of snow, that is, grain shape and grain size, is also significant in determining the p-wave modulus.
We clearly show here that samples with different initial crystal types and the same density, even when given time to sinter, can have significantly different stiffnesses after 72 hours. Future work should study similar changes in elastic properties due to snow metamorphism under various temperature gradients. Furthermore, this type of work would benefit from micro-computed tomography (MicroCT) scans to obtain more information regarding the grain shape/size, microstructure, elastic modulus and porosity of the snow samples.
This understanding allows for a more comprehensive assessment of snow behavior beyond density alone.
Data availability statement
All SMP, LUS and SSA data within this manuscript are publicly available in McCaslin and others (Reference McCaslin, Mikesell, Marshall and Courville2024b).
Acknowledgements
This research is based upon work supported in part by the Cold Regions Research and Engineering Laboratory (CRREL) award #W913E520C0017, led by HPM. JCM was supported by the SMART Scholarship funded by: OUSD/R&E (the Under Secretary of Defense Research and Engineering), National Defense Education Program (NDEP)/BA-1, Basic Research. TDM acknowledges that the preparation of this article was partially supported by the basic funding to NGI from The Research Council of Norway.


 Open access