


Introduction
The use of geothermal energy is on the rise, as technology improves and the need for CO2 emission reductions and sustainable energy sources becomes more urgent every day. Geothermal energy can be used for the generation of electricity, and also for heat needed for various industrial processes and heating of, e.g., buildings. Worldwide, the installed geothermal electric capacity increased from 7000 MWe in 1995 to over 20,000 MWe in 2015, and for direct use (heating) the installed capacity increased from 10,000 MWt in 1995 to 70,000 MWt in 2015 (Lund et al., Reference Lund, Bertani and Boyd2015). In the Netherlands the first successful (deep, >1 km) geothermal well was drilled in 2006 at the Bleiswijk Geothermie site. The number of operational doublets increased from 14 in 2017 to 18 in 2019 (excluding the Californië doublets and Heerlen Mijnwater) with a total installed capacity of 194 MWt (Fig. 1A; Table S1 in the Supplementary Material available online at https://doi.org/10.1017/njg.2019.6). Also over 40 exploration licences have been granted (Ministry of Economic Affairs and Climate Policy, 2018). The doublets mostly target porous formations at depths between 2 and 2.7 km with fluid temperatures of 60–100 °C, using this hot water for heating of greenhouses. The current contribution of geothermal energy to the total heat production in the Netherlands is small (0.5%), but is expected to increase significantly (>20%) over the coming decades (Stichting Platform Geothermie et al., 2018). These ambitions require the number of doublets to increase to tens to hundreds. As the Netherlands is now on the brink of a significant increase in geothermal projects, it is important to assess potential hazards associated with these projects. One of these potential hazards is the occurrence of felt and/or damaging induced seismic events (earthquakes).
Overview of geothermal doublets, oil and gas fields, and seismicity in the Netherlands. (A) Geothermal doublets in the Netherlands and their current status (per 1 June 2019). See Table S1 (in the Supplementary Material available online at https://doi.org/10.1017/njg.2019.6) for more information on the doublets. (B) Main structural elements in the subsurface of the Netherlands and boundary fault (thick lines). The thin lines indicate faults in the Permian formations (www.nlog.nl). Oil and gas fields are shown (www.nlog.nl) as well as natural seismicity (red) and induced seismicity (blue) (source: www.knmi.nl, 6 August 2019). AB: Ameland Block; BFB: Broad Fourteens Basin; CNB: Central Netherlands Basin; FP: Friesland Platform; GH: Groningen High; LBM: London–Brabant Massif; LSB: Lower Saxony Basin; LT: Lauwerszee Trough; PB: Peel Block; RVG: Ruhr Valley Graben; TIJH: Texel–IJsselmeer High; VB: Vlieland Basin; WNB: West Netherlands Basin.
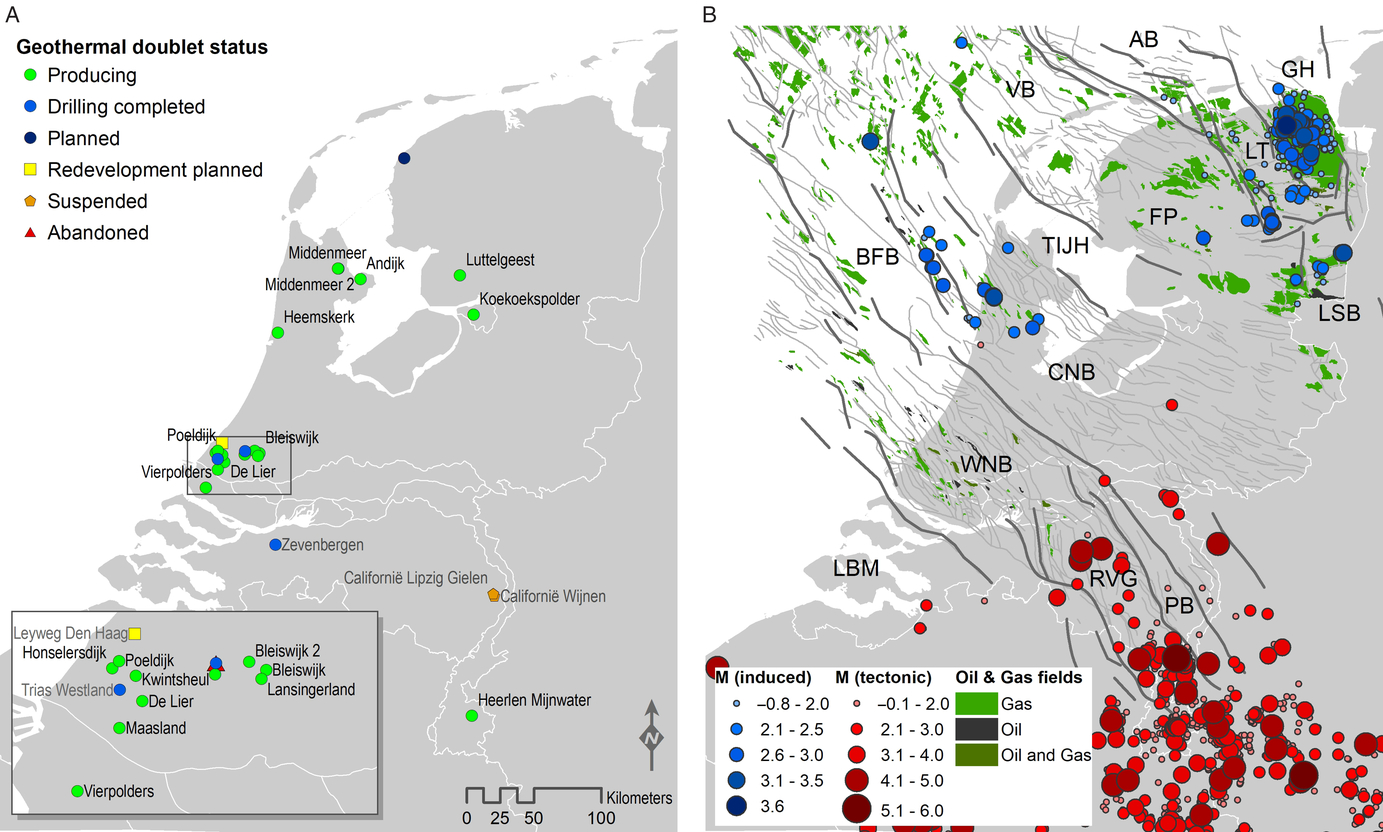
Induced seismic events have been observed in a number of geothermal projects in other countries, although many systems have been operational for decennia without any seismicity. The occurrence of induced seismicity is not necessarily a problem. The majority of seismic events are not large enough to be felt at the surface in the first place. Also some geothermal projects are situated in remote areas, and/or in areas, such as Iceland, which already have high natural seismicity rates. Here induced earthquakes would go unnoticed and be of no concern, unless event magnitudes become so large that they are felt strongly (Flóvenz et al., Reference Flóvenz, Ágústsson, Guðnason and Kristjánsdóttir2015). However, in a number of geothermal projects induced seismicity has posed a (serious) problem, causing societal unrest and/or damage to housing and infrastructure. A well-known example was the widely felt event with a local magnitude M L 3.4 under the Swiss city of Basel caused by development of an Enhanced Geothermal System (EGS), which resulted in infrastructural damage and termination of the project (Häring et al., Reference Häring, Schanz, Ladner and Dyer2008; Mignan et al., Reference Mignan, Landtwing, Kästli, Mena and Wiemer2015). More recently, a M w 5.5 event occurred at an EGS site near the city of Pohang, Korea, causing widespread damage and injuring 135 people (Kim et al., Reference Kim, Ree, Kim, Kim, Kang and Seo2018a; Ge et al., Reference Ge, Giardini, Ellsworth, Shimamoto and Townend2019). Also smaller, non-damaging events can still cause societal unrest. Recent events of M L 1.8–2.1 near Munich in Germany were felt by the population and led to a temporary suspension, followed by production at lower flow rates (LIAG, 2018; Seithel et al., Reference Seithel, Gaucher, Mueller, Steiner and Kohl2019). In general, the public is less accepting of induced seismicity than of natural earthquakes (McComas et al., Reference McComas, Lu, Keranen, Furtney and Song2016). For the Netherlands in particular, the occurrence of felt seismicity is undesirable as the country is densely populated and induced seismicity due to gas production has already caused damage to >1000 buildings in the north, in the province of Groningen (Fig. 1B). To proceed with the expansion of geothermal technologies in the Netherlands it is highly important to first understand the hazards and the risks and to investigate mitigating the occurrence of felt events as much as possible.
To understand when, where and why felt seismic events can occur in geothermal projects, observations of induced seismicity (or the lack thereof) in projects in other countries can be analysed. These provide insight into the mechanisms and factors controlling the occurrence and size of induced events and provide an overview on how widespread these events are (e.g. Buijze et al., Reference Buijze, Bijsterveld, Cremer, Paap, Veldkamp, Wassing, Wees and Heege2019). In this research we present a literature review on the key mechanisms playing a role in geothermal systems, and the occurrences of seismicity observed in geothermal projects worldwide. We focus on deep (>0.5 km) geothermal systems (i.e. excluding shallow aquifer thermal energy storage and heat exchangers) used for heating or generation of electricity. Additionally, we review cases in similar settings where no seismicity has been observed. We place these findings in the context of the (present and future) geothermal target formations and tectonic and geological setting of the Netherlands.
Summary of key mechanisms causing induced seismicity in geothermal fields
Seismicity is the result of rapid slip on a fault plane, which is a pre-existing zone of weakness in the crust. In the upper crust, faulting occurs mainly as a brittle process, which is commonly described by the Mohr–Coulomb criterion (Fig. 2). Sliding can occur when the shear stress τ reaches the failure shear strength τ f This criterion is defined in terms of the stresses and fault friction:
 $$\tau \ge {\tau _{\rm{f}}} = C + {\sigma _{\rm{n}}}^{\prime} \;{\tan}\;\varphi = C + {\sigma _{\rm{n}}}^{\prime}\mu $$
where C is the cohesion, σ n′ is the effective normal stress and φ is the friction angle, the tangent of which is friction coefficient μ (i.e. the slope of the failure line). Normal stress acts as a clamping force, resisting shearing, whereas shear stress promotes shearing. Friction and, in particular, cohesion of intact rocks are higher than for pre-existing faults, which have lower cohesion and may be filled with weak minerals (Fig. 2B).
Mohr diagrams in 2D with failure criteria and example stress state. (A) Mohr diagram with a composite Griffith–Coulomb failure envelope (black line), with tensile strength T 0 and cohesion C. The stress state at shear failure on a fault plane with θ is drawn (green semicircle). Different failure modes (tensile, compressive shear, mixed mode) are illustrated. (B) Mohr diagram with failure lines for intact rocks and pre-existing faults. An example stress state is given (green semicircle) with three different fault orientations relatively far from failure (blue dots) and one fault orientation relatively close to failure (yellow square).
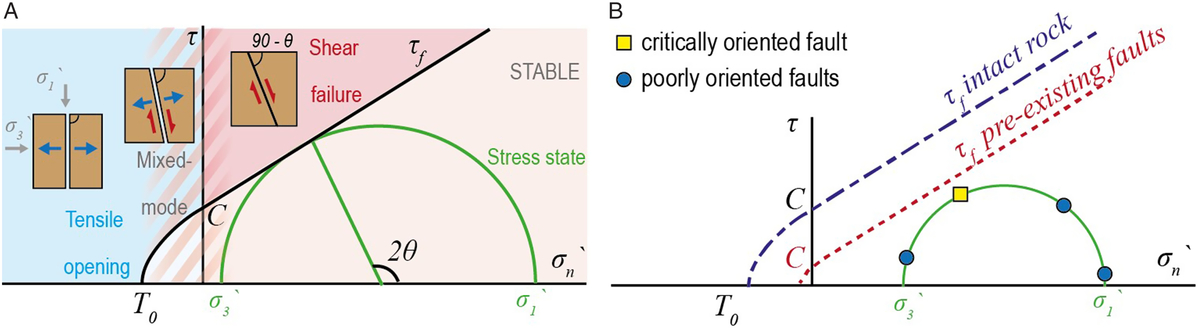
For induced seismicity, failure on faults is caused by stress changes resulting from anthropogenic activities, such as a gas production or water injection. Note that the initial stress on faults affected by these stress changes is not zero; gravity and plate tectonic loading have imposed an initial stress on the pre-existing faults. The initial fault stress may already be close to failure (critically stressed), depending on the maximum effective principal stress σ 1′ and minimum effective principal stress σ 3′. A larger differential stress σ 1′ – σ 3′ (large radius of the Mohr circle) and smaller mean effective stress σ 1′ + σ 3′ bring the state of stress closer to failure. In addition, the fault orientation in the stress field is important (e.g. the normal of an optimally oriented fault lies in the plane of σ 1′ and σ 3′ and has an orientation 2θ w.r.t. σ 1′). Reactivation of critically stressed faults may require only small stress changes, whereas reactivation of stable faults requires large stress changes.
Induced vs triggered seismicity
The presence of critically stressed faults is thus of great importance for fault reactivation and the occurrence of induced seismicity. It is also one of the challenges, as very small stress changes can generate relatively large seismic events. In the debate on induced seismicity, such relatively large events have also been called ‘triggered’ events (not to be confused with events resulting from dynamic triggering by other earthquakes), whereas events requiring a larger stress change have been called ‘induced’ events. However, it is often unclear what the stress changes were at hypocentre depth, and how the total energy change of a project is related to the released energy. Moreover, a small stress change can advance the occurrence of an earthquake by hundreds to thousands of years. In this article no distinction is made between triggered and induced; from here all the events linked to a project are termed ‘induced’.
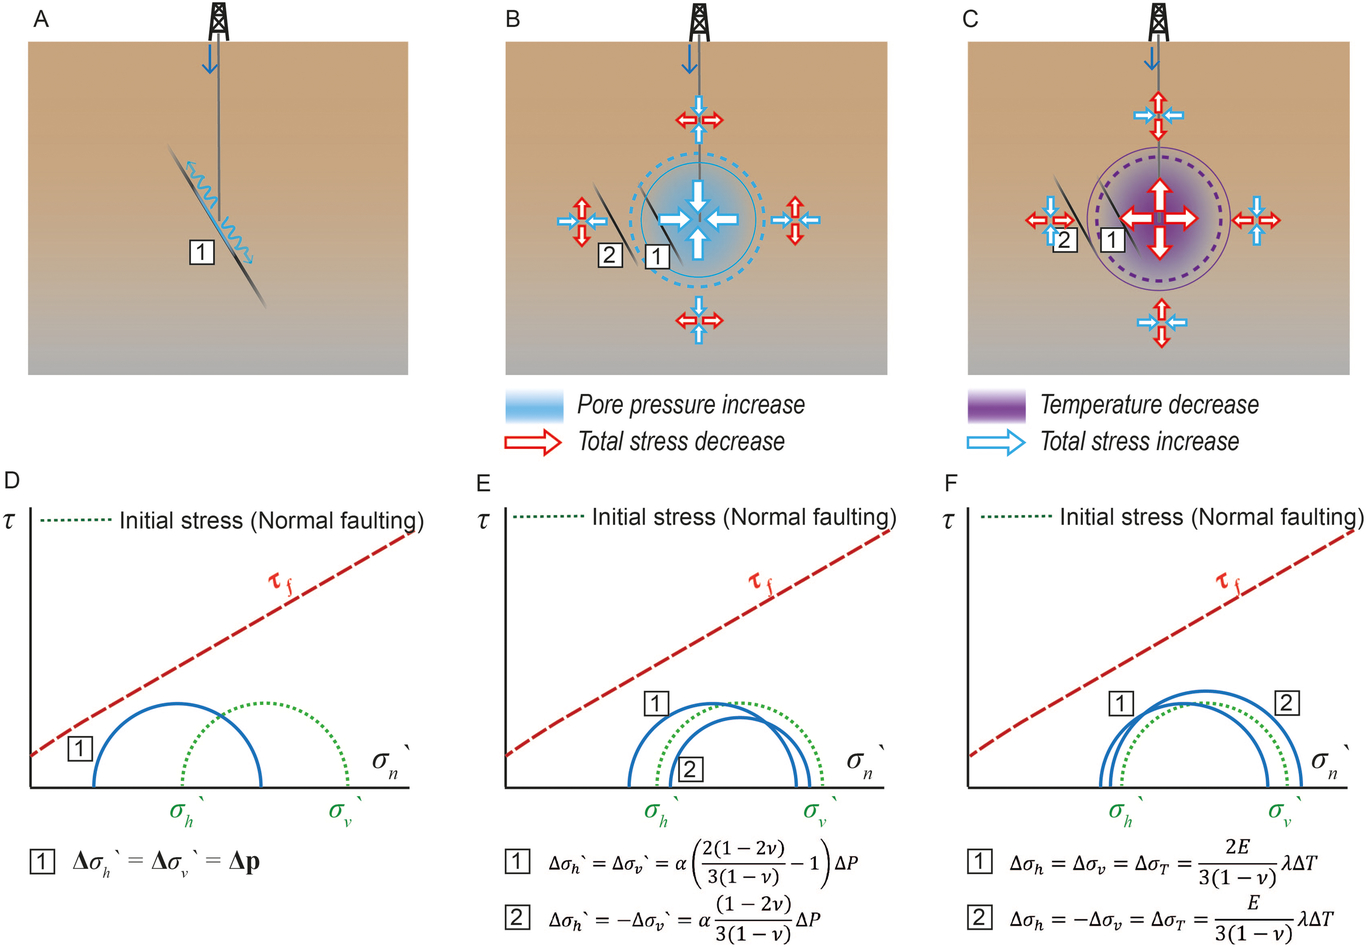
Stress changes: pore pressure increase
Pore fluid pressure changes are the most ubiquitous stress perturbation in geothermal systems; pressure changes can occur e.g. due to production and (re)injection of geothermal fluid. An increase in pressure on a fault due to e.g. fluid injection (Fig. 3A) reduces the effective normal stress on the fault and brings the fault closer to failure (Fig. 3D). The elevated pressure diffuses away from the injection well as a function of time, raising pressures and inducing seismic events further away from the source (e.g. Shapiro & Dinske, Reference Shapiro and Dinske2009). Even when injection is terminated, diffusion still causes the pressure to increase at some locations, which may lead to post-injection seismicity. In fact, some of the larger events in Enhanced Geothermal Systems (EGS) have occurred after stimulation was stopped, e.g. at Soultz-sous-Forêts and Basel. When injection occurs in a relatively impermeable but fractured rock mass, the fractures dominate fluid flow and diffusion, whereas for porous rocks the matrix is more important in controlling the fluid flow and diffusion. The pressure distribution thus depends on the rock type targeted and the hydrogeology, as well as on the operational parameters.
Simplified examples of the dominant mechanisms causing stress changes in geothermal systems. Examples are given for a normal faulting regime (σ h < σ H < σ v). (A) Schematic 2D illustration of pore pressure increases in a fault and diffusion of pressure along the fault. (B) Schematic 2D illustration of poroelastic stressing in and around a spherical pressurised volume. (C) Schematic 2D illustration of poroelastic stressing in and around a spherical cooled volume. Case 1: stresses on a fault within the pressurised or cooled volume. Case 2: stresses on a fault just outside the pressurised or cooled volume. (D–F) Mohr circle diagram showing the stress changes due to scenarios A–C.
Stress changes: poroelastic stressing
A change in pore pressure also causes a volumetric strain (volume change) of the rock mass experiencing a pressure change. This volume change causes a change in stress within the rock mass itself controlled by pore pressure changes, and in the surrounding rock formations, i.e. poroelastic stressing (Fig. 3B). The magnitude of poroelastic stress changes depends on the pressure change, the elastic properties of the rock mass and the geometry of the rock mass experiencing a pressure (e.g. Segall & Fitzgerald, Reference Segall and Fitzgerald1998; Soltanzadeh & Hawkes, Reference Soltanzadeh and Hawkes2008, Reference Soltanzadeh and Hawkes2009). Figure 3B shows an example for a sphere experiencing an increase in pressure. Inside the volume (case 1) the total stresses become more compressive due to the presence of surrounding rock where the hydraulic pressure is still undisturbed. However, due to the increase in pressure the effective stresses become smaller, and the net effect is a more critical stress state (Fig. 3E). To the sides of the expanding (case 2) volume the horizontal stress becomes more compressive, but the vertical stress decreases, leading to stabilisation in the assumed normal faulting regime. The poroelastic stress-changes outside of the pressurised volume are smaller than inside the volume, and decay rapidly with distance. Poroelastic stressing is expected to play a role both in geothermal systems where pressure is decreased (e.g. producing geothermal fields) or increased (e.g. stimulation in an EGS). Direct pressure effects are expected to dominate near the well, but poroelastic effects reach further at a short timescale. The volume change due to pressure drop can also cause subsidence at the surface, such as observed in many geothermal fields experiencing net extraction, such as the Geysers geothermal field (e.g. Mossop & Segall, Reference Mossop and Segall1997) (USA) and Cerro Prieto (Italy) (Glowacka et al., Reference Glowacka, González and Fabriol1999).
Stress changes: thermoelastic stressing
Analogous to poroelasticity, changes in temperature cause volumetric strain of the rock mass, which leads to stress changes within and around the volume experiencing a temperature change. An example for a spherical cooled volume is shown in Figure 3C. The stress changes are opposite to those resulting from a pressure increase, because cooling leads to a decrease in total stresses. In the normal faulting scenario both faults within and just outside the cooled volume become less stable (Fig. 3D). The effect of temperature changes ΔT may be strong, and is related to pore pressure changes ΔP through (Segall & Fitzgerald, Reference Segall and Fitzgerald1998)
 $${{\sigma _{}^{{\rm{thermo}}}} \over {\sigma _{}^{{\rm{poro}}}}} = {{E\lambda {\rm{\Delta }}T} \over {\left( {1 - \upsilon } \right)\alpha {\rm{\Delta }}P}}$$
where E is Young’s modulus, ν is Poisson’s ratio and λ is the linear thermal expansion coefficient. Temperature changes and thermoelastic stressing play an important role in geothermal systems. In geothermal fields the temperature difference between the reservoir rock and reinjected water may be in excess of 200 °C, such as at the Geysers and Larderello (Batini et al., 1985; Martínez‐Garzón et al., 2014). The difference between the reservoir rock and (re)injected fluids in doublets circulating through hot sedimentary aquifers is smaller but still significant (30–70 °C). Over time (10–30 years) these temperature differences may cause a significant fraction of the rock mass in the doublet system (Willems et al., 2017). The thermal stresses in the vicinity of the wellbore can be significant and lead to tensile failure, but the stresses decrease rapidly with distance (Koh et al., Reference Koh, Roshan and Rahman2011). Note that (for tight rocks) thermoelastic and poroelastic stress changes cannot be simply superimposed as they are coupled processes; e.g. cooling will increase the permeability, which influences the pressure distribution.
Other mechanisms of fault reactivation
Beside the three main mechanisms discussed above, other mechanisms may also lead to fault reactivation. These include:
Mass changes: The addition or removal of mass due to the extraction of fluids or mining causes elastic stress changes at depth which may reactivate (critically stressed) faults (e.g. Segall, Reference Segall1989; Klose, Reference Klose2007; Kang et al., Reference Kang, Zhu and Zhao2019).
Excavation-induced stresses: Stress changes around an excavated volume (relevant for mining).
Chemical changes of fault properties: Rather than changing the stress on fault, changes of the fault properties themselves may bring a fault to failure. These changes result from e.g. the introduction of injection fluids or acid into the subsurface, or temperature changes, which can change the friction coefficient (e.g. Kang et al., Reference Kang, Zhu and Zhao2019). Water can weaken silicate-rich fault rocks through stress corrosion (Davis et al., Reference Davis, Nyffenegger and Frohlich1995). Also, dissolution of carbonate can alter the fault properties and cause fault reactivation as proposed for the Molasse Basin (Seithel et al., Reference Seithel, Gaucher, Mueller, Steiner and Kohl2019) or seismicity below impounded reservoirs (Chen & Talwani, Reference Chen and Talwani1998).
Static and dynamic triggering: As one earthquake is induced, stress is redistributed around the fault area that slipped. The stress changes may promote failure on other faults or fault segments (e.g. Schoenball et al., Reference Schoenball, Baujard, Kohl and Dorbath2012).
Effects of local geometry: Local heterogeneities may cause the various stress changes to be locally enhanced, e.g. at the interface of layers with strongly different stiffnesses and offset or impermeable faults. For example, subsidence due to large-scale fluid extraction may cause differential strain along faults (Glowacka et al., Reference Glowacka, González and Fabriol1999).
Selection and classification of case histories and definition of key factors
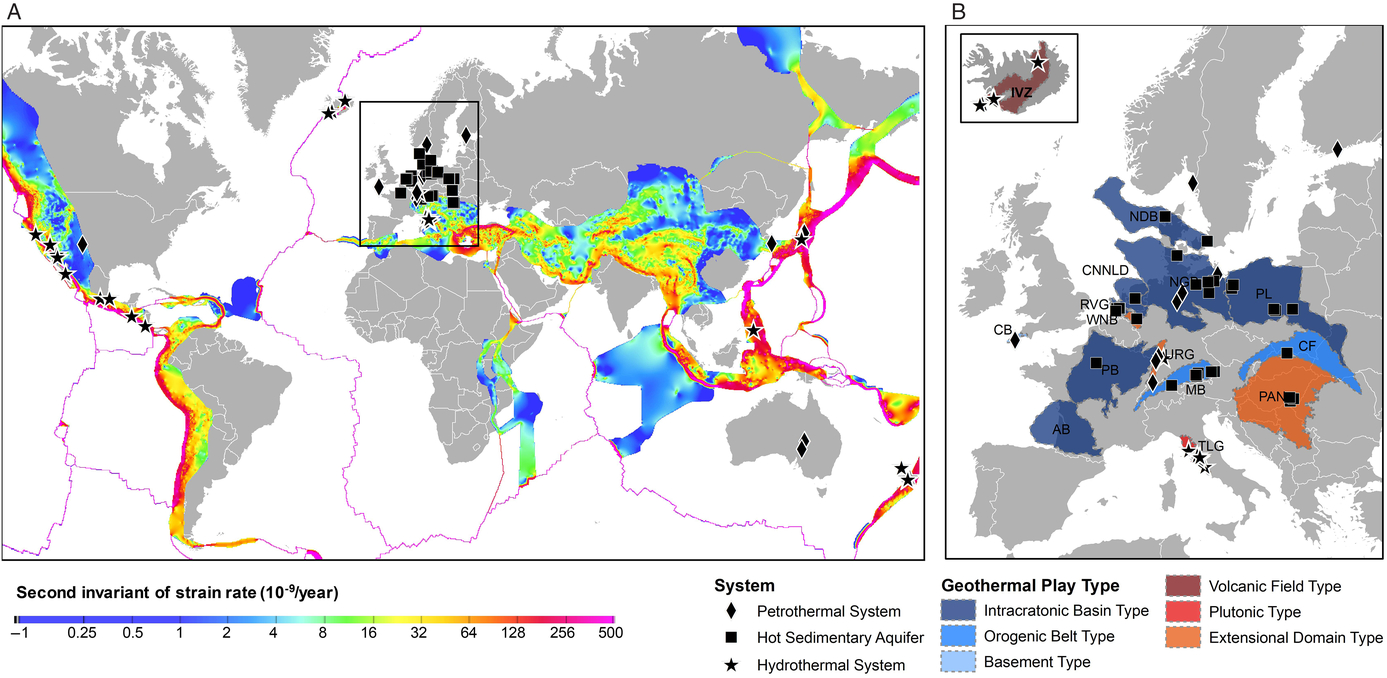
The selection of case histories of induced seismicity linked to geothermal projects was based on the Human Induced Earthquake database HiQuake (Foulger et al., Reference Foulger, Wilson, Gluyas, Julian and Davies2018). In this database, 85 geothermal projects related to induced seismicity were listed (http://inducedearthquakes.org, updated December 2018). The cases are situated predominantly in Europe, North America and Asia. Nearly all of the cases listed in HiQuake are included in this study. In addition to these ‘seismic’ cases, a number of case histories of geothermal projects without induced seismicity were selected for the review. These include cases in the same geothermal regions as the cases with seismicity, and several other regions predominantly in Europe. Closed systems (e.g. heat exchangers), Aquifer Thermal Energy Storage (ATES) projects, and spas were not included. For all cases an additional selection criterion was that the data/information should be publicly available in scientific journals, reports and databases. The cases included in the review are summarised in Table S2 (in the Supplementary Material available online at https://doi.org/10.1017/njg.2019.6), and the locations of cases are shown in Figure 4.
Map of locations of case studies included in the review. (A) Global map showing location of reviewed cases. Background colours indicate the strain rate magnitude (second invariant of the strain rate tensor) in nanostrains a−1, after the Global Strain Rate Model (Kreemer et al., Reference Kreemer, Blewitt and Klein2014). (B) Zoomed map of main geothermal regions in Europe and locations of case studies. CB: Cornubian batholith, CF: Carpathian Mountains and Foredeep, IVZ: Iceland Volcanic Zones (combined east, west and neovolcanic zones), MB: Molasse Basin, NGB: North German Basin, NDB: Norwegian–Danish Basin, PAN: Pannonian Basin, PL: Polish Lowlands, RVG: Ruhr Valley Graben, TLG: Tuscany–Latium Geothermal Area, URG: Upper Rhine Graben, WNB: West Netherlands Basin. Shown but not included AB: Aquitaine Basin (modified from Robertson Basins and Plays).
Note that the presence of a local monitoring system may introduce bias towards cases being related to induced seismicity. In the Supplementary Material (available online at https://doi.org/10.1017/njg.2019.6) we include information on the presence of a local monitoring system, and where available the magnitude of completeness M c is listed. We introduce a cut-off magnitude of M 2.0, above which we classify seismicity as ‘felt seismicity’, and below which we consider cases ‘low-seismic’ (following e.g. Evans et al., Reference Evans, Zappone, Kraft, Deichmann and Moia2012). A M 2.0 is approximately the threshold for induced events to be felt (e.g. in the Upper Rhine Graben, in the Netherlands), but locally the magnitude from which events can be felt can vary.
Tectonic setting and geothermal play type
The case studies and geothermal regions included in this review are very different in terms of tectonic regime, heat flow, geology, etc. It is useful to classify the cases according to their geothermal play type; here we follow the classification given in Moeck (Reference Moeck2014), which is based on the geological controls on the thermal regime, heat flow and hydrogeology. Moeck (Reference Moeck2014) distinguishes between conduction-dominated systems and convection-dominated systems, where conduction and convection are indicative of the heat transfer causing the geothermal anomaly. Here we summarise the main characteristics of these systems (Moeck, Reference Moeck2014).
Conduction-dominated systems are found in passive tectonic regions without recent tectonism or volcanism, such as passive continental margins of intracontinental, tectonically quiet areas. Thermal gradients are near-normal, and therefore conduction-dominated systems host mainly low- to medium-temperature geothermal systems. Rock types targeted include mainly sedimentary rocks, and also crystalline basement rocks. In sedimentary basins, heat is transferred mainly through conduction from depth, whereas in crystalline rocks (e.g. granite) heat production is also caused by decay of radioactive elements. Conduction-dominated systems are classified into:
Intracratonic Basin Type (IBT), which are inactive intracratonic rift basins or passive margin basins (e.g. North German Basin) with a near-normal geothermal gradient. Usually these basins are filled with sediments, which may form permeable aquifers at depths >3 km suitable for the production (and reinjection) of geothermal water. Tighter rock types may require EGS technology (see next subsection).
Orogenic Belt Type (OBT), which are situated in fold-and-thrust belts and foreland basins (e.g. Molasse Basin). The sediments in the foreland basins are bent and have experienced significant subsidence due to the weight of the nearby mountain belt. Advective heat transport may occur along permeable sedimentary formation from deeper parts to shallower parts further away from the mountain range, causing an elevated geothermal gradient.
Basement Type (BT), which are related to intrusions or heat-producing element regions (e.g. Cooper Basin). This is an igneous play type consisting of crystalline basement (granite) present below most of the continental area. Natural permeability is often low.
Convection-dominated (CV) systems are high-temperature regions where recent volcanism and/or active plate tectonic processes occur. Examples are magmatic arcs, rift zones, transform fault systems and hot-spot magmatism. Circulation of hot fluids from depth to shallower reservoirs causes an elevated geothermal heat gradient. Convection-dominated systems include:
Volcanic Field Type (VFT) which are found near magmatic arcs, mid-oceanic ridges, and hot spots (e.g. Icelandic Volcanic Fields, Taupo).
Plutonic Type (PT) plays, which are related to young orogens and post-orogenic collapse with recent plutonism (e.g. Larderello and the Geysers). Temperatures for both PT and VFT may exceed 300 °C and reservoirs may be vapour- and/or liquid-dominated.
Extensional Domain Type (EDT) plays, which are situated in metamorphic core complexes, back-arc extension, pull-apart basins and intracontinental rifts (e.g. Upper Rhine Graben, the Great Basin). In contrast to the previous cases, this is a non-magmatic play type, where heat flow predominantly occurs by convection through permeable faults. The crust in these regions is usually thinner, creating a higher geothermal gradient.
Fluid flow and convective heat flow is dominated by matrix porosity (VFT) and/or fractures (EDT, PT).
Figure 4B shows the geothermal play types of the main geothermal areas in Europe. Natural seismicity in the convection-dominated regions is much more ubiquitous than in the conduction-dominated systems, which may make distinguishing natural and induced seismicity difficult (e.g. Brodsky & Lajoie, Reference Brodsky and Lajoie2013).
Geothermal system type
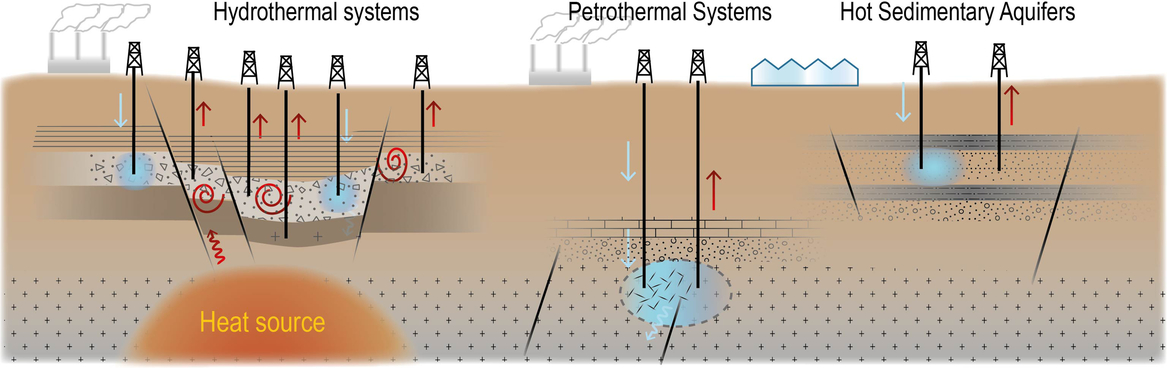
Depending on the tectonic setting and rock type, different types of deep geothermal energy systems exploit the geothermal resources. Here three different types are recognised (following Breede et al., Reference Breede, Dzebisashvili and Falcone2015): hydrothermal systems (HS), petrothermal systems (PS) and hot sedimentary aquifers (HSA) (Fig. 5).
Hydrothermal systems (HS), also called geothermal fields, are the oldest geothermal systems and are situated in tectonically active, convection-dominated settings (see Fig. 4A). These fields are high-temperature (>200 °C) reservoirs at shallow depth (<∼3 km) and can be classified as vapour-dominated or water-dominated fields. Permeability of the matrix and/or fractures is high enough to allow flow without stimulation. Well-known examples include the Geysers, and Larderello. From the early 1900s, hot water from these fields was used for heating (direct-use) and the first commercial production of electricity was achieved in 1926 at Larderello. The fields can be extensive (>10 km) and contain numerous wells. Initially the fields only produced steam and/or hot water. From the 1970s, reinjection of produced cooled water as a means of disposal and/or pressure maintenance became common practice (Stefansson, Reference Stefansson1997; Kaya et al., Reference Kaya, Zarrouk and O’Sullivan2011). Note that reinjection may not necessarily occur in the producing formation but could also occur shallower or in a different area of the field.
Petrothermal systems (PS) (here also called EGS) target rocks that have a low permeability and need to be stimulated before fluid flow can be achieved. These include the Hot-Dry Rock (HDR) concept, where wells are connected through hydraulic fracturing which is achieved by injection pressures exceeding the minimum principal stress (e.g. Jung, Reference Jung2013) and Enhanced Geothermal Systems where injection at high pressures (but lower than the minimum principal stress) stimulates the permeability of the natural fracture network between two wells by shearing. Since the 1980s a number of pilot-EGS projects have been conducted, and the first commercial plants are operational (Lu, Reference Lu2018). In this review both initial HDR project and EGS projects are classified as PS. Typically a petrothermal system is exploited by circulation between two wells. Note that there may also be EGSs within geothermal fields, e.g. in the Geysers (PS–HS).
Hot sedimentary aquifers are porous/permeable sedimentary rock formations where heat flow is dominated by conduction (see Fig. 4A). Mostly these are low–moderate-temperature (30–150 °C) systems in permeable sedimentary aquifers at relatively shallow depth (1–4 km). Typically, water is circulated between two wells (a doublet) at low pressures. Temperatures can be high enough for electricity generation (e.g. in some systems near Munich) but are mostly suitable for direct use in e.g. district heating, space heating and various other applications (e.g. North German Basin, Paris Basin, the Netherlands).
Beside the type of geothermal system, also the depth and reservoir temperature are specified for the case histories included in the review. In addition, the minimum vertical distance of the geothermal system to basement was listed. For HSA and PS this was usually the crystalline basement. For hydrothermal systems where no crystalline basement was present, this could be another rock type, e.g. greywacke (Taupo Volcanic Zone in New Zealand).
Schematic illustration of geothermal system types.
Geological parameters
The initial stress is very important for assessing the reactivation potential of faults. However, in situ stress measurements are often not available, and often faults have not been identified. Where available the stress regime was listed, with NF: normal faulting, NF-SS: transtenstional faulting, SS: strike-slip faulting, SS-TF: transpressive faulting, and TF: thrust faulting. For each activity the rock type of the geothermal target formation is listed, as rock type may influence the potential for faulting and controls fluid flow. Also an indication of the average matrix porosity Φ was included. Where no porosity data were available, a standard value of 1% was assumed for granites, 8% for carbonates and 10% for volcaniclastic sequences. To analyse whether there is a relation between tectonic activity and induced seismicity, at each locality the second invariant of the strain tensor (i.e. strain magnitude) was obtained from the Global Strain Rate Model v2 (Kreemer et al., Reference Kreemer, Blewitt and Klein2014) (Fig. 4A).
Operational parameters
Operational parameters are also important for the occurrence of induced seismicity, as larger pressure and temperature changes result in larger stress changes. For each activity we list the start of operations, and the following operational parameters:
ΔV (m3): net injected volume
ΔP (MPa): maximum injection pressure at the wellhead
ΔT (°C): temperature difference between reservoir temperature and (re)injected fluids
Seismicity
If seismic events occurred, the maximum magnitude and the date of occurrence are listed, as well as the magnitude scale that was used. In addition, where available the magnitude of completeness M c of the local monitoring network was listed.
Seismicity in geothermal systems: case history review
Here we summarise the main findings from the case history review. We start with a brief summary of the characteristics of the main geothermal regions in which the selected case histories are located; for more extensive reviews of individual cases we refer the reader to e.g. Evans et al. (Reference Evans, Zappone, Kraft, Deichmann and Moia2012), Foulger et al. (Reference Foulger, Wilson, Gluyas, Julian and Davies2018) and the references therein. The geothermal plays in the Netherlands are not included here but are described more extensively in the Implications section further below. After summarising the different geothermal regions and observed seismicity, we discuss the dominant geological and operational factors underlying the occurrence of induced seismicity in different geothermal systems.
Conduction-dominated plays and case studies
North German Basin: The North German Basin (Fig. 4B) is a Permian rift basin (IBT) with a thick infill of Mesozoic and Cenozoic sediments (e.g. Scheck-Wenderoth & Lamarche, Reference Scheck-Wenderoth and Lamarche2005). It is a sub-basin of the Central European Basin System. The basin is inactive, and natural seismicity rates are low. The main geothermal target formations are sandstone aquifers from the Lower Jurassic Lias, the Upper Triassic Keuper (which includes the well-known Rhaetian Formation) and the Lower Triassic Bundsandstein sandstones including the Dethlingen, Volpriehausen sandstones (Franz et al., Reference Franz, Barth, Zimmermann, Budach, Nowak and Wolfgramm2018). Starting in 1986 at Waren, five doublets (Neustadt-Glewe, Neubrandenburg, Neuruppin, Sønderborg and Waren) circulate water through the low-temperature (45–100 °C), porous (20–30%) Liassic and Keuper sandstone aquifers at depths of 1–2.5 km (Kabus & Jäntsch, Reference Kabus and Jäntsch1995; Seibt et al., Reference Seibt, Kabus and Hoth2005; Røgen et al, Reference Røgen, Ditlefsen, Vangkilde-Pedersen, Nielsen and Mahler2015; Franz et al., Reference Franz, Barth, Zimmermann, Budach, Nowak and Wolfgramm2018). Apart from an incidental acid stimulation, no stimulation techniques are required and high flow rates can be attained at low injection pressures (<1 MPa). The deeper, tighter Bundsandstein (4.1 km, 150–170 °C) in the west was hydraulically fractured in two geothermal research projects: Genesys Hannover and Horstberg (Orzol et al., Reference Orzol, Jung, Jatho, Tischner and Kehrer2005; Rioseco et al., Reference Rioseco, Löhken, Schellschmidt and Tischner2013; Tischner et al., Reference Tischner, Krug, Pechan, Hesshaus, Jatho, Bischoff and Wonik2013). Similarly, the geothermal potential of older Permian Rotliegend sediments and volcanics was tested by hydraulic fracturing at the Gross Schönebeck research well (e.g. Zimmermann et al., Reference Zimmermann, Moeck and Blöcher2010).
Only very small events occurred during the hydraulic fracturing experiments, with maximum magnitudes of M w−1 at Gross Schönebeck (Moeck et al., Reference Moeck, Kwiatek and Zimmermann2009; Kwiatek et al., Reference Kwiatek, Bohnhoff, Dresen, Schulze, Schulte, Zimmermann and Huenges2010; Blöcher et al., Reference Blöcher, Cacace, Jacquey, Zang, Heidbach, Hofmann, Kluge and Zimmermann2018), or no events at all (Tischner et al., Reference Tischner, Krug, Pechan, Hesshaus, Jatho, Bischoff and Wonik2013). At the other sites no monitoring was in place, but no events have been reported by the public.
Norwegian–Danish Basin: The Norwegian–Danish Basin (Fig. 4B) is a Permian rift basin which is also part of the Central European Basin System (IBT). The thickness of the sedimentary cover ranges from 1–2 km in the south to 9 km in the north of the basin (Frederiksen et al., Reference Frederiksen, Nielsen and Balling2001). The main geothermal targets are the Upper Triassic Gassum (Rhaetian in Germany) and the Lower Triassic Bundsandstein (Kristensen et al., Reference Kristensen, Hjuler, Frykman, Olivarius, Weibel, Nielsen and Mathiesen2016). Two geothermal plants are operative: Thisted (started in 1984) and Margretheholm (started in 2005) near Copenhagen. Thisted exploits the high-porosity (26%) Gassum sandstone at 1.2 km depth with a temperature of 45 °C (Mahler, Reference Mahler1995; Hjuler et al., Reference Hjuler, Vosgerau, Nielsen, Frykman, Kristensen, Mathiesen, Bidstrup and Nielsen2014; Røgen et al., Reference Røgen, Ditlefsen, Vangkilde-Pedersen, Nielsen and Mahler2015). The Margretheholm plant targets the Bundsandstein at 2.5 km depth (73 °C) (Mahler et al., Reference Mahler, Røgen, Ditlefsen, Nielsen and Vangkilde-Pedersen2013), which directly overlies the granitic basement (Erlström et al., Reference Erlström, Boldreel, Lindstrom, Kristensen, Mathiesen, Andersen, Kamla and Nielsen2018).
No seismic events have been reported for either geothermal plant.
Paris Basin: The Paris Basin is a Permo-Triassic basin in northern France with a sediment thickness up to 3 km in the centre (Fig. 4B). The absence of microseismicity and absence of horizontal motion indicates the basin is tectonically inactive (Cornet & Röckel, Reference Cornet and Röckel2012). The prime geothermal target in the Paris Basin is the ∼200 m thick Middle Jurassic Dogger carbonates (1.5–2 km, 55–85 °C) (Lopez et al., Reference Lopez, Hamm, Le Brun, Schaper, Boissier, Cotiche and Giuglaris2010). The most productive layers in the Dogger strata are permeable oolitic reef deposits and shelf sediments with a net thickness of 15–25 m, with an average porosity of 15%. The fluid flow is generally matrix-controlled, although in some parts fluid flow may locally be fracture-controlled (Rojas et al., Reference Rojas, Giot, Le Nindre, Criaud, Fouillac, Brach and Pauwels1989). The Dogger is underlain by Lower Jurassic shales, Triassic sands and shales, which are underlain by the granitic basement (Fig. 6). Between 1970 and 1985 more than 100 geothermal wells were drilled in the Paris Basin, mainly used for district heating. Of the 55 doublets 34 are still operational, without any thermal decline (Lopez et al., Reference Lopez, Hamm, Le Brun, Schaper, Boissier, Cotiche and Giuglaris2010). Hydraulic stimulation is not necessary, and circulation can occur at low injection pressures (<1 MPa). However, chemical stimulation is sometimes used to improve the injectivity (Ungemach et al., Reference Ungemach, Antics and Papachristou2005).
Cross-section of the stratigraphy of the Paris Basin (Dentzer et al., Reference Dentzer, Lopez, Violette and Bruel2016, reprinted with permission from Elsevier).
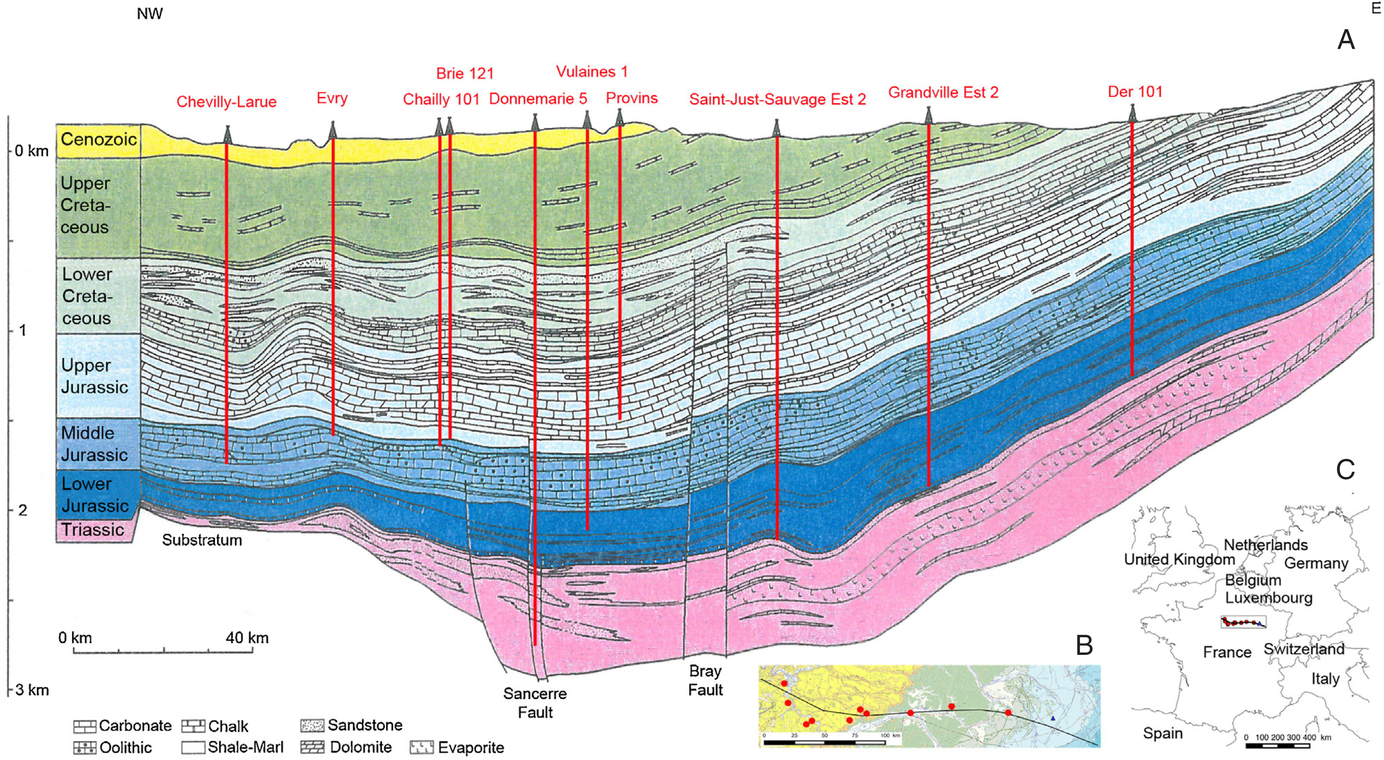
No (felt) induced events have been reported for any of the doublets in the Paris Basin. No site-specific monitoring is in place.
Polish Lowlands: The Polish Lowlands, or Polish Basin, is another sub-basin of the Central European Basin System, which formed during rifting in the Permian (e.g. Scheck-Wenderoth & Lamarche, Reference Scheck-Wenderoth and Lamarche2005). The basin was filled with >8 km of Mesozoic sediments, with the Polish trough as the deepest part of the basin running NW–SE (e.g. Grad & Polkowski, Reference Grad and Polkowski2016). The main aquifers targeted by geothermal operations in the Polish Lowlands are the porous Lower Jurassic (0.7–3.7 km depth, 25–120 °C) and Lower Cretaceous (0.8–2.8 km depth, 30–85 °C) sandstone formations which have porosities of 5–20% with an average permeability for the Lower Jurassic of 1.1 × 10⁻¹² m2 (Kurowska, Reference Kurowska2000; Sowizdzal, Reference Sowizdzal2018). Since 1996 five geothermal plants have become operational that use hot water from these aquifers for district heating (Pyrzyce, Mszczonów, Uniejów, Stargard Szczecinski and Poddebice), as well as several spas (e.g. Meyer and Kozlowski, Reference Meyer and Kozlowski1995; Górecki et al., Reference Górecki, Sowiżdżał, Hajto and Wachowicz-Pyzik2015; Kepinska, Reference Kepinska2015). The systems at Poddebice and Mszczonów (Bujakowski & Wojnarowski, Reference Bujakowski and Wojnarowski2005) only produce the formation water, whereas the others circulate fluids between the wells.
No (felt) induced events have been reported for any of the system in the Polish Basin. No local monitoring stations are present.
Molasse Basin: The Molasse Basin is a foreland basin north of the Alps (OBT), stretching from Switzerland in the west through the south of Germany to Austria in the east (e.g. Reinecker et al., Reference Reinecker, Tingay, Müller and Heidbach2010). The geothermal target formation is the permeable, faulted, karstified Upper Jurassic Malm limestones which underlie the Tertiary Molasse sediments. Near Munich the Malm lies at a depth of 3 km, with a thickness of over 600 m, with temperatures in the range 85–130 °C (e.g. Seithel et al., Reference Seithel, Gaucher, Mueller, Steiner and Kohl2019). Here, the Malm directly overlies the Variscan basement (Fig. 7). Further to the west at Sankt Gallen in Switzerland, Middle Jurassic and Triassic and Permian sediments are found below the Malm (Moeck et al., Reference Moeck, Bloch, Graf, Heuberger, Kuhn, Naef and Wolfgramm2015). So far, a total of 26 geothermal doublets are operational in the Molasse Basin, 16 of which are situated around Munich (Agemar et al., Reference Agemar, Weber and Schulz2014; Baumann et al., Reference Baumann, Bartels, Lafogler and Wenderoth2017; Seithel et al., Reference Seithel, Gaucher, Mueller, Steiner and Kohl2019), and 7 of which are located in the east of the basin near the German–Austrian border (e.g. Goldbrunner, Reference Goldbrunner1999; Karytsas et al., Reference Karytsas, Mendrinos and Goldbrunner2009). The geothermal wells often target faults because of the enhanced permeability. Most of the doublets are used for district heating, and three systems (Dürrnhaar, Kirchstockach and Sauerlach) to the south of Munich generate electricity (Wanner et al., Reference Wanner, Eichinger, Jahrfeld and Diamond2017; Seithel et al., Reference Seithel, Gaucher, Mueller, Steiner and Kohl2019). Circulation occurs at low (1–2 MPa) pressure (e.g. Wanner et al., Reference Wanner, Eichinger, Jahrfeld and Diamond2017), and hydraulic stimulation is not required.
Overview of geothermal systems in the Munich area in the Molasse Basin. (A) Overview map showing Munich, the location of geothermal projects, and local fault structures. (B) Cross-section of the Mollasse Basin (Seithel et al., Reference Seithel, Gaucher, Mueller, Steiner and Kohl2019, reprinted with permission from Elsevier).
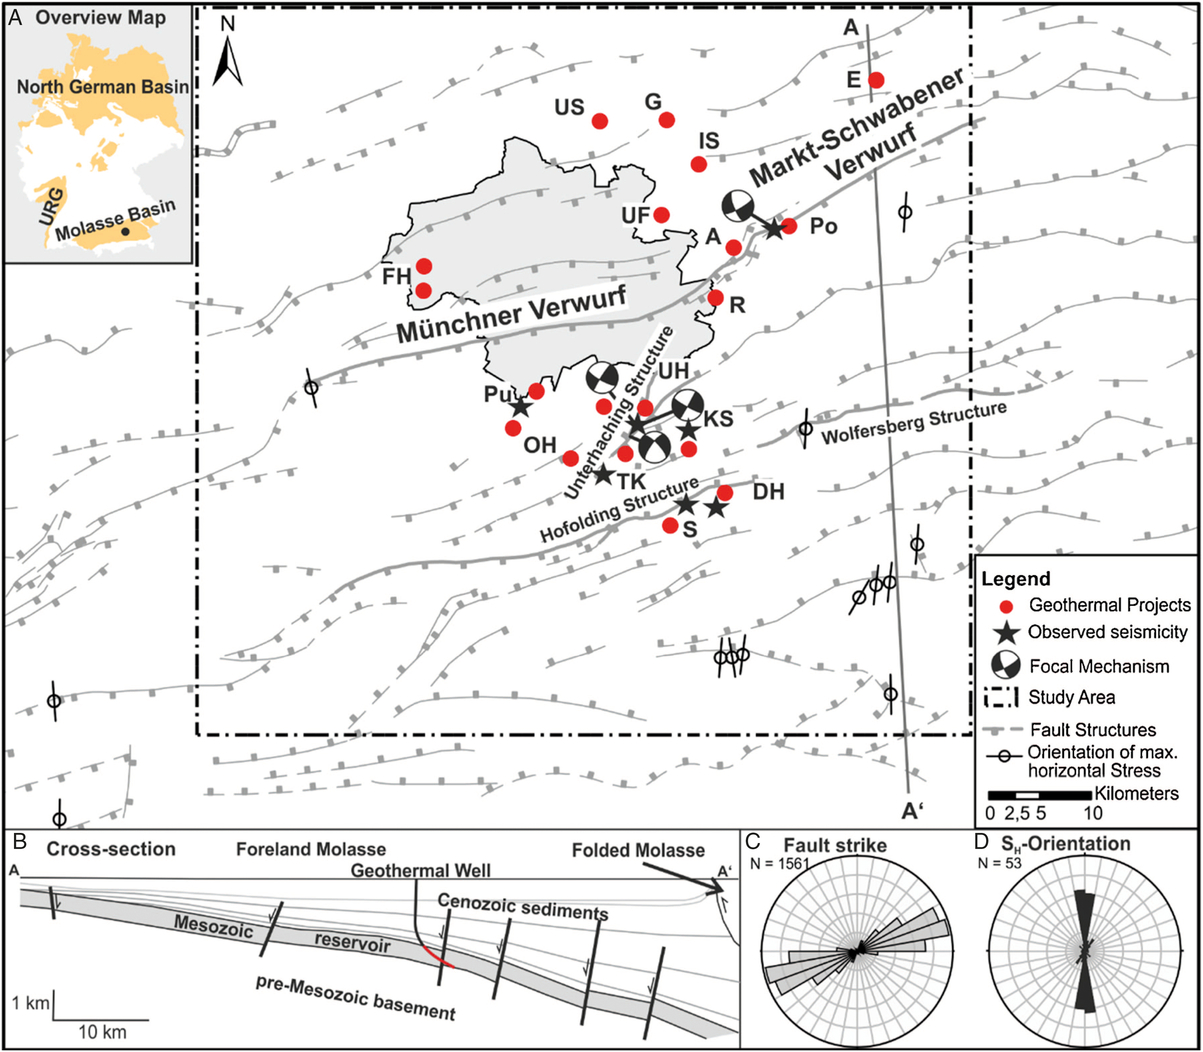
Three geothermal sites in the Molasse Basin are associated with induced events with M > 2.0 (Fig. 7). The most well-known example is Sankt Gallen, where a M L 3.5 event was recorded during well control operations following influx of gas (Kraft et al., Reference Kraft, Wiemer, Deichmann, Diehl, Edwards, Guilhem and Woessner2013; Obermann et al., Reference Obermann, Kraft, Larose and Wiemer2015; Diehl et al., Reference Diehl, Kraft, Kissling and Wiemer2017). Other felt events of M L 2.4 and M L 2.1 were recorded during circulation in doublets at Unterhaching (Megies & Wassermann, Reference Megies and Wassermann2014) and Poing (LIAG, 2018; Seithel et al., Reference Seithel, Gaucher, Mueller, Steiner and Kohl2019), respectively after a few months and after 5 years of circulation. In both cases the events occurred in the top of the crystalline basement underlying the Malm. A number of other sites were associated with M < 2.0 events: Dürrnhaar (M L 1.3), Sauerlach (M L 1.2), Kirchstockach (M L 0.8), Oberhaching (M L 0.5), Taufkirchen (M L 0.3), Pullach, M L 0.4) (Seithel et al., Reference Seithel, Gaucher, Mueller, Steiner and Kohl2019) and other systems around Munich have not shown any seismicity, even though the monitoring system captures all events with M > 1 .0–1.5 (and locally even smaller events). Also no events have been reported for the doublets in the eastern part of the basin.
Cooper Basin: The Cooper Basin is located in a stable region of the northeast of Australia. The geothermal target formation is a large naturally fractured granitic body covered by 3.6 km of sediments. Heat is generated within the granite, causing high temperature gradients in the area. Two EGS doublets are present at the Habanero geothermal field (Baisch et al., Reference Baisch, Weidler, Voros, Wyborn and Graaf2006, Reference Baisch, Vörös, Weidler and Wyborn2009), and one EGS well in the Jolokia field (Baisch et al., Reference Baisch, Rothert, Stang, Vörös, Koch and McMahon2015).
More than 60,000 events (M L 1.6 to 3.7) were detected during three hydraulic stimulations: two in Habanero 1 and one in Habanero 4 (Baisch et al., Reference Baisch, Weidler, Voros, Wyborn and Graaf2006, Reference Baisch, Vörös, Weidler and Wyborn2009, Reference Baisch, Rothert, Stang, Vörös, Koch and McMahon2015). Maximum magnitudes were M L 3.7, M L 3.0 and M L 3.0, and the microseismic cloud revealed a large thrust fault structure that was well-oriented in the regional stress field and was reactivated by the injection (Holl & Barton, Reference Holl and Barton2015). Stimulation of the Jolokia well on the other hand resulted in smaller events (M L < 1.6); here the well did not intersect a large fault (Baisch et al., Reference Baisch, Rothert, Stang, Vörös, Koch and McMahon2015).
EGS Helsinki: Recently, fractured granitic basement rocks of the Svecofennian province (part of the Fennoscandian shield) were targeted with EGS technology below the city of Helsinki, Finland (Kwiatek et al., Reference Kwiatek, Saarno, Ader, Bluemle, Bohnhoff, Chendorain, Dresen, Heikkinen, Kukkonen and Leary2019). Here, the crystalline basement can be found almost up to the surface. Natural seismicity rates in the south of Finland are low, and in the years prior to the stimulation only small natural earthquakes up to M 1.7 were recorded in the vicinity of the drill site. The stress regime is strike-slip. The well OTN-3 was drilled to 6.1 km deep, where temperatures of 125 °C were measured. The well was stimulated by injecting 18,160 m3 of fresh water, at wellhead pressures of 60–90 MPa, and flow rates of 400–800 L min−1.
Seismicity was recorded during the stimulations (M c − 1.2) and processed near-real-time (Kwiatek et al., Reference Kwiatek, Saarno, Ader, Bluemle, Bohnhoff, Chendorain, Dresen, Heikkinen, Kukkonen and Leary2019). Depending on the evolution of seismic magnitudes in relation to the injected volume, injection flow rates were adjusted. A total of 6150 events were recorded, with a maximum magnitude M w of 1.9.
Other: Other EGS and HDR test sites targeting granitic basement rocks or tight sandstones included in the database are Fenton Hill (Phillips et al., Reference Phillips, House and Fehler1997), Fjällbacka (Jupe et al., Reference Jupe, Green and Wallroth1992), Paralana (Albaric et al., Reference Albaric, Oye, Langet, Hasting, Lecomte, Iranpour, Messeiller and Reid2014; Riffault et al., Reference Riffault, Dempsey, Archer, Kelkar and Karra2016) and Rosemanowes (Batchelor, Reference Batchelor1982; Richards et al., Reference Richards, Parker, Green, Jones, Nicholls, Nicol, Randall, Richards, Stewart and Willis-Richards1994; Parker, Reference Parker1999; Evans et al., Reference Evans, Zappone, Kraft, Deichmann and Moia2012); see further Table S2 (in the Supplementary Material available online at https://doi.org/10.1017/njg.2019.6). Maximum magnitudes during stimulations at these sites were respectively M 1.3, M L 0.2, M L 2.5 and M 2.0. At Fjällbacka, during a later stimulation, an event was felt but its magnitude was unknown.
Convection-dominated plays and/or case studies
Iceland Volcanic Zones: Iceland is the site of active rifting and volcanism (VFT) and has large geothermal potential. The Icelandic volcanic area runs SW–NE across the island and is seismically active. Production of geothermal energy started in the 1970s. Currently eight high-temperature (230–440 °C) fields are being produced (six of them for electricity), and tens to hundreds of low-temperature fields for district heating (Ragnarsson, Reference Ragnarsson2005; Armannsson, Reference Armannsson2016). Reinjection occurs in five high-temperature and four low-temperature fields (Flóvenz et al., Reference Flóvenz, Ágústsson, Guðnason and Kristjánsdóttir2015). The main geothermal reservoir rocks are basaltic lava flows and hyaloclastics, which may have high porosities (e.g. Eggertsson et al., Reference Eggertsson, Lavallée, Kendrick and Markússon2018).
The Iceland Volcanic Zones are well covered by the seismic network, with a magnitude of completeness of ∼1.0 (Panzera et al., Reference Panzera, Mignan and Vogfjörð2017). Seismicity was observed in most of the fields where reinjection occurred, with maximum magnitudes between M L 2.0 and 4.0 (Flóvenz et al., Reference Flóvenz, Ágústsson, Guðnason and Kristjánsdóttir2015). The largest event, of M L 4.0, was observed at the Húsmúli reinjection site in the Hellisheidi field (Juncu et al., Reference Juncu, Árnadóttir, Geirsson, Guðmundsson, Lund, Gunnarsson, Hooper, Hreinsdóttir and Michalczewska2018).
Taupo Volcanic Zone: The Taupo Volcanic Zone (TVZ) is a 150 km long NE–SW zone in the centre of the North Island, New Zealand. The TPV is a zone of active rifting and volcanism associated with subduction at the Kermadec trench in the east (Wilson & Rowland, Reference Wilson and Rowland2016). Currently 16 geothermal fields are being developed in the region, mostly targeting pyroclastic, fractured lavas (andesites, rhyolites), and fractured greywacke basement formations at 1–3 km depth (250–320 °C). Porosities vary from several per cent in the deeper rocks to more than 20% in the shallower rocks (Henrys & Hochstein, Reference Henrys and Hochstein1990; Cant et al., Reference Cant, Siratovich, Cole, Villeneuve and Kennedy2018). Production started in the late 1950s from the Kawerau and Wairakei fields, generating electricity and producing warm water for district and industry heating. Reinjection started from the 1980s.
Local monitoring networks are present near most geothermal fields so that most events with M > 2.0 are detected (Sherburn et al., Reference Sherburn, Bromley, Bannister, Sewell and Bourguignon2015a). Induced seismicity was observed in a number of fields, notably Rotokawa (M 3.3), Kawerau (M 3.2), Mokai (M 3.2), Ngatamariki (M 2.7) and Wairakei (M 2.5) (Sherburn et al., Reference Sherburn, Bromley, Bannister, Sewell and Bourguignon2015a). A clear correlation with reinjection wells could be observed for some of those fields (Sewell et al., Reference Sewell, Cumming, Bardsley, Winick, Quinao, Wallis, Sherburn and Bourguignon2015; Sherburn et al., Reference Sherburn, Sewell, Bourguignon, Cumming, Bannister, Bardsley, Winick, Quinao and Wallis2015b). Several other fields in similar settings (Ohaaki, Ngawha) have not shown seismicity.
The Geysers: The Geysers field in Northern California is the largest producing geothermal field in the world. It lies 80 km from the San Andreas Fault between large active strike-slip faults, in a transtensional stress environment (Garcia et al., Reference Garcia, Hartline, Walters, Wright, Rutqvist, Dobson and Jeanne2016). The Geysers field itself is bounded by two NNW–SSE-striking faults that have been inactive for at least 15,000 years, and is underlain by a granitic pluton. The reservoir is vapour-dominated and situated in faulted metagreywacke (tight, competent, metamorphosed, poorly sorted sandstone). The reservoir can be divided into a normal-temperature reservoir (NTR) (∼1–2.6 km, T < 240 °C), and a high-temperature reservoir (HTR) which underlies the NTR in the northwest Geysers (T > 400 °C) (Garcia et al., Reference Garcia, Hartline, Walters, Wright, Rutqvist, Dobson and Jeanne2016). Geothermal production started in 1960, and reinjection started in the early 1980s as field pressures decreased (Majer et al., Reference Majer, Freeman, Johnson, Jarpe, Nihei, Hartline, Walter and Deniliger2017). Currently 60–80% of the water is reinjected. In the northwest of the Geysers an EGS demonstration project is being developed (Rutqvist et al., Reference Rutqvist, Dobson, Garcia, Hartline, Jeanne, Oldenburg, Vasco and Walters2015; Garcia, et al., Reference Garcia, Hartline, Walters, Wright, Rutqvist, Dobson and Jeanne2016).
Since the early 1980s, more than 750 events have been recorded annually in the Geysers geothermal field.
Since 2003, 20 M > 4.0 events have been recorded, with the maximum, M w 5.0, occurring on 14 of December 2016 (Majer et al., Reference Majer, Freeman, Johnson, Jarpe, Nihei, Hartline, Walter and Deniliger2017). The events show a strong spatial correlation to the (re)injection wells (Martínez‐Garzón et al., Reference Martínez‐Garzón, Kwiatek, Sone, Bohnhoff, Dresen and Hartline2014) and a temporal correlation to injected volumes (Trugman et al., Reference Trugman, Shearer, Borsa and Fialko2016).
Tuscany–Latium: The Tuscany–Latium geothermal region is situated in the west of Italy. The high heat flow derives from the post-orogenic collapse of the Apennines, which causes extension and magmatism (Batini et al., Reference Batini, Brogi, Lazzarotto, Liotta and Pandeli2003). Recent seismic activity is moderate (M 4.1 in 1970), but in 1724 a large event occurred in the region, with intensity up to VII–VIII (Batini et al., Reference Batini, Console and Luongo1985). The northern geothermal fields (Larderello-Travale, Monte Amiata) are characterised by a shallow reservoir (<1 km, T up to 250 °C) composed of evaporitic rocks and limestones, and a deeper reservoir (2.5–3.5 km, T > 350 °C) composed of fractured metamorphic rocks (Giovanni et al., Reference Giovanni, Guido and Adolfo2005). The southern fields (Torre Alfina, Latera, Cesano) target fractured limestones at 0.6–2.0 km depth (T < 230 °C) (Cavarretta et al., Reference Cavarretta, Gianelli, Scandiffio and Tecce1985; Buonasorte et al., Reference Buonasorte, Cameli, Fiordelisi, Parotto and Perticone1995; Evans et al., Reference Evans, Zappone, Kraft, Deichmann and Moia2012). Larderello-Travale is the oldest steam-producing geothermal field, with the first commercial powerplant in 1926.
Seismicity in the fields clustered around (re)injection wells and reached moderate magnitudes up to M L 3.2 at the Larderello–Travale field (Batini et al., Reference Batini, Console and Luongo1985). A M w 4.5 (M L 3.9) occurred in April 2000 near the Piancastagnaio field at Monte Amiata (Mazzoldi et al., Reference Mazzoldi, Borgia, Ripepe, Marchetti, Ulivieri, della Schiava and Allocca2015; Braun et al., Reference Braun, Cesca, Kühn, Martirosian-Janssen and Dahm2018), but the relationship with geothermal operations was difficult to identify due to high natural seismicity in the region and poor available seismic data. Several injection tests were performed, but not all tests resulted in significant seismicity. At Latera several injection tests only induced magnitudes up to 0.8 (Moia, Reference Moia2008).
Salton Sea: The Salton Sea geothermal field (Southern California) is located at the transition from the diverging East Pacific Rise to the strike-slip San Andreas Fault system (McGuire et al., Reference McGuire, Lohman, Catchings, Rymer and Goldman2015). The field is situated in a seismically active transtensional region between strike-slip faults. It is a water-dominated geothermal field located in sandstone, siltstone and shale, which are slightly altered at shallow levels (1–2 km and <280 °C) and more altered and cemented at deeper levels where temperatures exceeded 300 °C. Porosity in the shallow formations is 10–30% but decreases strongly with depth and alteration. Deeper rocks are, however, extensively fractured, which provides permeability. Production of steam started in 1986, and was increased to 5–10 million m3 per month from the 1990s, of which 80% was reinjected. With increasing scale of operations the seismicity rates increased. From 1985 to 2011 over 12,000 earthquakes with M > 1.7 were recorded, mostly between 3 and 7 km depth (Brodsky & Lajoie, Reference Brodsky and Lajoie2013). The largest observed event was a M 5.1. which was part of a large earthquake swarm with multiple M > 4 events. However, the correlation with operational parameters was less straightforward than e.g. at the Geysers; an initial correlation with production rates was observed, but also tectonically driven earthquake swarms occur in and near the field (Brodsky et al., 2013; Trugman et al., Reference Trugman, Shearer, Borsa and Fialko2016).
Great Basin: The Great Basin is a large basin in the west of the USA, characterised by active dextral strike-slip faulting and extensions, i.e. a transtensional stress regime. Geothermal systems in the basin are found near active zones of intersecting or overlapping faults, such as step-over fault systems, which provide permeable pathways for hot fluids, but rarely near mature fault zones, as these may have lower permeability (Faulds et al., Reference Faulds, Coolbaugh, Benoit, Oppliger, Perkins, Moeck and Drakos2010). The main geothermal target formations are metavolcanics and metamorphic (siliceous metamudstone) rocks at 150–250 °C (e.g. Lutz et al., Reference Lutz, Hickman, Davatzes, Zemach, Drakos and Robertson-Tait2010). In a few cases at the western margin, heat flow is of magmatic origin (e.g. at Coso field, T = 285 °C). Here the main reservoir rock is (grano)diorite (Davatzes & Hickman, Reference Davatzes and Hickman2010). Over 400 geothermal systems are found in the Great Basin, 27 of which have temperatures high enough for generation of electricity.
For most systems no induced seismicity is reported, but local monitoring systems were only placed near a couple of geothermal fields. Several small events were measured during EGS stimulation at Desert Peak with M L up to 1.7 (Benato et al., Reference Benato, Hickman, Davatzes, Taron, Spielman, Elsworth, Majer and Boyle2016) and production and reinjection in Brady’s field with M L up to 2.4 (Cardiff et al., Reference Cardiff, Lim, Patterson, Akerley, Spielman, Lopeman, Walsh, Singh, Foxall and Wang2018). At Brady, no seismic events were observed when pumping rates were high, but events were temporally correlated to times when production was halted. Larger magnitudes (M < 4.4) occurred in the high-temperature field Coso in the western margin of the basin (Trugman et al., Reference Trugman, Shearer, Borsa and Fialko2016).
Pannonian Basin: The Pannonian Basin (Fig. 4B) is a back-arc basin that started to form in the early Miocene through rifting and volcanism, and covers Hungary as well as parts of Croatia, Slovakia, Slovenia and Romania (Horváth et al., Reference Horváth, Musitz, Balázs, Végh, Uhrin, Nádor, Koroknai, Pap, Tóth and Wórum2015). Present-day inversion causes transpressive stresses, and seismicity occurs in the basin with magnitudes up to M 6.0 (Tóth et al., Reference Tóth, Mónus, Bus, Györi, Husebye and Christova2008). The prime geothermal target is the 100–300 m thick base of permeable (10−13–10−12 m2) Ujfalu Formation (1–2 km, 30–100 °C), which consists of high-porosity (20–30%) unconsolidated sediments (sands) overlying an aquitard formation (Horváth et al., Reference Horváth, Musitz, Balázs, Végh, Uhrin, Nádor, Koroknai, Pap, Tóth and Wórum2015). A second target is karstified Mesozoic carbonates at depths <2 km. There are over 350 sites producing thermal water mostly from the Ujfalu Formation, of which >150 are used for space heating. Most geothermal systems such as for example Szentes (Szanyi & Kovács, Reference Szanyi and Kovács2010; Bálint & Szanyi, Reference Bálint and Szanyi2015) consist of multiple wells, and only produce water, which over time leads to pressure decreases in the geothermal aquifer. Reinjection occurs in only 20 wells, for example in the Hódmezővásárhely geothermal system (Szanyi and Kovács, Reference Szanyi and Kovács2010) and in the Orosháza-Gyopárosfürdő geothermal system (Szita and Vitai, Reference Szita and Vitai2013).
No seismicity has been reported for any of the geothermal sites. No local networks are in place; the regional network has a detection threshold of ∼M 2.0 (Tóth et al., Reference Tóth, Mónus, Bus, Györi, Husebye and Christova2008).
Pohang: The Pohang EGS site is located in the Pohang Basin in the southeast of the Korean Peninsula and targets a granodioritic intrusion found from 2.4 km depth (Kim et al., Reference Kim, Ree, Kim, Kim, Kang and Seo2018a). The Pohang Basin is a Miocene back-arc basin which is currently subject to a compressive stress regime, and although natural seismicity in the vicinity of the EGS is low, earthquakes with M w 5.8 have occurred at 40 km from the EGS site (Kim et al., Reference Kim, Min, Kim, Choi, Yoon, Yoon, Yoon, Lee and Song2018b). Two wells (PX-1 and PX-2) were drilled to a depth of 4.2 km with a horizontal distance of 0.6 km between them. The temperature at this depth was 140 °C.
Between 29 January 2016 and 18 September 2017 five hydraulic stimulations were performed, three of them in PX-2 (the first, third and fifth) and two of them in PX-1 (the second and fourth) (Kim et al., Reference Kim, Ree, Kim, Kim, Kang and Seo2018a). The maximum wellhead pressures were reached during the first two stimulations and were 89.2 MPa (PX-2) and 27.7 MPa (PX-1) (Ge et al., Reference Ge, Giardini, Ellsworth, Shimamoto and Townend2019). A total volume of 7135 m3 was injected into PX-2 and 5663 m3 into PX-1, of which 2989 m3 and 3968 m3 was flowed back, so that the net injected volume in both wells was ∼6000 m3. Injection tests indicated that a hydraulic barrier was present between PX-1 and PX-2.
During drilling of PX-2 a fault zone was encountered at 3.8 km depth. This resulted in mud losses, and seismicity of up to M w 0.9 (Ge et al., Reference Ge, Giardini, Ellsworth, Shimamoto and Townend2019). Seismicity with magnitudes up to an M w 3.2 in April 2017 was recorded during the various stimulations in PX-1 and PX-2. Injection in PX-2 had reactivated the fault zone which penetrated by the well at 3.8 km depth. The third and last stimulations of PX-2 in September 2017 produced only small-magnitude seismicity up to M w 2.0 on this fault. However, seismicity restarted in mid-November 2017, with some foreshocks increasing in magnitude from M w 1.6 to M w 2.7. Subsequently, on 15 November 2017 the Mw 5.5 mainshock occurred at 4.3 km depth, just below the location of the foreshocks and seismicity previously induced by injection in PX-2 (Grigoli et al., Reference Grigoli, Cesca, Rinaldi, Manconi, López-Comino, Clinton, Westaway, Cauzzi, Dahm and Wiemer2018; Kim et al., Reference Kim, Ree, Kim, Kim, Kang and Seo2018a; Ge et al., Reference Ge, Giardini, Ellsworth, Shimamoto and Townend2019). A first-order hydromechanical modelling approach suggests that the pressure increase at the hypocentre depth was only 0.07 MPa, indicating the fault was close to failure (Ge et al., Reference Ge, Giardini, Ellsworth, Shimamoto and Townend2019).
Upper Rhine Graben: The Upper Rhine Graben is a 300 km long NNE–SSW-trending active rift system on the border of France and Germany. The graben is seismically active, with frequent small events and occasional moderate-sized events, and some historic events of M ∼7.0 (Grimmer et al., Reference Grimmer, Ritter, Eisbacher and Fielitz2017). Five medium- to high-temperature geothermal power plants are currently operational in the graben (Vidal & Genter, Reference Vidal and Genter2018). The wells at Basel (terminated) and Soultz-sous-Forêts target the fractured granitic basement at 3.5–5 km depth with temperatures of 160–200 °C (e.g. Cornet et al., Reference Cornet, Helm, Poitrenaud, Etchecopar and Talebi1997; Baria et al., Reference Baria, Baumgartner, Gerard, Jung and Garnish1999; Häring et al., Reference Häring, Schanz, Ladner and Dyer2008; Dorbath et al., Reference Dorbath, Cuenot, Genter and Frogneux2009; Deichmann et al., Reference Deichmann, Kraft and Evans2014). The geothermal systems at Insheim, Landau and Ritterhofen were developed using a multi-reservoir concept, where the interface of the granitic basement and the overlying tight, fractured sediments are both targeted (e.g. Schindler et al., Reference Schindler, Baumgärtner, Gandy, Hauffe, Hettkamp, Menzel and Wahl2010; Maurer et al., Reference Maurer, Cuenot, Gaucher, Grunberg, Vergne, Wodling and Schmittbuhl2015; Baujard et al., Reference Baujard, Genter, Dalmais, Maurer, Hehn, Rosillette, Vidal and Schmittbuhl2017; Küperkoch et al., Reference Küperkoch, Olbert and Meier2018; Vidal and Genter, Reference Vidal and Genter2018). At Bruchsal, only the tight, fractured Triassic–Carboniferous sandstone sediments were targeted at a depth of 2.5–3.5 km at a temperature of 100–150 °C (Meixner et al., Reference Meixner, Schill, Grimmer, Gaucher, Kohl and Klingler2016). Hydraulic stimulation of the pre-existing fracture network was required except at Bruchsal, and typically volumes between 10,000 and 50,000 m3 are injected at wellhead pressures between 15 and 30 MPa, except at Rittershofen where pressures were lower (Baujard et al., Reference Baujard, Genter, Dalmais, Maurer, Hehn, Rosillette, Vidal and Schmittbuhl2017).
Seismicity was monitored in most geothermal systems. At a number of sites felt events were induced, with the largest event being a M L 3.4 related to the Basel EGS stimulations (e.g. Häring et al., Reference Häring, Schanz, Ladner and Dyer2008; Deichmann et al., Reference Deichmann, Kraft and Evans2014). At other locations seismicity was smaller, but still felt by the local population, e.g. a maximum M L 2.9 at Soultz-sous-Forêts after stimulation (e.g. Cornet et al., Reference Cornet, Helm, Poitrenaud, Etchecopar and Talebi1997; Charléty et al., Reference Charléty, Cuenot, Dorbath, Dorbath, Haessler and Frogneux2007; Dorbath et al., Reference Dorbath, Cuenot, Genter and Frogneux2009), a M L 2.7 at Landau during circulation (Bönnemann et al., Reference Bönnemann, Schmidt, Ritter, Gestermann, Plenefish and Wegler2010) and a M L 2.4 at Insheim (Küperkoch et al., Reference Küperkoch, Olbert and Meier2018). Events occurred both during stimulation and circulation, and were located predominantly in the granitic basement (Pilger et al., Reference Pilger, Eulenfeld, Brüstle, Wegler, Plenefisch and Schmidt2017; Küperkoch et al., Reference Küperkoch, Olbert and Meier2018). However, felt events did not always occur; at Rittershoffen, close to Soultz-sous-Forêts, the maximum magnitude did not exceed ML 1.6 (Baujard et al., Reference Baujard, Genter, Dalmais, Maurer, Hehn, Rosillette, Vidal and Schmittbuhl2017; Lengline et al., Reference Lengline, Boubacar and Schmittbuhl2017). At Bruchsal also no seismicity was recorded during circulation, even though a local monitoring network was present with a magnitude of completeness of M L 0.7 (Gaucher, Reference Gaucher2016).
Japan: Japan is a tectonically active country with active volcanism and has large geothermal potential, with the first commercial geothermal powerplant opening in 1967 at Matsukawa. Currently there are 17 geothermal powerplants operational, and after a lack of interest in geothermal energy in the early 2000s, many more geothermal plants are planned after the Tohoku earthquake and nuclear disaster in 2011 (Tosha et al., Reference Tosha, Nishikawa, Shimada and Oishi2016). Geothermal fields mainly target Quaternary volcanoes and are located in the northeast of the country on the islands of Honshu and Hokkaido (e.g. Yanaizu-Nishiyama, Kakkonda), or in the southwest in Kyushu. In the late 1980s and early 1990s two HDR test sites were drilled and stimulated at Hijiori and Ogachi, targeting granodiorite basement in calderas. Fracturing experiments at Hijiori were performed in 1998, 1992 and 1995, by injection of 1960 m3, 51,500 m3 and 2115 m3 respectively (Sasaki & Kaieda, Reference Sasaki and Kaieda2002). Circulation tests were performed in 1995 and 2000–2002 with recovery factors of 39% and 53% (Kaieda, Reference Kaieda2015). At Ogachi two fracturing experiments were conducted in 1991 and 1992, injecting 10,000 m3 and 5500 m3 respectively (Ito, Reference Ito2003; Kaieda et al., Reference Kaieda, Jones, Moriya, Sasaki and Ushijima2005; Kaieda, Reference Kaieda2015).
At Yanaizu–Nishiyama (Okuaizu) geothermal field, seismicity was monitored by a local network (M c ∼ 1.0) (Asanuma et al., Reference Asanuma, Mitsumori, Adachi, Saeki, Aoyama, Ozeki, Mukuhira and Niitsuma2011; Mitsumori et al., Reference Mitsumori, Asanuma, Adachi, Aoyama, Ozeki and Saeki2012). Several M > 3.0 events occurred in the field, including a M JMA 4.9 event in November 2009, after 14 years of production and reinjection. Natural seismicity also occurs in the field, but a correlation with injection has been observed (Asanuma et al., Reference Asanuma, Eto, Adachi, Saeki, Aoyama, Ozeki and Häring2014). Events up to M 2.0 were recorded during fracturing at Ogachi (Kaieda et al., Reference Kaieda, Jones, Moriya, Sasaki and Ushijima2005; Kaieda, Reference Kaieda2015), but event sizes at Hijiori did not exceed M 0.6 during the different fracturing tests (Sasaki & Kaieda, Reference Sasaki and Kaieda2002). However, three months after the long-term circulation test in 2000–2002, a M 2.4 event occurred, at the edge of the stimulated reservoir (Kaieda, Reference Kaieda2015).
Other: Other case histories included in the review include geothermal fields in Mexico and El Salvador. The largest event associated with one of these fields is M L 6.6 which occurred on the Imperial Valley Fault in the Salton Trough (Glowacka & Nava, Reference Glowacka and Nava1996). Large-scale production from the nearby Cerro Prieto field in Mexico caused a reduction in pressure and subsidence over a large area surrounding the field (Glowacka et al., Reference Glowacka, González and Fabriol1999; Trugman et al., Reference Trugman, Borsa and Sandwell2014). The poroelastic stress-changes and differential subsidence may have contributed to the occurrence of the M L 6.6 event (Glowacka & Nava, Reference Glowacka and Nava1996). Other fields in Mexico in the Mexican Volcanic Belt and Baja California (Prol-Ledesma & Morán-Zenteno, Reference Prol-Ledesma and Morán-Zenteno2019) include Los Humeros (Lermo et al., Reference Lermo, Antayhua, Quintanar and Lorenzo2008; Urban & Lermo, Reference Urban and Lermo2012, Reference Urban and Lermo2013; Flores-Armenta, Reference Flores-Armenta2014), Los Azufres (Iglesias et al., Reference Iglesias, Contreras, Garcia and Dominquez1987; Arellano et al., Reference Arellano, Torres and Barragán2005; Urban & Lermo, Reference Urban and Lermo2012), and Los Tres Virgenes (Verma et al., Reference Verma, Pandarinath, Santoyo, González-Partida, Torres-Alvarado and Tello-Hinojosa2006; Antayhua-Vera et al., Reference Antayhua-Vera, Lermo-Samaniego, Quintanar-Robles and Campos-Enríquez2015; Prol-Ledesma et al., Reference Prol-Ledesma, Arango-Galvan and Torres-Vera2016). At Los Humeros, only a small fraction of the extracted fluid is reinjected, at Los Azufres about 50% is reinjected and at Los Tres Virgenes almost 80% is reinjected. Maximum observed magnitudes in these fields are M d 2.5, M d 4.6 and M d 1.9 respectively. In El Salvador, electricity is generated at two geothermal fields: the Chipilapa–Ahuachapan (Fabriol & Beauce, Reference Fabriol and Beauce1997; Monterrosa & López, Reference Monterrosa and López2010) and Berlín (Rivas et al., Reference Rivas, Castellón and Maravilla2005; Rodríguez & Aníbal, Reference Rodríguez and Aníbal2005; Kwiatek et al., Reference Kwiatek, Bulut, Bohnhoff and Dresen2014) fields. Maximum magnitudes detected were M d 3.0 and M w 3.7 (M L 4.4) respectively. The largest event in Berlín followed a hydraulic stimulation of one of the injection wells in the field (Kwiatek et al., Reference Kwiatek, Bulut, Bohnhoff and Dresen2014). At the Mirvalles field in Costa Rica microseismicity increased over time, with a maximum magnitude of M L 3.8 in 2003 (Moya & Nietzen, Reference Moya and Nietzen2010; Moya & Taylor, Reference Moya and Taylor2010). At the Palinpinon geothermal field in the Philippines, seismicity up to M 2.4 was observed after starting production and injection in 1983 (Bromley et al., Reference Bromley, Pearson and Rigor1987).
Summary
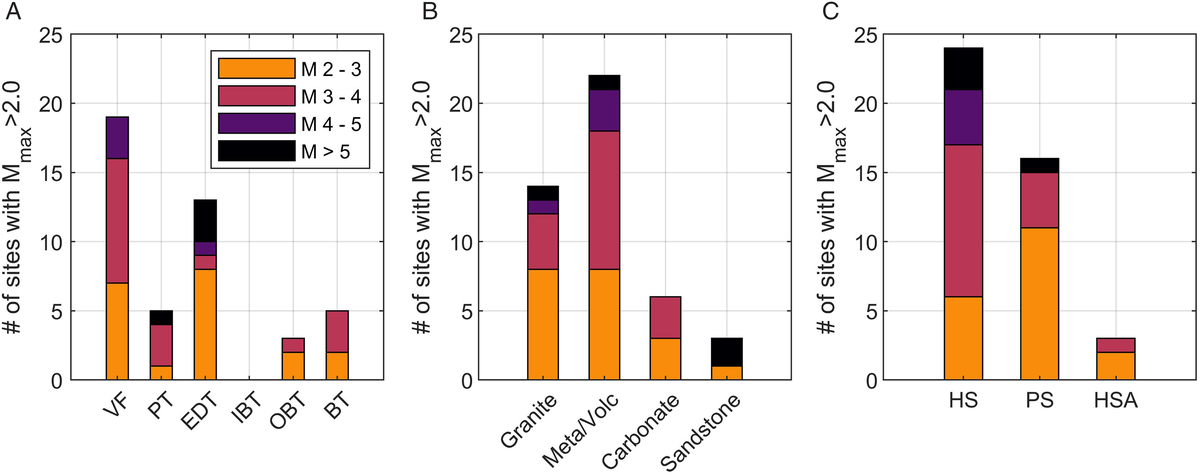
The occurrence of seismic events with M max> 2.0 for the different geothermal plays and systems discussed above is summarised in Figure 8. Most seismic events have been observed in the convection-dominated play types, mostly in the VFT and EDT (Fig. 8A). In these settings mostly hydrothermal systems (HS) are found, as well as some petrothermal systems (PS), which both show a relatively high number of M > 2.0 sites (Fig. 8B). Fewer events have been observed in conduction-dominated plays (IBT, OBT and BT). In particular for IBT no events of M > 2.0 have been reported to date. Seismicity was also mostly associated with projects targeting crystalline or metamorphic rocks (Fig. 8c). However, as observed from the review, PS in granite does not always induce M > 2.0 events; e.g. at Jolokia, Rittershoften and Helsinki, magnitudes did not exceed 1.9. Hot sedimentary aquifers (HSA) are only occasionally associated with seismicity of M > 2.0. The three cases of seismicity in HSA shown in Figure 8C are from the Molasse Basin where the underlying basement was reactivated. Operations in sandstone were not associated with a large number of M > 2.0 events. For HSA systems in sandstones, no M > 2.0 seismicity was reported, but for PS in Paralana, and HS in Mexico and USA, seismicity occurred. For the latter two cases magnitudes exceeded M 5.0.
Occurrence of induced seismic events for different (A) play types, with VF: volcanic fields, PT: plutonic type, EDT: extensional domain type, IBT: intracratonic basin type, OBT: orogenic belt type, and BT: basement type. (B) Rock types, and (C) system types, with PS: petrothermal systems or EGS, GF: geothermal field, and HSA: hot sedimentary aquifer.
Key factors and relation with the occurrence of felt induced events
In this section we summarise the key parameters related to the occurrence of felt induced events. The occurrence of induced seismicity is controlled by the combination of geological parameters (e.g. rock type) and operational parameters (e.g. injection pressure) obtained from the case study review. Note that it is challenging to determine unequivocal correlations between these parameters and maximum recorded magnitudes, because the parameters are often interrelated (e.g. depth and temperature) and many factors together contribute to the occurrence of felt seismicity. The following analysis attempts to establish rough trends or bounds between maximum observed earthquake magnitudes and operational or geological parameters.
Effect of geological parameters
For the cases presented in this study, felt seismicity in conduction-dominated settings only occurred in projects targeting rocks with low matrix porosity at depths larger than 2.5 km (Fig. 9A). The largest magnitude, of M 3.7, occurred due to stimulation of the Habanero EGS in the granite basement of the Cooper Basin (#2 in Fig. 9A). Also a few of the projects in the fractured carbonate rocks of the Molasse Basin generated seismicity, for example at Sankt Gallen (M L 3.5, #23), Unterhaching (M L 2.4, #26) and Poing (M L 2.1, #21). Proximity and a hydraulic connection to the granitic basement resulted in seismic events in these cases. However, for most of the fractured carbonates of the Molasse Basin no seismicity was reported, even though operations (circulation) are similar. This underlines how induced seismicity can be site-specific. Also, deep and tight sandstones of the North German Basin that were hydraulically fractured did not produce felt events. Felt seismicity was also not observed for the 35 doublets targeting the relatively porous Dogger carbonates in the Paris Basin (#45) which have been operational for >30 years. Shallow porous sandstone aquifers in the North German Basin (#35–39), Norwegian–Danish Basin and in the Netherlands (WNB) have also not been associated with felt seismicity.
Average rock matrix porosity against depth and the occurrence of induced seismicity. Cases where induced seismicity occurred are shown by square symbols where the size of the symbol scales with maximum magnitude. Cases where no seismicity was observed or seismic events were low (M < 2.0) are indicated with circles. Colours of the symbols give the rock type. (A) Case histories in conduction-dominated settings, including EGS and hot sedimentary aquifers (HSA). (B) Case histories in convection-dominated settings including EGS and hydrothermal systems (geothermal fields). For numbers see Table S2 (in the Supplementary Material available online at https://doi.org/10.1017/njg.2019.6); geothermal areas PL: Polish Lowlands, URG: Upper Rhine Graben, WNB: West Netherlands Basin.
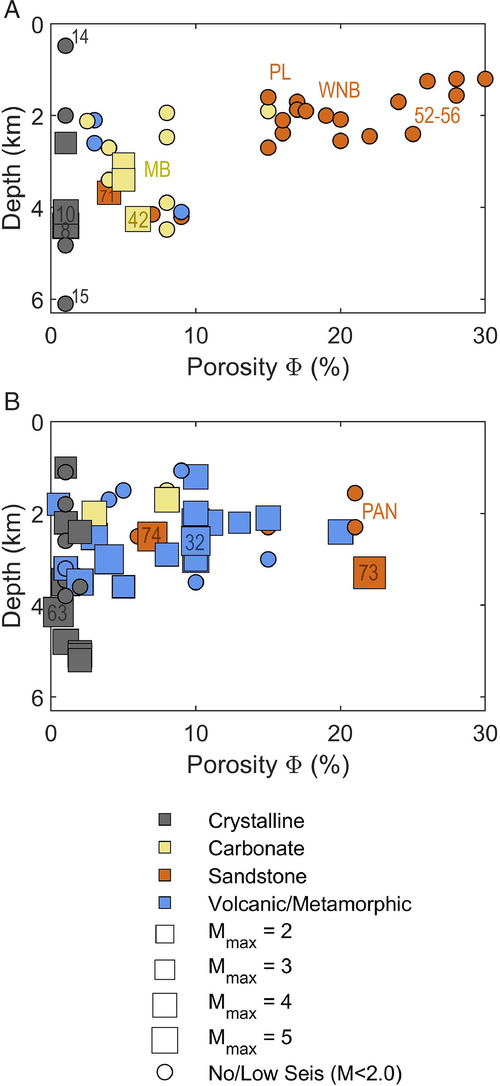
Felt seismicity was more often observed in geothermal projects in convection-dominated settings in tectonically active areas (Fig. 9B), in agreement with Figure 8A. Here, felt seismicity occurred in petrothermal systems (e.g. EGS projects) targeting low-porosity rocks, as well as in hydrothermal fields. The EGS projects targeted naturally fractured granites with low matrix porosity at depths > 3.0 km, including projects at Soultz-sous-Forêts (M L 2.9) and Basel (M L 3.4). The largest event was observed at the EGS near Pohang (M w 5.5, #46). The geothermal fields were located at shallower depths than the EGS, with maximum depths between 2 and 3 km. The rock types and porosities vary; some rocks such as the ignimbrites in the Taupo Volcanic Zone have a high porosity, whereas metamorphic rocks have lower porosities. Seismicity is common, and often clusters around reinjection wells (e.g. Rotokawa, the Geysers, Larderello, Hellisheiði). The largest event occurred in the Salton Sea geothermal field (M 5.5) which is composed of hydrothermally altered sandstones (#60), and at the Geysers (M 5.0, #7). The occurrence of natural seismicity sometimes makes it difficult to distinguish natural and induced seismicity, as for example at Salton Sea. Although seismicity is common, it is not always of large (M > 4) magnitude.
Figure 10 shows the maximum induced magnitudes against various geological parameters. Most felt induced events occurred in areas which were tectonically active (Fig. 10A), in agreement with Figure 9. All M > 4.0 events occurred in regions with a strain rate of 5 nanostrains a−1 or more. However, no further trend between the tectonic loading rates and maximum magnitudes was observed. The M w 5.5 at the Pohang EGS (#46) occurred in an area with relatively low tectonic loading rates of ∼5–6 nanostrains a−1, which is more than three orders of magnitude lower than the strain rate magnitude at e.g. the Geysers (M 5.0, #7) and Salton Sea (M 5.1, #60). Projects in tectonically inactive regions (R in Fig. 10A) on the other hand also generate felt events, up to a M L 3.7 at Habanero (#2). Both at Pohand and Habanero the pre-existing faults were close to failure, indicating that low tectonic loading rates do not mean that the stress is low. Projects in tectonically active regions on the other hand do not always generate seismicity, e.g. in the Pannonian Basin. Other factors such as the lithology and operational parameters are also of influence on seismicity.
Geological and tectonic parameters against maximum magnitudes observed at geothermal sites. Colours indicate the rock type of the geothermal target formation, the symbols the system type. The dotted lines indicate the range of possible magnitudes for cases where no seismicity was reported. The upper bound of this range indicated the magnitude of completeness in case local networks were present, or a M 2.0 (approximately the threshold for events to be felt) if no local network was present. (A) Depth to (crystalline) basement (negative values mean below basement). (B) Strain rate magnitude (second invariant of the strain rate tensor) from the Global Strain Rate Model (GSRM) (Kreemer et al., Reference Kreemer, Blewitt and Klein2014). R indicates the geothermal site was situated in a region assumed inactive in the GSRM. (C) Tectonic regime, where NF: normal faulting regime, NF-SS: transtensional regime, SS: strike-slip regime, SS-TF: transpressive regime, TF: thrust faulting regime.
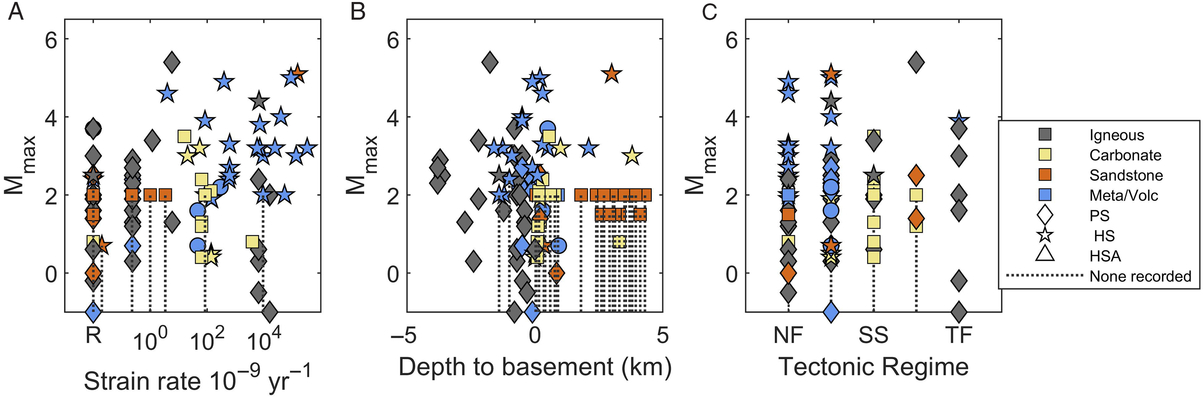
Felt events associated with petrothermal systems (PS) and hot sedimentary aquifers (HSA) showed a clear relationship with proximity to the basement (Fig. 10B). All felt events occurred at sites which targeted depths close to the basement, whereas no felt events were reported for PS and HSA targeting formations >0.5 km away from the basement. A M L 3.5 occurred ∼0.5 km below the Sankt Gallen well; here a previously undetected fault caused the pressure perturbation to migrate to depth. This shows the importance of faults as hydraulic conduits to depth. For hydrothermal systems, on the other hand, the distance to (crystalline or metamorphic) basement had no apparent influence on the occurrence of felt events. No clear trend was visible for event magnitudes and tectonic regime.
Effect of operational parameters
For PS and HSA the maximum magnitudes of induced seismicity increased with the injection pressure ΔP at the wellhead (Fig. 11A). Note, however, that ΔP is closely linked to the rock type targeted for the geothermal operations. Porous sandstones and permeable carbonates are targeted in HSA, which require relatively low ΔP, generally <5 MPa. Granites targeted by EGS on the other hand require >10 MPa during stimulation. Most felt events occurred at ΔP > 5 MPa, in systems targeting crystalline rock. However, seismicity was also induced at low ΔP (<1.5 MPa) during circulation at the aforementioned HSA systems at Unterhaching and Poing, as well as at Insheim in the Upper Rhine Graben. In all these cases, circulation occurred close to the crystalline basement, and most seismicity was located within the (critically stressed) basement rather than the sedimentary formation (Megies & Wassermann, Reference Megies and Wassermann2014; Küperkoch et al., Reference Küperkoch, Olbert and Meier2018). Both the magnitude of the pressure change, as well as the rock type and in situ stress, are thus important for the occurrence of felt events. For hydrothermal systems the relation with ΔP and induced magnitudes is not obvious. Note that e.g. at the Geysers no injection pressure is required; the reservoir formation is underpressured and water can be injected under gravity drive (here shown as ΔP 0.1 MPa). However, at the reservoir level the pressure change with respect to the initial formation pressure may be larger due to the water column, e.g. 7 MPa which is an excess pressure of ∼3.5 MPa (Martínez‐Garzón et al., Reference Martínez‐Garzón, Kwiatek, Sone, Bohnhoff, Dresen and Hartline2014). For future studies we recommend taking the pressure difference with respect to the initial reservoir pressure, rather than the wellhead pressure (the latter is equal to the former in case of a hydrostatic pressure gradient, but not for underpressured or overpressured reservoirs).
Operational parameters and maximum magnitudes of induced seismicity at the sites included in the case study review. The dotted lines indicate the range of possible magnitudes for cases where no seismicity was reported. The upper bound of this range indicated the magnitude of completeness in case local networks were present, or a M 2.0 (approximately the threshold for events to be felt) if no local network was present. (A) Injection pressure at the wellhead, (B) Absolute volume change, (C) Maximum reservoir temperature, (D) Temperature difference between reservoir temperature and injected fluid temperature.
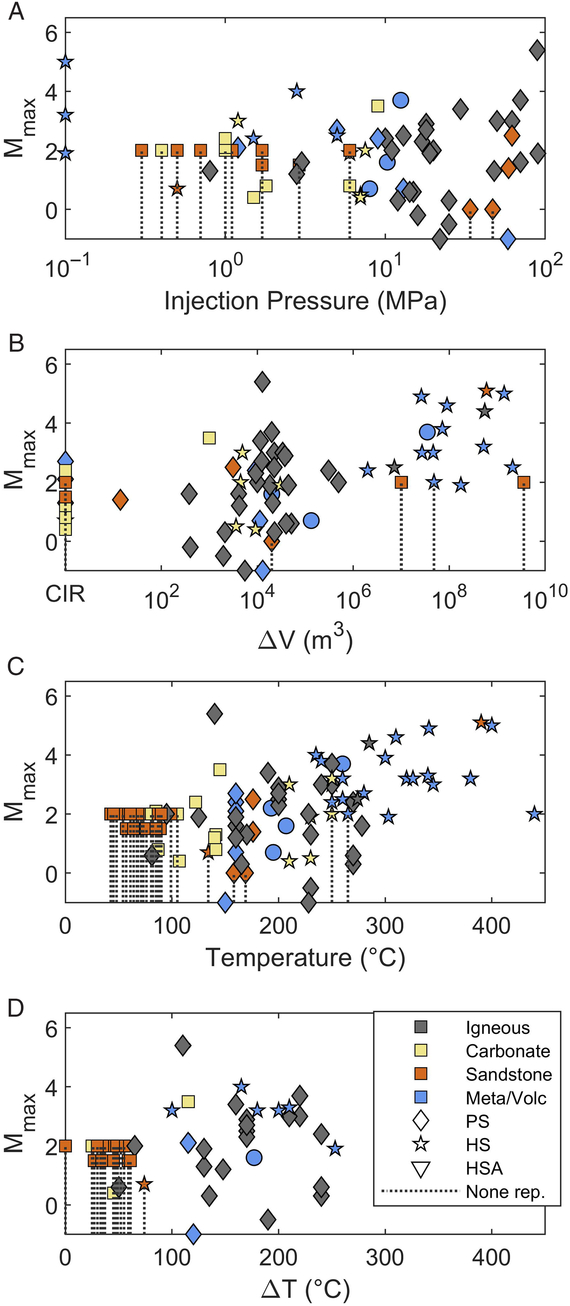
There was no clear correlation of M > 2.0 events with the absolute volume change in the geothermal systems (Fig. 11B). However, most M > 4.0 events occurred in hydrothermal systems in which large volume changes (often depletion) occur. One exception is the M w 5.5 Pohang event, in which the net injected volume was ∼6000 m3, which was comparable to the volume change of other EGS. Some hot sedimentary aquifers have large volume change but no reported seismicity (dotted lines), further illustrating the lack of a clear correlation between volume change and felt seismicity. For injection-induced seismicity in general, such a correlation was observed (McGarr, Reference McGarr2014; Zang et al., Reference Zang, Oye, Jousset, Deichmann, Gritto, McGarr, Majer and Bruhn2014); perhaps here the range of volume changes is too limited to clearly see that correlation.
In this study, all events with M > 2.0 occurred in systems targeting formations of ∼100 °C and hotter (Fig. 11C and D). Temperature differences are in excess of 80 °C, up to more than 200 °C in hydrothermal systems. The data indicate a trend of increasing maximum magnitudes with increasing temperature (and in most cases associated ΔT). Again, the M w 5.5 Pohang event is an outlier to that trend, i.e. it occurred at relatively low temperatures compared to the other sites.
Discussion
The review of the 85 geothermal case histories showed how the occurrence of induced seismicity varied for the different geothermal plays and systems analysed. The majority of felt seismic events occurred in geothermal systems in tectonically active, convection-dominated settings, both in hydrothermal systems and petrothermal systems (EGS). Also petrothermal systems in tectonically inactive regions generated felt seismicity. Hot sedimentary aquifers in tectonically inactive, conduction-dominated settings, on the other hand, mostly did not generate felt seismicity, unless operations occurred close to competent (crystalline) basement rocks. These observations provide an indication of the seismogenic potential of geothermal systems, i.e. what conditions are more or less prone to the occurrence of felt seismicity. In the following subsection we discuss the causes of different responses of geothermal reservoirs to geothermal operations. We then discuss the implications for geothermal systems in the Netherlands.
Response of geothermal reservoirs to geothermal operations
Critically stressed faults (or potentially active faults) play an important role in the occurrence of felt induced seismicity. These faults can be reactivated by small (<1 MPa) stress changes. A prominent example of this is the M w 5.5 earthquake at the Pohang EGS site on 15 November 2017, two months after the last stimulation. Although the maximum wellhead pressures reached 27 MPa during this stimulation, and almost 90 MPa during an earlier stimulation in 2016, modelling suggested that pressure diffusion caused a pressure change at the hypocentre location of only 0.07 MPa (Ge et al., Reference Ge, Giardini, Ellsworth, Shimamoto and Townend2019). However, this pressure change was enough to trigger foreshocks and the mainshock on the previously unmapped, critically stressed fault, releasing mainly tectonic strain. The seismic moment exceeded the expected moment based on the net injected volume by three orders of magnitude (Grigoli et al., Reference Grigoli, Cesca, Rinaldi, Manconi, López-Comino, Clinton, Westaway, Cauzzi, Dahm and Wiemer2018), again indicative of a large contribution of tectonic strain energy. Note that critically stressed faults and fractures may be present even though tectonic loading rates are low, as shown by, for example, in situ stress measurements in intraplate areas (Zoback & Townend, Reference Zoback and Townend2001) and measurements at the Fjällbacka HDR site in the Fennoscandian shield (Jupe et al., Reference Jupe, Green and Wallroth1992). Critically stressed faults also were reactivated at, for example, Habanero in the Cooper Basin (Holl & Barton, Reference Holl and Barton2015) where natural seismicity rates are low. Tectonic loading rates near Pohang were also relatively low, with little natural seismicity, although some active faults are present in the region (Ge et al., Reference Ge, Giardini, Ellsworth, Shimamoto and Townend2019). To avoid large-magnitude events it is therefore important to stay away from these critically stressed faults (see also recommendations in e.g. Baisch et al., Reference Baisch, Koch, Stang, Pittens, Drijver and Buik2016; Wiemer et al., Reference Wiemer, Kraft, Trutnevyte and Roth2017).
The review showed that the crystalline basement was prone to hosting induced events with M > 2.0, in agreement with previous studies (Evans et al., Reference Evans, Zappone, Kraft, Deichmann and Moia2012). Critically stressed faults are often found in the basement (see previous paragraph). Furthermore, because of the impermeable nature of crystalline rocks, geothermal operations in the crystalline basement require stimulations at ΔP often exceeding 10 MPa, which can also reactivate less critically stressed faults and fractures near the well. Crystalline rocks are also very competent (e.g. high Young’s modulus and shear modulus), and thus poroelastic and thermoelastic stress changes can be large. In addition, laboratory experiments showed granite has seismogenic frictional properties (Blanpied et al., Reference Blanpied, Lockner and Byerlee1995; Ge et al., Reference Ge, Giardini, Ellsworth, Shimamoto and Townend2019). However, the characteristics of the local structural fabric (fractures, faults) also play an important role in whether large-magnitude events occur. During EGS stimulations in Helsinki for example it was also noted that seismicity occurred in a 3-D ellipsoidal volume, in contrast to a planar fault structure as observed in Basel and the Cooper Basin (Kwiatek et al., Reference Kwiatek, Saarno, Ader, Bluemle, Bohnhoff, Chendorain, Dresen, Heikkinen, Kukkonen and Leary2019). Event magnitudes scaled with injected volume, so that injection strategy could be adjusted during stimulations and magnitudes remained limited to M w 1.9. A relatively large amount of small-scale seismic activity may have relaxed the stresses during stimulation.
Not only stimulations within the basement itself generated seismicity of M > 2.0; also stimulation or circulation close to the basement resulted in M > 2.0 events. This includes circulation in the faulted and fractured Malm carbonates in the Molasse Basin at Unterhaching and Poing, and at the transition from tight sedimentary formation to basement in the Upper Rhine Graben at Insheim and Landau (Megies & Wassermann, Reference Megies and Wassermann2014; Küperkoch et al., Reference Küperkoch, Olbert and Meier2018; LIAG, 2018). The majority of the seismic events occurred in the crystalline basement, although some may also have occurred in the tight sedimentary rocks overlying the basement (Küperkoch et al., Reference Küperkoch, Olbert and Meier2018). Fractures and faults can transmit pressure changes from the well to critically stressed faults in the basement, showing how a hydraulic connection to the basement increases the seismogenic potential. This is similar to induced seismicity associated with other activities such as waste water injection, where low-pressure changes over a large area reactivated critically stressed basement faults (e.g. Zhang et al., Reference Zhang, Person, Rupp, Ellett, Celia, Gable, Bowen, Evans, Bandilla and Elliot2013; Yeck et al., Reference Yeck, Weingarten, Benz, McNamara, Bergman, Herrmann and Earle2016). However, in the Molasse Basin the majority of geothermal systems did not generate seismicity or only generated low-magnitude events. Analysis of fault criticality showed many faults are not critical so that reactivation did not occur or only after significant thermal and chemical changes, indicating again the importance of the local structural fabric, the related hydrogeology and potential hydraulic connection to the basement, and the stress field (Seithel et al., Reference Seithel, Gaucher, Mueller, Steiner and Kohl2019). Note that experiences from hydraulic fracturing also show that not only basement is prone to hosting felt seismic events, but highly stressed competent sedimentary formations also can host significant seismicity (Lei et al., Reference Lei, Wang and Su2019); this should be taken into account for geothermal systems as well.
Doublet operations in porous sedimentary formations did not generate felt seismicity. Both operational and geological parameters in these sedimentary formations are less likely to lead to felt seismicity. First of all, stress changes in these formations are smaller, as (re)injection pressures are low (<2 MPa), net volume changes are often zero (circulation) or negative (depletion) and the rocks themselves are less competent (in particular, poorly consolidated sands) which reduces the magnitude of poroelastic and thermoelastic stresses. In addition, the state of stress in sedimentary formations can be less critical than in the crystalline basement, depending on the lithology. For example, in clay-rich formations viscoelastic creep is expected to relax a large fraction of the differential stress imposed by tectonic loading (Sone & Zoback, Reference Sone and Zoback2014). High σ h /σ v ratios (close to 1, meaning isotropic stress state) were observed in clay-rich layers, salt formations and anhydrite-rich layers, whereas in limestone layers the differential stress was much higher (Cornet & Röckel, Reference Cornet and Röckel2012). These stable stresses in clay-rich layers would prevent an earthquake growing very large on a fault cross-cutting a succession of, for example, sands and clay-rich layers. A near-isotropic stress state in sedimentary layers around salt domes can explain why in hydraulic fracturing tests in tight sandstones the North German Basin did not induce any (micro)seismicity, even though the maximum injection pressures reached 90 MPa (Rioseco et al., Reference Rioseco, Löhken, Schellschmidt and Tischner2013). Hence, whereas stress magnitudes and directions are on average more continuous and critical in the crystalline basement, the magnitude and direction of stress in sedimentary formations can vary with depth and location, depending on the lithologies present. Another effect of the presence of clay-rich formations is that they act as an aquitard (as long as no major fault zones are present), preventing pressure change from migrating to critically stressed faults in the basement. The thick sequence of shales present between the carbonates and the crystalline basement in the Paris Basin could have prevented pressure and temperature perturbations extending to depth, and may together with the operational parameters and in situ stress explain why no seismicity was observed in any of the 34 doublets.
Geothermal fields which are always situated in tectonically active settings are also often seismogenic, although magnitudes are not always large. The largest magnitudes occurred in the Geysers, Salton Sea, Yanaizu Nishiyama and Hellisheidi. Often (but not always) events show a spatiotemporal correlation to reinjection operations, and thermoelastic stressing may play a large role. In Iceland for example the injectivity depended strongly on injected fluid temperature, because of increased thermal contraction of the reservoir faults and fractures with cooler fluids. It is unclear why events in some geothermal fields remain smaller than in other fields. Often subsidence is observed above the fields, in particular when the net volume depletion is large. Subsidence can be significant and contribute to inducing to seismic events, e.g. at the Geysers and Cerro Prieto. At the Cerro Prieto field the subsidence reached much further than the field boundaries, as the geothermal reservoir (sands and shales) is recharged from the sides (Glowacka et al., Reference Glowacka, González and Fabriol1999). The large subsidence bowl interacted with several major active faults, and subsidence could have altered the stresses and triggered large earthquakes. This shows how volumetric changes due to reservoir depletion also play a role in inducing seismic events.
To summarise, interaction of operational parameters with the in situ state of stress and presence of large optimally oriented faults, and the hydrogeological and mechanical (i.e. rock competency, rock creep behaviour, and fault friction) properties of reservoir rocks and overburden and underburden, all have a large effect on the occurrence of M > 2.0 seismicity. Seismicity with M > 2.0 becomes more likely when operations cause stress changes on critically stressed faults (which are often found in the crystalline basement), or when stress perturbations are transmitted from sedimentary formations to the crystalline basement, e.g. if a hydraulic connection exists. The larger the pressure and temperature perturbations and the area over which they act, the larger is the chance of affecting a critically stressed fault or bringing a fault to failure. Operations in porous sandstone aquifers interbedded with clay-rich layers far from the basement are less likely to generate felt seismic events as pressure changes are lower and a hydraulic connection to the basement is often less likely (depending on the local geology). Thermoelastic stresses may, however, still be significant, and research into the response of porous sandstone formations to thermal stresses is recommended.
Relative importance of geological parameters on the occurrence of seismicity
The relative importance of the geological factors can be quantified using logistic regression (Pawley et al., Reference Pawley, Schultz, Playter, Corlett, Shipman, Lyster and Hauck2018). Here we used logistic regression to obtain a first-order assessment of the statistical importance of geological parameters, and which parameter may be indicative of the potential for causing seismic events. The relative importance of the depth, temperature, distance to basement, matrix porosity, and logarithm of the tectonic strain rate were analysed with logistic regression with L1 regularisation in MATLAB®, with eightfold cross-validation. Strain rates of areas outside of actively deforming regions were set to 10−11 a−1, in agreement with typical values for cratons and intraplate regions. The effect of these geological parameters on whether a site is ‘seismic’ (i.e. M > 2.0 recorded) or ‘low-seismic’ (M < 2.0 or none recorded) was investigated. We also tested two different cut-off values for seismic cases (M > 3.0 and M > 4.0). The regression was applied to all cases included in the review for which the five parameters were known. The five parameters were normalised to span a range from 0 to 1.
The L1 regressions showed that all five parameters help to explain the observed variability in seismic response (Fig. 12). For a cut-off M > 2.0 geothermal reservoir, temperature had the strongest influence and was positively correlated to the occurrence of seismicity. A smaller effect was observed for porosity and strain rate, that had the same strength but opposite sign (i.e. matrix porosity was negatively correlated to the occurrence of seismicity). Depth had the smallest model coefficients. For M > 3.0, again reservoir temperature had the strongest correlation, now followed by distance to basement. For M > 4.0, temperature remained strongest, followed by strain rate.
Model coefficients of the logistic regression analysis of the five geological parameters on the occurrence of felt seismicity.
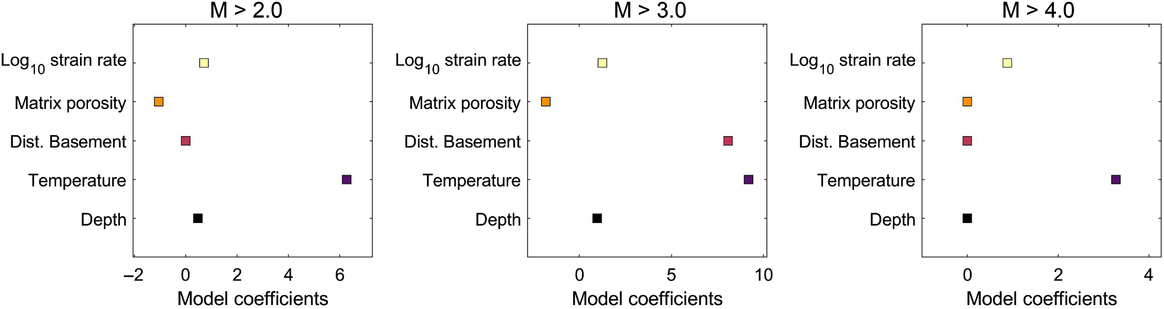
This is in agreement with the dominant mechanisms and key observations discussed in the previous subsection. Most M > 4.0 events were observed in geothermal fields which are situated in high-temperature and tectonically active (high strain-rate) regions. For M > 2.0 events the distance to basement did not show up as a dominant factor, although it was observed that operations within or close to basement were prone to generate seismicity. It was, however, also observed that the local structural fabric may have a large role in causing felt seismic events; this factor is not included in the importance analysis and could explain why basement was not a dominant factor. Also, for geothermal fields the (role of) basement is different compared to sedimentary aquifers close to basement.
As more and more geothermal projects start and knowledge increases, we recommend future work on (region-specific) logistic regression and its potential to quantify the likelihood of the occurrence of felt seismic events. In addition, if possible the presence of large faults in the vicinity of the geothermal systems and the state of stress on these faults could be included.
Implications for geothermal systems in the Netherlands
Most Dutch geothermal targets are situated in the West Netherlands Basin (WNB), which is an inactive rift basin at the west end of the Ruhr Valley Graben (RVG), or in the Central Netherlands Basin (CNB) and the Texel–IJsselmeer High (TIJH) (Fig. 1). The target formations in these region are porous sandstone aquifers of Lower Cretaceous, Upper Jurassic or Permian age (Table 1). Other targets include fractured limestones that are found locally, e.g. in the south and southeast of the Netherlands near the Ruhr Valley Graben. Here we discuss the main geological and operational characteristics of (future) geothermal systems in the Netherlands. We relate these characteristics to the mechanisms and key factors related to the occurrence of felt seismic events, and classify the seismogenic potential for each target. The seismogenic potential is based on the key factors, as well as previous occurrences of seismicity in the geothermal target or an analogous setting in another country.
Main geothermal target formations in the Netherlands and seismogenic potential. For a more extensive description of the lithostratigraphy see www.dino-loket
a As of 1 June 2019.
Doublet operations in the Netherlands
For geothermal doublets in the Netherlands the pumping pressure applied for the thermal loop (production plus injection) is in the order of 20% of reservoir hydrostatic pressure, due to performance and safety constraints (Van Wees et al., Reference Van Wees, Kronimus, Van Putten, Pluymaekers, Mijnlieff, Van Hooff, Obdam and Kramers2012). The allowed pressure changes at the injector are restricted to 13.5 MPa km−1 (State Supervision of Mines & TNO-AGE, 2013). For a saline water gradient of 10.8 MPa km−1 and a reservoir depth of 2 km this would, for example, give a pressure difference of 5.4 MPa at the reservoir level. For high-porous matrix-dominated reservoirs at a few hundred metres from the well, the pressure changes are likely to be small, in the order of <0.1 MPa (Willems et al., Reference Willems, Nick, Weltje and Bruhn2017). However, temperature changes can be significant; simulations of a doublet in the West Netherlands Basin show how the aquifer temperature around the injection well can decrease by more than 30 °C within an area of several hundreds of metres over 30 years (Willems et al., Reference Willems, Nick, Weltje and Bruhn2017). Such changes can cause considerable thermoelastic stressing in the cooled reservoir-volume surrounding the injection well (see ‘Stress changes: thermoelastic stressing’ above). The thermal stress effect is strongly dependent on thermal cooling (ΔT) and the Young’s modulus (E) of rocks (Equation 1), and may thus be stronger with depth (higher ΔT and more competent rocks). Further research on the effect of thermal stresses on the potential for fault reactivation is recommended: for example on the spatiotemporal distribution of the stress changes and the stress path, and to what extent these stresses may be transmitted to or relaxed by inelastic deformation of over- and underlying clays.
In many of the geothermal regions in the Netherlands the seismic network has a magnitude of completeness of 1.5 (Dost et al., Reference Dost, Goutbeek, Van Eck and Kraaijpoel2012). Locally the detection completeness can be lower, in particular in the north of the Netherlands near the Groningen gas field.
In the following subsections the main geothermal target formations in the Netherlands are described. For information on the nomenclature and lithological descriptions see also www.dino-loket.nl.
Tertiary
Tertiary rocks (Palaeogene, Neogene) occur nearly everywhere in the Netherlands at depths of 0–1300 m, though in the RVG the depth increases locally up to 1.8 km (Fig. 13A). The thickness is mostly up to about 100 m, but in the RVG and WNB it can increase to 200–300 m. The rocks constitute loosely consolidated sandstone, siltstone and claystone of predominantly marine origin. The Tertiary rocks unconformably overlie the Cretaceous Chalk group, and are usually unconformably overlain by the sandstones, siltstones and claystones of the Quaternary Upper North Sea Group. Due to the relatively shallow depth, the temperature of the reservoirs is also relatively low. In the past the reservoirs have not attracted much attention for geothermal exploration, but the first well into the Tertiary (Zevenbergen) was drilled in 2017 to a depth of 0.8 km, reaching a temperature of 30 °C. Production is expected to start in 2019. The loosely consolidated sandstone and shale and clays are very porous and have a low competency, and pressure and stress changes are likely low. A hydraulic connection to competent (basement) rocks at depth is not present. Operations in similar lithologies such as in the Pannonian Basin have not generated any seismicity, and the seismogenic potential of this formation is low.
Depth maps of the main geothermal target formations in the Netherlands; doublets targeting these formations are indicated by black dots. Depth maps of the aquifers are from ThermoGIS v2.1. (A) Tertiary (Brussels Formation), (B) Lower Cretaceous (Rijnland Group), (C) Upper Jurassic (Schieland Group, Delft and Alblasserdam Members), (D) Lower Triassic, (E) Permian (Rotliegend), (F) Upper Carbonifeorus (Limburg Group, Hunze and Dinkel Subgroups), (G) Lower Carbonfierous (Zeeland Group), (H) cross-section along the AA–AA′ line shown in (E) (www.dino-loket.nl).
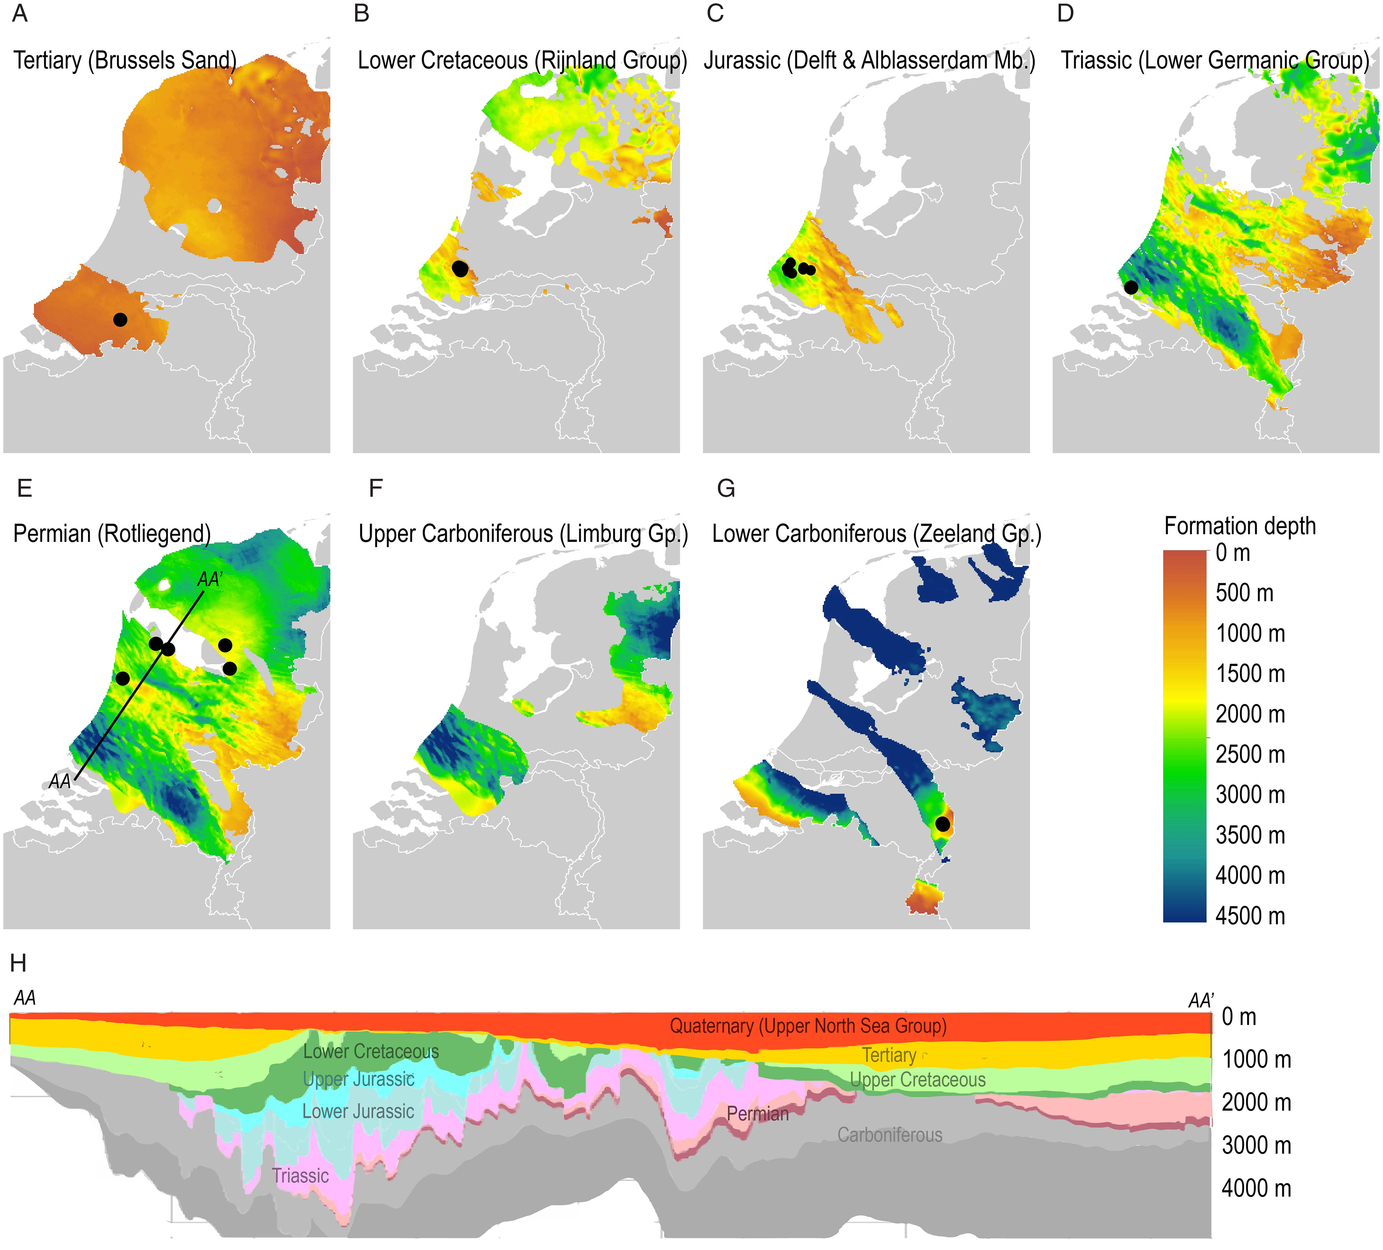
Lower Cretaceous and Upper Jurassic sandstones
The Cretaceous and Upper Jurassic sandstones are a prime target of geothermal operations in the Netherlands, and have shown favourable conditions in the WNB (Fig. 13B and C). The WNB is a small transtensional basin containing a number of NW–SE-striking half-grabens that formed during the Jurassic and Early Cretaceous (e.g. Willems, Reference Willems2012).
The doublets drilled to these formations have reached depths of 2–3 km, reaching temperatures between 60 and 90 °C (Table S1, in the Supplementary Material available online at https://doi.org/10.1017/njg.2019.6). Figure 14 shows the stratigraphy of the WNB, including the main target formations which are the Vlieland Sandstone Formation (with the Berkel Sandstone and Rijswijk Members) and Nieuwerkerk Formation (with the Delft and Alblasserdam Members), which are comprised of fluvial sands interbedded with clay layers with average porosities of 20% (DeVault & Jeremiah, Reference DeVault and Jeremiah2002, Willems, Reference Willems2012; Vondrak et al., Reference Vondrak, Van de Weerd, Van Leeuwen and Brautigam2014; Donselaar et al., Reference Donselaar, Groenenberg and Gilding2015). The Upper Jurassic is underlain by the Aalburg Formation of the Altena Group, which consists of calcareous claystones (www.dino-loket.nl). The presence of these thick clay-rich sequences and the depth of the basement (>5.5 km) makes a hydraulic connection to the basement unlikely. The basin is tectonically inactive, and the stress is extensional with the maximum horizontal stress oriented NW–SE. The stress magnitudes are unknown. Several oil and gas fields targeting the Lower Cretaceous and Upper Jurassic formations are present in the area (e.g. Fig. 1B), such as the Berkel Field, De Lier Field and the IJsselmonde Field (www.nlog.nl, de Jager et al., Reference De Jager, Doyle, Grantham and Mabillard1996). These fields, although they are located somewhat shallower than the geothermal doublets, have not led to any induced events over decades of hydrocarbon production, suggesting the stress is not critical. Also the geothermal doublets have been operational from 2006 without inducing (felt) seismicity. In similar geological settings in the North German Basin and Poland no events have been recorded. These observations suggest that geothermal operations in the shallow porous sandstones of the West Netherlands are unlikely to generate seismicity.
Stratigraphy of the West Netherlands Basin, from the Late Triassic to the Cenozoic (DeVault & Jeremiah, Reference DeVault and Jeremiah2002). AAPG©2002. Reprinted with permission of the American Association of Petroleum Geologists (AAPG) whose permission is required for further use.
Triassic sandstones
Another geothermal target formation is the Triassic Buntsandstein Group (Fig. 1D), including the Nederweert Sandstone, Volpriehausen Formation, Dethlingen Formation and Hardegsen Formation, which are comprised of a succession of sandstones and silty claystones. The Main Buntsandstein Group is underlain by a 150 m thick Lower Triassic succession of clays and sands, and overlain by evaporites, claystones and carbonates of the Upper Germanic Trias Group. The Buntsandstein Group has favourable conditions for geothermal exploitation in the WNB and possibly in the RVG in the southeast (e.g. Kramers et al. Reference Kramers, Van Wees, Pluymaekers, Kronimus and Boxem2012), with temperatures of 75–130 °C and depths of 2–4.5 km. However, due to a burial anomaly the porosity and permeability are low in the central parts of the WNB and the RVG in the southeast. At the margins of the WNB porosity is good, ranging from 10% at 3 km to 20% at 2 km depth (Bender, Reference Bender2012). Here the Vierpolders doublet (Fig. 13C) has been circulating since the start of 2016. The state of stress is unknown, but no induced seismicity has been observed in relation to geothermal operations, or in relation to oil and gas fields targeting the Buntsandstein Formation in the WNB such as the Brakel Field (www.nlog.nl). In the Brakel Field, hydraulic fracturing was performed in 2008 with injection pressure >25 MPa, but no seismicity was reported and the state of stress was likely not critical. The distance between geothermal operations in the Trias in the WNB and basement is large (>2 km) and a hydraulic connection to basement is thus unlikely. Pressure changes are low, but temperature change may be significant. In similar geological settings in the North German Basin and Poland no events have been recorded. These factors indicate that geothermal operations in the Triassic sandstones of the West Netherlands are unlikely to generate felt seismicity, but it remains important to avoid large faults. Note however that in other areas (CNB, northern Netherlands) gas production from the Buntsandstein Formation has led to felt seismic events, notably in the Roswinkel Field (up to M L 3.4), and the offshore Q04-A field (up to M L 2.7) and Q01-B field (up to M L 2.6) (Fig. 1B). We recommend further research into the response of the Triassic Buntsandstein Formation to geothermally induced stress changes, and potential differences in geological and petrophysical parameters and stress between the WNB and other areas in the Netherlands.
Permian sandstones
The Permian Slochteren sandstone Formation of the Permian Rotliegend has favourable temperature–depth conditions in the CNB and TIJH. Six doublets are currently producing in the provinces of North Holland and Flevoland (Fig. 13E): the three Middenmeer doublets, Koekoekspolder (Veldkamp et al., Reference Veldkamp, Mijnlieff, Bloemsma, Donselaar, Henares, Redjosentono and Weltje2015), Andijk, and Luttelgeest. These doublets target depths between 1.9 and 2.3 km where temperatures are 70–100 °C (Table S1 in the Supplementary Material available online at https://doi.org/10.1017/njg.2019.6). The Slochteren is overlain by anhydrites, carbonates and rock salt, which likely have stable stresses due to viscoelastic relaxation. Here the Upper Carboniferous underburden (Limburg Group) is composed of sands, shales and mudstones (Ruurlo Formation, www.dinoloket.nl). Seismic events have been observed for gas fields producing from Permian sandstones in the north and west of the Netherlands at a depth of 3 km. These include the Groningen gas field with >1000 earthquakes with magnitudes up to M L 3.6, the Bergermeer field with several M L > 3 events, the Eleveld field (up to M L 2.8), and the Annerveen field (up to M L 2.4). Many of these events occurred after decennia of production, which can be an indication that the state of stress is initially not critical. The formation can be seismogenic, but the stress path and stress changes due to gas depletion are different than those in geothermal systems. We recommend further research into the differences and similarities between the stress changes generated during gas depletion and geothermal operations; in particular the thermoelastic stress which can be large. Seismogenic potential of the doublets is likely low, but care must be taken to stay away from faults (see also e.g. Baisch et al., Reference Baisch, Koch, Stang, Pittens, Drijver and Buik2016; Wiemer et al., Reference Wiemer, Kraft, Trutnevyte and Roth2017). Care must be taken also in case of geothermal activities in or near (former) gas fields, as gas depletion may have altered the state of stress.
Upper Carboniferous
A potential target formation is the Upper Carboniferous sandstone rocks of the Hunze and Dinkel Groups (Fig. 13F). These occur mainly in the east and WNB, whereas in the rest of the Netherlands the Hunze and Dinkel Group are characterised by shales. The sandstones were formed as sheet flood and fluvial channel sandstones. The aquifer is underlain by shales of the Epen Formation, and overlain by sandstones of the Rotliegend. The expected permeabilities are low, with the exception of the eastern part of the Netherlands, coinciding with a shallow depth and therefore relatively low temperature. In the largest part of the WNB, the rocks are buried too deep for conventional geothermal doublet operations without the necessity of stimulation.
Lower Carboniferous
The deepest formation currently targeted in the Netherlands is the fractured and karstified Zeeland Formation of the Carboniferous Limestone Group. In large parts of the Netherlands the Zeeland Formation lies at depth >4 km (Fig. 13F), and its composition in these parts is unknown (Fig. 13G). In the province of Limburg in the southeast of the Netherlands, karstified, fractured and faulted Dinantian limestones of the Zeeland Group are targeted by two doublets: Californië Wijnen Geothermie (CWG) which started in January 2013, and Californië Lipzig Gielen (CLG) which started in the summer of 2017 (Table S2, in the Supplementary Material available online at https://doi.org/10.1017/njg.2019.6; Burghout et al., Reference Burghout, Vorage and Broothaers2019; Vörös and Baisch, Reference Vörös and Baisch2019). The doublets are situated in a stable fault block (Peel and Venlo blocks) north of the RVG and reach a depth of ∼2.5 km (Fig. 13F). Matrix porosity is low, but permeability is provided by the fractures and faults. The production wells of both doublets, and the injection well of CWG cross-cut the Tegelen Fault, which is a large fault bounding the Venlo Block (Vörös & Baisch, Reference Vörös and Baisch2019). Natural seismicity occurs in the region, with eight events with M > 2.2 within 20 km of the doublets. Slip tendency analysis indicates that the state of stress on (some) faults including the Tegelen Fault is close to failure (Vörös & Baisch, Reference Vörös and Baisch2019). At this location the Zeeland Formation is overlain by claystones (Epen Formation), and competent Devonian sandstones/quartzites may be present in the underburden (Reith, Reference Reith2018; Burghout et al., Reference Burghout, Vorage and Broothaers2019).
Even though pressure changes during circulation are small, the fact that circulation occurred through a large fault zone motivated local monitoring of seismicity, which was conducted from 2014 (Baisch & Vörös, Reference Baisch and Vörös2019; Vörös & Baisch, Reference Vörös and Baisch2019). Operations in CWG were suspended in May 2018. After a small (M L 0.0) event occurred near CLG in August 2018, operations were halted. Within two weeks, nine more events occurred up to M L 1.7. Since then, operations in both doublets remained suspended because of the uncertainties related to the nature of the seismic events (State Supervision of Mines, 2019). Although the events appear to occur several km below the geothermal reservoir (Spetzler et al., Reference Spetzler, Ruigrok, Dost and Evers2018; Baisch and Vörös, Reference Baisch and Vörös2019), they are temporally correlated to production stops in the CWG doublet. A possible explanation could be the interplay between pressure changes and thermal stresses (Baisch & Vörös, Reference Baisch and Vörös2019; Vörös & Baisch, Reference Vörös and Baisch2019).
Doublet operations in carbonates abroad have occasionally generated seismicity with M > 2.0. Recently, injection tests in a geothermal well targeting the same limestone in Belgium (Balmatt) have generated events up to M L 2.1 (23 June 2019), clearly lining up on a linear structure close to the injection well signifying that a fault has been reactivated (www.vito.be). Doublets in the Malm carbonates of the Molasse Basin near Munich have in a few instances (2 out of 16) caused induced events (M 2.0–2.4). Most of these larger events occurred in the underburden of the Malm, i.e. in the crystalline basement. This is different from the situation in the Netherlands where other (competent) sediments underlie the Lower Carboniferous Limestone instead of crystalline rocks (though stressed, competent sedimentary formations may also host seismic events). Smaller events have occurred in the vicinity of other doublets in the Malm (Seithel et al., Reference Seithel, Gaucher, Mueller, Steiner and Kohl2019). Fault analysis showed that the occurrence of seismicity is site-specific and depends, among other things, on the structural fabric and state of stress (Seithel et al., Reference Seithel, Gaucher, Mueller, Steiner and Kohl2019).
The observations from the Netherlands and abroad show that (small to moderate) seismic events may thus occur in or around geothermal operations in carbonate formations, and the potential for induced seismicity is larger than for the porous sandstone aquifers. It is important to characterise large faults in the vicinity of the (planned) geothermal system, and their reactivation potential in the stress field.
The review showed that geothermal operations in most geological settings comparable to those found in the Netherlands did not generate M > 2.0 events. However, seismicity cannot be excluded. In particular, in faulted carbonates M > 2.0 events may occur, but the potential for these events remains site-specific and dependent on the local fault and fracture fabric and the state of stress. Taking into account the different key parameters shown in Table 1 helps to assess the possibility of the occurrence of felt events and motivate additional characterisation of the subsurface in case the potential for M > 2.0 events is larger than desired. Additionally, it is also important to inform and involve the public on the development of geothermal systems and potential hazards as we proceed with the energy transition (McComas et al., Reference McComas, Lu, Keranen, Furtney and Song2016).
Conclusion
A case history review was performed to assess the potential for the occurrence of felt induced seismicity in geothermal systems. A total of 85 cases in various geothermal plays were analysed. Here the main findings are listed:
The review shows that doublet operations in shallow, porous sandstone formations did not induce M > 2.0 seismicity. Porous sandstone layers are usually found at relatively shallow depth, and are far away from the crystalline basement which is prone to seismicity. Also the pressure changes are small as no stimulation is required. Furthermore sandstone formations are often intercalated with clay and shale layers, which could hydraulically isolate the formation from deeper layers.
Geothermal operations within crystalline basement are prone to generate felt seismicity. Crystalline basement is competent, often critically stressed, and usually must be stimulated before fluid flow between wells can be established, i.e. larger pressure changes. Relatively small stress changes (0.01–1 MPa) can be enough to cause induced seismicity on already critically stressed faults, as demonstrated by the Pohang earthquake. The local structural geology affects how large the induced events become, e.g. injection into a large fault zone can transmit pressure perturbation further and/or result in larger seismic events.
Circulation in doublets or drilling operations in fractured sediments occasionally generated felt seismic events. Pressure diffusion through fractures can result in reactivation of critically stressed faults, in particular when connected to the basement. This shows a hydraulic connection to more competent formations at depth can be a potential hazard as these critically stressed faults can be encountered.
Geothermal fields in fractured sedimentary, metamorphic and volcanic rock (hydrothermal systems) regularly generate felt seismic events. The largest events occurred in the large-size fields in the western USA and Mexico, e.g. the Geysers, Salton Sea and Cerro Prieto. These fields are associated with significant subsidence, poroelastic and thermoelastic stresses.
In regions with high natural seismicity it can be difficult to distinguish natural and induced seismicity. For example, for some geothermal fields there are clear spatiotemporal correlations of seismicity and field operations (e.g. the Geysers, Rotokawa), but for others such a correlation is absent (e.g. Salton Sea).
The main mechanisms for induced seismicity in geothermal systems are pore pressure increase, poroelastic stressing and thermoelastic stressing. Also, chemical changes of fault properties may play a role.
Most felt induced events occurred in areas which were tectonically active. However, tectonic loading rates (and natural seismicity rates) are not always a good proxy for the occurrence of induced seismicity. In situ stresses may still be critical in areas of low loading rates. In the sedimentary cover, stresses could on the other hand be lower or more variable. Site-specific analysis of the state of stress is thus important.
Key factors for the occurrence of M > 2.0 events are the presence of critically stressed faults, distance to basement and a hydraulic connection to the basement, the magnitude of pressure and temperature changes, and possibly the rock competency of target reservoir and overburden/underburden. In general, these parameters and hence the seismogenic potential increases with depth.
Induced seismicity is always site-specific and depends on the type of operations, and can never be fully excluded. By taking into account the dominant mechanisms, the geological and operational key factors, the potential for induced events can be assessed/estimated/ categorised.
Acknowledgements
This paper is based on, and forms an extension to, a review report reviewing scientific literature on induced seismicity in geothermal systems (Buijze et al., Reference Buijze, Bijsterveld, Cremer, Paap, Veldkamp, Wassing, Wees and Heege2019). The review considered well-described cases worldwide and considered published papers and reports until December 2018. The authors would like to thank the following reviewers who provided valuable comments on the review report: B. Dost (KNMI Royal Netherlands Meteorological Institute), M. van Eck van der Sluijs (EBN), G. Foulger (Durham University), M. Hettema (EBN), H. de Pater (Fenix Consulting Delft) and A. Zang (Helmholtz Centre Potsdam, GFZ German Research Centre for Geosciences).
Supplementary material
Supplementary material is available online at https://doi.org/10.1017/njg.2019.6. This material comprises a table with doublets in the Netherlands (Table S1) and a table of the parameters collected for the reviewed case histories (Table S2).


 Open access